Cross-stream migration of a Brownian droplet in a polymer solution under Poiseuille flow
Abstract
The migration of a Brownian fluid droplet in a parallel-plate microchannel was investigated using dissipative particle dynamics computer simulations. In a Newtonian solvent, the droplet migrated toward the channel walls due to inertial effects at the studied flow conditions, in agreement with theoretical predictions and recent simulations. However, the droplet focused onto the channel centerline when polymer chains were added to the solvent. Focusing was typically enhanced for longer polymers and higher polymer concentrations with a nontrivial flow-rate dependence due to droplet and polymer deformability. Brownian motion caused the droplet position to fluctuate with a distribution that primarily depended on the balance between inertial lift forces pushing the droplet outward and elastic forces from the polymers driving it inward. The droplet shape was controlled by the local shear rate, and so its average shape depended on the droplet distribution.
I Introduction
Particle migration in a microchannelStone and Kim (2001); Stone, Stroock, and Ajdari (2004) has important applications in separation technologies such as filtration Bhagat, Kuntaegowdanahalli, and Papautsky (2008), cell sorting Hur et al. (2011), and fractionation Giddings (1993). It also has implications for physical processes like the margination of cells in the blood streamKumar and Graham (2012a, b) and for multiphase flows in geological formations (enhanced oil recovery) Green and Willhite (1998); Wilson Jr. (1977); Tehrani (1996). Such cross-stream migration could be desirable if a separation is needed but undesirable if a homogeneous distribution is preferred, and it is important to understand and design the conditions under which migration occurs. Multiple mechanisms exist for cross-stream migration in microchannels Fu et al. (1999); Cohen (2005); Lee, Purdom, and Westervelt (2004); Das, Mandal, and Chakraborty (2018); Das and Chakraborty (2018), but in this article we will focus on particle migration that is passively controlled by a pressure- or gravity-driven flow Karimi, Yazdi, and Ardekani (2013); Amini, Lee, and Di Carlo (2014), which is attractive from an engineering perspective for its potential as a scalable, high-throughput technology.
Rigid particles in a Newtonian fluid are known to move across streamlines in parabolic (Poiseuille) flows due to lift forces at small but finite fluid inertia Leal (1980); Stone (2000). Inertial lift outward from the channel center is balanced by an inward force induced by hydrodynamic interactions with the walls, causing the particle to adopt an intermediate lateral position Matas, Morris, and Guazzelli (2004); Di Carlo et al. (2007); Amini, Lee, and Di Carlo (2014). This effect was first observed experimentally by Segré and Silberberg Segré and Silberberg (1961), who found that millimeter-sized spheres in pipe flow migrated to an annulus at roughly 60% of the pipe radius. The number and position of these “focusing” points depends on the channel geometry and flow, and has also been demonstrated for, e.g., parallel platesHo and (1974) and square ducts Di Carlo et al. (2009).
Deformable droplets in a Newtonian fluid exhibit an even richer set of behaviors than their rigid counterparts Leal (1980). Unlike rigid spheres, droplets can migrate across streamlines even in the Stokes flow (inertialess) limit due to their deformability. Chan and Leal showed that the direction of this migration depends on the viscosity ratio between the droplet and the fluid Chan and Leal (1979). Stan et al. found that chemical and surfactant-induced Marangoni effects also influenced droplet migration Stan et al. (2011, 2013). At finite fluid inertia, Legendre and Magnaudet demonstrated that there is lift on a droplet Legendre and Magnaudet (1997) analogous to the Saffman lift on a rigid particle Saffman (1965, 1968) but with a magnitude that depends on the viscosity ratio between the droplet and the fluid. Experiments Karnis, Goldsmith, and Mason (1966); Hur et al. (2011) and simulations Mortazavi and Tryggvason (2000); Chen et al. (2014); Pan et al. (2016); Marson et al. (2018) have shown that droplets undergo Segré–Silberberg-type migration in Poiseuille flow, and that the preferred lateral position depends on several dimensionless parameters, as recently discussed in detail by Marson et al. Marson et al. (2018).
High-throughput applications like filtration or sorting may require focusing particles onto the channel centerline Di Carlo et al. (2007); Karimi, Yazdi, and Ardekani (2013), which is not always achieved by inertial or deformation-induced migration in simple channel geometries. Considerable efforts have been dedicated to design various microfluidic device geometries that can manipulate particles in this way Di Carlo et al. (2007), but finding such geometries can be difficult and highly problem specific Amini, Lee, and Di Carlo (2014). Fortunately, it has been shown that the addition of polymers to the Newtonian solvent provides a simple mechanism, called viscoelastic focusing D’Avino, Greco, and Maffettone (2017), to drive particles toward regions of low shear.
Viscoelastic polymer solutions induce inward particle migration in Poiseuille flow due to a gradient in the first normal stress difference over the particle surface Leshansky et al. (2007). The elastic force exerted by the polymers competes directly with other forces acting on the droplet for the flow conditions, including inertial lift, deformation-induced forces, and wall forces, to set the lateral position of the particle. Such viscoelastic focusing of rigid particles has been demonstrated experimentally Karnis and Mason (1966); Gauthier, Goldsmith, and Mason (1971a, b); Tehrani (1996); Leshansky et al. (2007); Kim et al. (2012); Kim and Kim (2016) and using computer simulations D’Avino et al. (2012); De Santo et al. (2014); Nikoubashman et al. (2014a, b); Howard, Panagiotopoulos, and Nikoubashman (2015); Trofa et al. (2015). Interestingly, a neutral surface separating focusing points at the channel center and at the walls was discovered in simulations for certain classes of viscoelastic fluids D’Avino et al. (2012). Droplets under shear are also known to migrate in polymer solutions Hur et al. (2011); Gauthier, Goldsmith, and Mason (1971a, b); Chan and Leal (1979).
Most prior theoretical descriptions Chan and Leal (1979); Leal (1980); Leshansky et al. (2007); D’Avino, Greco, and Maffettone (2017) and simulations D’Avino et al. (2012); De Santo et al. (2014); Trofa et al. (2015) of viscoelastic focusing have adopted a continuum-level description. Such models neglect microscopic details and fluctuations of the macromolecular components of the viscoelastic medium and the particle or droplet. However, in microfluidic and nanofluidic devices, it can be necessary to consider such motion and interactions. For example, Brownian motion leads to considerable scattering in the position of a rigid sphere around the Segré–Silberberg annulus for Poiseuille flow in a pipe Prohm, Gierlak, and Stark (2012). Moreover, Brownian particles are often comparable in size to the macromolecular constituents of non-Newtonian fluids. At these length scales, Brownian spheres can exhibit anomolous motion in polymer solutions Mackay et al. (2003); Wong et al. (2004); Tuteja et al. (2007); Poling-Skutvik, Krishnamoorti, and Conrad (2015), which has been attributed to coupling between the motion of the sphere and the polymers Chen et al. (2018, 2019). It is then unclear whether well-established results for viscoelastic focusing of larger particles directly transfer to smaller particles in microchannels.
We previously demonstrated the applicability of viscoelastic focusing for Brownian rigid spheres with sizes comparable to the constituent polymer chains of a viscoelastic medium Nikoubashman et al. (2014a, b); Howard, Panagiotopoulos, and Nikoubashman (2015). However, we noted significant fluctuations of the particle around its focused position, in qualitative agreement with microfluidic experiments Kim et al. (2012). It is desirable to exploit the viscoelastic focusing mechanism to manipulate small Brownian droplets, which fluctuate in shape in addition to position, in microchannels. To our knowledge, this problem has gone relatively unexplored. We hypothesize that similar considerations may apply to the droplets as for the rigid spheres: namely, focusing onto the centerline should be improved by longer polymers and higher polymers concentrations. However, as for the rigid spheres, the distribution of the droplet position in the channel may be broad or narrow under certain flow conditions.
In this article, we test and confirm this hypothesis using particle-based computer simulations of the cross-stream migration of a Brownian fluid droplet in a polymer solution under Poiseuille flow. Although the droplet migrated outward in a Newtonian solvent (in agreement with prior simulations Marson et al. (2018)), we found that it focused onto the channel centerline in solutions of sufficiently long polymers at modest concentrations. The flow-rate dependence of the focusing was nontrivial due to a combination of effects from droplet deformation and the elastic force exerted by the polymers. We also varied the viscosity ratio between the droplet and the solvent, but did not observe any significant effect on the viscoelastic focusing in the flow regime considered. The droplet shape was controlled primarily by the local shear rate near the droplet, and so its average shape depended sensitively on the droplet distribution in the channel.
The rest of this article is organized as follows. We first describe the simulation model, including characterization of the fluid surface tension and viscosity. We then report our results, first analyzing the simulated flow fields and then systematically demonstrating the effects of polymer concentration, polymer chain length, and flow rate on the distribution of the droplet in the channel and its shape. We finally present our conclusions, suggesting avenues for future inquiry.
II Simulation model
A single fluid droplet was simulated in a Newtonian solvent and in a polymer solution using dissipative particle dynamics (DPD) simulations Hoogerbrugge and Koelman (1992); Español and Warren (1995); Groot and Warren (1997) DPD is a particle-based mesoscale simulation method that faithfully resolves hydrodynamic interactions, incorporates thermal fluctuations, and is well-suited for modeling multiphase fluids. In DPD, particles interact with each other through three pairwise forces: a conservative force , a dissipative force , and a random force . As is typical, we modeled the conservative force acting on particle due to particle by a soft repulsion Groot and Warren (1997),
| (1) |
where sets the strength of the repulsion between particles and , is the distance between the particle centers, is the unit vector to the center of particle from the center of particle , and is the cutoff radius for the interaction that sets the effective size of the particles.
The random and dissipative forces impart thermal fluctuations and drag while also acting as a thermostat on the DPD particles. These forces are applied in a pairwise manner that conserves momentum, with the forces on particle from particle given by
| (2) | ||||
| (3) |
where is the drag coefficient between particles and , is a weight function, and is the difference in the velocities of particles and . To satisfy the fluctuation–dissipation theorem Español and Warren (1995), is an independent random variable for each pair of particles that has zero mean, , and a variance with being Boltzmann’s constant and being the temperature. In this work, the drag coefficients were assigned per particle, , and the effective drag coefficient for a pair was determined by the mixing rule Visser, Hoefsloot, and Iedema (2006).
The weight function modulates the dynamic properties, i.e., diffusivity and viscosity, of the fluid. We used the generalized weight function proposed by Fan et al. Fan et al. (2006),
| (4) |
with . This choice of increases the Schmidt number of the fluid compared to the standard DPD weight function Groot and Warren (1997) () to give a value closer to that of a real liquid. We also found that using gave better agreement with the no-slip boundary conditions at the microchannel walls than using (see below).
II.1 Fluid model
The polymer solution and droplet were modeled using three types of DPD particles: solvent (s) particles, polymer segment (p) particles, and droplet (d) particles. The model and results in this article will be reported in a fundamental system of units using as the unit of length, as the unit of mass, and as the unit of energy, which gives as the unit of time. Throughout, the total density of DPD particles was , all DPD particles had equal mass , the temperature was , and the cutoff radius was . All simulations were performed using HOOMD-blue Anderson, Lorenz, and Travesset (2008); Glaser et al. (2015); Phillips, Anderson, and Glotzer (2011) (version 2.2.5) on multiple graphics processing units with a simulation time step of .
In order to choose the DPD repulsive parameters, we first computed the surface tension between coexisting slabs of solvent and droplet particles. We fixed the repulsive parameter for particles of the same type to standard DPD values Groot and Warren (1997), , but varied the cross-interaction strength, . The drag coefficient should not affect the measured surface tension, which is a static property, and so was fixed to to promote fast diffusion. The coexisting slabs were equilibrated by joining two cubic regions of edge length to give an orthorhombic box centered around the origin with edge lengths , , and , where , , and denote the Cartesian coordinate axes. Particles were allowed to interdiffuse for to equilibrate the joined slabs.
In this geometry, can be computed from the pressure anisotropy Kirkwood and Buff (1949); Frenkel and Smit (2002),
| (5) |
where denotes the diagonal component of the stress tensor for index , and the prefactor of accounts for the presence of two interfaces due to the periodic boundary conditions. The cross-interaction strength was varied from to , and the surface tension was measured using eq. (5) by sampling every during a simulation. The measured surface tension (Fig. 1) is in good agreement with Groot and Warren’s empirical equation Groot and Warren (1997),
| (6) |
with being their fit to the Flory–Huggins parameter for .
As expected, the surface tension increased with increasing because the solvent and droplet particles became less miscible. The solvent and droplet particle density profiles near the interface (inset of Fig. 1) converged to similar values with increasing . We desired a droplet that was sparingly soluble in the solvent but that could still deform under the flow rates accessible in the simulations. At , the density of solvent particles dissolved in the droplet phase was already small (), and the surface tension permitted modest deformation under viable flow rates. We accordingly selected for the cross-interaction strength.

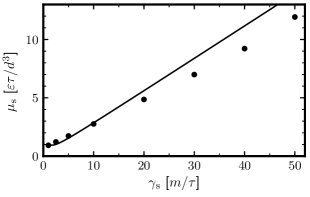
We subsequently measured the shear viscosity of the solvent using reverse nonequilibrium simulations (RNES) Müller-Plathe (1999). Details of this method are well-described elsewhere Müller-Plathe (1999); Statt, Howard, and Panagiotopoulos (2018). We simulated a cubic box of edge length containing only solvent particles with drag coefficients that varied from to . Using RNES, we imposed a shear stress on the solvent by periodically exchanging the -momenta of one pair of particles from slabs of width centered at . The swapped particles were the ones that most opposed the desired direction of flow () in each slab. We measured the velocity profile between the exchange slabs () every over a simulation, obtaining a Couette flow profile with a shear rate that decreased as the time between exchanges was increased from to . The imposed shear stress was proportional to the measured shear rate, , as expected for a Newtonian fluid. The shear viscosity, , was then determined by a linear fit of versus .
As expected, the viscosity increased with increasing (Fig. 2). The simulated viscosity was generally lower than theoretically estimated Fan et al. (2006),
| (7) |
particularly at high values of . We selected for the solvent particles, which gives a measured shear viscosity of . In most cases, we used , giving a droplet viscosity , but we also varied to determine the effects of the viscosity ratio in select cases.
To model linear polymer chains of length that were fully soluble in the solvent but insoluble in the droplet, the polymer segment (p) particles were treated as if they were solvent (s) particles in the DPD interactions, i.e., , , and . Bonds within a chain were modeled by adding a harmonic spring force to for connected pairs of particles. The force on particle bonded to particle was
| (8) |
with spring constant and Kranenburg, Nicolas, and Smit (2004).
II.2 Flow in microchannel
We simulated gravity-driven flow of the droplet and polymer solution in a parallel plate microchannel. The full system was initialized as follows. We first dispersed solvent particles with a total density of into a three-dimensional, periodic simulation box of dimensions , , and and equilibrated the solvent for . We chose as the direction of flow in the microchannel, and the parallel plates had normals along . We constructed the microchannel walls by freezing solvent particles having , zeroing their velocities, and switching their types to be wall (w) particles Pivkin and Karniadakis (2005); Fedosov, Pivkin, and Karniadakis (2008). (The total channel width was .) The wall particles interacted with the fluid as if they were solvent particles, i.e., , , and . Mutual DPD interactions between wall particles were excluded. To help enforce no-slip and no-penetration boundary conditions at the walls, solvent, polymer, and droplet particles were additionally reflected from the planes at using bounce-back rules Fedosov, Pivkin, and Karniadakis (2008); Revenga, Zúñiga, and Español (1999).
We selected particles near the origin of the channel to form a droplet of radius , giving a droplet blockage ratio of . Due to the sparing solubility of the droplet particles in the solvent, we first estimated the number of particles required to form such a droplet volume using the lever rule with the coexistence densities shown in Fig. 1. This procedure gave a droplet with a radius initially larger than , but some particles later dissolved into the solvent so that the droplet reached its target radius. We then randomly created linear polymers of length from the remaining solvent particles. To build each chain, we first randomly removed solvent particles. They were reinserted as polymer segment (p) particles between the channel walls in a randomly generated chain conformation having a bond length of between connected particles. The number of polymer chains was chosen to give the desired polymer weight fraction, , where is the volume of the microchannel. In most simulations, we used or , but also tested (no polymer), and for selected conditions. The complete configuration, including the solvent, droplet, and polymers, was equilibrated for .
Flow was generated by applying a constant body force, , in the -direction for all solvent, polymer, and droplet particles. For the pure solvent, applying such a force in conjunction with no-slip boundary conditions at the channel walls gives the standard parabolic (Poiseuille) velocity field,
| (9) |
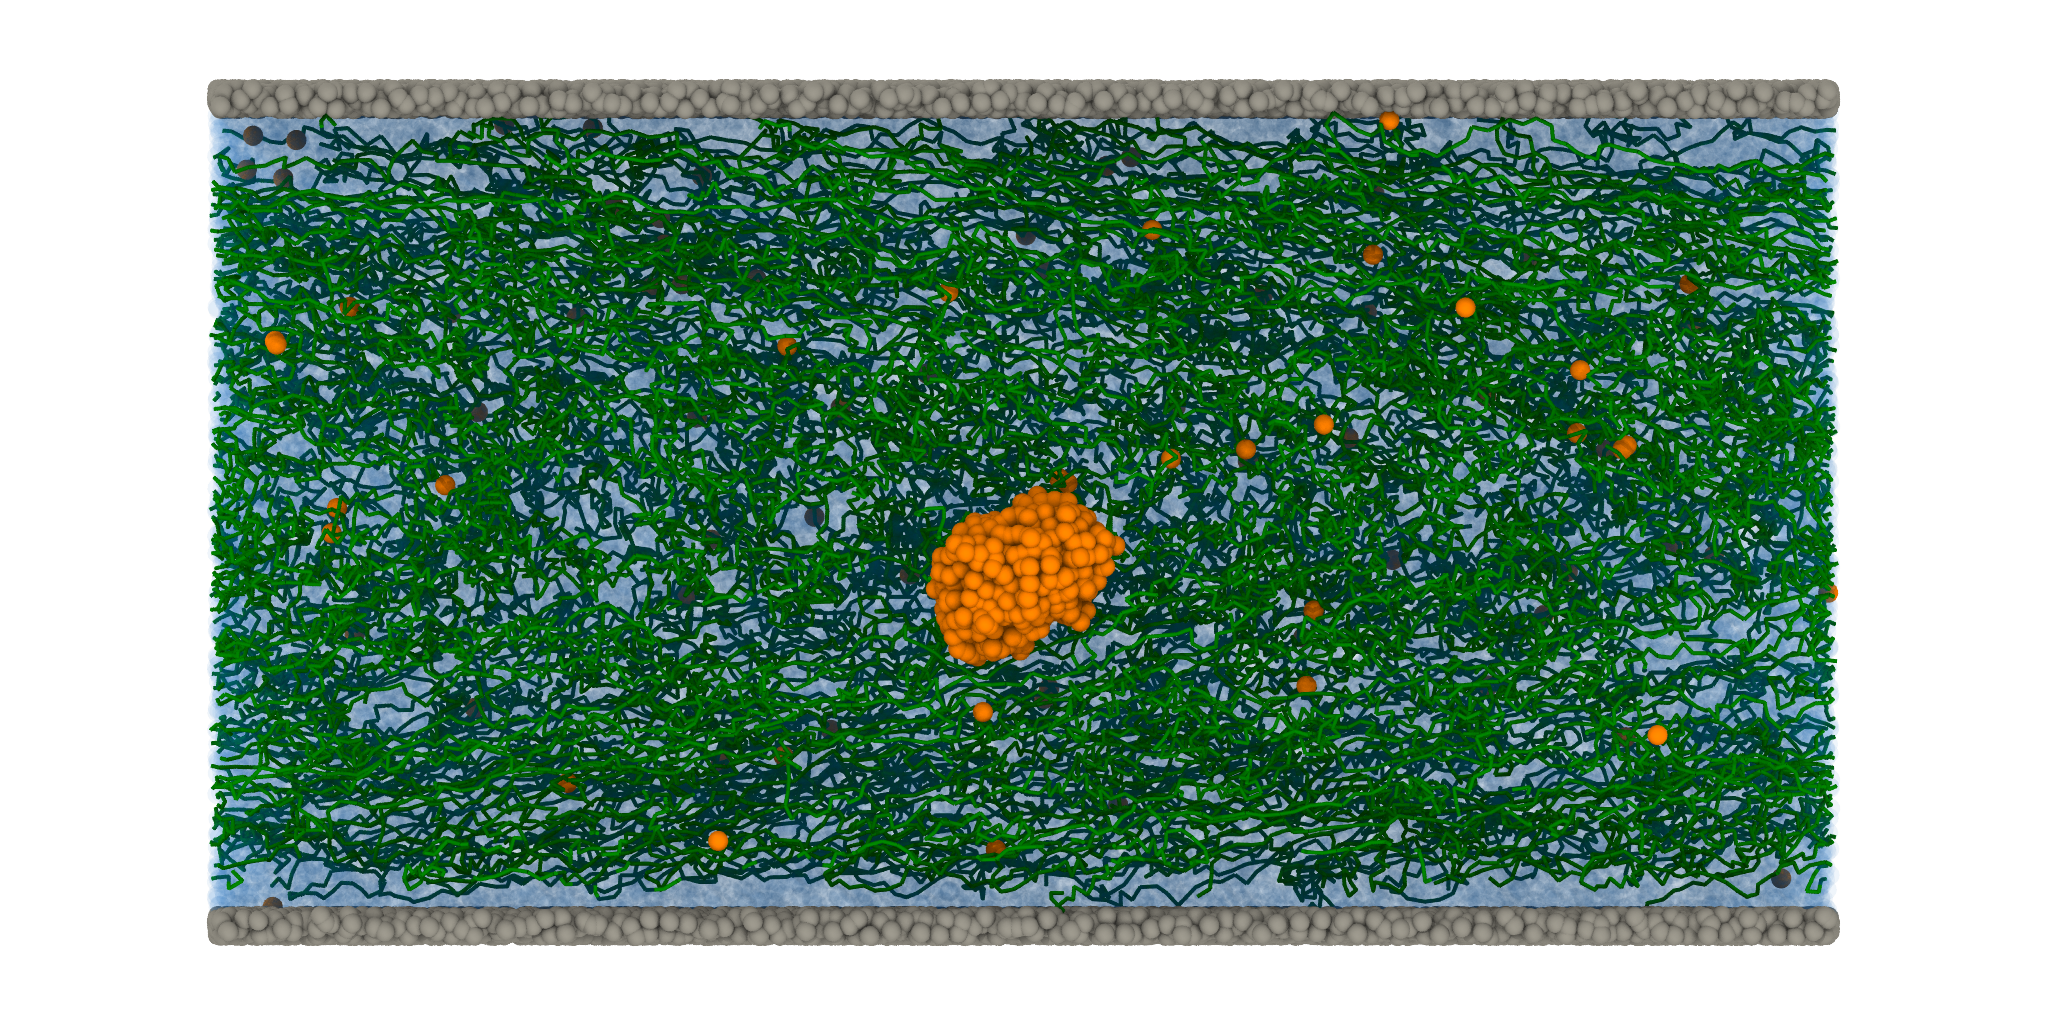
where is the maximum velocity at the channel centerline for this flow field. To help enforce the wall boundary conditions in the simulations, the frozen wall particles were assigned velocities based on their positions in the wall Fedosov, Pivkin, and Karniadakis (2008). Additionally, was initially superimposed onto the polymer solution and droplet to accelerate the approach to a steady flow profile during a simulation. Fig. 3 shows an example configuration for the polymer solution under flow at steady state.
We repeated this procedure 5 times for each combination of chain length , polymer concentration , body force , and droplet viscosity studied to generate independent starting configurations. Production simulations of were performed for each configuration. The droplet properties were sampled every , while the properties of the entire solution were recorded every . The computational workflow and data were managed using the signac framework Adorf et al. (2018).
III Results and discussion
III.1 Flow field
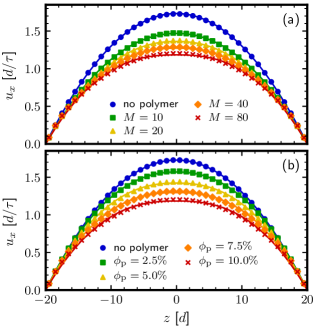
We first measured the average flow field in the microchannel, including the solvent, polymers, and droplet. The flow was unidirectional, , and is shown for various polymer chain lengths at the largest polymer concentration simulated () in Fig. 4a and for various concentrations of the longest polymers simulated () in Fig. 4b. The body force in Fig. 4 was , which was the largest value we simulated and where any wall slip or non-Newtonian flow effects should be most pronounced. This upper bound for in our simulations was determined by trial and error so that no droplet breakup occurred.
The velocity profile in the absence of polymer was parabolic, as expected, and was also in quantitative agreement with eq. (9) using the measured (Fig. 2). This indicates that the no-slip boundary conditions are well-enforced and also validates the RNES measurement of . The addition of polymers with resulted in a lower maximum velocity at the centerline, consistent with the expected higher viscosity of a polymer solution (Fig. 4a) Rubinstein and Colby (2003). Increasing the length of the polymers from to further lowered . Additionally, the velocity profiles became less parabolic and developed a flattened region near , consistent with an increasingly non-Newtonian character of the fluid. Similar trends were observed when varying the concentration of the polymers from to (Fig. 4b), with higher polymer concentrations giving less parabolic flow profiles.
To quantify this non-Newtonian behavior, we modeled the shear stress in the polymer solutions using a power law, , where is the flow behavior index and is a prefactor giving correct dimensions to . In a parallel plate channel, the flow field for a power-law fluid is
| (10) |
A Newtonian solvent has and , and eq. (10) reduces to eq. (9), whereas shear-thinning fluids have . We determined and by fitting the flow fields in Fig. 4 through eq. (10), recovering exponents ranging from for to for when (Fig. 4a). Likewise, decreased from at to at for the polymers (Fig. 4b). There is a small but noticeable deviation of the measured velocity from the fit using eq. (10) for at , suggesting that the shear stress may have a more sophisticated functional form than the power-law model. Nonetheless, the fitted exponents give us a useful qualitative characterization of the polymer solutions.
Longer polymer chains shear thin more readily under flow than shorter chains because they have longer relaxation times, , that cause them to deform and align with the flow at smaller Doi and Edwards (1986). The dimensionless Weissenberg number, , characterizes this relationship. When , the rate of deformation is slow compared to the polymer relaxation and primarily coil conformations are expected, whereas for , the polymers are expected to be highly deformed. We approximate the shear rate by , and estimate the polymer relaxation time from the Zimm model for a Gaussian polymer chain in dilute solution Doi and Edwards (1986), . We find that for the polymers and for the polymers for the conditions in Fig. 4a (). Hence, more significant shear-alignment is expected for the longer chains, which should result in more shear thinning (smaller values of ). This expectation is consistent with the shape of the flow fields in Fig. 4 and the fitted values for .
III.2 Droplet distribution
Having characterized the flow in the microchannel, we measured the center-of-mass position of the droplet between the channel walls, . The droplet was identified for each configuration using a clustering procedure Pedregosa et al. (2011); Ester et al. (1999) in order to exclude droplet particles dissolved in the solvent from subsequent analysis. We analyzed the absolute value based on the symmetry of the microchannel and to improve sampling. Previous studies Marson et al. (2018); Pan et al. (2016) have reported the average center-of-mass position, , which is the first moment of the distribution of . However, a Brownian droplet can adopt a variety of distributions in the channel depending on the conditions, and we found that was not sufficiently discriminating between these. For example, a uniformly distributed droplet has , which is indistinguishable from a droplet which is strongly focused at this position throughout the entire simulation. We accordingly computed the distribution of using a bin size of , and will focus most of our discussion around such distributions.
We first considered the distribution of the droplet in solutions of polymer chains of increasing concentration (Fig. 5) for the flow conditions shown in Fig. 4b. In the neat solvent, the droplet migrated outward from the channel centerline, showing a strongly preferred position of . Such outward migration is consistent with prior theoretical and simulation work for droplets Chen et al. (2014); Marson et al. (2018); Pan et al. (2016). The droplet can migrate by two mechanisms: (1) deformation due to the flow, even in the creeping flow limit, and (2) lift forces at finite inertia. We define a channel Reynolds number, , and a droplet Reynolds number Di Carlo et al. (2007); Marson et al. (2018). When the channel Reynolds number is sufficiently small, the flow is expected to be laminar. When is small, inertial forces on the droplet are not significant and results from the Stokes flow limit are expected to apply. As an upper bound, we find and for the investigated flow rates, consistent with the laminar flow of Fig. 4 but suggesting that inertial lift on the particle may be significant. This estimate is in accord with the observed migration of the droplet away from the centerline.
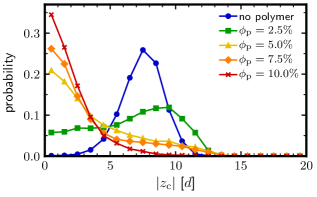
The addition of polymers to the channel at increasing polymer concentration dramatically altered the preferred position of the droplet. The droplet distribution significantly broadened at the lowest concentration (). Interestingly, this included an increased probability of finding the droplet near the wall, beyond the preferred peak in the neat solvent, which we speculate may be partially due to polymer-mediated depletion interactions Asakura and Oosawa (1954). Depletion, often discussed in the context of rigid spherical colloids in solution with smaller polymer chains, induces an effective attraction between otherwise hard particles (the colloids) due to volume exclusion of a secondary species (the polymers) Russel, Saville, and Schowalter (1989). In this case, the effective attraction is between the droplet and the wall because the polymers are insoluble in the droplet and cannot penetrate the channel boundaries. Such an attraction near the wall was more pronounced for simulations at smaller (not shown here).
Continuing to add polymer increasingly focused the droplet onto the channel centerline with a narrowing distribution of . The increased polymer concentration had competing effects on the droplet migration. On the one hand, the depletion force scales with Asakura and Oosawa (1954), which increases the outward force on the droplet near the wall. On the other hand, the increased lowered the maximum velocity in the channel, decreasing the outward inertial lift on the droplet Di Carlo et al. (2007). Concurrently, the increased polymer concentration also increased the inward elastic force on the droplet Howard, Panagiotopoulos, and Nikoubashman (2015). The net result of these interactions is an increased inward force for larger , which improves the droplet focusing onto the centerline, consistent with with our previous work on viscoelastic focusing of rigid particle Nikoubashman et al. (2014a, b); Howard, Panagiotopoulos, and Nikoubashman (2015).
We next considered the impact of chain length on droplet focusing at two polymer concentrations, and . Longer chains are expected to have better droplet focusing for three reasons: (1) the elastic force should scale with Howard, Panagiotopoulos, and Nikoubashman (2015), (2) longer chains deform at lower shear rates and so act more non-Newtonian, and (3) the maximum velocity was found to be lower for longer chains, reducing the outward inertial lift. The measured distributions of (Fig. 6) are clearly consistent with this hypothesis. The addition of polymers with did not have a significant impact on the droplet distribution compared to the neat solvent. This may not be surprising given that for the polymers, and the solution is nearly Newtonian. However, adding polymers of increasing length improved the focusing onto the centerline in a monotonic fashion for a given concentration.
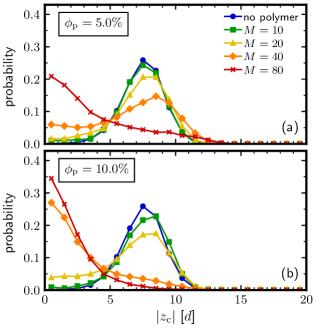
We note, however, that there are additional concentration effects that influenced when polymers of a given size became effective focusers. This is most apparent for the chains. At , the droplet had a broad distribution of and a most probable position of . However, at , the droplet was strongly focused onto the centerline. We speculate that this difference in behavior is due to an increase in elastic force with concentration, which was sufficient to overcome the inertial lift at but too weak at .
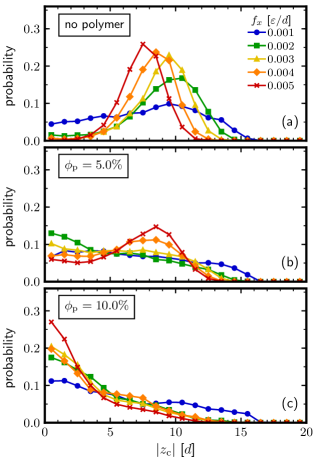
To understand this flow rate and concentration dependence in more detail, we computed the droplet distribution for the chains at varying for and , which we compare to the distributions without any polymer (Fig. 7). Without polymer, the droplet initially migrated outward as increased, but the peak of this distribution moved inward with additional increases in (Fig. 7a), consistent with the simulations of Marson et al.Marson et al. (2018) At (Fig. 7b), there was an initial trend to focus when . However, at larger , the droplet began to migrate outward, suggesting that inertial lift dominated over the available elastic force. In contrast, the droplet distribution sharpened around the channel centerline at for all considered here (Fig. 7c). It is possible that there is a sufficiently large that could exceed the inward elastic force at this concentration. However, the droplet may breakup under shear before such a force can be applied.
We finally tested the sensitivity of the viscoelastic focusing to the viscosity ratio between the droplet and the solvent. In the Stokes flow limit, Chan and Leal showed that inward or outward droplet migration can be obtained in a Newtonian solvent based on this ratio Chan and Leal (1979). However, recent simulations by Marson et al. suggest that such differences may not be as significant in the inertial regime Marson et al. (2018). Our primary interest is in how the droplet focusing may change in a non-Newtonian polymer solution. We varied the droplet viscosity ratio, , from 0.54 () to 5.3 () for the polymer solutions at , which focused the droplet when . Since the effective viscosity of the polymer solution is higher than that of the pure solvent, should be considered an upper bound on the viscosity ratio between the droplet and the polymer solution.
We found no significant differences between the droplet distributions under these conditions, and so we omit the data here for brevity. This result may not be unexpected given the qualitative picture of the focusing mechanism. The polymers are insoluble in the droplet, and so they primarily influence the fluid around it. (The flow inside the droplet is affected by , but such effects may be secondary.) Given that the viscosity ratio did not significantly alter the droplet distribution in the inertial regime of the pure solvent for Marson et al. Marson et al. (2018), it is then not surprising that the viscosity ratio also does not significantly change the droplet distribution in the polymer solution. Indeed, letting should recover the rigid particle limit of viscoelastic focusing to which we have already drawn analogy. However, we do anticipate that the viscosity ratio may still influence the droplet distribution more significantly in other flow regimes (e.g., Stokes flow limit) that were not accessible to us in our simulations. In these cases, the migration forces controlled by the viscosity ratio, with inward or outward direction Chan and Leal (1979), would either work cooperatively or antagonistically with the elastic force of a sufficiently deformed polymer.
III.3 Droplet shape
We have concentrated our discussion thus far on how polymers influence the droplet distribution in the microchannel, but have not yet considered how the polymers influence the droplet shape and orientation in the flow. To characterize the droplet shape, we first computed its gyration tensor ,
| (11) |
where is the vector from the droplet center of mass to particle , and are indices in the usual tensor notation, and is the number of particles in the droplet. We then computed the eigenvalues of , whose corresponding eigenvectors give the principle moments of the droplet, and sorted them in descending order, . We determined the Taylor deformation parameter Taylor (1932, 1934), a dimensionless measure of the asphericity of the droplet, as
| (12) |
For a sphere, is diagonal () and , while a prolate spheroid has and when the aspect ratio between the major and minor axes of the spheroid increases. Hence, larger values of correspond to droplets that have more significant deformation. We additionally determined the inclination angle of the droplet relative to the flow direction, , using Ripoll, Winkler, and Gompper (2006):
| (13) |
for a sphere (no preferred orientation) or for an object completely aligned with the flow, but for particles that align with a relative tilt.
It is well-established that increases with for a droplet in an unbounded shear flow Taylor (1932, 1934); Rallison and Acrivos (1978). In Poiseuille flows, the shear rate varies across the channel, and accordingly, the droplet may experience a different deformation based on its lateral position. Fig. 8a shows the average deformation versus the average center-of-mass position of the droplet , clearly indicating that the droplet is (on average) more deformed when it is (on average) farther from the centerline, where the shear rate is higher. The droplet is additionally (on average) more inclined relative to the flow when it is more deformed (Fig. 8b).
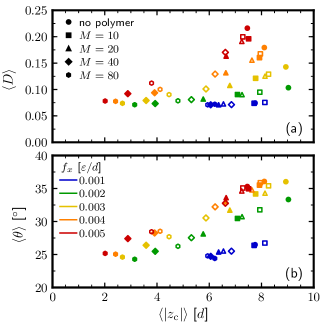
It is tempting to find a parameter to collapse the data in Fig. 8 onto a single curve, e.g., using the capillary number Rallison and Acrivos (1978); Pan, Phan-Thien, and Khoo (2014); Marson et al. (2018). Unfortunately, such an analysis is again considerably complicated using only average quantities because of the droplet distribution. Indeed, the average properties computed in Fig. 8 and in prior studiesMarson et al. (2018) are intimately connected to the droplet distribution, which sets the preferred droplet location and as a consequence, the shear rates it experiences.
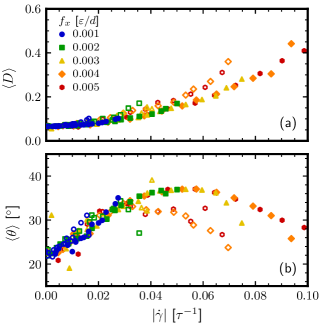
To deconvolve the droplet shape from the droplet distribution, we averaged and as functions of the shear rate at the droplet center-of-mass using the flow fields measured in the simulations (Fig. 4). Figure 9 shows the results of this procedure for the pure solvent and the polymers with . For a given polymer solution, the data were well-collapsed across all body forces when plotted against . Moreover, all data nearly collapsed onto a single curve for small , i.e., near the channel centerline. However, there were some noticeable differences between different polymer solutions at larger , which corresponded to larger and positions closer to the channel walls. This discrepancy is not surprising since in that regime wall effects on the droplet may be significant.
In general, the droplet deformation increased monotonically with shear rate (Fig. 9a), but never reached zero even as due to the finite size of the droplet. In contrast, the inclination angle showed a maximum at intermediate shear rates (Fig. 9b). On visual inspection of the trajectories, this change in orientation with the flow appeared to be due to alignment of the droplet with the walls. Other than these boundary effects, we found that the droplet shape was not strongly influenced by the presence of the polymers in solution. Instead, the deformation and orientation correlated strongly with the shear rate due to the imposed flow. The primary roles of the polymers in setting the average deformation (Fig. 8) were then as viscosity modifiers, altering the flow field (Fig. 4) for a given body force, and as focusers for the droplet, which caused the droplet to experience a given shear rate with higher probability.
IV Conclusions
We used dissipative particle dynamics computer simulations to show that a Brownian droplet in a dilute polymer solution migrates toward the center of a parallel-plate microchannel under gravity-driven flow. The droplet had a distribution of positions in the channel that sharpened near the center for longer polymer chains at higher concentrations, but had a nontrivial dependence on the flow rate due to droplet and polymer deformation. The average droplet shape depended on the droplet distribution because its local deformation was controlled by the shear rate. Our simulations demonstrate the applicability of the viscoelastic focusing mechanism for Brownian droplets that are comparable in size to the polymer chains in the viscoelastic fluid.
Polymer-induced migration may play an important role in droplet migration and mobility in small channels flooded with complex fluids, such as those encountered in oil recovery from geological formations or in membrane filtration. In this work, we have neglected polymer solubility and adsorption with the droplet, the presence of surfactants, complex microchannel boundaries, and collective interactions between droplets at finite concentration. Such effects are surely present in many applications, and an intriguing avenue of future research is to determine how they may assist or hinder polymer-induced droplet migration in microchannels. Viscoelastic focusing will likely also influence the migration of other rigid and deformable objects in these complex fluid mixtures, including colloids, star polymers Srivastva and Nikoubashman (2018), dendrimers, cells, and micelles. Controlling the distribution of these objects in a mixture through general inertial and viscoelastic focusing mechanisms presents an opportunity to effect a separation.
Conflicts of interest
There are no conflicts to declare.
Acknowledgements.
We happily thank Florian Müller-Plathe and Athanassios Panagiotopoulos for discussions inspiring this research. Work by M.P.H. was supported as part of the Center for Materials for Water and Energy Systems, an Energy Frontier Research Center funded by the U.S. Department of Energy, Office of Science, Basic Energy Sciences under Award No. DE-SC0019272. T.M.T. acknowledges financial support from the Welch Foundation (Grant No. F-1696), and A.N. acknowledges financial support from the German Research Foundation (DFG) under Project No. NI 1487-2/1. The simulations are part of the Blue Waters sustained-petascale computing project, which is supported by the National Science Foundation (awards OCI-0725070 and ACI-1238993) and the state of Illinois. Blue Waters is a joint effort of the University of Illinois at Urbana-Champaign and its National Center for Supercomputing Applications.References
- Stone and Kim (2001) H. A. Stone and S. Kim, AIChE J. 47, 1250 (2001).
- Stone, Stroock, and Ajdari (2004) H. A. Stone, A. D. Stroock, and A. Ajdari, Annu. Rev. Fluid Mech. 36, 381 (2004).
- Bhagat, Kuntaegowdanahalli, and Papautsky (2008) A. A. S. Bhagat, S. S. Kuntaegowdanahalli, and I. Papautsky, Phys. Fluids 20, 101702 (2008).
- Hur et al. (2011) S. C. Hur, N. K. Henderson-MacLennan, E. R. B. McCabe, and D. Di Carlo, Lab Chip 11, 912 (2011).
- Giddings (1993) J. C. Giddings, Science 260, 1456 (1993).
- Kumar and Graham (2012a) A. Kumar and M. D. Graham, Phys. Rev. Lett. 109, 108102 (2012a).
- Kumar and Graham (2012b) A. Kumar and M. D. Graham, Soft Matter 8, 10536 (2012b).
- Green and Willhite (1998) D. W. Green and G. P. Willhite, “Enhanced oil recovery,” (Society of Petroleum Engineers, 1998) pp. 239–300.
- Wilson Jr. (1977) L. A. Wilson Jr., “Improved oil recovery by surfactant and polymer flooding,” (Academic Press, 1977) pp. 1–26.
- Tehrani (1996) M. A. Tehrani, J. Rheol. 40, 1057 (1996).
- Fu et al. (1999) A. Y. Fu, C. Spence, A. Scherer, F. H. Arnold, and S. R. Quake, Nat. Biotech. 17, 1109 (1999).
- Cohen (2005) A. E. Cohen, Phys. Rev. Lett. 94, 118102 (2005).
- Lee, Purdom, and Westervelt (2004) H. Lee, A. M. Purdom, and R. M. Westervelt, Appl. Phys. Lett. 85, 1063 (2004).
- Das, Mandal, and Chakraborty (2018) S. Das, S. Mandal, and S. Chakraborty, J. Fluid Mech. 835, 170 (2018).
- Das and Chakraborty (2018) S. Das and S. Chakraborty, Phys. Rev. Fluids 3, 103602 (2018).
- Karimi, Yazdi, and Ardekani (2013) A. Karimi, S. Yazdi, and A. M. Ardekani, Biomicrofluidics 7, 021501 (2013).
- Amini, Lee, and Di Carlo (2014) H. Amini, W. Lee, and D. Di Carlo, Lab Chip 14, 2739 (2014).
- Leal (1980) L. G. Leal, Ann. Rev. Fluid Mech. 12, 435 (1980).
- Stone (2000) H. A. Stone, J. Fluid Mech. 409, 165 (2000).
- Matas, Morris, and Guazzelli (2004) J.-P. Matas, J. F. Morris, and É. Guazzelli, J. Fluid. Mech. 515, 171 (2004).
- Di Carlo et al. (2007) D. Di Carlo, D. Irimia, R. G. Tompkins, and M. Toner, Proc. Natl. Acad. Sci. USA 104, 18892 (2007).
- Segré and Silberberg (1961) G. Segré and A. Silberberg, Nature 189, 209 (1961).
- Ho and (1974) B. P. Ho and L. G. , J. Fluid Mech. 65, 365 (1974).
- Di Carlo et al. (2009) D. Di Carlo, J. F. Edd, K. J. Humphry, H. A. Stone, and M. Toner, Phys. Rev. Lett. 102, 094503 (2009).
- Chan and Leal (1979) P. C.-H. Chan and L. G. Leal, J. Fluid Mech. 92, 131 (1979).
- Stan et al. (2011) C. A. Stan, L. Guglielmini, A. K. Ellerbee, D. Caviezel, H. A. Stone, and G. M. Whitesides, Phys. Rev. E 84, 036302 (2011).
- Stan et al. (2013) C. A. Stan, A. K. Ellerbee, L. Guglielmini, H. A. Stone, and G. M. Whitesides, Lab Chip 13, 365 (2013).
- Legendre and Magnaudet (1997) D. Legendre and J. Magnaudet, Phys. Fluids 9, 3572 (1997).
- Saffman (1965) P. G. Saffman, J. Fluid Mech. 22, 385 (1965).
- Saffman (1968) P. G. Saffman, J. Fluid Mech. 31, 624 (1968).
- Karnis, Goldsmith, and Mason (1966) A. Karnis, H. L. Goldsmith, and S. G. Mason, Can. J. Chem. Eng. 44, 181 (1966).
- Mortazavi and Tryggvason (2000) S. Mortazavi and G. Tryggvason, J. Fluid Mech. 411, 325 (2000).
- Chen et al. (2014) X. Chen, C. Xue, L. Zhang, G. Hu, X. Jiang, and J. Sun, Phys. Fluids 26, 112003 (2014).
- Pan et al. (2016) D.-y. Pan, Y.-q. Lin, L.-x. Zhang, and X.-m. Shao, J. Hydrodyn., Ser. B 28, 702 (2016).
- Marson et al. (2018) R. L. Marson, Y. Huang, M. Huang, T. Fu, and R. G. Larson, Soft Matter 14, 2267 (2018).
- D’Avino, Greco, and Maffettone (2017) G. D’Avino, F. Greco, and P. L. Maffettone, Ann. Rev. Fluid Mech. 49, 341 (2017).
- Leshansky et al. (2007) A. M. Leshansky, A. Bransky, N. Korin, and U. Dinnar, Phys. Rev. Lett. 98, 234501 (2007).
- Karnis and Mason (1966) A. Karnis and S. G. Mason, Trans. Soc. Rheo. 10, 571 (1966).
- Gauthier, Goldsmith, and Mason (1971a) F. Gauthier, H. L. Goldsmith, and S. G. Mason, Rheo. Acta 10, 344 (1971a).
- Gauthier, Goldsmith, and Mason (1971b) F. Gauthier, H. L. Goldsmith, and S. G. Mason, Trans. Soc. Rheo. 15, 297 (1971b).
- Kim et al. (2012) J. Y. Kim, S. W. Ahn, S. S. Lee, and J. M. Kim, Lab Chip 12, 2807 (2012).
- Kim and Kim (2016) B. Kim and J. M. Kim, Biomicrofluidics 10, 024111 (2016).
- D’Avino et al. (2012) G. D’Avino, G. Romeo, M. M. Villone, F. Greco, P. A. Netti, and P. L. Maffettone, Lab Chip 12, 1638 (2012).
- De Santo et al. (2014) I. De Santo, G. D’Avino, G. Romeo, F. Greco, P. A. Netti, and P. L. Maffettone, Phys. Rev. Appl. 2, 064001 (2014).
- Nikoubashman et al. (2014a) A. Nikoubashman, N. A. Mahynski, A. H. Pirayandeh, and A. Z. Panagiotopoulos, J. Chem. Phys. 140, 094903 (2014a).
- Nikoubashman et al. (2014b) A. Nikoubashman, N. A. Mahynski, M. P. Howard, and A. Z. Panagiotopoulos, J. Chem. Phys. 141, 149906 (2014b).
- Howard, Panagiotopoulos, and Nikoubashman (2015) M. P. Howard, A. Z. Panagiotopoulos, and A. Nikoubashman, J. Chem. Phys. 142, 224908 (2015).
- Trofa et al. (2015) M. Trofa, M. Vocciante, G. D’Avino, M. A. Hulsen, F. Greco, and P. L. Maffettone, Comput. Fluids 107, 214 (2015).
- Prohm, Gierlak, and Stark (2012) C. Prohm, M. Gierlak, and H. Stark, Eur. Phys. J. E 35, 80 (2012).
- Mackay et al. (2003) M. E. Mackay, T. T. Dao, A. Tuteja, D. L. Ho, B. Van Horn, H.-C. Kim, and C. J. Hawker, Nat. Mater. 2, 762 (2003).
- Wong et al. (2004) I. Y. Wong, M. L. Gardel, D. R. Reichman, E. R. Weeks, M. T. Valentine, A. R. Bausch, and D. A. Weitz, Phys. Rev. Lett. 92, 178101 (2004).
- Tuteja et al. (2007) A. Tuteja, M. E. Mackay, S. Narayanan, S. Asokan, and M. S. Wong, Nano Lett. 7, 1276 (2007).
- Poling-Skutvik, Krishnamoorti, and Conrad (2015) R. Poling-Skutvik, R. Krishnamoorti, and J. C. Conrad, ACS Macro Lett. 4, 1169 (2015).
- Chen et al. (2018) R. Chen, R. Poling-Skutvik, A. Nikoubashman, M. P. Howard, J. C. Conrad, and J. C. Palmer, Macromolecules 51, 1865 (2018).
- Chen et al. (2019) R. Chen, R. Poling-Skutvik, M. P. Howard, A. Nikoubashman, S. A. Egorov, J. C. Conrad, and J. C. Palmer, Soft Matter , 10.1039/C8SM01834K (2019).
- Hoogerbrugge and Koelman (1992) P. J. Hoogerbrugge and J. M. V. A. Koelman, Europhys. Lett. 19, 155 (1992).
- Español and Warren (1995) P. Español and P. Warren, Europhys. Lett. 30, 191 (1995).
- Groot and Warren (1997) R. D. Groot and P. B. Warren, J. Chem. Phys. 107, 4423 (1997).
- Visser, Hoefsloot, and Iedema (2006) D. C. Visser, H. C. J. Hoefsloot, and P. D. Iedema, J. Comput. Phys. 214, 491 (2006).
- Fan et al. (2006) X. Fan, N. Phan-Thien, S. Chen, X. Wu, and T. Y. Ng, Phys. Fluids 18, 063102 (2006).
- Anderson, Lorenz, and Travesset (2008) J. A. Anderson, C. D. Lorenz, and A. Travesset, J. Comput. Phys. 227, 5342 (2008).
- Glaser et al. (2015) J. Glaser, T. D. Nguyen, J. A. Anderson, P. Lui, F. Spiga, J. A. Millan, D. C. Morse, and S. C. Glotzer, Comput. Phys. Commun. 192, 97 (2015).
- Phillips, Anderson, and Glotzer (2011) C. L. Phillips, J. A. Anderson, and S. C. Glotzer, J. Comput. Phys. 230, 7191 (2011).
- Kirkwood and Buff (1949) J. G. Kirkwood and F. P. Buff, J. Chem. Phys. 17, 338 (1949).
- Frenkel and Smit (2002) D. Frenkel and B. Smit, Understanding Molecular Simulation: From Algorithms to Applications, 2nd ed. (Academic Press, 2002) p. 472.
- Müller-Plathe (1999) F. Müller-Plathe, Phys. Rev. E 59, 4894 (1999).
- Statt, Howard, and Panagiotopoulos (2018) A. Statt, M. P. Howard, and A. Z. Panagiotopoulos, , arXiv:1811.04097 (2018).
- Kranenburg, Nicolas, and Smit (2004) M. Kranenburg, J.-P. Nicolas, and B. Smit, Phys. Chem. Chem. Phys. 6, 4142 (2004).
- Pivkin and Karniadakis (2005) I. V. Pivkin and G. E. Karniadakis, J. Comput. Phys. 207, 114 (2005).
- Fedosov, Pivkin, and Karniadakis (2008) D. A. Fedosov, I. V. Pivkin, and G. E. Karniadakis, J. Comput. Phys. 227, 2540 (2008).
- Revenga, Zúñiga, and Español (1999) M. Revenga, I. Zúñiga, and P. Español, Comput. Phys. Commun. 121–122, 309 (1999).
- Stukowski (2010) A. Stukowski, Modelling Sim. Mater. Sci. Eng. 18, 015012 (2010).
- Adorf et al. (2018) C. S. Adorf, P. M. Dodd, V. Ramasubramani, and S. C. Glotzer, Comput. Mater. Sci. 146, 220 (2018).
- Rubinstein and Colby (2003) M. Rubinstein and R. H. Colby, Polymer Physics (Oxford University Press, 2003) pp. 314–318.
- Doi and Edwards (1986) M. Doi and S. F. Edwards, The Theory of Polymer Dynamics (Clarendon Press, Oxford, 1986) pp. 97–103.
- Pedregosa et al. (2011) F. Pedregosa, G. Varoquaux, A. Gramfort, V. Michel, B. Thirion, O. Grisel, M. Blondel, P. Prettenhofer, R. Weiss, V. Dubourg, J. Vanderplas, A. Passos, D. Cournapeau, M. Brucher, M. Perrot, and E. Duchesnay, J. Mach. Learn. Res. 12, 2825 (2011).
- Ester et al. (1999) M. Ester, Kriegel, Hans-Peter, J. Sander, and X. Xu, in Proceedings of the 2nd International Conference on Knowledge Discovery and Data Mining (AAAI Press, Portland, OR, 1999) pp. 226–231.
- Asakura and Oosawa (1954) S. Asakura and F. Oosawa, J. Chem. Phys. 22, 1255 (1954).
- Russel, Saville, and Schowalter (1989) W. B. Russel, D. A. Saville, and W. R. Schowalter, Colloidal Dispersions (Cambridge University Press, 1989).
- Taylor (1932) G. I. Taylor, Proc. R. Soc. London A 138, 41 (1932).
- Taylor (1934) G. I. Taylor, Proc. R. Soc. London A 146, 501 (1934).
- Ripoll, Winkler, and Gompper (2006) M. Ripoll, R. G. Winkler, and G. Gompper, Phys. Rev. Lett. 96, 188302 (2006).
- Rallison and Acrivos (1978) J. M. Rallison and A. Acrivos, J. Fluid Mech. 89, 191 (1978).
- Pan, Phan-Thien, and Khoo (2014) D. Pan, N. Phan-Thien, and B. C. Khoo, J. Non-Newtonian Fluid Mech. 212, 63 (2014).
- Srivastva and Nikoubashman (2018) D. Srivastva and A. Nikoubashman, Polymers 10, 599 (2018).