Magnetotransport in Fe-intercalated TS2: the comparison between T = Ti and Ta
Abstract
Sharp magnetization switching and large magnetoresistance were previously discovered in single crystals of 2H-FexTaS2 and attributed to the Fe superstructure and its defects. We report similar sharp switching in 1T-FexTiS2 () and the discovery of large magnetoresistance. The switching field and magnetoresistance are similar to 2H-FexTaS2, with a larger than expected bowtie magnetoresistance and a sharp hysteresis loop. Despite previous reports, electron diffraction shows only the superstructure in 1T-FexTiS2. The Curie and Weiss temperatures remain roughly constant below before monotonically increasing for higher x. By contrast, the switching field and magnetoresistance reach a maximum where defects in the superstructure exist, approach a minimum near perfect superstructures, and remain constant above . Additionally, an increase in with annealing time is reported. Glassy behavior is shown to coexist within the ferromagnetic state in 1T-FexTiS2 for compositions between and . A simple model captures the essential phenomenology and explains most similarities and differences between 1T-FexTiS2 and 2H-FexTaS2, and provides insights into other magnetically intercalated transition metal dichalcogenides.
pacs:
75.47.-m, 75.60.d, 75.30.GwI Introduction
Transition metal dichalcogenides (TMDCs) have garnered interest due to their potential use in a variety of applications. While materials like MoS2 have long been used as mechanical lubricants kim_characterization_1991 , recent interest has focused on the magnetic and electrical properties of layered TMDCs. Due to the two dimensional nature of these materials, many display charge density waves and superconductivity, competing electronic states driven by Fermi surface instabilities chen_charge_2016 ; morosan_superconductivity_2006 ; garoche_experimental_1976 ; morosan_multiple_2010 ; nagata_superconductivity_1992 ; wagner_tuning_2008 ; wilson_charge-density_1975 . The choice of transition metal and polytype drastically affects the electrical properties in the layered TMDCs, such that insulators (HfS2 morosan_strongly_2012 ), semiconductors (MoS2 radisavljevic_single-layer_2011 , WS2 zhu_giant_2011 ), semimetals (WTe2 ali_large_2014 , TcS2 wilson_transition_1969 ), and metals (NbS2 naito_electrical_1982 , VSe2 bayard_anomalous_1976 ) with or without superconductivity (NbSe2 garoche_experimental_1976 , 2H-TaS2 nagata_superconductivity_1992 ) can all be found within the TMDC archetype.
Chemical modifications through intercalation or doping impart a new level of complexity in both the electronic and magnetic properties of TMDCs. For electronic properties, copper or palladium intercalation induces superconductivity in 1T-TiSe2 morosan_superconductivity_2006 ; morosan_multiple_2010 , while doping Pt on the Ti site leads to insulating behavior chen_chemical_2015 . Similarly, intercalating small amounts of Cu in 2H-TaS2 increases the superconducting temperature wagner_tuning_2008 . Regarding magnetism, unusual properties like very large, non-saturating magnetoresistance (MR) can be seen in undoped WTe2 ali_large_2014 , while magnetic intercalation often induces antiferromagnetic order parkin_3d_1980-1 . These results all raise questions about the role of the intercalant in different TMDCs and different polytypes.
When surveying the magnetically intercalated TMDCs, two materials stand out for their magnetotransport properties not seen in other TMDCs: 2H-FexTaS2 and 1T-FexTiS2 order ferromagnetically with the moments parallel to the axis. They also both display large (up to 150 ) MR, while normal metals only show MR values up to a few percent. This prompts the need for an in-depth comparison between the two compounds, as well as a comparison with other intercalated TMDCs, to address a few outstanding questions: (i) Why do these two systems show FM order along the axis while most other magnetically intercalated TMDCs order antiferromagnetically? (ii) Given the substantive differences between Ti and Ta (number of electrons, atomic size, S6 coordination polyhedra (Fig. 1)), what singles out these two compounds from other similar TMDCs intercalated with Fe as ferromagnets, with large MR? (iii) Why is there a progression from the 22 superstructure to the in 2H-FexTaS2, while 1T-FexTiS2, as is shown below, remains in the superstructure for the whole Fe composition range? (iv) Why does glassy behavior appear in 1T-FexTiS2, as our present measurements reveal, and antiferromagnetic behavior appear in 2H-FexTaS2 for certain regimes?
In the hexagonal 2H-TaS2 system, Fe-intercalation results in ferromagnetic (FM) order for and antiferromagnetic (AFM) order above narita_preparation_1994 . In the FM state, 2H-FexTaS2 shows high magnetic anisotropy and an easy axis parallel to . The Fe atoms form and superstructures at and , respectively. For , the magnetization shows sharp switching, resulting in rectangular isothermal magnetization curves morosan_sharp_2007 . Fe concentrations away from reveal an increase in MR, from at the superstructure to at , attributed to spin disorder scattering hardy_very_2015 ; chen_correlations_2016 .
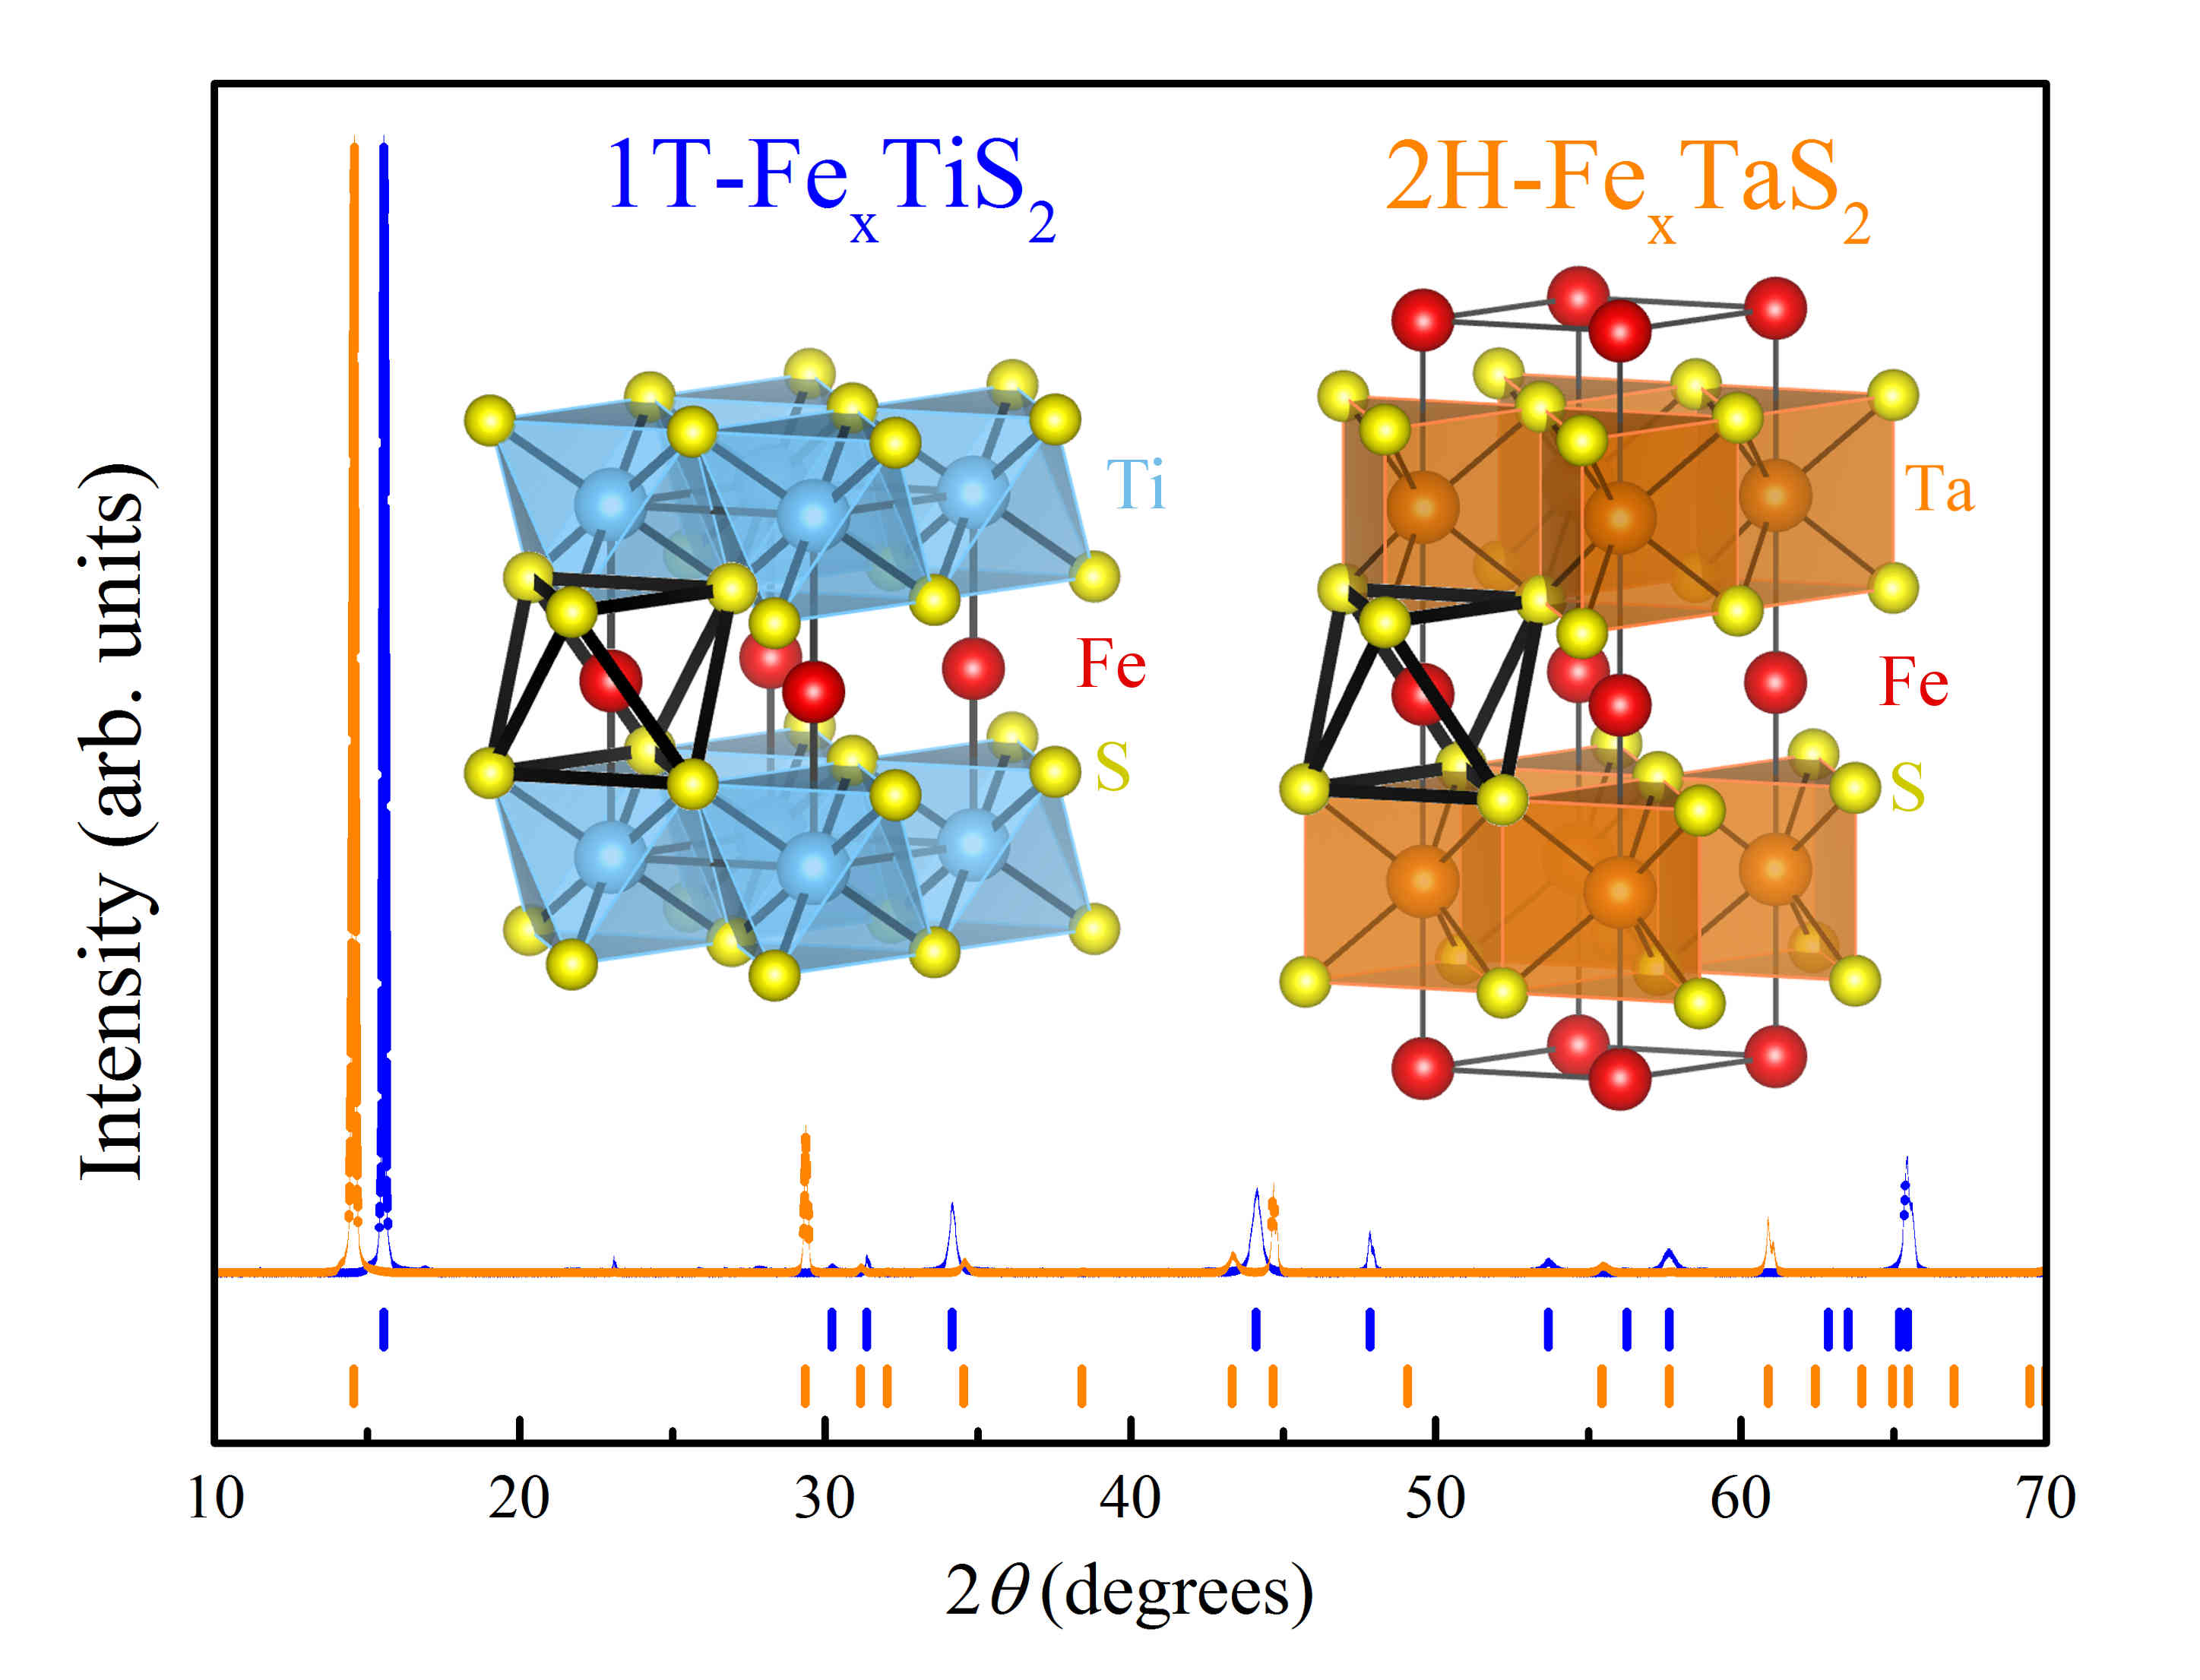
Much less is known about 1T-FexTiS2. However, the previously known properties, together with our findings reported here for the first time, point to four substantive differences between the two FeS2 ( = Ti and Ta) systems. First, there are key structural differences due to the different polytypes as illustrated in Fig. 1. In the 2H polytype of S2, the S atoms form a trigonal-prismatic coordination around (Fig. 1 left inset), and the unit cell consists of two S2 layers in a ABAB… stacking along (with a 60 rotation between the A and B planes). TiS2 is only known to exist in the 1T polytype, with one S2 layer per unit cell (and a AAA…layer stacking) and octahedral coordination (Fig. 1 right inset). It is important to note that, despite the different polytypes, the Fe atoms are octahedrally-coordinated for both (black lines in the insets). The second difference is the electron count: Ti4+ is in a 3 electronic configuration whereas Ta4+ is in the 5 configuration, which can be expected to result in differences in the electrical transport, even for the pure S2. The third key difference is revealed in the properties of these two materials upon Fe intercalation: glassy behavior exists in 1T-FexTiS2 inoue_low_1985 ; inoue_transport_1991 ; koyano_low-field_1994 ; matsukura_ac-susceptibility_1989 , but not in 2H-FexTaS2 morosan_sharp_2007 . Here we will show AC susceptibility data for 1T-FexTiS2, suggesting the coexistence of the glassy state within the ferromagnetic order for , rather than a progression with x from glassy to FM as previously reported negishi_anisotropic_1988 . The final difference is that in 1T-FexTiS2, our electron diffraction measurements indicate a superstructure down to the lowest composition measured, , with no superstructure, as was the case in 2H-FexTaS2 near . morosan_sharp_2007
Motivated by the similarities with the better studied 2H-FexTaS2, in the present paper we turn to the less studied 1T-FexTiS2 () system, the only other known TMDC with FM moment ordered along the axis and sharp magnetization switching. Following a detailed characterization of the properties of 1T-FexTiS2 single crystals, we will focus on the comparison between the Fe-intercalated Ti and Ta disulfide systems, as well as contrasting these two Fe-intercalated ferromagnets to the other magnetically intercalated TMDCs.
II Methods
Single crystals of 1T-FexTiS2 were grown using iodine vapor transport. Stoichiometric amounts of Fe, Ti, and S powders were sealed in evacuated quartz tubes ( 6 in. in length, 0.5 in. in diameter) with approximately 50% I2 by mass. The tubes were then placed in a gradient furnace. The samples were heated for at least 10 days at a gradient of 900-800C then cooled to room temperature. Iron compositions were determined by inductively coupled plasma atomic emission spectroscopy measurements performed by Galbraith Laboratories.
Powder x-ray diffraction was performed using a Bruker D8 Advance diffractometer and refinements were performed using the EVA/TOPAS software suite. The x-ray data shown in Fig. 1 confirms the 1T polytype for all Ti samples in this study, in contrast to the 2H polytype of the Fe-intercalated TaS2 morosan_sharp_2007 . Magnetization measurements were performed using a Quantum Design (QD) Magnetic Property Measurement System (MPMS). Transport measurements were performed using a QD Physical Property Measurement System (PPMS), using standard four point probe measurements with and . The AC susceptibility was measured using the AC magnetic susceptibility (ACMS) insert in the QD PPMS.
Electron microscopy was performed on a JEOL 2100F operated at 200 kV. Electron diffraction was performed with an effective camera length of 50 cm and collected on an ES500W camera from Gatan, Inc. Samples for transmission electron microscopy (TEM) were prepared by shearing large crystals submerged in acetone in a mortar and pestle. The powdered material was isolated and drop cast onto a carbon grid with a copper frame and allowed to dry under a stream of dry nitrogen before use.
| 1T-FexTiS2 | 2H-FexTaS2 | ||
![[Uncaptioned image]](/html/1812.07063/assets/1T.png)
|
![[Uncaptioned image]](/html/1812.07063/assets/2H.png)
|
||
| Stacking | A-B-C | A-B-A | |
| coordination | Octahedral | Trigonal prism | |
| Magnetic ordering | |||
| FM () + glassy behavior | FM () | AFM | |
| Known Superstructure | |||
| Sharp magnetization switching | |||
| MR | to | to | |
III Results
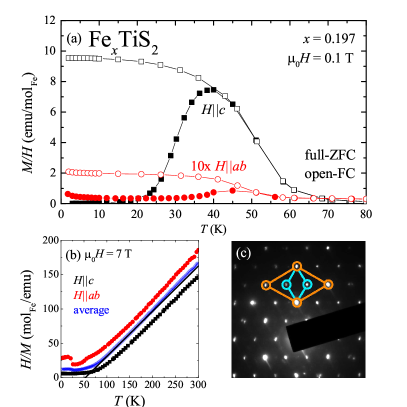
As previous measurements indicated koyano_magnetic_1990 , 1T-FexTiS2 is a ferromagnet with the moments perpendicular to the TMDC layers. Fig. 2(a) illustrates the anisotropic magnetic susceptibility near TC for , while Fig. 2(b) demonstrates Curie-Weiss behavior at high temperatures. We find that TC ranges from 35 K all the way up to 140 K for , and the ordering temperatures are fairly close to the Weiss temperatures , determined from linear fits as shown in Fig. 2(b) (solid line).
While magnetic order and the anisotropy in 1T-FexTiS2 are similar to those in 2H-FexTaS2, TEM data for 1T-FexTiS2 shows only the superstructure for the whole range in the current study. No 22 superstructure close to the (or any other composition) in contrast to the Ta analogue morosan_sharp_2007 . The superstructure for 1T-Fe0.197TiS2 is seen in the TEM image in Fig. 2(c). The blue outline (inner diamond) corresponds to the 1T-TiS2 structure, while the orange (outer diamond) depicts the superstructure upon Fe intercalation. It would appear that the polytype, the size of the transition metal , amount of intercalant, and potential geometric frustration all contribute to the exchange interactions. Our model calculation, presented below, suggests that the superstructures are a result of the relative strengths of the exchange interactions. This also ties in with another significant difference between the two series, that will be discussed later: the Ti compounds exhibit re-entrant spin glass behavior in the ferromagnetic state, whereas the Ta analogues do not.
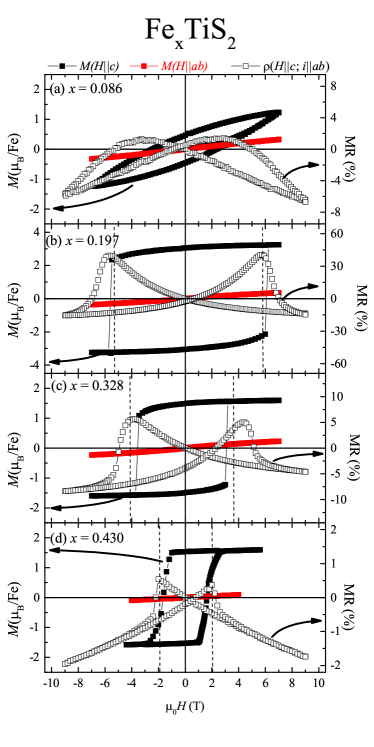
Despite the differences between the two series, Fig. 3 highlights the similar features of 1T-FexTiS2 to those of 2H-FexTaS2, which set both compounds apart from other intercalated TMDCs. Anisotropic magnetization isotherms show drastic variation with composition for 1T-FexTiS2 (full symbols, Fig. 3), similar to the M(H) behavior in 2H-FexTaS2 (Fig. 4 in Chen et al. chen_correlations_2016 ). Sharp hysteresis loops were first observed in 2H-Fe1/4TaS2 morosan_sharp_2007 . As a function of , the switching field decreased for chen_correlations_2016 . The similarities between the sharp hysteresis loops in both = Ta and Ti series motivated MR measurements on 1T-FexTiS2, since very large MR values (up to ) were discovered in 2H-FexTaS2 hardy_very_2015 . Indeed, MR curves (open symbols, Fig. 3) are remarkably similar to those in 2H-FexTaS2 morosan_sharp_2007 ; chen_correlations_2016 . The ‘bowtie’ curves display sharp resistivity drop at the same field as the sharp magnetization switch for (black symbols, Fig. 3). MR values vary with ranging from a few percent to at . While smaller than most MR values in 2H-FexTaS2 chen_correlations_2016 , the 1T-FexTiS2 MR reaches values larger than the few percent typically seen in normal metals, and larger than previously reported inoue_transport_1991 .
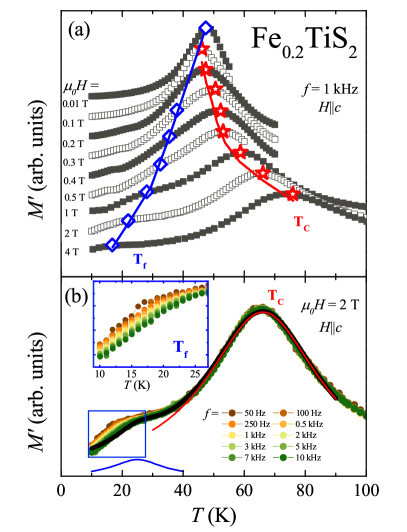
Existing measurements on FexTiS2 reported spin glass (), cluster glass () behavior satoh_ferromagnetic_1988 , and long range ferromagnetic order () negishi_magnetic_1987 ; yoshioka_magnetic_1985 . With AC magnetic susceptibility measurements on 1T-FexTiS2, we confirm glassy behavior for (see Appendix B) with important differences from the previously reported magnetic properties across the series. Previous studies on polycrystalline FexTiS2 show glassy behavior at low intercalant concentrations (), and ferromagnetic order for negishi_magnetic_1987 ; yoshioka_magnetic_1985 . Our measurements on single crystals suggest cluster glass behavior for concentrations (Appendix B). Our single crystal measurements resolve this apparent inconsistency by showing coexistence of cluster glass behavior within the ferromagnetic order for and , but not for (Fig. 4). Additionally, frequency dependent AC susceptibility measurements were previously only taken for low concentrations (), so glassy behavior at higher concentrations had not been tested koyano_low-field_1994 . Our AC susceptibility measurements at different DC fields show that the peak in susceptibility splits into two distinct peaks with increasing field. For example, for (Fig. 4(a)), the splitting occurs around T, with the freezing temperature Tf (blue symbols) moving down with increasing field as expected for glassy behavior. Conversely, the ferromagnetic order occurs at increasingly higher TC (red symbols) as increases. Fig. 4(b) shows the T AC susceptibility for , with clear frequency dependence for the the low temperature peak, and no frequency dependence at TC. The solid lines are fits for the two peaks illustrating how the Tf and TC values were determined from the (T).
IV Discussion
Sharp magnetization switching in TMDCs was first observed in 2H-FexTaS2 morosan_sharp_2007 . While intriguing by itself, this behavior also appears correlated with large MR in 2H-FexTaS2 single crystals hardy_very_2015 . Similar magnetization isotherms were reported in 1T-FexTiS2 koyano_magnetic_1990 , and the existence of large MR is shown in Fig 3. Large MR effects in homogeneous metals are of fundamental interest, as well as for potential applications in magnetic sensing. This motivated our comparative study of the only two magnetically-intercalated TMDCs known to exhibit such unusual magneto-transport properties. Our aim was answering why, unlike any other magnetic metals, Fe intercalation results in axial ferromagnetic order with sharp M() isotherms and large MR, and why this behavior appears in Fe intercalated 1T-TiS2 and 2H-TaS2 and not other Fe intercalated TMDCs, which tend to order antiferromagnetically along . In the course of the current investigation on 1T-FexTiS2, we also revealed additional questions regarding the Fe superstructures by contrast to that in 2H-FexTaS2, as well as the co-existence of glassy behavior within the ferromagnetically ordered state. The similarities and differences between 1T-FexTiS2 and 2H-FexTaS2 are summarized below, together with a theoretical discussion offering insight into the magnetic properties of these two systems.
Understanding 1T-FexTiS2 requires that it be placed in context with 2H-FexTaS2 and other magnetically-intercalated TMDCs. One of the key differences of Fe intercalation, compared to other magnetic metals, is the easy axis anisotropy. Intercalation of Fe atoms into a TMDC structure tend to result in the moment ordering along the axis. In both 1T-FexTiS2 and 2H-FexTaS2 where FM ordering occurs, the Fe atoms are located between the layers surrounded by S ions forming distorted octahedra (Fig. 1(a-b)) (with local point group D3d). Crystal field theory predicts that, in the intercalated Fe ions, the orbitals with out-of-plane angular momenta form the lowest energy manifold due to the -axis elongation ( orbitals, derived from orbitals without the distortion), leading to the strong magnetic anisotropy with easy-axis along the -axis parkin_3d_1980 ; dijkstra_band-structure_1989 . A more recent theoretical study on 2H-Fe1/4TaS2 also found that the Fe ions have large, unquenched, out-of-plane orbital magnetic moments () ko_rkky_2011 . On the other hand, for compounds with other intercalants such as Mn, Cr, or V, the outermost shell is half- or less than half-filled. In the high spin configuration, due to Hund’s coupling, the extra holes populate the orbitals with no out-of-plane angular momentum component dijkstra_band-structure_1989 , which is consistent with the easy-plane magnetic anisotropy of these compounds.
In regards to the superstructure for 2H-FexTaS2, a superstructure near morosan_sharp_2007 and a superstructure near are reported morosan_sharp_2007 ; hardy_very_2015 ; chen_correlations_2016 . However, Choi et al. performed TEM on Fe1/4TaS2 which suggested the two superstructures exist in different domains of the same crystal choi_giant_2009 . Additionally, between and , the superstructure is reported as the with vacancies hardy_very_2015 . For 1T-FexTiS2, the same superstructures ( superstructure near , and a superstructure near ) were reported inoue_electronic_1989 ; however, neutron results claim the for and for kuroiwa_short-range_1994 ; kuroiwa_neutron_1995 ; kuroiwa_neutron_2000 . In contrast, our electron diffraction measurements on 1T-FexTiS2 show only the superstructure for . For neutron diffraction, the data set is taken over a large area of sample whilst TEM and the electron diffraction are done on local areas. The superstructure seen in neutron diffraction could be the result of a blending of the two superstructures. Alternatively, the calculated phase diagram in Fig. 6(e-f) show a phase space of potential superstructures, as a function of coupling strengths, that contains a superstructure with Bragg peaks at and consistent with a mixture of and next to the . A small change in exchange energies could push the system from one superstructure to the other.
Both 1T-FexTiS2 and 2H-FexTaS2 provide equivalent local environments (distorted octahedra) to the intercalated Fe ions. The difference—in superstructures and the glassy behavior—between the two families may therefore be attributed to the inter-Fe interactions. As suggested by the metallic transport behavior of these compounds, the interaction between the local moments of Fe is expected to be of Ruderman-Kittel-Kasuya-Yosida (RKKY) type ruderman_indirect_1954 ; kasuya_theory_1956 ; yosida_magnetic_1957 , which is controlled by the underlying electronic structure of the charge carriers. 2H-TaS2, with Ta4+ in configuration, has large Fermi pockets enclosing the and points wilson_charge-density_1975 (Fig. 5(b)), resulting in short wavelength RKKY oscillations in 2H-FexTaS2. It is estimated to be similar to the distance between nearest neighboring Ta ions ko_rkky_2011 . The interaction between two Fe moments located at nearest neighboring sites is thus antiferromagnetic, consistent with the negative Curie-Weiss temperature for larger doping in 2H-FexTaS2 narita_preparation_1994 . On the other hand, 1T-TiS2 contains Ti4+ in a configuration, with small Fermi pockets enclosing and points fang_bulk_1997 (Fig. 5(a)). This leads to RKKY interaction in 1T-FexTiS2 with a spatial structure very different to that of the Ta counterpart. This, in turn, may be responsible for the lack of a superstructure in 1T-FexTiS2, and its glassy behavior may also be due to this difference in the Fe-Fe interactions.
V Theoretical Modeling
Here we present a model calculation demonstrating how the interaction between different ions can lead to different superstructures. Starting with a triangular lattice of size that represents the available sites for the intercalated Fe ions, we choose a fraction of the sites to be Ising spins for , which model the Fe moments at a doping level of . To account for the different inter-Fe RKKY interactions, we adopt a model with nearest-, second-nearest- and third-nearest-neighbor interactions, whose interaction energy is given by
| (1) |
We determine the optimal configuration , that minimizes this energy. Here , , and respectively represent nearest-, second-nearest-, and third-nearest-neighboring sites, with Ising exchange constants , , and . We search for the optimal configuration at different values of using simulated annealing to construct a phase diagram.
As a function of coupling constants, we find various superstructures, as illustrated in Fig. 6(a-d). Figures 6(e) and (f) show the phase diagrams of this model, for FM () and AFM nearest-neighbor Ising exchange (), respectively. The phases are classified according to the peak position of the structure factor and include the superstructure ( peaked at , panel (a)), the superstructure (peaked at , panel (b)), a “” superstructure (peaked at and , panel (c)), and an ion cluster phase (peaked at , panel (d)).
It is important to point out that this simple model is constructed to demonstrate possible mechanisms of superstructure formation, and therefore is not expected to be quantitatively accurate. The small system size of and the limited number of interactions allows only a small number of structures. More importantly, the model calculation only searches for the equilibrium ground state. Experimentally, the structure of the intercalated ions is determined by quench dynamics which depend on many factors, including relaxation time scales and finite temperature entropic effects that are ignored in the present calculation.
Nevertheless, this model captures some key elements of the experimental system. FM interactions between nearest-, second-nearest-, and third-nearest-neighbors promote superstructures with their corresponding length scales. In the presence of AFM interactions, competition between different interactions as well as geometrical frustration determine the structure.
One clear difference between the phase diagrams with AFM and FM is the existence of the ion cluster phase for the latter. This occurs because with FM interactions, it is energetically favorable for the ions to form clusters. On the other hand with AFM , the geometric frustration of the triangular lattice suppresses such clustering tendencies. Formation of ion clusters through such a mechanism could possibly explain the observed cluster glass behavior in the Ti compound, and lack thereof in the Ta compound.
VI Conclusions
A summary of the magneto-transport parameters for 1T-FexTiS2 is provided in Fig. 7(a-c) (a table of the values is provided in Appendix A). (circles, left, Fig. 7(a)) and (triangles, right, Fig. 7(a)) vary little with below , while (squares, right, Fig. 7(b)) and MR (diamonds, right, Fig. 7(b)) both peak around . For higher , both and increase rapidly and nearly triple up to , while and MR plateau near their values. By comparison, in 2H-FexTaS2, and peak near while and MR peak between the two nominal superstructure concentrations and (Fig. 7 of chen_correlations_2016 ). The proposed theory for FexTaS2 suggests that its behavior is due to the formation of superstructures with MR increasing away from the nominal superstructure compositions due to defects hardy_very_2015 . In -FexTiS2 the MR is low near , and increases to a peak value as decreases to , i.e. upon introducing vacancies in the superstructure. However, the absence of a superstructure places the peak between the superstructure and the low compositions, where sharp switching is not observed, i.e. hysteresis curves do not saturate (up to T for Fig. 7(a)). In Fig. 7(c) and (d), the relationship between MR values and the switching field in 1T-FexTiS2 (orange, panel (c)) is contrasted with that in 2H-FexTaS2 (blue, panel (d)). In both compounds, large MR values are correlated to large values, with a stronger correlation for Ti system, most likely a reflection of where these compounds are situated in the J3-J2 theoretical phase diagram (Fig. 6).
With the discovery of large MR in FeS2 ( = Ti, Ta), the understanding of the similarities and differences between the two systems brings to light the unanswered questions about magnetically intercalated TMDCs: (i) Why do these two systems show FM order along the axis while most others do not? (ii) What singles out FeS2 ( = Ti, Ta) from other Fe-intercalated TMDCs? (iii) Why do we not see the 22 superstructure in 1T-FexTiS2? (iv) Why does glassy behavior appear in 1T-FexTiS2 and antiferromagnetic behavior in 2H-FexTaS2 for certain regimes?
We partially answered question (i) by showing that the easy axis for Fe is explained by crystal field theory, although we have not explained why 1T-TiS2 and 2H-TaS2 are the only Fe intercalated TMDCs which show FM behavior. Our model calculation of the coupling constants helps shed light on questions (iii) and (iv). The differences in superstructure and the spin glass behavior are potentially due to the differences in the length scale between the two compounds. However, question (ii) remains unanswered. Many of the other Fe intercalated TMDCs show AFM behavior tazuke_magnetic_2006 ; buhannic_iron_1987 ; hillenius_magnetic_1979 ; parkin_3d_1980-1 precluding them from sharp switching or large MRs. Details explaining this might be elucidated by a more detailed model of the interactions, or an understanding of the non-equilibrium states that form due to the growth dynamics.
Understanding of the physics of low dimensional systems is of importance due to the plethora of strongly correlated physics that exists from superconductivity to charge density waves to topology. In particular, the understanding and design of large MR systems is of interest not only because of their rarity, but also because of their technical applications in hard drive technology.
VII acknowledgments
J. C. and E. M. acknowledge support from DMREF 1629374. C. L. H. is acknowledging partial support from the Gordon and Betty Moore EPiQS grant GBMF 4417. K. L. and N. T. acknowledge support from the National Science Foundation Grant No. DMR-1629382.
Appendix A Supplementary data

The temperature-dependent resistivity in Fig. 8 shows that 1T-FexTiS2 is indeed metallic, albeit with weak temperature dependent above . The inset shows the determination of the Curie temperature from (right axis) and (left axis) derivatives. Table 2 summarizes the composition dependence of various magnetization and MR parameters for the 1T-FexTiS2 series.
| FexTiS2 | (K) | (K) | [2 K](T) | MR[2 K](%) | ||
|---|---|---|---|---|---|---|
| 3.4 | 2.5* | 1.23* | 1.2 | |||
| 3.6 | 7* | 1.04* | 3.2 | |||
| 4.0 | 3.8 | 2.39 | 26 | |||
| 3.5 | 5.8 | 3.27 | 40.7 | |||
| 3.1 | 6.9 | 2.08 | 36.6 | |||
| 3.7 | 5.9 | 2.31 | 27.7 | |||
| 3.8 | 5 | 2.47 | 19.3 | |||
| 3.6 | 4.6 | 2.36 | 30.4 | |||
| 2.2 | 4.8 | 2.41 | 9.9 | |||
| 2.5 | 3.8 | 1.65 | 5.6 | |||
| 3.0 | 1.1 | 1.76 | 2.3 | |||
| 3.0 | 1.3 | 4.16 | 11.8 | |||
| 3.0 | 2 | 2.82 | 0.3 | |||
| 3.6 | 0.9 | 3.98 | 0.7 | |||
| 2.7 | 2 | 2.04 | 0.5 | |||
| 2.3 | 0.8 | 0.63 | 0.6 | |||
| 3.6 | 3.8 | 1.90 | 4.8 |
*Values are for coercive field and M(7 T) when no switching field or magnetization saturation was observed up to 7 T.
Appendix B Spin glass behavior in TiS2 for
Fig. 9 illustrates the frequency dependence of the AC susceptibility for . The glassy behavior is often characterized by frequency dependence given by equation (2) mydosh_spin_1993 :
| (2) |
or alternatively
| (3) |
where is the freezing temperature below which the system is in a spin glass state, defined as the temperature of the peak in susceptibility, a characteristic relaxation frequency with characteristic relaxation time , is the dynamic exponent, and is the critical exponent. The exponent is used as a general indicator for glassiness with typical values for systems with glassy behavior ranging from svanidze_cluster-glass_2013 . In 1T-FexTiS2 spin glass behavior is observed for , with ranging from to , as seen in Table 3.
Further differentiation between spin and cluster glass behavior can be made from Vogel-Fulcher fits to equation 4
| (4) |
where E is the activation energy for the spins to overcome the clusters to align with the field, kB is the Boltzmann constant, and is the Vogel-Fulcher temperature, which is a measure of the interaction strength between clusters mydosh_spin_1993 . Negative values of indicated a spin glass system, while the positive values of are signs of clusters formation anand_ferromagnetic_2012. Fig. 9b illustrates the Vogel-Fulcher fits for . The values are positive for all glassy samples with , pointing to cluster glass behavior.
| [] (K) | (K) | ||
|---|---|---|---|
| 0.1 | |||
| 0.2 | |||
| 0.3 | |||
| 0.530 | |||
| 0.703 |
Appendix C Annealing Study
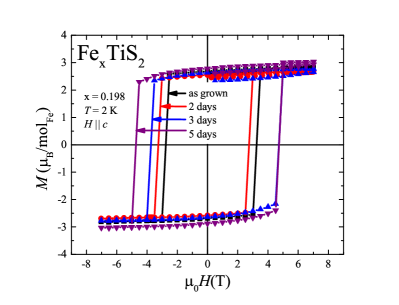
Choi et al. suggested that growth parameters could have an effect on the switching field in FexTaS2. Specifically, increasing the rate of quenching associated with smaller domains resulted in a greater attributed to pinning of magnetic domain walls choi_giant_2009 . For comparison, we performed a study to measure the switching field as a function of annealing time (Fig. 10). A sample of 1T-FexTiS2 () was annealed in 24 hour increments with magnetization (, K) measured at each annealing step. Before the sample disintegrated at days, it showed increasing with annealing time. It can be expected that a larger domain requires more energy to flip, and hence one assumption is that domain growth is promoted with increasing annealing times, and correspondingly, larger Hs are required for the domain flip. These two contradictory results: both quenching and annealing increasing despite having opposite affects on domain size, in addition to magnetic domain imaging indicating an unusual dendritic formation of domains vannette_local-moment_2009, suggest that domains in this system have an important role to play on magnetic properties.
References
- [1] Yun Kim, Jin-Lin Huang, and Charles M. Lieber. Characterization of nanometer scale wear and oxidation of transition metal dichalcogenide lubricants by atomic force microscopy. Applied Physics Letters, 59(26):3404–3406, December 1991.
- [2] Chih-Wei Chen, Jesse Choe, and E. Morosan. Charge density waves in strongly correlated electron systems. Reports on Progress in Physics, 79(8):084505, 2016.
- [3] E. Morosan, H. W. Zandbergen, B. S. Dennis, J. W. G. Bos, Y. Onose, T. Klimczuk, A. P. Ramirez, N. P. Ong, and R. J. Cava. Superconductivity in CuxTiSe2. Nature Physics, 2(8):544–550, August 2006.
- [4] P. Garoche, J. J. Veyssié, P. Manuel, and P. Molinié. Experimental investigation of superconductivity in -NbSe2 single crystal. Solid State Communications, 19(5):455–460, July 1976.
- [5] E. Morosan, K. E. Wagner, Liang L. Zhao, Y. Hor, A. J. Williams, J. Tao, Y. Zhu, and R. J. Cava. Multiple electronic transitions and superconductivity in PdxTiSe2. Physical Review B, 81(9):094524, March 2010.
- [6] Shoichi Nagata, Tsuyoshi Aochi, Tsuyoshi Abe, Shuji Ebisu, Takatsugu Hagino, Yoshitaka Seki, and Kitomi Tsutsumi. Superconductivity in the layered compound 2-TaS2. Journal of Physics and Chemistry of Solids, 53(10):1259–1263, October 1992.
- [7] K. E. Wagner, E. Morosan, Y. S. Hor, J. Tao, Y. Zhu, T. Sanders, T. M. McQueen, H. W. Zandbergen, A. J. Williams, D. V. West, and R. J. Cava. Tuning the charge density wave and superconductivity in CuxTaS2. Physical Review B, 78(10):104520, September 2008.
- [8] J. A. Wilson, F. J. Di Salvo, and S. Mahajan. Charge-density waves and superlattices in the metallic layered transition metal dichalcogenides. Advances in Physics, 24(2):117–201, March 1975.
- [9] Emilia Morosan, Douglas Natelson, Andriy H. Nevidomskyy, and Qimiao Si. Strongly correlated materials. Advanced Materials, 24(36):4896–4923, 2012.
- [10] B. Radisavljevic, A. Radenovic, J. Brivio, V. Giacometti, and A. Kis. Single-layer MoS2 transistors. Nature Nanotechnology, 6(3):147–150, March 2011.
- [11] Z. Y. Zhu, Y. C. Cheng, and U. Schwingenschlögl. Giant spin-orbit-induced spin splitting in two-dimensional transition-metal dichalcogenide semiconductors. Physical Review B, 84(15):153402, October 2011.
- [12] Mazhar N. Ali, Jun Xiong, Steven Flynn, Jing Tao, Quinn D. Gibson, Leslie M. Schoop, Tian Liang, Neel Haldolaarachchige, Max Hirschberger, N. P. Ong, and R. J. Cava. Large, non-saturating magnetoresistance in WTe2. Nature, 514(7521):205–208, October 2014.
- [13] J.A. Wilson and A.D. Yoffe. The transition metal dichalcogenides discussion and interpretation of the observed optical, electrical and structural properties. Advances in Physics, 18(73):193–335, May 1969.
- [14] Michio Naito and Shoji Tanaka. Electrical transport properties in -NbS2, -NbSe2, -TaS2 and -TaSe2. Journal of the Physical Society of Japan, 51(1):219–227, January 1982.
- [15] Michel Bayard and M. J. Sienko. Anomalous electrical and magnetic properties of vanadium diselenide. Journal of Solid State Chemistry, 19(4):325–329, December 1976.
- [16] Justin S. Chen, Jiakui K. Wang, Scott V. Carr, Sven C. Vogel, Olivier Gourdon, Pengcheng Dai, and E. Morosan. Chemical tuning of electrical transport in Ti1-xPtxSe2-y. Physical Review B, 91(4):045125, January 2015.
- [17] S. S. P. Parkin and R. H. Friend. transition-metal intercalates of the niobium and tantalum dichalcogenides. I. Magnetic properties. Philosophical Magazine Part B, 41(1):65–93, January 1980.
- [18] H. Narita, H. Ikuta, H. Hinode, T. Uchida, T. Ohtani, and M. Wakihara. Preparation and physical properties of FexTaS2 () compounds. Journal of Solid State Chemistry, 108(1):148–151, January 1994.
- [19] E. Morosan, H. W. Zandbergen, Lu Li, Minhyea Lee, J. G. Checkelsky, M. Heinrich, T. Siegrist, N. P. Ong, and R. J. Cava. Sharp switching of the magnetization in Fe1∕4TaS2. Physical Review B, 75(10):104401, March 2007.
- [20] Will J. Hardy, Chih-Wei Chen, A. Marcinkova, Heng Ji, Jairo Sinova, D. Natelson, and E. Morosan. Very large magnetoresistance in Fe0.28TaS2 single crystals. Physical Review B, 91(5):054426, February 2015.
- [21] Chih-Wei Chen, Shalinee Chikara, Vivien S. Zapf, and E. Morosan. Correlations of crystallographic defects and anisotropy with magnetotransport properties in FexTaS2 single crystals (). Physical Review B, 94(5):054406, August 2016.
- [22] M. Inoue, M. Matsumoto, H. Negishi, and H. Sakai. Low field ac magnetic susceptibility measurements of intercalation compounds MxTiS2 (M = 3d transition metals). Journal of Magnetism and Magnetic Materials, 53(1–2):131–138, November 1985.
- [23] M. Inoue, K. Sadahiro, and H. Negeshi. Transport studies on relaxation behavior in spin-glass phase of itinerant magnetic intercalate FexTiS2. Journal of Magnetism and Magnetic Materials, 98(1):60–64, July 1991.
- [24] Mikio Koyano, Manabu Suezawa, Hajime Watanabe, and Masasi Inoue. Low-field magnetization and AC magnetic susceptibility of spin- and cluster-glasses of itinerant magnet FexTiS2. Journal of the Physical Society of Japan, 63(3):1114–1122, March 1994.
- [25] Fumihiro Matsukura, Yūichi Tazuke, and Tomonao Miyadai. ac-susceptibility study of Ising spin glasses: FexTiS2. Journal of the Physical Society of Japan, 58(9):3355–3360, September 1989.
- [26] Hiroshi Negishi, Shigeo Ōhara, Mikio Koyano, Masasi Inoue, Toshiro Sakakibara, and Tsuneaki Goto. Anisotropic spin-glass and cluster-glass of layered FexTiS2 crystals. Journal of the Physical Society of Japan, 57(12):4083–4085, December 1988.
- [27] Mikio Koyano, Syuu Horisaka, Hiroshi Negishi, Minoru Sasaki, Masasi Inoue, Naoshi Suzuki, and Kazuko Motizuki. Magnetic scattering of conduction carriers in transition-metal intercalates of MxTiS2 (M=Mn, Fe, Co, and Ni). Journal of Low Temperature Physics, 78(1-2):141–154, January 1990.
- [28] Tetsuya Satoh, Yūichi Tazuke, Tomonao Miyadai, and Kensuke Hoshi. Ferromagnetic and reentrant spin glass properties in an Ising magnet FexTiS2. Journal of the Physical Society of Japan, 57(5):1743–1750, May 1988.
- [29] H. Negishi, A. Shoube, H. Takahashi, Y. Ueda, M. Sasaki, and M. Inoue. Magnetic properties of intercalation compounds MxTiS2 (M = 3d transition metal). Journal of Magnetism and Magnetic Materials, 67(2):179–186, June 1987.
- [30] Toshihiro Yoshioka and Yûichi Tazuke. Magnetic properties of FexTiS2 system. Journal of the Physical Society of Japan, 54(6):2088–2091, June 1985.
- [31] S. S. P. Parkin and R. H. Friend. transition-metal intercalates of the niobium and tantalum dichalcogenides. II. Transport properties. Philosophical Magazine Part B, 41(1):95–112, January 1980.
- [32] J. Dijkstra, P. J. Zijlema, C. F. van Bruggen, C. Haas, and R. A. de Groot. Band-structure calculations of Fe1/3TaS2 and Mn1/3TaS2, and transport and magnetic properties of Fe0.28TaS2. Journal of Physics: Condensed Matter, 1(36):6363, September 1989.
- [33] K.-T. Ko, Kyoo Kim, Sung Baek Kim, H.-D. Kim, J.-Y. Kim, B. I. Min, J.-H. Park, F.-H. Chang, H.-J. Lin, A. Tanaka, and S-W. Cheong. RKKY ferromagnetism with Ising-like spin states in intercalated Fe1/4TaS2. Physical Review Letters, 107(24):247201, December 2011.
- [34] Y. J. Choi, S. B. Kim, T. Asada, S. Park, Weida Wu, Y. Horibe, and S.-W. Cheong. Giant magnetic coercivity and ionic superlattice nano-domains in Fe0.25TaS2. EPL (Europhysics Letters), 86(3):37012, 2009.
- [35] M. Inoue, H. P. Hughes, and A. D. Yoffe. The electronic and magnetic properties of the 3d transition metal intercalates of TiS2. Advances in Physics, 38(5):565–604, January 1989.
- [36] Yoshihiro Kuroiwa, Masahiro Nishimura, Ritsuko Nakajima, Hiroshi Abe, and Yukio Noda. Short-range order and long-range order of Fe atoms in a spin-glass phase and a cluster-glass phase of intercalation compounds FexTiS2. Journal of the Physical Society of Japan, 63(12):4278–4281, December 1994.
- [37] Y. Kuroiwa, M. Nishimura, Y. Noda, and Y. Morii. Neutron powder diffraction study of intercalation compound FexTiS2. Physica B: Condensed Matter, 213-214(Supplement C):396–398, August 1995.
- [38] Yoshihiro Kuroiwa, Hideo Honda, and Yukio Noda. Neutron magnetic scattering of intercalation compounds FexTiS2. Molecular Crystals and Liquid Crystals Science and Technology. Section A. Molecular Crystals and Liquid Crystals, 341(2):15–20, April 2000.
- [39] M. A. Ruderman and C. Kittel. Indirect exchange coupling of nuclear magnetic moments by conduction electrons. Physical Review, 96(1):99–102, October 1954.
- [40] Tadao Kasuya. A theory of metallic ferro- and antiferromagnetism on Zener’s model. Progress of Theoretical Physics, 16(1):45–57, July 1956.
- [41] Kei Yosida. Magnetic properties of Cu-Mn alloys. Physical Review, 106(5):893–898, June 1957.
- [42] C. M. Fang, R. A. de Groot, and C. Haas. Bulk and surface electronic structure of and . Phys. Rev. B, 56:4455–4463, Aug 1997.
- [43] Y. Tazuke, T. Miyashita, H. Nakano, and R. Sasaki. Magnetic properties of MxTiSe2 (M = Mn, Fe, Co). Physica Status Solidi C, 3(8):2787–2790, September 2006.
- [44] M. A. Buhannic, P. Colombet, M. Danot, and G. Calvarin. The iron electronic characteristics and the crystal dimensionality of the phases FexTiSe2 (). Journal of Solid State Chemistry, 69(2):280–288, August 1987.
- [45] S. J. Hillenius and R. V. Coleman. Magnetic susceptibility of iron-doped -NbSe2. Physical Review B, 20(11):4569–4576, December 1979.
- [46] J. A. Mydosh. Spin Glasses: An Experimental Introduction. Taylor and Francis, London, 1993.
- [47] E. Svanidze and E. Morosan. Cluster-glass behavior induced by local moment doping in the itinerant ferromagnet Sc3.1In. Physical Review B, 88(6):064412, August 2013.