Surface curvature guides early construction activity in mound-building termites
Abstract
Termite colonies construct towering, complex mounds, in a classic example of distributed agents coordinating their activity via interaction with a shared environment. The traditional explanation for how this coordination occurs focuses on the idea of a “cement pheromone”, a chemical signal left with deposited soil that triggers further deposition. Recent research has called this idea into question, pointing to a more complicated behavioral response to cues perceived with multiple senses. In this work, we explored the role of topological cues in affecting early construction activity in Macrotermes. We created artificial surfaces with a known range of curvatures, coated them with nest soil, placed groups of major workers on them, and evaluated soil displacement as a function of location at the end of one hour. Each point on the surface has a given curvature, inclination, and absolute height; to disambiguate these factors, we conducted experiments with the surface in different orientations. Soil displacement activity is consistently correlated with surface curvature, and not with inclination nor height. Early exploration activity is also correlated with curvature, to a lesser degree. Topographical cues provide a long-term physical memory of building activity in a manner that ephemeral pheromone labeling cannot. Elucidating the roles of these and other cues for group coordination may help provide organizing principles for swarm robotics and other artificial systems.
I Introduction
Termites in the Macrotermitinae subfamily construct towering earthen structures around their nests, which provide protection and help to ventilate and regulate internal climate Ocko2017 . The construction of these mounds requires the translocation of hundreds of kilograms of soil annually Turner2006 . The soil is moved from deep beneath the colony, up through the mound, to be placed on the outer surface of the mound Turner2006 . Soil may not be moved directly from the subterranean source to the ultimate site of deposition, but appears to be conveyed in stages as it travels upwards to the surface through the action of a number of individuals Turner2006 . The process of moving this soil leads to extensive remodeling of the tunnels and chambers within the mound Ocko2017 .
The mechanisms that govern where soil is removed from as well as added to the walls of the tunnels within the mound are unknown. It has been long thought that social insects organize their labor through a system of indirect communication known as stigmergy Grasse59 ; Bruinsma1979 ; Theraulaz1999 ; Khuong2016 , in which the insects manipulate a shared environment, which thereby stores information they use to coordinate their joint activity. In the classic formulation, a putative cement pheromone is hypothesized to be added to soil pellets deposited by workers; other workers encountering this pheromone respond by depositing additional soil, leading to a positive feedback loop that results in the accumulation of soil at focal locations Grasse59 ; Khuong2016 . This emphasis on cement pheromone has been challenged by a growing number of studies in termites Bardunias2010 ; Fouquet2014 ; Petersen2015 ; Green2016 and ants Bruce2016 ; it is also noteworthy that no cement pheromone has yet been identified. Instead, other cues have been identified as playing a role in organization of insect construction activity. Tactile cues have been suggested to elicit deposition responses in termites that could result in mound building Fouquet2014 . In Macrotermes, aggregation of actively digging workers has been shown to be a cue for recruiting additional workers, and excavation sites shown to act as a template for deposition Green2016 . In Coptotermes formosanus (Shiraki), both excavation and deposition have been shown to occur at depressions within tunnel walls depending on the behavioral state of the termite Bardunias2009 . Bends in tunnels have also been shown to act as cues for excavation and deposition Lee2008 .
In the language of this theme issue, the termites and the structures they build act as a hybrid liquid/solid brain. The termites constitute the liquid component, moving freely through the mound, interacting and responding to local stimuli; the structures constitute the solid component, presenting a fixed record of activity that is modified over longer time scales. Together they form a system of distributed cognition. The output of the actions of individual termites involved in the construction process is not ephemeral, but remains encoded in the topography of the structures they create. These structures thus act as a shared memory for the termite work force. Later construction occurs at sites that are artefacts of the labor of earlier construction. Building activity is shaped by a combination of existing topography, environmental conditions within the mound, and the behavioral motivation of the workers themselves as they seek to move and deposit wet soil or alternately excavate soil to be transported elsewhere. The interplay of the liquid and solid aspects of the termite collective brain provides termites with the ability to rapidly respond to changing needs and environmental challenges, while maintaining a structure that remains effective over the life span of many individual termite workers.
Macrotermes may be responding to topographical cues in choosing sites for excavation and/or deposition. Tunnel curvature may provide cues analogous to those shown to be informative in C. formosanus Bardunias2009 ; Lee2008 ; Lee2008b . However, previous studies with subterranean termites have been conducted in horizontal planar arenas, which exclude other possible cues that may be present in freer environments. For instance, incline (slope with respect to the vertical) may provide a cue; similarly, termites may express geotaxis, exhibiting a tendency to move up or down with respect to gravity to excavate or place soil. Herein we show that early termite construction activity is strongly associated with surface concavity (high positive curvature, using the mean curvature definition), and displays inconsistent correlation with inclination or geotaxis.
II Methods
II.1 Experiments
We conducted experiments in April 2017 at the Cheetah View Field Biology Station near Otjiwarongo, Namibia ( S, E). We studied termites of the species Macrotermes michaelseni (Sjostedt) (Blattodea: Termitidae), placing workers on a shaped surface and recording their activity.
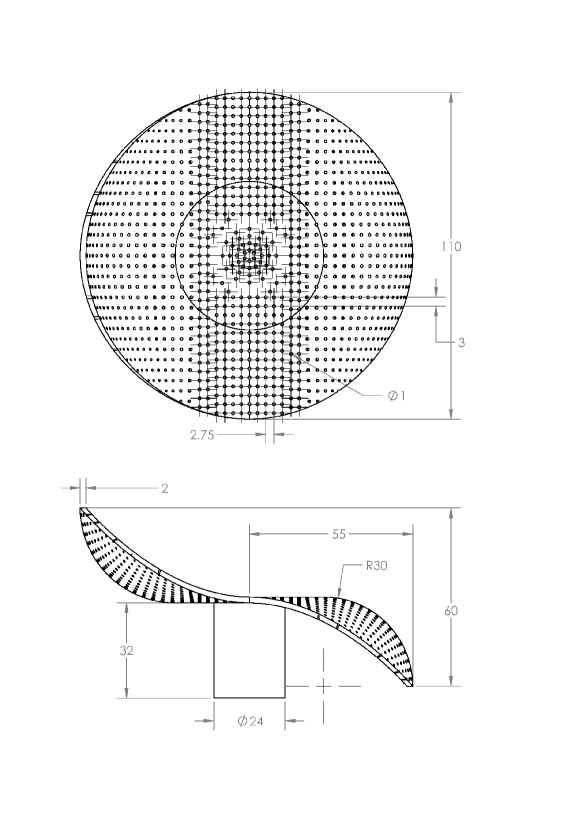
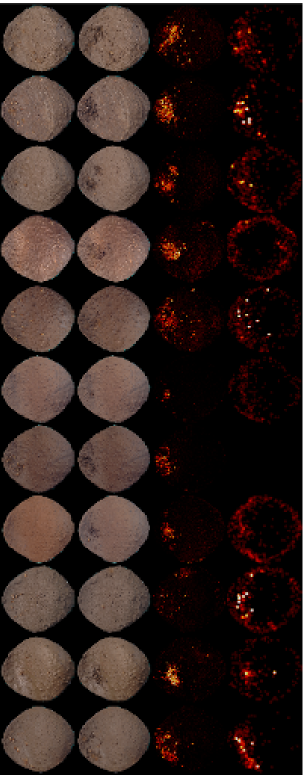
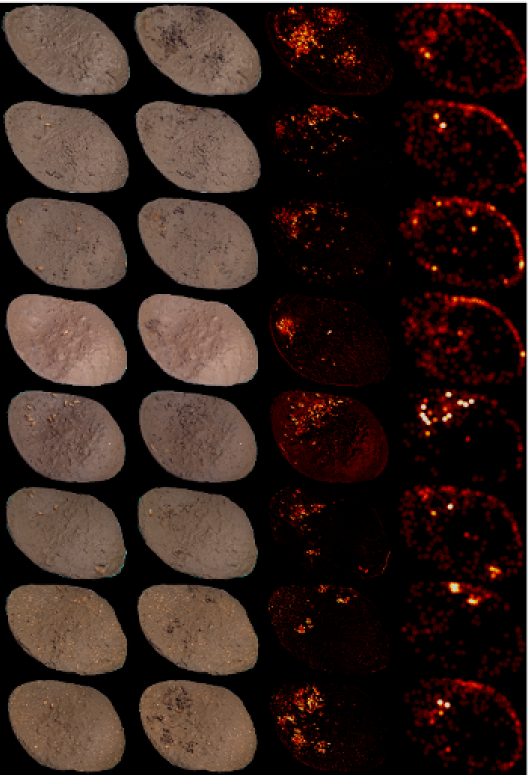
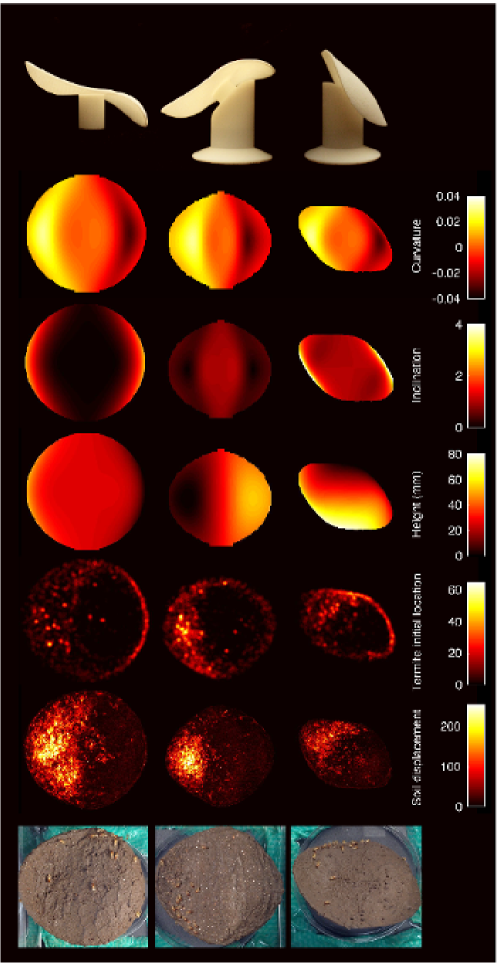
In order to determine the effect of the three factors noted above (curvature, inclination and geotaxis), we designed and 3D-printed a specialized test surface (Figure 1, top row; SI Figure A.1). The curvature varies continuously over this surface, with areas that are concave, convex, or flat; similarly, each point on the surface is associated with a specific inclination and height when the surface is mounted in a given orientation (Figure 1, each column). To disambiguate the three factors, we performed experiments with the surface mounted in three different orientations; reorienting the surface changes the inclination and height at each point but not the curvature. These different orientation conditions were termed horizontal, 45 degrees, and vertical (Figure 1, top row left to right). The surface was also designed with homogeneous small perforations, to help ensure uniform soil moisture across the surface.
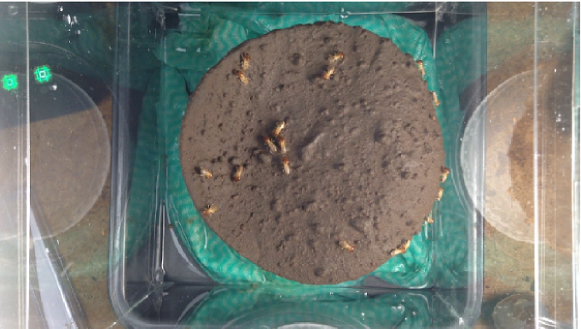
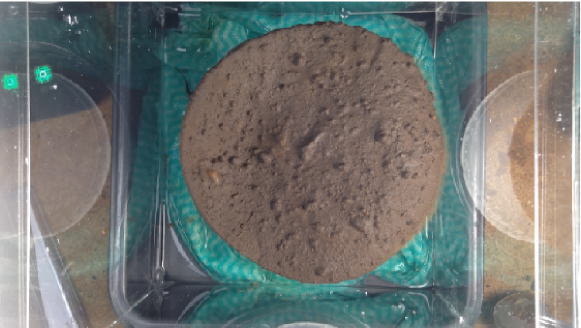
For each treatment we performed experiments using 3 different colonies, with three replicas for each colony (except for colony 2, where 45 degrees orientation had five replicas, and vertical orientation had two replicas). For each experiment we extracted termites and recently manipulated soil from an active building site of one of the 3 colonies. After collection, termites were stored in an enclosed container with wet paper towels, for no longer than 6 hours before an experiment. We coated the test surface with a layer of the recently manipulated soil approximately 2mm thick. Mound soil was mixed with water to achieve a loose consistency that was poured onto the surface of the manifold. This was repeated three times to achieve the proper soil depth, and if the surface appeared too dry during the process, water was sprayed on the surface to ensure the soil was in a liquid Atterberg state Atterberg . Liquid soil on the manifolds was allowed to air-dry for 20 minutes to allow soil to dry to its plastic Atterberg state: approximately 25% water by weight. Soil from manifolds coated and dried in this manner was tested using the ASTM Standard D 4318 test to verify that the soil had dried from its liquid Atterberg state to the plastic state. No special effort was made to remove larger particulates from the soil, resulting in a more granular surface. By not sieving larger soil particles, we provided termites with soil conditions typical of their natural environment. These particles could potentially influence behavior, but they were distributed haphazardly over the whole surface, with no consistent locations across trials, and not likely to confound any effect of topology. The last row of Figure 1 displays initial state examples for each treatment. In an indoor environment, we oriented the test surface according to the experimental condition, placed 25 termites of the major worker caste atop it, and enclosed it in a custom-built acrylic box, illuminated by LED lamps on two sides and with a wet cloth underneath the surface to maintain air humidity. Experiments were filmed (1080x1920 resolution, 30 frames per second) from above for an hour, or, given that there were no physical boundaries to the surface and termites occasionally fell off its edges, until no termites remained on the surface.
II.2 Analysis
Since the surface was designed digitally, we could easily calculate the curvature, height, and inclination of every point for each orientation. A geometric transformation gave the correspondence between each pixel in the video image and the corresponding point on the surface. We used the mean curvature definition, , where and are the two principal curvatures of the surface at a point. A principal curvature is positive if it curves in the direction of the surface normal vector and negative if opposite to it. Inclination was defined as the modulus of the gradient of the tangent plane at a point.
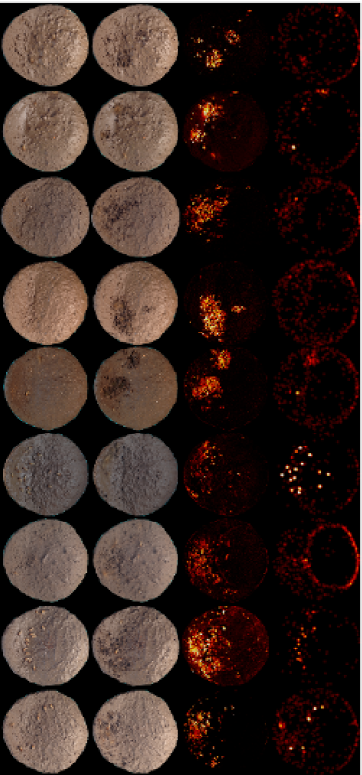
To bring all videos into consistent registration, we performed the following procedure. First, we averaged all frames over each minute of the video (30 frames per second, or 1800 frames per minute), providing the equivalent of a long exposure photo for each minute of the video. This provided 60 averaged images (for experiments that did last the full hour). Termites that moved during each one-minute period were averaged away and were in most cases invisible in these averaged images (SI Figure A.2).
Next, we used an automatic image stabilization algorithm provided by Matlab (Matlab2016a, Video Stabilization Using Point Feature Matching package) to eliminate camera drift that occurred over the course of some experiments. Removing termites before this step was necessary to avoid false automatic features from being selected and affecting the image stabilization. Next, to adjust for small inconsistencies in camera positioning between videos (orientation, position, and height relative to the surface), we manually annotated the edge of the surface in each video to define a region of interest (ROI), and applied an algorithm to match ROIs for all trials with the same treatment: resize to have the same overall area, shift to have the same centroid, and finally test possible rotations in order to maximize the overlap between them.
To quantify soil displacement, for each replica we averaged the first and last 5 minutes of video into single images (respectively first and second column of SI Figures A.3–A.5) and performed a background subtraction by taking the difference between these initial and end states. This procedure removed visible features in the soil covering the surface (e.g., small stones) that remain unchanged since the start of the trial. The remaining image provided a record of soil displacement activity, including both excavations and depositions. Finally, this RGB image was converted to monochrome (third column of SI Figures A.3–A.5), and the results of the multiple replicas all averaged into a single image, with pixel brightness representing the strength of consistency of soil displacement at each point. Averaging over the multiple trials for each orientation removed any remaining termites that did remain immobile (and therefore visible) in the last minutes within a single replica (Figure 1, row 6).
The same factors of curvature, inclination, and height may also affect where termites prefer to move in addition to where they prefer to dig, and the former effect may contribute to the latter. To investigate how these factors influence termite movement, we manually marked termite locations in each video at every 10 seconds for the first 5 minutes of each recording (for a total of 40 frames per replica). This time range was chosen in order to capture initial exploration activity, during a period before excavations began, since active excavation influences activity of other termites Green2016 . Since termites sometimes do not start moving for some time after being placed on the surface, we excluded termites that had not yet moved to a distance of at least 30 pixels from their positions in the first tracked frame. One replica of the 45 degrees orientation was not tracked due to the first minutes of the video of that replica being lost. Each marked termite position was translated to a circle of approximately the size of a termite (15 pixels radius), and all circles superimposed for the tracked period of a given replica, to produce a heatmap indicating termite locations during early exploration of the surface (Figure 1, row 5; SI Figures A.3–A.5, last column).
III Results
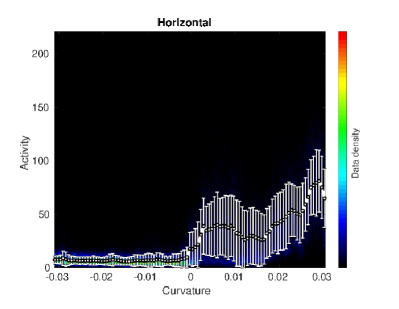
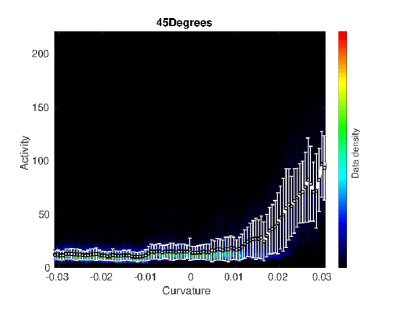
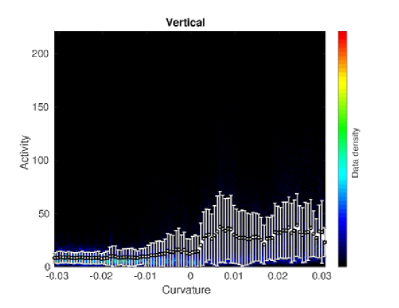
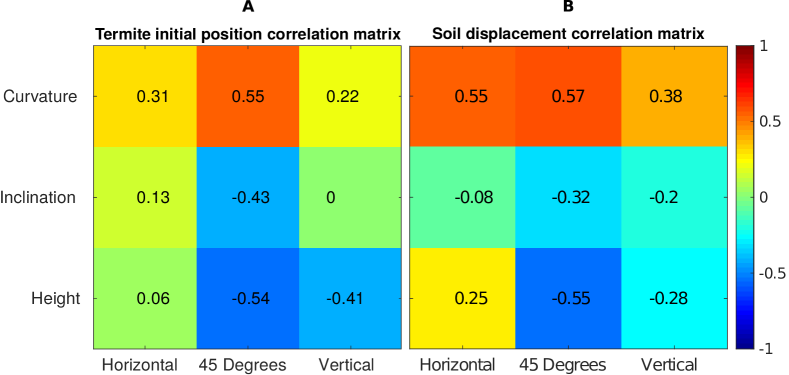
Figure 1 (second to sixth row) shows the different results discussed above as a function of position on the surface, displayed as a heatmap. Columns represent the three different orientations (as seen in the first row), and the following rows represent curvature, inclination, height, termite early movement, and construction activity. The correlation of curvature with construction activity, and the lack of consistent correlation of inclination or height with construction activity, is visible across all orientations. Density plots and averages of activity as a function of curvature for all orientations are shown in SI Figure A.6. While excavation and deposition cannot be separately quantified with our method, visual inspection showed that deposition occurred primarily in the immediate vicinity of excavation sites (SI Figures A.3–A.5), consistent with previous studies Green2016 . Figure 2 quantifies the correlation matrices between surface geometric factors (curvature, inclination and height) and both termite early locations and construction activity.
These results show that curvature is the consistent and sole driver, among the measured geometric candidates, of both early termite positioning and construction activity. Curvature is more strongly correlated with soil displacement than with termite locations, indicating that the observed preference for construction in concave areas is not solely due to (though possibly influenced by) the preference for spending time in those places.
It is worth noting that these correlation values are at best a lower bound estimate of the agreement between activity and curvature. The curvature has a continuous distribution of values, while termite activity happens in relatively small regions of the surface, with much of the surface displaying no activity.
IV Conclusions
Construction in termites requires that each pellet of soil used in building must first be excavated from someplace within the nest or beyond Bardunias2009 . Macrotermes mounds are permeated with a system of conduit tunnels that allow passage as well as affecting airflow to the nest and fungus garden below. Our study suggests that the curvature of these tunnels within the mound acts as a cue that organizes their construction, in a physical feedback loop. Termites, the mobile agents that act as the “liquid” component in the liquid/solid brain analogy, behave like a liquid in a further sense, pooling in concave areas. Construction activity that then occurs starting in these zones further shapes the solid component embodied by the mound. These ongoing changes affect the local perceptions the termites have, and continue to influence the possible outcomes of the growing structure.
Zones of tunnel with high rates of curvature can occur as artifacts of tunnel excavation, and may be similar to the depressions in tunnel walls that have been shown to attract labor in C. formosanus Lee2008 . The manner in which termites assess curvature in tunnel walls is unknown, but presumably involves a combination of antennation and proprioception of body posture Staudacher2005 ; Bardunias2009b . Lee et al. Lee2008 found that termites excavated at depressions in tunnel walls when their forward progress was impeded.
The rate of curvature of tunnels can be expected to be low for the large, smooth tunnels that make up the main air-flow conduits in the central portion of the mound Turner2008 . Where tunnels abruptly turn back near the outer surface of the mound, or in the narrowing at the top of the mound, high curvature may focus excavation, expanding the internal conduits, or soil deposition, sealing conduits and thickening the mound walls.
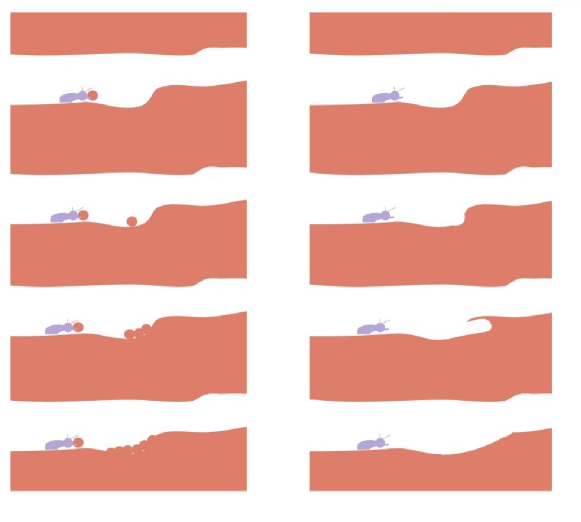
An attraction to curvatures with values typical of excavation sites may lead to a positive feedback loop of activity, eventually producing a tunnel originating at such a site. Alternatively, when encountering high curvatures near transitions in the topography, termites could react by smoothing away these features through either excavation or deposition (SI Figure A.7). These two possibilities represent computations the liquid/solid brain can perform, amplifying or smoothing out initial irregularities in tunnel walls. In future work, we will develop simulation models to further explore quantitatively the ways in which these different types of computations occur under different conditions, and how they might contribute to mound function. The existence of a dynamic equilibrium between opposing excavation and deposition behavior at the same sites has been shown in C. formosanus to alternately expand or cover over depressions in tunnel walls Bardunias2009 ; Lee2008 . The same cue elicits opposing digging and filling based on the prior behavioral state of the termites, loaded with soil vs seeking a digging site. This system allows for a rapid response by the termites to changing conditions that alter the behavioral state of the termite workers. A local imbalance in workers seeking to excavate soil or loaded workers looking to deposit will govern what occurs at zones of high curvature.
This study is part of an ongoing effort to elucidate the cues termites use in collective construction, identifying the factors in their environment and their interactions with others that shape their behavior. Ascertaining these behavioral rules, and relating them to characteristics of the mounds the insects build together, will help advance our understanding of how individual agent actions connect to collective colony outcomes. Connecting these small-scale and large-scale levels of description has the potential to help us understand the operation of other social insect species, as well as providing principles for the design of artificial swarm systems, where large numbers of independent robots follow simple rules in order to build structures or achieve other desired outcomes Brambilla2013 .
V Author Contributions
Study concept: ST, RN, JW; Study design: PB, DSC, NC, ST, RN, JW; field/laboratory work: PB, NC, DSC; data analysis: DSC; Interpretation: DSC, PB, NC, ST, RN, JW; writing: DSC, PB, JW; All authors gave final approval for publication.
VI Acknowledgments
Research reported in this publication was supported by the National Institute of General Medical Sciences of the National Institutes of Health under award number R01GM112633. The content is solely the responsibility of the authors and does not necessarily represent the official views of the National Institutes of Health. We thank the Cheetah Conservation Fund for providing research facilities.
References
- (1) Ocko SA, King H, Andreen D, Bardunias P, Turner JS, Soar R, et al. Solar-powered ventilation of African termite mounds. Journal of Experimental Biology. 2017;220(18):3260–3269. Available from: http://jeb.biologists.org/content/220/18/3260.
- (2) Turner J, Marais E, Vinte M, Mudengi A, Park W. Termites, water and soils. Agricola. 2006;16:40–45.
- (3) Grasse PP. La reconstruction du nid et les coordinations interindividuelles chez bellicositermes natalensis et cubitermes sp. La theorie de la stigmergie: essai d’interpretation du comportement des termites constructeurs. Insectes Sociaux. 1959;6:41–81.
- (4) Bruinsma OH. An analysis of building behaviour of the termite Macrotermes subhyalinus (Rambur). Wageningen University; 1979.
- (5) Theraulaz G, Bonabeau E. A Brief History of Stigmergy. Artificial Life. 1999;5(2):97–116. Available from: https://doi.org/10.1162/106454699568700.
- (6) Khuong A, Gautrais J, Perna A, Sbaï C, Combe M, Kuntz P, et al. Stigmergic construction and topochemical information shape ant nest architecture. Proceedings of the National Academy of Sciences. 2016;113(5):1303–1308. Available from: http://www.pnas.org/content/113/5/1303.
- (7) Bardunias PM, Su NY. Queue Size Determines the Width of Tunnels in the Formosan Subterranean Termite (Isoptera: Rhinotermitidae). Journal of Insect Behavior. 2010 May;23(3):189–204. Available from: https://doi.org/10.1007/s10905-010-9206-z.
- (8) Fouquet D, Costa-Leonardo AM, Fournier R, Blanco S, Jost C. Coordination of construction behavior in the termite Procornitermes araujoi: structure is a stronger stimulus than volatile marking. Insectes Sociaux. 2014 Aug;61(3):253–264. Available from: https://doi.org/10.1007/s00040-014-0350-x.
- (9) Petersen K, Bardunias P, Napp N, Werfel J, Nagpal R, Turner S. Arrestant property of recently manipulated soil on Macrotermes michaelseni as determined through visual tracking and automatic labeling of individual termite behaviors. Behavioural Processes. 2015;116:8 – 11. Available from: http://www.sciencedirect.com/science/article/pii/S0376635715001023.
- (10) Green B, Bardunias P, Turner JS, Nagpal R, Werfel J. Excavation and aggregation as organizing factors in de novo construction by mound-building termites. Proceedings of the Royal Society of London B: Biological Sciences. 2017;284(1856). Available from: http://rspb.royalsocietypublishing.org/content/284/1856/20162730.
- (11) Bruce AI. It is not all pheromones: No evidence that pheromones affect digging face choice during ant nest excavation. Behavioural Processes. 2016;122:12 – 15. Available from: http://www.sciencedirect.com/science/article/pii/S0376635715300668.
- (12) Bardunias P, Su NY. Opposing headings of excavating and depositing termites facilitate branch formation in the Formosan subterranean termite. Animal Behaviour. 2009;78(3):755–759.
- (13) Lee SH, Bardunias P, Su NY, Yang RL. Behavioral response of termites to tunnel surface irregularity. Behavioural Processes. 2008;78(3):397 – 400. Available from: http://www.sciencedirect.com/science/article/pii/S0376635708000478.
- (14) Lee SH, Yang RL, Su NY. Surface irregularity induced-tunneling behavior of the formosan subterranean termite. Behavioural Processes. 2008;78(3):473 – 476. Available from: http://www.sciencedirect.com/science/article/pii/S0376635708000429.
- (15) Standard Test Methods for Liquid Limit, Plastic Limit, and Plasticity Index of Soils. West Conshohocken, PA, USA: ASTM International; 2000.
- (16) Staudacher EM, Gebhardt M, Dürr V. Antennal Movements and Mechanoreception: Neurobiology of Active Tactile Sensors. vol. 32 of Advances in Insect Physiology. Academic Press; 2005. p. 49 – 205. Available from: http://www.sciencedirect.com/science/article/pii/S0065280605320029.
- (17) Bardunias P, Su NY. Dead Reckoning in Tunnel Propagation of the Formosan Subterranean Termite (Isoptera: Rhinotermitidae). Annals of the Entomological Society of America. 2009;102(1):158–165. Available from: http://dx.doi.org/10.1603/008.102.0118.
- (18) Turner JS, Soar RC. Beyond biomimicry: What termites can tell us about realizing the living building. In: First International Conference on Industrialized, Intelligent Construction at Loughborough University; 2008. .
- (19) Brambilla M, Ferrante E, Birattari M, Dorigo M. Swarm robotics: a review from the swarm engineering perspective. Swarm Intelligence. 2013 Mar;7(1):1–41. Available from: https://doi.org/10.1007/s11721-012-0075-2.
Appendix A Supplementary Information