Numerical studies on effect of operating conditions and geometrical components on the timing response and efficiency of RPC
Abstract
A detailed numerical simulation has been performed to investigate the timing properties of a standard RPC geometry in order to optimize its application in INO-ICAL experiment designed for studying atmospheric neutrinos. The timing information provided by the RPC is an important observable in the experiment to determine the direction of the neutrinos. Effects of various operating conditions and design components on the RPC timing response, mainly the average signal arrival time and the time resolution have been studied in this context. The dependence of the detector efficiency on the same parameters has also been presented.
A. Jasha,c111
Present address: Department of Particle Physics and Astrophysics, Weizmann Institute of
Science, Rehovot 7610001, Israel (E-mail: abhik.jash@weizmann.ac.il).
, N. Majumdara,c, S. Mukhopadhyaya,c, S. Chattopadhyayb,c
aApplied Nuclear Physics Division, Saha Institute of Nuclear Physics, Block AF, Sector 1, Bidhannagar, Kolkata 700064, India
bExperimental High Energy Physics Division, Variable Energy Cyclotron Centre, Block AF, Sector 1, Bidhannagar, Kolkata 700064, India
cHBNI, Training School Complex, Anushakti Nagar, Mumbai 400094, India
E-mail: abhik.jash@niser.ac.in
1 Introduction
Resistive Plate Chamber (RPC) [1] has been chosen as the active detector element for
the magnetized Iron CALorimeter (ICAL) setup [2] of 50 kTon target mass in the proposed
underground laboratory facility of India-based Neutrino Observatory (INO). The ICAL has been
designed for detection of the muons propagating through the calorimeter, identification of their charges
and accurate determination of their energies and directions. These will allow for a sensitivity to
the neutrino mass hierarchy and precision measurement of the neutrino mixing parameters. To
accomplish the task, the ICAL will be equipped with RPCs stacked in horizontal layers interleaving
151 layers of iron plates of thickness 5.6 cm which will be magnetized to produce a uniform
magnetic field of 1.3 T over the entire plate thickness. Muons of opposite charges (,
) produced by the charged current interaction of incoming atmospheric muon
neutrinos (, ) with the iron nuclei in the target mass will bend
differently under the action of the magnetic field and their path will be tracked using the two
dimensional position information provided by each RPC layer. In addition, the timing response
of the RPCs will allow for a determination of directionality of the muons by distinguishing between
up-going and down-going muons. All these measurements will allow to probe several important observables,
such as, the earth-matter effect of and that travel through the
earth before reaching the ICAL, their path length and the momenta. Fast timing response with
time resolution of the order of one nanosecond and position resolution of the order of one
centimeter from each detector layer are the basic requirements to achieve these goals.
A thorough understanding of the operation of RPC and dependence of its performance on different
conditions will help us to optimize its application in the ICAL as well as interpret and predict the
experimental results. The RPC made up of float glass electrodes has been opted for muon
detection in ICAL. However, a simultaneous R&D has been underway to investigate the feasibility
of using bakelite electrodes which can offer several advantages like high rate capability, easy
handling and fabrication and can be an alternative option for the ICAL.
In the present work, a detailed numerical simulation has been performed for this purpose to
investigate the dynamics of a bakelite RPC for different operational as well as geometrical
parameters which may be useful for validating its choice. Also, the numerical method has
been used to predict the behavior of the detector at conditions which are difficult to
realize using experiments.
In this context, computation of the entire working procedure of an RPC beginning from the
primary ionization caused by the passage of muons through it, till the generation of signal on its
read-outs, has been performed using a simulation framework developed for the gaseous detectors.
The main thrust has been put on the investigation of its timing performance under various
conditions. A straightforward approach based on the basic principles of electronic signal detection
has been implemented to calculate the timing response in the process of simulating
the induced current signal.
The same simulation has been performed for computing the timing properties of a glass RPC
for which experimental data are available [3] to compare with the numerical work. In this paper, the material property (bakelite or glass)
has been used for calculating the electric field and weighting field within the RPC gas chamber which
depends on the dielectric constant of the chosen material.
The content of the paper has been arranged in the following manner. The scheme of numerical simulation
adopted to calculate the RPC response has been described in section 2.
In section 3 the simulated results for a glass RPC has been compared
with the available experimental data.
The effect of different operating conditions and the geometrical components on the timing properties
and the efficiency of a bakelite RPC, as found from simulation, has been presented in
section 4. The computer resources used for the present simulation
work have been mentioned in section 5. Finally, concluding remarks are
made in section 6.
2 Simulation scheme
RPC being a gaseous detector, works on the principle of ionization phenomenon caused by the passage of a charged particle/radiation through its gaseous volume. When an energetic charged particle or radiation passes through the gaseous medium, it imparts its energy partially to the molecules of the gas mixture, causing their ionization or excitation. In presence of the electric field, the electrons and cations, created in the primary ionization, move towards the anode and the cathode, respectively. At lower values of the electric field, the electrons and cations may get lost due to processes like recombination, attachment, electron capture etc. When the electric field is sufficiently high, the primary electrons may gain enough kinetic energy to ionize other molecules when they collide with them, liberating more electrons and cations. Depending upon the kinetic energy gathered by the primaries, they can cause further ionization even after the secondary level. On the other hand, the cations, being very heavy, generally move slower and the probability of secondary ionization by the cations is quite less usually. The movement of all the ions, thus produced in a cascade of ionization, commonly known as avalanche, induces a current on the conductive read-out panel. Following the Shockley-Ramo theorem [4, 5], the current induced by a charge , moving with an instantaneous velocity , is given by the equation (1):
| (1) |
where, is the weighting field for a read-out and that
is calculated as the electric field produced at the instantaneous position ()
of the charge () when the read-out of interest is kept
at unit potential while all other available conductors are grounded. The
signal thus collected from the read-out strips is the characteristic response of the RPC that depends
on its geometry, electric field and the filling gas mixture for a given incident particle or radiation.
In the present work, the timing properties of a bakelite RPC have been studied for variation in
its operational parameters, such as, supplied voltage and filling gas mixture. In addition, the effect
of geometrical components, such as, the edge and the button spacer has been
investigated as well. To accomplish these, numerical simulation of the RPC signal for different
operational and geometrical conditions has been performed by calculating the current induced
on one of its read-out strips using Garfield [6]. Garfield is a simulation framework which
has interfaces to several toolkits, namely, HEED [7], neBEM [8], Magboltz [9],
to compute different auxiliary components relevant to the gaseous detector dynamics, such as, primary
ionization, electrostatic field, transport properties of the gas respectively. The final stage of signal
calculation is computed by the Garfield with the use of relevant data produced by the respective
toolkits.
The information on the primary ionization in the RPC gas chamber filled with a given gas mixture
due to the passage of a muon with a specific energy and direction can be obtained using HEED.
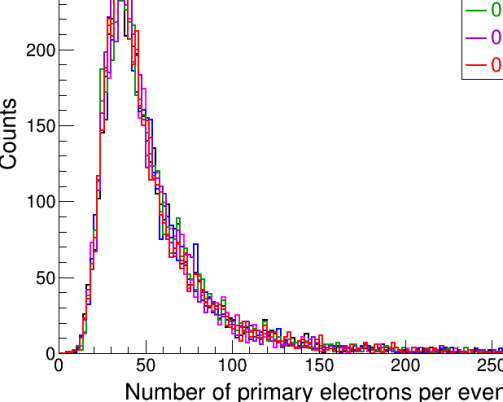
As an example, figure 1 shows a distribution of number of primary electrons
generated per event by the passage of 5000 muons each of energy 2 GeV traveling in a fixed direction
(5∘ with respect to the zenith) through a 2 mm gas gap containing C2H2F4,
5% i-C4H10 and different fractions of SF6.
Landau fit of the distribution produces a most probable value (MPV) of 34.81 denoting a primary electron
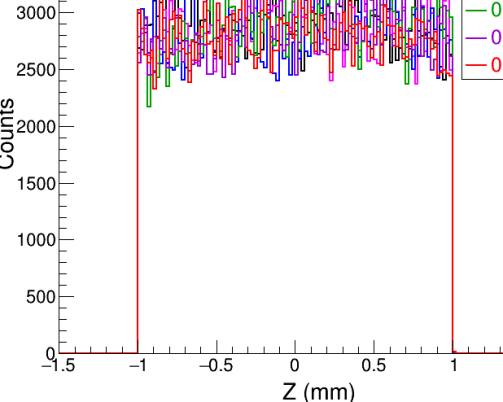
density of 174.05cm for the given gas mixture. Figure 1 shows the
spatial distribution of the primary electrons along the thickness of the gas gap which indicates an
almost uniform probability for ionization across the entire gap. No significant effect on the primary
ionization properties has been found for varying the SF6 fraction from 0.0% to 0.5%.
In simulating the detector response, it is important to carry out a precise computation of the field
configuration within the detector because it plays the principal role in the detector dynamics.
The detail electrostatic field map within a 30 cm 30 cm bakelite RPC has been calculated
using two numerical methods, namely, finite element method (COMSOL Multiphysics® [10])
and boundary element method (neBEM) and the results are available
in [11]. For the present work, the field maps have been calculated using neBEM v1.8.20.
A relative dielectric constant of 5.4 has been used for calculating the field in the bakelite RPC.
The same calculation has been repeated for a glass RPC using a different relative dielectric constant
of 13.5, for the glass electrodes in geometry. The time dependence of the electric
field owing to the finite bulk resistivity of the RPC plate has been ignored as it is not expected to
affect the signal [12]. An appropriate approach for this study would be
to find out the signal in the presence of a dynamic electric field as the space charges created in
the avalanche process tend to modify it [13]. However, the calculations
in the present work have been performed assuming a static electric field configuration where the
RPC is described as a multi-dielectric planar capacitor.
The electron transport properties in different gas mixtures have been calculated using the standalone
Magboltz v8.9.3 program for different field values. The variation of the electron transport properties,
such as, effective Townsend coefficient () which is the value after
subtracting the attachment coefficient () from the first Townsend coefficient (),
drift velocity (Vz) and longitudinal (Dl) and transverse (Dt) diffusion coefficients
have been calculated for C2H2F4 based gas mixtures containing 5% i-C4H10
and a small fraction of SF6 that varies between 0.0 - 0.5%.
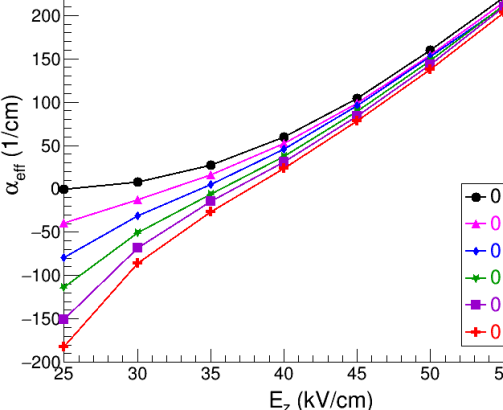
It can be seen from figure 2 that with the increase in applied field, the effective
Townsend coefficient increases signifying more ionizations and less attachment of electrons for any
given mixture. It reduces at a given field value when the amount of SF6 is increased in the
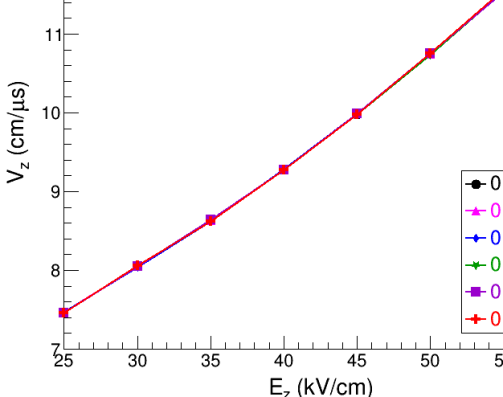
mixture for the obvious reason that SF6 has a great affinity of electrons. In figure 2,
the drift velocity of electrons increases with the field which makes the detector response faster.
However, there is no effect of changing SF6 fraction observed on this parameter.
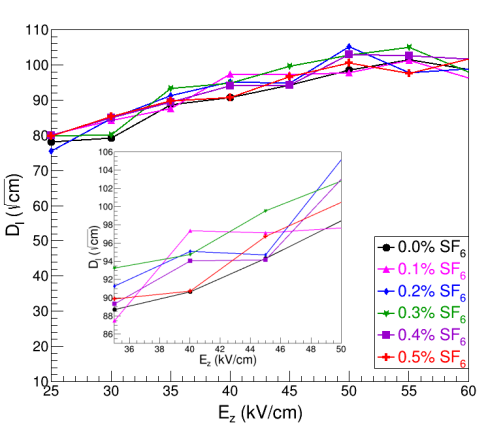
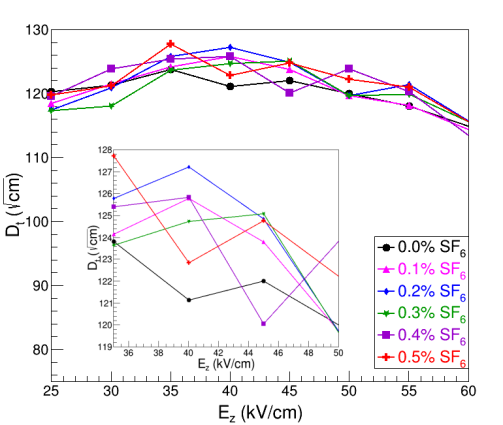
Figure 3 and 3 displays the variation of longitudinal and transverse
diffusion coefficients with the applied electric field. In case of longitudinal diffusion, a rising trend
in the coefficient with the increase in the field has been observed. On the other hand, the transverse
diffusion coefficient shows a rise upto a field value of about 40 kV/cm and a subsequent fall. The
variation of SF6 fraction in the gas mixture does not show any distinguishable effect
on any of the diffusion coefficients.
The signal induced on a RPC read-out strip has been calculated by passing muons of energy randomly
varying between 0.5 - 10 GeV through the detector in randomly varying directions restricting the
incidence angle () within 0∘ - 10∘. The movement of all the electrons
and ions created in the gas mixture through the avalanche process has been tracked by the
Garfield and the current induced on the read-out strip due to their movement has been calculated
at an interval of 100 ps.
A typical signal shape as found from numerical calculation is shown in figure 4.
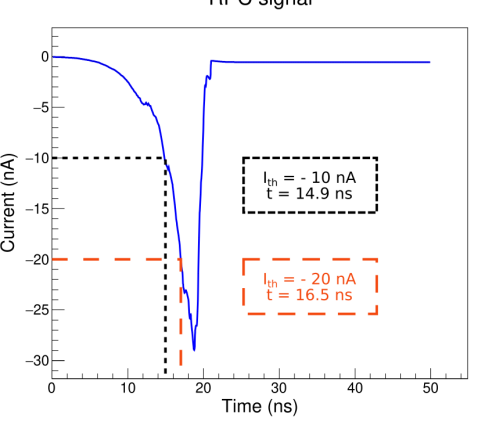
The experimentally obtained signal shapes generally appear with a long tail which is absent in the
simulated current signal. This can be attributed to the assumption of simplified ion movement
and non-inclusion of the effect of the electronics and the detector components outside the gas chamber.
The positive ions, having a larger mass and contributing to the slower falling edge, have been treated
as moving with a constant velocity and not contributing to the growth of avalanche.
The computed signal shapes have been analysed using Root data analysis framework [14]
to find the timing properties of the detector. A threshold in the current value has been used in the
simulation for eliminating the low amplitude noise signals as is usually done in experiments. The
selection of times corresponding to crossing two fixed values of current thresholds is indicated
in figure 4. The time corresponding to crossing a specific threshold
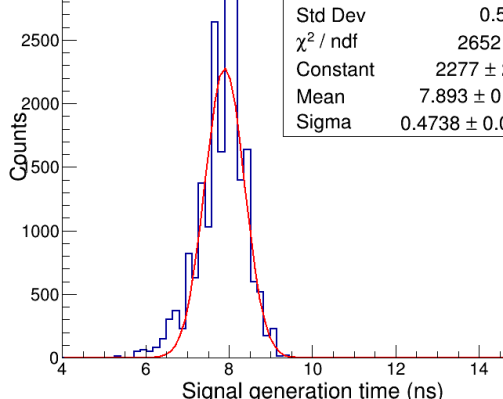
has been defined as the signal generation time. A distribution of the signal generation times has
been obtained for 2000 events where each event represents an averaging of current signals due to
passage of 10 muons of randomly varying energy and angle of incidence within the mentioned range. A typical
distribution of signal generation times, to cross a threshold of 10 nA current, is shown in
figure 4. The distribution has been fit with a Gaussian function to obtain the
average signal generation time and the intrinsic time resolution of the detector from its mean and
standard deviation, respectively.
The amplitude of the induced signals has been calculated for 2000 events (20000 muons with
randomly varying energy and direction as mentioned earlier). A distribution of signal amplitudes
has been thus obtained for each set of applied field and gas mixture.
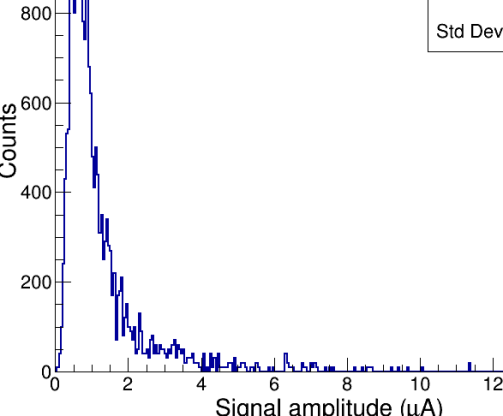
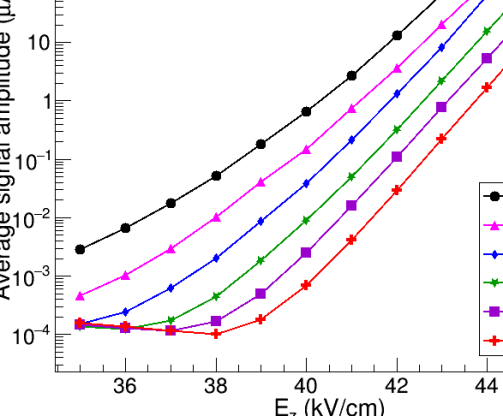
One of such distributions when the RPC has been operated at a field of 42 kV/cm and with a gas mixture of 94.8% C2H2F4, 5% i-C4H10 and 0.2% SF6 is shown in figure 5. The mean of the distribution, termed as average signal amplitude, has been used to denote the characteristic response at different operating conditions. To study the effect of the applied field and the SF6 content in the gas mixture on the detector efficiency, the average signal amplitudes have been calculated for different field values with a gas mixture of C2H2F4, 5% i-C4H10 and different percentages of SF6 varying from 0.0 to 0.5%. The average signal amplitude were found to increase at higher electric field and for lower SF6 in the gas mixture (figure 5). At higher fields the rise in the Townsend coefficient or the gain in kinetic energy of the electrons caused release of larger number of electrons through further ionization of the gaseous molecules that contributed to the rise in the induced current. On the other hand, the effect of addition of a trace amount of highly electronegative SF6 in the gas mixture caused a reduction in the signal amplitude owing to attachment of electrons with the SF6 molecules. Addition of SF6 to the gas mixture is necessary to restrict streamer generation which may deteriorate the detector performance. The detector efficiency has been calculated by finding out the fraction of events which has been able to generate a signal amplitude more than a specified threshold.
3 Comparison of numerical and experimental data
Experimental results for variation of the timing parameters with the fraction of SF6 for a glass RPC of size 2 m 2 m is available in [3]. Numerical calculations have been done for the same prototype operated with the same gas mixtures (C2H2F4, 4.5% i-C4H10 and SF6) with smaller lateral dimension (16 cm 16 cm) using the dielectric constant of Asahi glass [15] for the field calculation. The average signal generation time and intrinsic time resolution of the RPC have been calculated at different applied fields.
The variation of the two parameters, calculated for 2 A threshold (corresponding voltage
threshold = 10 mV), with the applied field is shown in figure 6
for different gas mixtures containing different fractions of SF6 along with C2H2F4
and 4.5% i-C4H10.
In the experiments [3], both the timing parameters were found
to deteriorate with the increase in SF6 fraction in the gas mixture. The variation of the two
timing parameters with the fraction of SF6 has been found out from the numerical data at
Ez = 45 kV/cm, and compared with the experimental result in figure 7.
For the comparison, the simulated values of arrival time have been
incremented by 47.85 ns, as a contribution from the delay introduced by the electronic modules and
wires in the experiment. Similarly, a value of 1.33 ns has been added in quadrature to the simulated
values of time resolution to take care of the jitters introduced by the related components. These
two values are chosen arbitrarily to obtain the best match between the two curves.
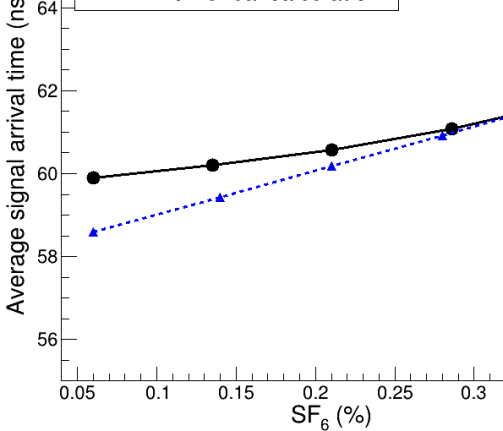
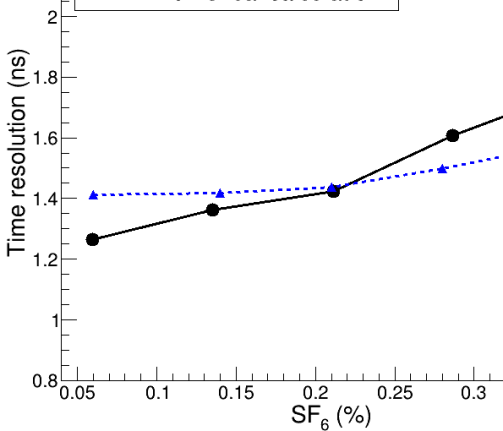
The mismatch of arrival times for lower SF6 fractions in the gas mixture (figure 7) can be attributed to the space charge generated within RPC in the experiment which slows it down by reducing the local electric field. No such effect is present in the simulation and thus is expected to produce a smaller value of signal arrival time compared to the experiment. Smaller the fraction of SF6 in the gas mixture larger is the charge production giving rise to more difference between the two curves. Although both simulation and experiment showed that the time resolution worsens with the increase in SF6 fraction (figure 7), the two curves were found to differ slightly in their nature.
4 Numerical results
4.1 Effect of operational parameters
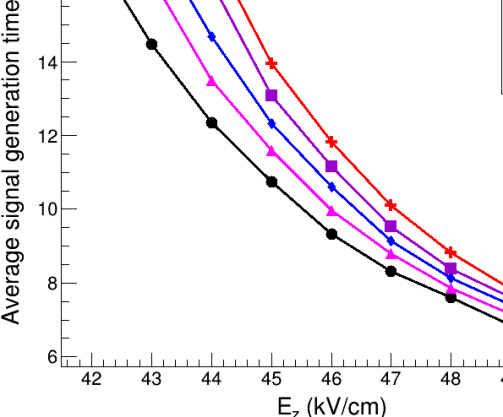
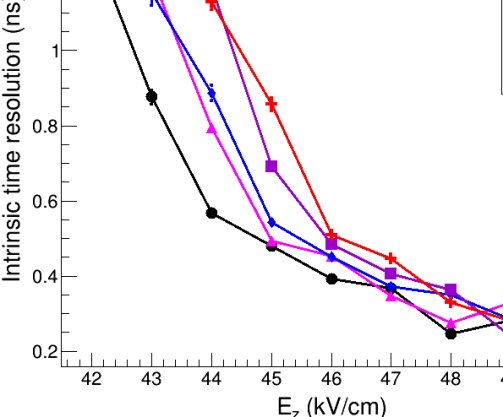
Figure 8 shows the variation of average signal generation time and intrinsic time resolution of a bakelite RPC with the applied field when the RPC is operated with gas mixtures containing different fractions of SF6 along with C2H2F4 and 5% i-C4H10.
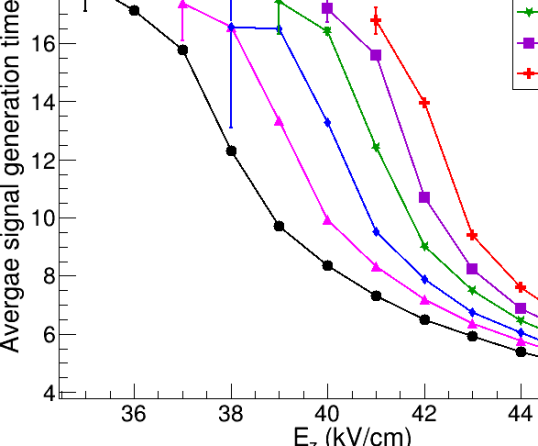
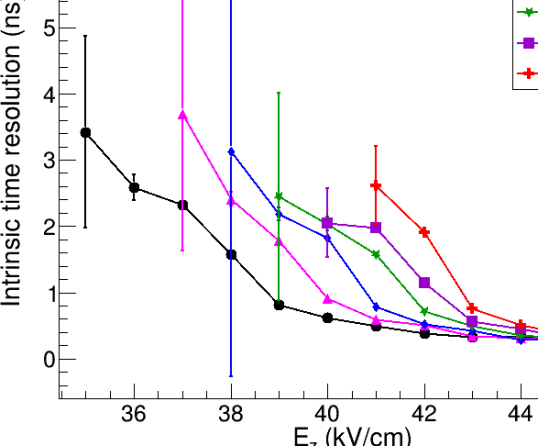
The curves have been obtained by setting a threshold of 10 nA. Values of both the timing parameters have been found to decrease at higher fields implying a better timing performance of the detector. At higher values of field avalanche multiplication is larger which produces the detectable signal earlier and in turn reduces the average signal generation time; the increase of both the effective Townsend coefficient and drift velocity of electrons at higher field region (refer to figure 2) is responsible for the improvement of the time resolution according to the analytic formula described in [16]. The effect of SF6 on the timing properties is also evident from figure 8. The timing performance deteriorates for the gas mixtures containing higher fraction of SF6. The difference in the values for the two timing parameters for different gas mixtures is prominent at lower field values which diminishes at higher values of the field.
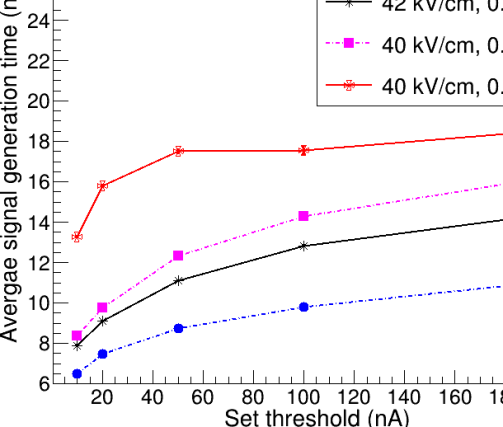
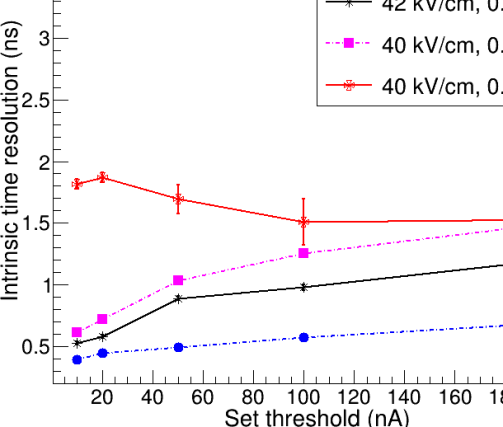
The value of the timing parameters has been found to depend on the used threshold also.
Variation of the two timing parameters with the used threshold has been shown in figure 9
for two different fields and gas mixtures containing different fractions
of SF6. Again in this case, the dependence of the timing parameters on the used threshold
has been found to be more prominent for lower field values and with higher fraction of SF6
in the gas mixture.
The variation of the detector efficiency with the applied field for different fractions of SF6 in
the gas mixture is shown in figure 10 for crossing
a threshold of 10 nA .
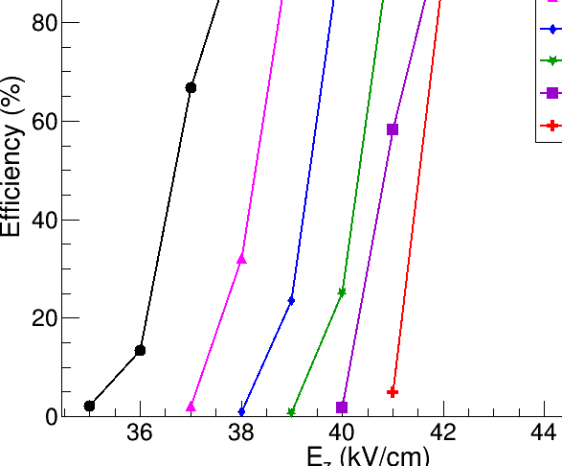
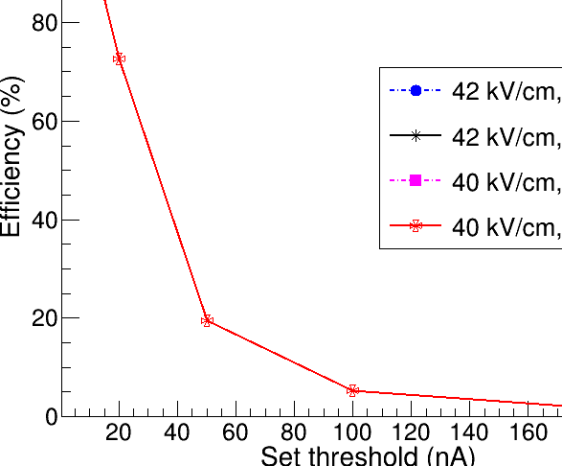
The efficiency increased with the applied field and reached a plateau (100% efficiency) after a while. For higher fraction of SF6 in the gas mixture, a comparatively higher value of field is required to reach the plateau region. The effect of used set threshold on the detector efficiency can be found out from figure 10 where variation of detector efficiency with the used threshold has been shown for two different field values and two different fractions of SF6 in the gas mixture. For lower values of field and moderate amount of SF6, the detector efficiency has been found to get reduced at higher threshold values as some of the events could not produce signals crossing the set threshold. For higher field values and without inclusion of SF6 the signal production is very efficient and the highest efficiency is achievable even when using a very high threshold ( 200 nA). In experiments, a minimum field (or applied voltage) is required to have a signal amplitude crossing the discriminator threshold and producing a non-zero efficiency, which increases with the increase in the SF6 fraction in the gas mixture.
4.2 Effect of geometrical parameters
Due to the distorted field map near the edge, and button spacers [11] of the RPC, the transport properties of the electrons are different at those regions which in turn influences the signal generation and timing properties of the detector at those regions. Muons of varying energy and direction have been passed through the RPC at different distances from the edge spacer and button spacer of the typical shape to find their effect on the timing properties. The variation of average signal generation time and the intrinsic time resolution at different distances from the edge spacer is shown in figure 11 for the application of two
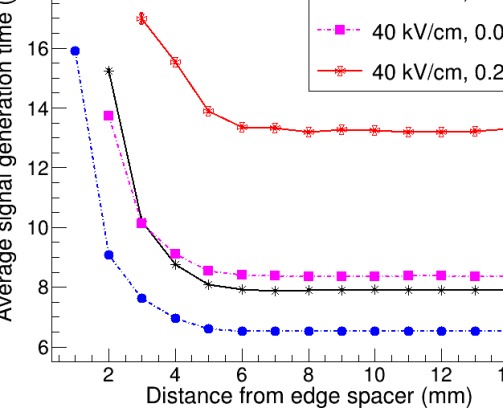
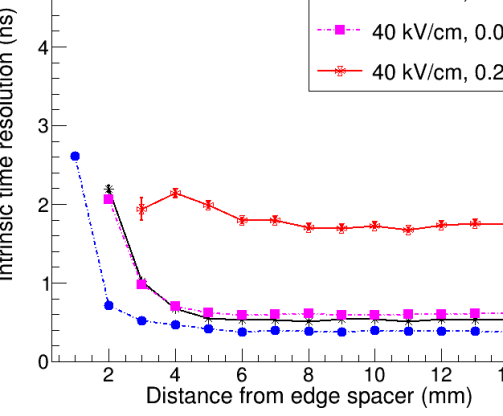
different fields and for gas mixtures containing two different fractions of SF6 with 5% i-C4H10
and rest C2H2F4.
presence of large errors on the data points close to the edge and button spacers are due to less
statistics as the signals from those regions are of less amplitude and very few of them are able to cross
the set threshold.
It is evident from figure 11 that the timing properties deteriorate
very near to the edge spacer and the effect extends upto 5 mm from it.
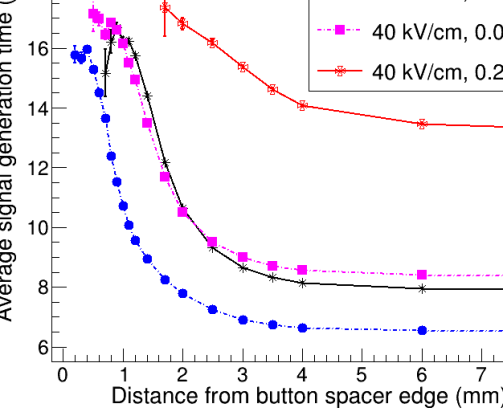
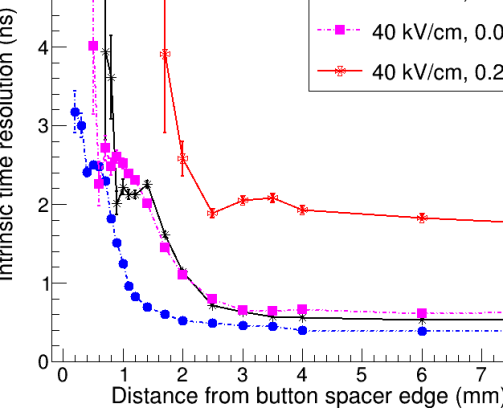
The variation of the same at different distances away from a button spacer is shown in
figure 12.
The button has a groove like structure, where the electric field is highly non-uniform and its value
changes rapidly at the points within this non-uniform region [11]. This gives rise to a
non-monotonic variation of the timing parameters in its close vicinity.
From the figures 9, 11 and 12 it can be concluded that
lower field and higher amount of SF6 in the gas mixture worsen its timing performance.
The detector efficiency has been calculated at different distances away from the edge and button
spacer of RPC by passing muons through those locations. The variation of efficiency with the
distance from the edge spacer is shown in figure 13 for two different
field values and different fractions of SF6 in the gas mixture.
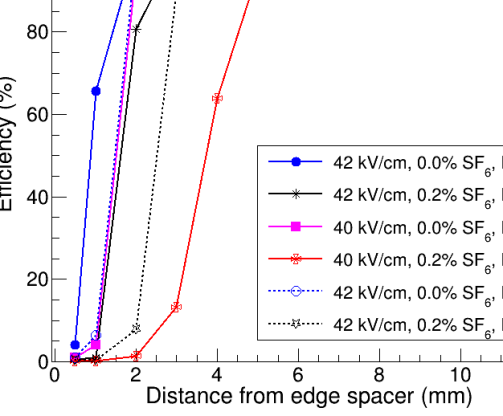
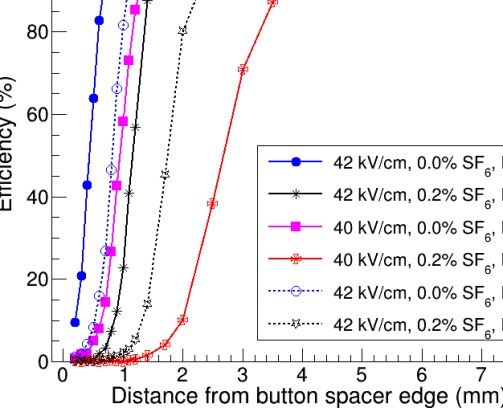
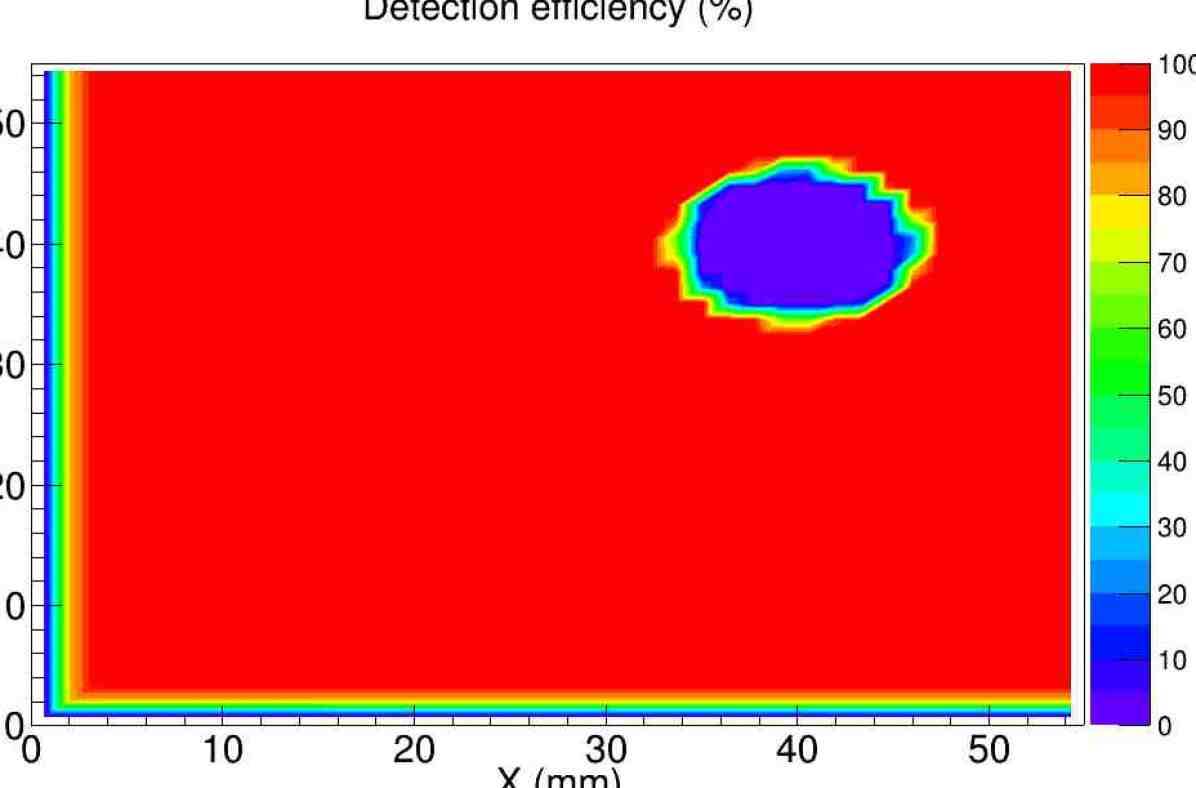
The results obtained using a threshold of 10 nA are shown in solid lines whereas that using a threshold of 50 nA are shown in dotted lines in the same figure. For a fixed threshold, presence of higher amount of SF6 in the gas mixture reduces the signal amplitude. Also operating the detector at lower field value has the same effect. These in turn produces a lower detection efficiency. Raising the value of used threshold decreases the number of events able to cross the threshold and in turn reduces the efficiency which is also visible in figure 13 for two different combinations of field and gas mixture. The electric field suffers near the spacers which is the reason for lower signal production in their vicinity. The variation of the detector efficiency with the distance from button spacer edge is shown in figure 13 where a similar trend can be seen. The extent of the inefficient regions depend on the choice of applied field, used gas mixture and the set threshold. For the operation of the detector at 42 kV/cm with 0.2% SF6, the inefficient region extends upto 3 mm from the edge spacer and about 1.75 mm from the button spacer if the used threshold is 10 nA. The inefficient region increases at higher threshold. A surface map of the detector efficiency in X-Y plane of an RPC with all its components is shown in figure 14 where and lines are the boundaries between the gas chamber and the edge spacers. The map is generated for the RPC operated at 42 kV/cm with the gas mixture containing 0.2% SF6 and for the threshold of 10 nA.
5 Computing resources
The calculations using Garfield have been performed in DELL PowerEdge R930 server having 256 GB RAM, 64 cores, 2.2 GHz CPU running CentOS 7.5. For fixed operating conditions, calculation of signals for the passage of 20000 muons, using field maps pre-calculated in neBEM and gas files prepared by Magboltz stand alone separately, takes 1 day 5 hours to complete.
6 Conclusion
The amplitude of the RPC signal increases with the increase in the applied voltage which in turn
improves the efficiency of the detector.
An RPC becomes faster with the increase in applied field (or voltage) and the time resolution also
improves. However, raising the field to a very high value increases streamer probability [19]
which is known to affect the RPC timing performance adversely.
The electron quenching role of SF6 is evident from the simulated results.
Although a certain amount of SF6 is used to limit the streamer generation, the increase of
SF6 proportion in the gas mixture deteriorates the timing performance of the detector.
So, to achieve the best timing performance in the avalanche mode operation with limited streamer
contribution, a RPC is required to be operated at an optimum voltage along with an optimum
amount of SF6 whose amount need to be chosen judiciously depending on the requirements
of the experiment.
The simulation predicts that the response of RPC at critical regions like very near to edge and button
spacers gets altered due to the affected field map [11] at those regions. The timing response
also gets affected adversely in those regions. The effect of these geometrical components vanish
by about 7 mm away from edge spacers and about 5 mm away from the edge of the button spacers.
So, the effective volume of RPC producing uniform response will be little less than the geometrical
volume of its gas chamber. The detection efficiency also gets hampered near the spacers which in turn
is expected to produce dead regions.
The present robust simulation method can be used to find the timing performance of other gaseous
detectors also, as well as their dependence on various operating and design parameters.
Acknowledgment
The financial support and the helpful review received from INO collaboration is gratefully acknowledged. A. Jash is grateful to Mr. Sridhar Tripathy and Mr. Jaydeep Datta for their help and cooperation during this work.
References
- [1] R. Santonico and R. Cardarelli, Development of resistive plate counters, Nucl. Instrum. Meth. A, 187 (1981) 377.
- [2] ICAL collaboration, Physics Potential of the ICAL detector at the India-based Neutrino Observatory (INO), Pramana, 88 (2017) 79 [arXiv:1505.07380].
- [3] M. Bhuyan et al., Development of 2 m 2 m size glass RPCs for INO, Nucl. Instrum. Meth. A, 661 (2012) S64.
- [4] W. Shockley, Currents to conductors induced by a moving point charge, J. of Appl. Phys., 9 (1938) 635.
- [5] S. Ramo, Currents induced by electron motion, Proc. IRE, 27 (1939) 584.
- [6] R. Veenhoff, GARFIELD, recent developments, Nucl. Instrum. Meth. A, 419 (1998) 726 [http://garfield.web.cern.ch/garfield].
- [7] I.B. Smirnov, Modeling of ionization produced by fast charged particles in gases, Nucl. Instrum. Meth. A, 554 (2005) 474 [https://heed.web.cern.ch/heed/].
- [8] N. Majumdar and S. Mukhopadhyay, Simulation of 3D electrostatic configuration in gaseous detectors, JINST, 2 (2007) P09006 [http://nebem.web.cern.ch/nebem/].
- [9] S.F. Biagi, Accurate solution of the Boltzmann transport equation, Nucl. Instrum. Meth. A, 273 (1988) 533 [http://magboltz.web.cern.ch/magboltz/].
- [10] COMSOL Multiphysics® - multiphysics simulation tool, available at www.comsol.com.
- [11] A. Jash, N. Majumdar, S. Mukhopadhyay and S. Chattopadhyay, Numerical studies on electrostatic field configuration of Resistive Plate Chambers for the INO-ICAL experiment, JINST, 10 (2015) P11009.
- [12] W. Riegler, Induced signals in resistive plate chambers, Nucl. Instrum. Meth. A, 491 (2002) 258.
- [13] C. Lippmann and W. Riegler, Space charge effects in Resistive Plate Chambers, Nucl. Instrum. Meth. A, 517 (2004) 54.
- [14] R. Brun and F. Rademakers, ROOT - An object oriented data analysis framework, Nucl. Instrum. Meth. A, 389 (1997) 81 [https://root.cern.ch/].
- [15] K. Raveendrababu, P. K. Behera, B. Satyanarayana, J. Sadiq, Study of glass properties as electrode for RPC, JINST, 11 (2016) C07007 [arXiv:1605.01044].
- [16] W. Riegler and C. Lippmann, Detailed models for timing and efficiency in resistive plate chambers, Nucl. Instrum Meth. A, 508 (2003) 14.
- [17] M. Bhuyan et al., Cosmic ray test of INO RPC stack, Figure 9, Nucl. Instrum. Meth. A, 661 (2012) S68.
- [18] A. D. Bhatt, V. M. Datar, G. Majumdar, N. K. Mondal, Pathaleswar and B. Satyanarayana, Improvement of time measurement with the INO-ICAL resistive plate chambers, Figure 1(a,b), JINST, 11 (2016) C11001.
- [19] R. Cardarelli, V. Makeev, R. Santonico, Avalanche and streamer mode operation of resistive plate chambers, Figure 4, Nucl. Instrum. Meth. A, 382 (1996) 470.