Chiral QCD phase in equilibrium with Hadron Gas
and the location of the critical point
Abstract
We develop a description of the equation of state of QCD matter with restored chiral symmetry, which is in thermal and chemical equilibrium with the hadronic phase. The hadron gas is described with thermodynamically consistent volume corrections. The chiral phase is composed of a set of few quark condensates, each of which corresponds to a family of hadrons with specific quark content. On the boundary between the two phases we apply the requirement of conservation of particle numbers per family. We use lattice calculations for temperatures below the transition curve to determine hadronic volumes. We find that the pion system plays decisive role in the shift of the transition from higher order (crossover) to first order. For four volume models we calculate the location of the critical point as function of critical temperature at vanishing baryon density. Particularly, if we additionally impose the equality between the densities of quarks contained in mesons and baryons, we find a critical point residing in the interval of baryon chemical potential 233-267 MeV and of temperature 153-158 MeV.
Keywords: QCD critical point, Hadron gas, chiral phase
1 Introduction
The QCD phase diagram is a subject of intense research during the last years. This phase diagram describes the transition to hadronic matter at lower temperatures, a phase with equation of state (EoS) well described by different versions of the Hadron Gas (HG) model [1]. However, knowledge of the EoS of the phase at higher temperatures is accessible only through lattice calculations that are limited mainly to the zero baryon density regime [2]. The ideal quark-gluon plasma can, only, be reached at extremely high temperatures. The region which resides at temperatures higher than those determining the boundaries of the hadronic phase, is proposed to be associated with several exotic phases, like chiral-density waves, crystalline colour superconductivity, gluonic phase and quarkyonic matter [3]. The knowledge about this region is still developing and our work aims at this direction. We will focus on describing a model for the EoS at the high temperature region just above the transition to HG curve. The derivation of our model is based on a few useful, to our opinion, observations which are listed in the following:
-
(a)
The chiral condensate, which acts as the order parameter of the chiral restoration, changes rather sharp with temperature. On the contrary deconfinement, connected with the renormalized Polyakov loop, needs a wider temperature interval to be completed [4]. This suggests that chiral restoration can be completed well before quarks are “dissolved” to independent entities 111Our argument rests on the width of the deconfinement transition not on the mean temperature of its occurrence. Indeed the mean temperature of the deconfinement and chiral transition can be the same [5], whereas the gradual nature of the deconfinement transition can have the effect that it is extended for a considerable temperature interval above the mean temperature. This temperature interval, which is due to the system’s finite size, may allow for the organization of the quarks in hadron-like particles..
-
(b)
In [6] an equivalent description of the Lattice results at vanishing baryonic density has been carried out, using one particle states with mass and number of states calculated from the fit to these results. It was found that the quark-gluon interacting system, when crossing the critical temperature , exhibits an abrupt decrease in the number of states and, also, in the respective mass. Moreover, the minimum value of the degeneracy factor, reached just above , cannot be attributed to deconfined quark degrees of freedom, thus, leading to the conclusion that these states should be still quark condensates. Based on this observation, as well as the previous one (a), we will adopt in the present work the viewpoint that the quarks remain confined in hadronic type condensates even at temperatures above the QCD transition line.
-
(c)
In [7] a model has been developed which simulates the parity doubling of the nucleon. In this model chiral symmetry and an explicit mass term for the nucleon can coexist without contradiction. The nucleon has a partner of opposite parity. These particles have different masses in the broken symmetry phase (HG). However in the restored chiral phase these masses become degenerate. In [8], with the use of lattice simulations, a similar behaviour is found for opposite parity pairs of , and baryons.
-
(d)
One of the proposed exotic phases, situated at high density and relatively low temperatures is the quarkyonic phase, which is valid for a system with a large number of colours [9]. In the quarkyonic matter there are quarks forming a Fermi sea, but, also, baryons which occupy a Fermi surface. These baryonic particles are connected with phenomena like superconductivity and superfluidity. Likewise, here we assume that hadronic states can exist at densities and temperatures higher than those characterizing the hadronic phase.
-
(e)
Finally an important issue, which arises when considering the crossing of a transition curve to enter the HG phase from a higher temperature phase, is the conservation of quantum numbers (baryon number, strangeness, charge, etc.) which are carried by the quarks. This conservation is a necessary constraint additional to the continuity of chemical potentials and pressure [10], assuming thermal and chemical equilibrium between the two phases. However, these constraints alone are insufficient to determine how a certain number of quarks above the transition curve can be grouped to form certain number of hadrons below this curve. For example, the conservation of the net baryonic density , cannot insure the continuity of the multiplicities of proton and antiprotons separately. The latter can be explained by the sudden appearance or vanishing of quark-antiquark pairs upon crossing the transition line which change the number of quarks and antiquarks without altering the net baryon density. However, such a scenario should be excluded in the case of a smooth crossover.
Having presented the key observations which inspire our approach, we now proceed to suggest our working hypothesis in this paper:
A result of the partial chiral restoration is that the resonances with different masses and the same quark content, occurring below the critical temperature, become quasi-particle states (condensates), which are degenerate in mass, above the critical temperature.
The emerging picture we adopt is that the quark masses are reduced with the increase of temperature, while they are still interacting to form “hadronic-like” particles. This leads to an equivalent reformulation of the above hypothesis: All the resonances with the same quark content at lower temperatures originate from the same quasi-particle state at higher temperatures. As a consequence, since chiral symmetry breaking causes increase in the mass, we cannot allow the mass of a “hadronic- like” quasi-particle in the chiral phase to be greater than the mass of the lightest hadron in the broken symmetry phase. With this hypothesis we are able to solve the issue raised in remark (e) in a seamless way.
Another important point we are confronted with in this work is the fact that the exact position of the critical point depends crucially on the size of the hadronic volumes which encode the repulsive part of the strong interaction. To handle this uncertainty we estimate the hadronic volumes by fitting the Hadron Gas model with volume corrections for temperatures lower than the critical temperature to the lattice pressure with (2+1) flavours for zero [2] or finite [11] baryon-chemical potential . These, lattice QCD based, hadron volume determinations, together with the hypothesis of mass degeneration presented in the previous paragraph, constitute the backbone of the model we employ here to explore the QCD phase diagram region close to the boundary of the HG phase.
The structure of the following part of our paper is as follows. In section 2 we present in more detail the main ideas of our model. In section 3 we use them to propose a procedure for the determination of the critical point. In section 4 we investigate the effect on HG of volumes depending on temperature or chemical potentials and present results for hadron volumes calculated from fits to the lattice-pressure at zero baryon-density. In section 5 we use the results of sections 2, 3 and 4 to propose four different models for the description of the volume corrections leading to the determination of the critical point location in terms of (critical temperature at zero baryonic density). The first model assumes a common radius for all hadrons which is independent from temperature and chemical potential. The second model assumes a common hadronic radius for all species which is varying with temperature. The third model assumes different hadronic radius for mesons which vary with temperature and for baryons which vary with baryon-chemical potential. The fourth model utilises again a common hadron radius which depends simultaneously on both temperature and baryon-chemical potential. In section 6 we investigate an additional condition for the determination of the critical point which ensures equality of the density of the quarks which are enclosed in mesons and baryons of the hadron gas. Finally, in section 7 we summarise our findings and record our concluding remarks.
2 Modelling the hadron-quark condensate transition
The HG phase, in its simplest form, can be described as point particles in the Boltzmann approximation with total particle density:
| (1) |
where is the fugacity corresponding to a specific group of hadrons that have the same quark content and which will be called as “family”. Also, if the particles of the family carry baryon number equal to , strangeness equal to and electric charge equal to . The index runs over all resonances of the family. Since runs over particles and antiparticles, is the degeneracy factor due only to the spin of the particle and is the respective mass. Equation (1) easily shows that the HG partition function is a sum of terms, each of which corresponds to a specific fugacity.
Next we turn to the description of the QCD phase at temperatures just above the transition curve. In this phase the constituent quark masses are reduced due to the partial chiral restoration and in effect the mass of the corresponding quasi-particle is also reduced. Therefore, we shall call this phase in the following as “chiral” phase. We will, also, use the “tilde” () symbol to denote all quantities associated with this phase. We consider it to be a sum of quark condensates which represent quasi-particles carrying fugacities and degeneracy factors , where the index “i” runs over the families. Then the total particle density in the Boltzmann approximation for the chiral phase reads:
| (2) |
If the condensates in the chiral phase have the same quark content as the particles of the HG phase, then the particle number conservation at an arbitrary point of the transition curve is converted to the conservation of the number of particles per family. For existing families in the HG, this accounts to equations, each denoted by the index , of the form:
| (3) |
where is the system volume in the HG (chiral) phase. Due to continuity criteria, in the crossover , while in the 1st order region . In order to fulfil eqs. (3), we allow the masses in the chiral phase to be functions of temperature, . In principle, the equations in (3), since they do not depend on the fugacities, can be fulfilled at any point of a transition curve which may depend on fugacities.
Since chiral restoration is associated with the reduction of the quark masses, we expect the quasi-particle, which contains the relevant quarks, to reduce its mass. So we can associate the chiral state of each family with the ground mass state of the HG phase. This HG state will attribute the degeneracy factor to the respective chiral phase state. However, one can easily see that eqs. (3) are impossible to be fulfilled if since the sum of several positive terms cannot be equal to the first term only. To overcome this inconsistency one should require:
| (4) |
Then, eqs. (3) could in principle be fulfilled, since the functions are sensitive enough increasing exponentially with decreasing . The constraint (4) has a straightforward physical interpretation: the quasi-particle existing in the chiral restored phase will produce in the chiral broken (HG) phase, among other resonances, the ground state particle with the minimum mass among all resonances, . Since the breaking of chiral symmetry increases mass, the chiral mass cannot be greater than . So, we will set as the upper limit for the masses the respective mass of the lightest hadron in the family.
It can be checked that for some families eqs. (3) cannot be fulfilled for any value of mass in the range of relation (4). This fact forces us to turn to a more realistic description of the HG phase. We have to take into account the hadron volume corrections which will effectively reduce all the particle number densities. For consistency reasons we will, also, use the correct quantum statistics (Bose-Einstein or Fermi-Dirac). The volume corrections in the HG have been accounted for in a thermodynamically consistent way which avoids negative contributions to the system volume [17]. The partial pressure of a point particle belonging to the family using the correct quantum statistics is given by:
| (5) |
| (6) |
where () for bosons (fermions). If each particle carries volume , then the total HG pressure can be calculated from the partial pressures of the point particles. The relevant chemical potentials have to be replaced by the chemical potentials [17]:
| (7) |
| (8) |
Eq. (7) has to be solved numerically for the system pressure . The density for point particles in the Bose/Fermi statistics reads:
| (9) |
Then we can proceed with the calculation of the particle densities with volume corrections:
| (10) |
where the volume of the particle is connected to the corresponding radius [17] through:
| (11) |
With the use of the volume corrections and the Bose/Fermi statistics, eqs. (3), for the equality of particle densities between the HG and the chiral phase, are replaced by:
| (12) |
The fugacities in the densities do not factorize when the Bose/Fermi statistics are used. As a consequence, in eq. (12) the chiral states carry mass which is different between particles and antiparticles. This dependence, which will be denoted as , is not surprising since we are considering matter at positive baryon densities, and we are allowing the masses of baryons and antibaryons to change. Also, while in the Boltzmann approximation particles and antiparticles can be grouped together in the same family, in the Bose/Fermi statistics the particles have to form separate family from the respective antiparticles. However, as it will become evident in the next section, the mass difference between particles and antiparticles is low.
In the treatment of two QCD phases in equilibrium it is usual to apply the condition of the conservation of quantum numbers carried by the quarks [10]. Here we impose the more strict condition of the equality of the particle numbers per family. We assume that quarks have already been grouped in condensates at the chiral phase near the transition curve, which, after chiral breaking, evolve to the hadronic spectrum of the specific family. The conservation of these particle numbers automatically insures the conservation of quantum numbers, e.g. for the baryon-number :
| (13) |
where equals to the baryon-number carried in the particles of the family, common to both the HG and the chiral phase and refers to the particle number density.
To complete the set of requirements for equilibrium between the two phases we have to demand for the equality of pressures. In the chiral phase, apart from the quark condensates which contribute partial pressure , also the gluons show considerable pressure, , for [18, 19]. Thus:
| (14) |
| Ground | ||||||||
| Sym- | Name | Quark Content | Mass | |||||
| bol | State | (MeV) | ||||||
| 1 | L.U.M., | 138,03941 | 3 | 1 | -1 | |||
| (flavour- | ||||||||
| antisymmetric) | ||||||||
| 2a | L.U.M., | 547,862 | 1 | 1 | -1 | |||
| (flavour-symmetric, | ||||||||
| no -quark) | ||||||||
| 2b | L.U.M., | 957,78 | 1 | 1 | -1 | |||
| (flavour-symmetric, | ||||||||
| with -quark) | ||||||||
| 3 | Baryons | 938,918747 | 4 | +1 | ||||
| () | ||||||||
| -3 | Antibaryons | 938,918747 | 4 | +1 | ||||
| () | ||||||||
| 4 | Baryons | 1232 | 16 | +1 | ||||
| () | (flavour-symmetric) | |||||||
| -4 | Antibaryons | 1232 | 16 | +1 | ||||
| () | (flavour-symmetric) | |||||||
| 5 | Strange Mesons | 495,644 | 2 | -1 | ||||
| -5 | Antistrange | 495,644 | 2 | -1 | ||||
| Mesons | ||||||||
| 6 | Baryons | 1115,683 | 2 | +1 | ||||
| () | ||||||||
| -6 | Antibaryons | 1115,683 | 2 | +1 | ||||
| () | ||||||||
| 7 | Baryons | 1193,154 | 6 | +1 | ||||
| () | ||||||||
| -7 | Antibaryons | 1193,154 | 6 | +1 | ||||
| () | ||||||||
| 8 | Baryons | 1318,285 | 4 | +1 | ||||
| -8 | Antibaryons | 1318,285 | 4 | +1 | ||||
| 9 | Baryons | 1672,45 | 4 | +1 | ||||
| -9 | Antibaryons | 1672,45 | 4 | +1 |
where accounts for the possible influence of the vacuum. Eqs. (12), (14) constitute the minimum requirements for two phases in equilibrium. Since the two phases are described by different partition functions, continuation of first and higher order derivatives cannot be fulfilled by these equations alone. We use, though, these equations assuming that the region for the transition between the HG states and the chiral states is small. This allows to consider the transition curve of the phase diagram as points of equilibrium between the HG and chiral phases. Indeed, in a more complete description the quantities and should be taken into account. Also, smoothing functions, like in [20], would have to be introduced in the crossover region to ensure continuation of the first and higher order derivatives. However, this procedure would increase the free parameters of the model in cost of physical insight.
To complete this section we refer to the families where we have grouped the hadronic particles. Related information is given in Table 1. The used states are the ones listed in the summary table of “Particle Data Group” [22]222We include all particle states containing only , and quarks.. For simplicity we have neglected the dependence of the particles on the electric charge (). For this reason, when the lightest HG states in a family are nearly degenerate we consider as lowest mass their average value (e.g. ). Notice that some information for the lowest mass states presented in Table 1 have been taken from the Quark Model classification scheme in [21] (see the relevant review “Quark Model” therein).
In family 2a, we, also, omit the state. In the previous publications of Particle Data Group it was listed as particle with mass MeV. This particle is considered to be a two-pion state [23]. For this reason we omit it from the HG spectrum. There is not enough information of how to distribute the Light Unflavoured Mesons (L.U.M.) with Isotopic Spin among families 2a and 2b. For this reason we consider the conservation of the inclusive particle numbers of both families, according to the formula:
| (15) |
Last equation does not contain enough information for fixing both chiral masses. For this reason we assume the ratio of the chiral masses to be equal to the respective ratio of the lowest mass HG states:
| (16) |
This particular choice influences only the calculations concerning families 2a and 2b. In the following we shall consider families 2a and 2b as a common family 2. An additional comment is here in order: for the family only two states are known, the , which is considered as the ground state, the and the . Thus, there are probably missing states in this family and this may influence family specific properties. In order to reduce the impact of this missing information in our analysis we will occasionally neglect the, anyway very small, contribution of this family (as well as ), when referring to family specific results.
3 A Procedure to locate the Critical Point
We first need a transition curve upon which we shall impose the equality of particle multiplicities of the two phases in equilibrium. Lattice results for the QCD pressure do not fix the transition temperature at zero baryon-chemical potential. A lowest value of 154 MeV is suggested by [2]. A chemical freeze-out curve evaluated from heavy-ion collisions is suggested to end at at a temperature 166 MeV in [24]. It is natural to assume that the HG state (in which the hadron particles exist) cannot be retained in higher temperatures than , thus
| (17) |
On the other hand the results in [2] and [24] obey which can be compatible with the relation (17) only if
| (18) |
In fact such a condition is also compatible with the analysis presented in [33] ( MeV) and [25] ( MeV), which suggest that the critical QCD temperature and the freeze-out temperature at zero baryon-chemical potential are very close, if not identical. We will adopt this scenario in the following, assuming that the chemical freeze-out curve [24] coincides with the chiral transition curve. This curve is parametrised [24] as:
| (19) |
with and measured in MeV. Here, we will use a more general parametrization of (19) in order to implement the fact that is not uniquely defined and to fulfil
| (20) |
This parametrization is valid in the interval (154-166) MeV and it leads to the freeze-out curve of [24] for 166 MeV. The curves of eq. (20) approach the curve in [24] at high values of baryon-chemical potential, while they differ from it at low values of baryon-chemical potential (each approaches a different value of at zero density). In that sense, remains in eq. (20) a free parameter. Upon this curve we shall apply the conservation of particle numbers between the HG and the chiral phase. In fact, any choice for a transition curve is able to accommodate the constraints of particle conservation. However, the numerical results for the densities and chiral masses will depend on the particular choice.
We, also, impose the strangeness neutrality
| (21) |
Equations (20), (21) can be solved for a given value of and so the thermodynamic parameters of temperature and strange quark chemical potential can be expressed as a function of the baryon chemical potential , , . Following this procedure, in the next equations of this section there will be no explicit dependence on the parameters and .
We will now investigate whether solutions of eqs. (12) for given values of exist. In the crossover region, the equality of volumes, , leads to the equality of densities for the family:
| (22) |
where we have written the HG particle density with volume corrections as the product of the corresponding point particle density times a volume correction factor :
| (23) |
which represents the ratio of the density with volume corrections of the family to the corresponding density for point particles at specific conditions.
Eq. (22) should hold in the crossover region and, according to eq. (4), it can be fulfilled as long as the chiral mass for each family is less than the maximum allowed value. So the limit of the crossover region (critical point) is reached if for some family :
| (24) |
When last equation holds, then the right hand side of eq. (22) becomes:
| (25) |
Here as we define the ratio of the density of the least mass particle to the density of the whole family for specific conditions. The nominator of this ratio equals the minimum allowed density at the chiral phase at these conditions, which is achieved for the maximum allowed mass. With this definition we are led to
| (26) |
i.e. the critical point is reached at the conditions where the density of a family (with volume corrections) becomes equal to the density of the point particle of the family with least mass.
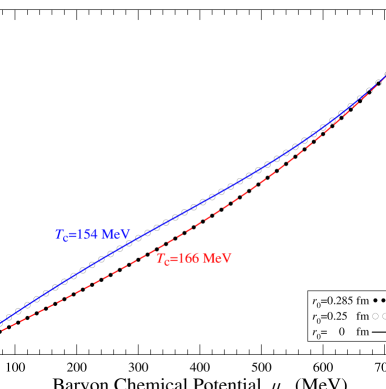
The quantities and in the above equation, also, depend on which is calculated by solving eq. (21). Actually, is almost independent of the particle volumes in the Bose/Fermi statistics, while is completely independent in the Boltzmann approximation, since in this case the strangeness neutrality condition reduces to . To show that this dependence is negligible we depict in Fig. 1 the solution for the strange quark chemical potential for the point particle case (), as well as, for different values of the hadron radius and we observe that the results almost coincide. We present calculations for a high and a low value of .
The only dependence of ratios on particle volumes comes through . In turn, we have shown that weakly depends on particle volumes. Thus, we can draw our conclusions using calculated for the case. The we have defined, carry, then, almost all the dependence on the particle volumes corrections. Also, these volume correction factors are practically the same for all families, provided that the same radius is used for all hadrons. This property, which is ap-
(i)
(ii)
proximate in the Bose/Fermi statistics, holds exactly in the Boltzmann description. Indeed, for equal hadron volumes, , eq. (23) reduces to:
| (27) |
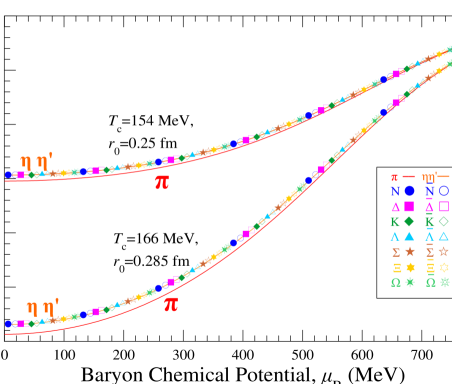
To verify that the dependence of the correction factor on the family is weak, we plot in Fig. 2 the factor in the Bose/Fermi statistics for the different families and for two hadron volumes (which correspond to the radii fm and fm respectively). It is evident from the graph that the values of this ratio are very close for all the families. We have to point out, though, that if different radii are used for different families, then the corresponding factors will differ.
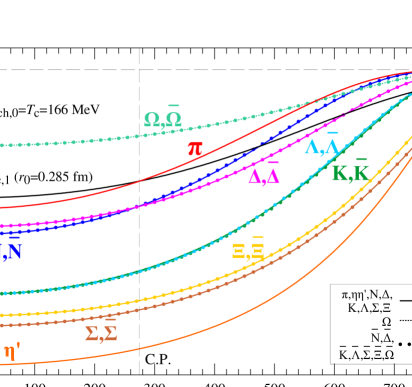
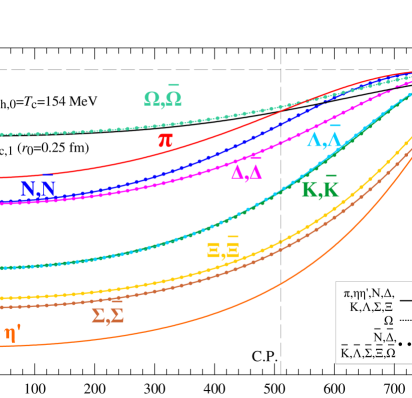
After these considerations, we plot in Fig. 3 the values of the ratios for each family, calculated along the transition curves which correspond to the two extreme values of 166 MeV in (i) and 154 MeV in (ii). In this figure we see, firstly, that the differences between families which contain particles and antiparticles are small. Secondly, we notice that the ratio for the families is artificially high as a consequence of unknown resonances in these families. Neglecting this discrepancy, the ratio for the family for certain value of baryon chemical potential has the highest value of all the families. Thus, if we apply the volume corrections for equal for all hadrons, the ’s will be the first family (i.e. for the lower value of ) which satisfies the condition that its chiral mass acquires the maximum allowed value:
| (28) |
Equivalently, last equation can be written as:
| (29) |
Eqs. (28),(29) enable us to calculate the critical point position at baryon-chemical potential .
For values the crossover conditions (22) can be fulfilled not only for the family, but also for all the families (since 1,9,-9). For the chiral mass of the pion family remains equal to the maximum allowed pion mass. The conservation of the particle number of the pion family can no longer be fulfilled through the reduction of the mass and, thus, it has to be fulfilled through the alteration of the system volume, . So we are in the region of the 1st order transition. To ensure the conservation of particle number for the pion family we impose the condition:
| (30) |
We have defined as the volume expansion ratio. This ratio is determined by eq. (30) for , while it remains equal to in the crossover. Consequently, is inherited to the rest of the families. The conservation for the particle number in these families is ensured by:
| (31) |
The last equation determines the chiral masses for the particle families different than the pion family. However, it has to be checked for consistency reasons that the condition
| (32) |
continues to hold in the region of the 1st-order transition, as well.
It is evident from this description that the pions with the associated spectrum of resonances play fundamental role. The position of the critical point is determined by the knowledge of the pion family particle spectrum. The particle spectrum of the rest of the families does not influence the critical point position. The addition of currently unknown resonances in the spectrum of these families will further reduce the ratios , depicted in Figs. 3.
In Figs. 3 we, also, present graphical solutions of eq. (29) – for the transition curves which correspond to 166 and 154 MeV – determining the position of the critical point. To this end we plot the volume correction factors for the relevant value of hadron radii . The intersection of these factors with the pion ratios, , determine the critical baryon chemical potential, . The factors are almost the same for all the families for equal hadron volumes, according to Fig. 2. Thus, the fact that the ratio retains the higher value among all ensures that the intersection of the curves and will occur first (at lower ). Also, it is evident from Fig. 2 that is slightly lower than the rest of the volume correction factors. This further confirms our conclusion that the pion family will reach first the relative maximum mass at the chiral phase. However, we have to point out that the factors will differ if different particle volumes are used.
This description is consistent with the fact that in the low baryon density area the HG state is dominated mainly by mesons and the pion is the meson with the lower mass. Thus, its production is favoured at this territory, which leads to enhanced pion multiplicities. Also, we observe that the family with closest to the pion family is the nucleon family . Indeed, the nucleon family contains the nucleons, protons and neutrons, which are the lightest hadrons carrying baryon number. Thus, these particles, with their family, should play important role as the baryonic density increases and their multiplicity becomes enhanced. So, the next family to the pions which may play important role are the nucleons.
In this section for simplicity we have used volume correction factors for the case of constant volumes equal for all hadrons. If different volumes are introduced for specific hadron species these factors will differ among these species. Additionally, for volumes depended on chemical potentials the volume correction factors may differ between particles and antiparticles (according to eq. (43)). In each case we have to ensure that the pion family is the family for which the volume correction factor meets the corresponding ratio at the lower value of baryon-chemical potential.
4 Constrains of Lattice QCD on hadron volumes - Thermodynamic implications
The hadron densities in the HG state depend on the eigenvolume of each particle, which incorporate the effect of the repulsive part of the strong interaction. In the previous section, to show the effect of the hadron volumes on our model, we used arbitrary values, which where not subject to any constraint. In this section we take a step further and we try to acquire knowledge of the values of these particle volumes by a fit on the Lattice QCD results. We consider here the QCD pressure as a function of temperature for vanishing baryon chemical potential which is calculated in [2]. Our results will depend on the critical temperature for zero density. Below the system exists in the Hadron Gas (HG) state. We will consider both scenarios: (i) constant eigenvolumes (independent of temperature and baryon chemical potential), as well as, (ii) eigenvolumes depending on temperature and baryon chemical potential.
4.1 Constant Eigenvolumes
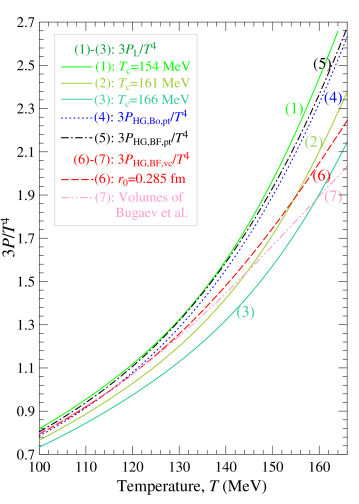
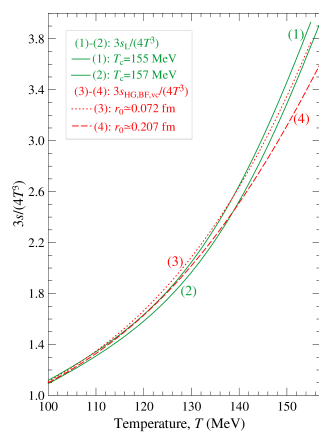
We start our investigation with the scenario of constant eigenvolumes. In Fig. 4 we present the normalised lattice pressure as function of temperature for three values of : 154 MeV (which is the prefered one in [2]), 161 MeV and 166 MeV (lines, (1)-(3)). We focus on the temperature region 100 MeV, since the lattice results may not be accurate for . As it is evident from Fig. 4, the increase of causes the lattice pressure to decrease for the same temperature. With line (4) we depict the normalised HG pressure for point particles in the Boltzmann approximation. However, line (4) lacks two additional requirements for a correct HG description, quantum statistics and volume corrections. So, with line (5) we depict the HG pressure with Bose/Fermi statistics for point particles. We observe that this addition shifts the HG pressure to higher values. This line still produces lower pressure values than the lattice MeV curve. The insertion of finite hadron volume will shift line (5) to even lower values. So the lattice MeV curve cannot be fitted by physical hadron volumes. On the contrary the increase of moves the lattice pressure curve to lower values than line (5). The addition of the volume corrections causes even more decrease in the HG pressure (line (6)). So, to shift the lattice pressure to values compatible to the HG case, an increase of is needed.
(i) (ii)
We, then, attempt to fit the lattice pressure with constant values of volumes. First we employ the same volume parameter, , for all the hadrons. We determine this volume by a fit on the lattice pressure [2], , so that the quantity:
| (33) |
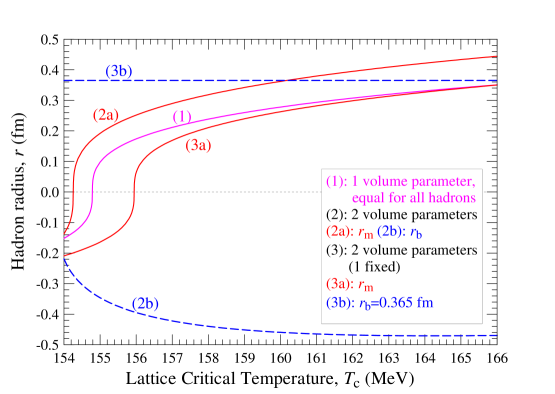
is minimized. The temperature points, , are taken at equal intervals in the range , while the errors are all taken equal . The degrees of freedom are , where is the number of the volume parameters we shall determine by the fit. The value of certainly affects any conclusion about the quality of the fit, however we are only interested in the relative success of the different fits we shall perform. In Fig. 5 we show the results of this fit in line (1), which represents the radius common to all hadrons as a function of . It is clear that for MeV the value of this radius is negative, thus unphysical. This is in accordance to the observation that the MeV lattice pressure curve lies above the Bose/Fermi HG pressure for point particles. Consequently, the unphysical negative hadron volume is necessary to mathematically fit the lattice results, since it increases the point-particle pressure, instead of suppressing it. However, above 155 MeV, we find physical positive values for the hadron radius. We observe a tendency for saturation as the maximum value of MeV is approached.
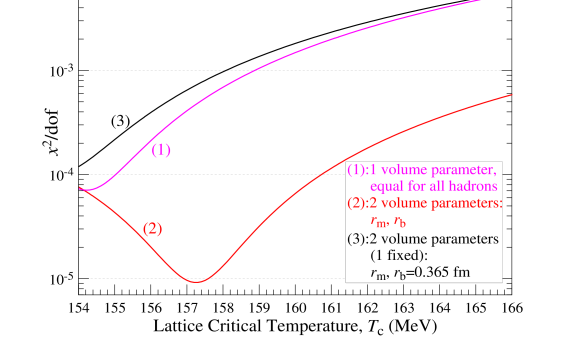
In Fig. 6 we present results of the quality of the fit. From this graph, it is evident that the quality worsens as increases. Returning to Fig. 4, where we have plotted the normalised HG pressures for the fitted radius value which corresponds to 161 MeV, we observe that the lattice pressure is fitted poorly by the one volume parameter (line (6)). For comparison we have also plotted the HG pressure for the hadron volumes of [34] (line (7)). It is evident that it does not fit well the lattice pressure. Only between the values 155-157 MeV we find the relative best fit, with the universal hadron volume in the range 0.07-0.21 fm. We use this interval because for 154.5 MeV, is unphysical and the quality of the fit worsens as rises.
We then attempt to fit the lattice pressure with two volume parameters, one for the mesons, and one for the baryons, , which are both left free to determined by the fit. The procedure entails to determine these two parameters by minimizing the quantity of eq. (33, which now involves HG pressure depending on , . The results for the fitted hadron radii are shown in Fig. 5 with lines (2a) and (2b) and in Fig. 6 with line (2). This fit achieves better quality than the one parameter case, as it is shown in Fig. 6. This is expected due to the use of an extra parameter. However, the baryon volumes are shifted, completely or partly, to unphysical negative volumes for all values of . This is also understandable, because for zero baryon density the HG is composed mainly by mesons, while the baryon content remains relatively small. Thus, small variations to the mesonic radius produce large variations to the meson multiplicities. On the contrary, to obtain comparable variations to the baryon multiplicities the respective radius has to vary considerably. Since the parameters in the performed fit are treated without constraints, the baryon radius is easily shifted to negative values whenever there is a tendency for the reduction of this parameter. To avoid this behaviour, while keeping two volume parameters in the HG description, we decided to fit the lattice pressure varying only the mesonic radius . During the fitting procedure the baryon radius remains fixed to the value fm given in [34]. Our results for are shown in Fig. 5 with lines (3a) and (3b) and in Fig. 6 with line (3). From Fig. 5 we find that acquires physical values for MeV. The quality of the fit remains worst than the one volume parameter case (Fig. 6, line (3)) for all .
We end his subsection by showing representative fits with common particle eigenvolumes for both mesons and baryons. We concentrate on this case since the fit with the two free volume parameters leads to unphysical results and the one parameter fit has better quality than the one with the fixed baryon volume. Thus, we present in Fig. 7(i) results of the HG pressure corresponding to 155 and 157 MeV. The best fit (at 155 MeV) corresponds to rather low value for hadron volume, while the fit starts to deteriorate at 157 MeV. In any case the HG model fails to fit sufficiently the lattice entropy density, which is the temperature derivative of the pressure. In Fig. 7(ii) we compare the entropy densities of lattice and HG for the parameters of Fig. 7(i). It is clear that the best constant HG volume parameters which fit quite well the lattice pressure are not adequate to fit the lattice entropy density.
4.2 Varying hadron eigenvolumes
Since the constant particle eigenvolumes are inadequate to fit the Lattice results (pressure and entropy density) we turn now to the use of volumes which depend on temperature and chemical potentials. However, this approach affects certain thermodynamic quantities. The total HG pressure can be calculated by eqs. (7)-(8).
For simplicity we use, here, only one index for a specific particle, without reference to the family it belongs to. If the particle volumes remain fixed, then the particle densities and the system entropy density read, respectively:
| (34) |
| (35) |
where the upper index denotes constant particle volumes and we have defined , i.e. the group of all the items without the -th one.
The last two equations can be worked out to give the known results [17]:
| (36) |
| (37) |
where the upper index “pt” denotes the point-particle case.
Then we examine the effect of having volumes which are not constant with respect of temperature and/or chemical potentials. We use the notation . Then we calculate
| (38) |
If the particle volumes depend on temperature, , then, using eq. (38), we determine the entropy density
| (39) |
where with we denote the part of the HG entropy density which is calculated with constant volumes, according to eq. (37).
If the particle volumes depend on chemical potentials, , then, using eq. (38), we calculate the particle densities
| (40) |
where with we denote the part of the HG density of the particle , which is calculated with constant volumes, according to eq. (36).
At this point we want to have the same result if we evaluate the density for two particle species , and then add them and if we evaluate the density of the two particles together
| (41) |
For example we can imagine that we have a family with two particle species and and common volume and we evaluate each density separately with chemical potentials , . Then we evaluate the density for the whole family with chemical potential . If the index in eq. (40) runs to all the hadrons of the system, then eqs. (40) and (41) cannot hold simultaneously. So we make the choice that the dependence of a hadron volume on chemical potentials is restricted to the chemical potential of the specific hadron
| (42) |
Then eq. (40) results in
| (43) |
(i) ![[Uncaptioned image]](/html/1812.07006/assets/x11.png)
(ii) ![[Uncaptioned image]](/html/1812.07006/assets/x12.png)
(iii) 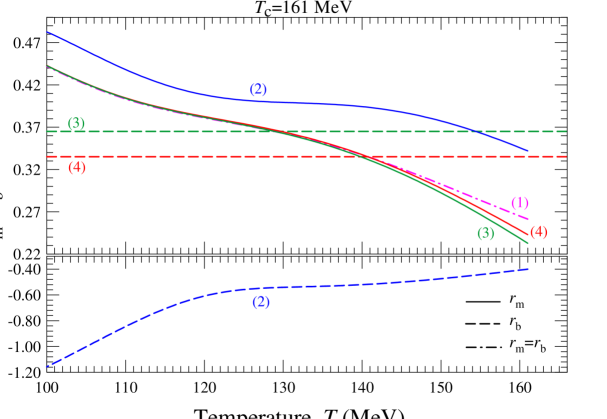
(iv) 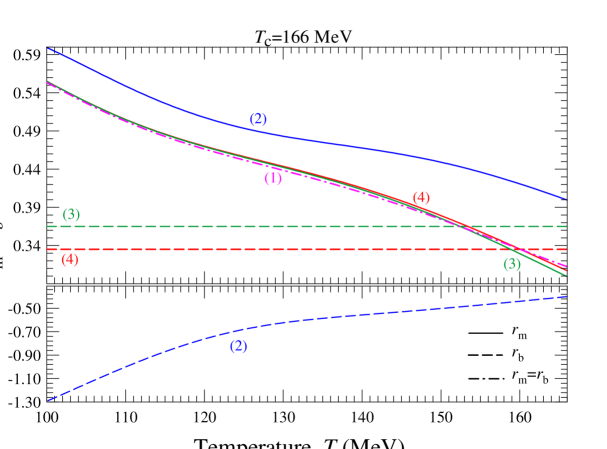
After evaluating the effect of the varying volumes on entropy density and particle densities, we shall use this type of volumes to fit the Lattice results. Obviously, the Lattice Pressure at vanishing baryon density depends only on temperature. Thus, the hadron volumes we will use in the fitting procedure depend only on temperature, as well. This, indeed, will allow us to produce a HG curve which completely coincides with the lattice pressure curve. Also, it will be possible to reproduce exactly the lattice entropy density curve with the use of eq. (39).
Our first attempt (case A) is to use one volume parameter, , for all hadrons. This volume is determined for every if we solve the equation:
| (44) |
Then, the corresponding HG entropy density can be calculated by eq. (39), where only one volume parameter is available:
| (45) |
where is infinitesimal, runs over all hadrons and in the approximate calculation of the derivative we have used terms up to the order of .
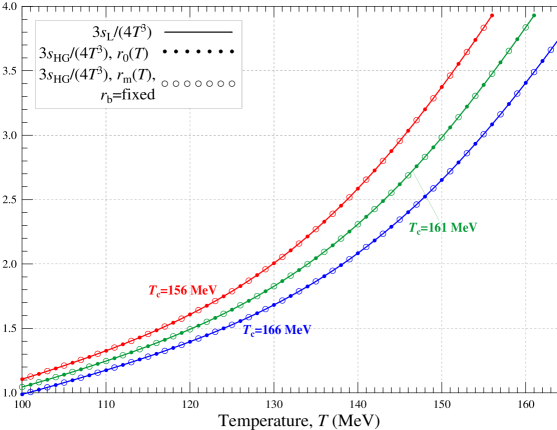
The HG entropy density of eq. (45) fits exactly , as it is evident from Fig. 8. Also, because , and , we must have . Thus, the hadron volume decreases with the increase of temperature. In Fig. 9 we present the results for the hadronic radii calculated from the fit to the Lattice results for specific critical temperatures : in (i) =154 MeV, in (ii) =157 MeV, in (iii) =161 MeV and in (iv) =166 MeV. In each graph the result corresponding to a common radius for all hadrons is shown with line (1).
Our second try (case B) utilises two separate volume parameters, one for mesons and one for baryons . We determine these two parameters for every , so that the HG pressure and entropy density equals the relevant quantities of the lattice. Thus, we simultaneously solve the equations:
| (46) |
| (47) |
This case is interesting because the HG entropy density for these specific volumes has the same functional dependence on the hadron eigenvolumes as the HG entropy density with constant volumes, that is . Consequently, in view of eq. (39), this leads to:
| (48) |
where () is the density of all mesons (baryons) in HG calculated for constant eigenvolumes. The last equation suggests that when, at certain temperature intervals, , then and vice versa. Also, when , then , meaning that and should reach simultaneously maximum or minimum values. Our results for this case are shown with lines (2) in graphs 9, where the properties of and which are inferred by eq. (48) can be observed.
Our last effort (case C) is again with two volume parameters, but only with the meson volume depending on temperature, e.g. . The baryon eigenvolume is held fixed and the meson eigenvolume is determined by solving the equation
| (49) |
The HG entropy density can be calculated by eq. (39) and equals to the corresponding lattice quantity. The results of this case are shown in graphs 9 with lines (3), where the baryon radius is fixed at fm (which is the mean baryon radius cited in [34]) and with lines (4), where the baryon radius is fixed at fm (which is the lower baryon radius cited in [34]).
Comparing, now, the results from cases A-C, we see that case B leads to baryon volumes which are negative in almost all the temperature range and for all . Thus, we have to drop this case as a plausible scenario. These results are similar to the case of fits with constant (with respect to ) baryon volumes. Again we find that if is left as a free parameter, it is easily shifted to negative, unphysical values. So we have to reject this approach. On the contrary, fixing the baryon volume at a certain (positive) value, independently of our choice, allows us to solve for the meson volume , so that the HG pressure equals the Lattice pressure at every temperature point. The relevant entropy density can be calculated by eq. (45), where runs over mesons only. In Fig. 8 it is shown that the Hadron Gas entropy density fits exactly the lattice entropy density, as well. Moreover, it is evident that for MeV the parameters fall, for cases A-C, almost completely in the unphysical negative domain. Thus, lattice results for this critical temperature cannot be fitted by HG. This picture changes dramatically if is raised by an amount of the order of 1 MeV. Additionally, when MeV the volume parameters acquire rather high values, disfavoured by phenomenology.
5 Locating the Critical Point through volume models guided by lattice QCD
In this section we will utilise HG models, using hadronic volumes extracted from Lattice QCD results, in order to describe the transition of the hadron phase to the chiral phase in the entire baryon chemical potential- temperature plane. Our goal is to determine the location of the critical endpoint of the first order transition line indicating the entrance into the smooth crossover region.
5.1 Critical Point with single Constant Hadron Volume
We first consider the model which assumes that all particles have the same eigenvolume , connected with the hard-core particle radius , which is constant with respect to temperature and chemical potentials. Its value, however, will be determined, for a specific choice of , by a fit on the Lattice Pressure curve, as in section 4 (through minimisation of given by eq. (33)). We will refer to this choice as volume model (a).
The use of a single volume parameter for all hadrons has, also, been used elsewhere. In [26, 27, 28] the eigenvolume was taken equal for all baryons and mesons. In these works the radius for baryons was given by the hard-core repulsive interaction as extracted from nucleon-nucleon scattering [29], while radius values for other baryons were taken similar. For mesons, in the absence of detailed information on their interactions at short distance, it was assigned the same radius value, based on the similarity of the meson charge radii compared to baryons and on the energy dependence of the pion-nucleon phase shifts [30].
The choice of eq. (20) as the transition curve, fixes the temperature, , for given . To determine the strange quark chemical potential we apply the zero strangeness condition in the HG phase:
| (50) |
Last equation can be solved to determine for given values of , and . Eqs. (20),(50) enable us to depict our calculations as function of alone, for a specific value of . The conservation of particle numbers insures the strangeness neutrality in the chiral phase, as well.
We proceed by considering the dependence of the position of the critical point on , i.e. the Lattice QCD critical temperature at . In Fig. 10(i) we plot the calculated radius as function of . In Figs. 10(ii)-(iv) we show the position of the critical point (, respectively) as a function of . In Fig. 10(v) we depict the location of the critical point in the () plane. We observe that for values 161.5 MeV (0.301 fm) the critical point is located at zero baryon chemical potential, while it disappears for higher (or ) values. Decrease of (and the radius ) shifts the critical point at higher values of chemical potential .
We have to impose the condition that the solution for the chiral masses is positive for all the families. The lowest values for these masses are found for and these values decrease with decreasing (or ). We find that the chiral mass of the pion family reaches the zero value, as decreases, while the rest of the chiral masses are still positive. This imposes a constraint on , leading to the lowest allowed value of 155.7 MeV (0.157 fm), which in turn gives an upper value for the position of the critical point at 709 MeV. These findings provide a lower limit for the critical temperature 84.8 MeV. Thus, our treatment excludes scenarios with very low critical temperatures [32]. In Fig. 10(v) we present the solution at zero baryon density for the chiral mass of each family (as the ratio to the higher allowed chiral mass of the family) with varying .
In summary, for a universal hadronic volume, which remains constant with temperature, the critical point can be located in the range of (0-709) MeV, which corresponds to range of (162-156) MeV or mean hadronic radius in the range of (0.16-0.30) fm. Also in Figs. 10 we depict by open circle the critical point, determined by the criterion which will be presented in detail in the next Section 6. This critical point corresponds to 160.8 MeV (0.291 MeV) and it is located at 249.1 MeV and 153.0 MeV.
We shall finish this subsection by presenting full calculations of the quantities involved for the solution for this critical point. In Fig. 11(i) we present the ratios . The intersection of the volume correction factor of the pion family, , with the corresponding ratio, , determines the position of the critical point. In Fig. 11(ii) we present the masses that solve eq. (12) for every family . Since the masses differ considerably among the families, we choose to depict the ratio of the chiral mass to the respective mass of the HG ground state. As it can be observed, the chiral mass of the pion family starts at its minimum value at zero baryon chemical potential, it reaches the maximum value at and then remains constant. The chiral masses of the rest of the families in general increase with the increase of . A general observation is that all the masses tend, for zero temperature (maximum value of ), to the physical mass of the lowest mass hadron in each family. Another observation is that the solution for the particle family differs slightly from antiparticle family solution.
In Fig. 11(iii) we present the calculations for the densities of each family in the HG and chiral phase. To display values in wide range, the family densities are divided by the respective minimum density (maximum value of chiral mass) at the chiral phase for the same conditions of temperature and chemical potentials, . For (crossover region) the densities of the HG and the chiral phase are equal (the slashed and continuous lines are identical at this region). For (1st order transition) the density in the HG phase is lower than the density in the chiral phase, since the volume expands as the system crosses from chiral to HG phase. This is evident by the fact that the HG curves (slashed lines) are lower than chiral curves (continuous lines). The densities between particle-antiparticle (with the respective normalization) are almost equal. All the densities for low temperatures tend to the respective .
Also, Figs. 11(ii)-(iii) confirm that the families exhibit irregular behaviour: the chiral masses of these families attain higher values than the maximum allowed ones and the HG densities for these families at the crossover region are lower than the minimum chiral density values. Both of these facts would be remedied if additional mass spectrum were present in the families.
(i)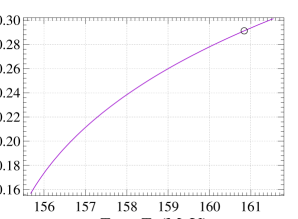 (ii)
(ii)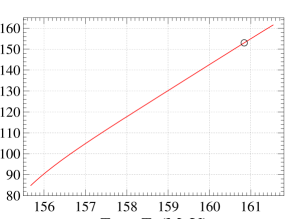
(iii)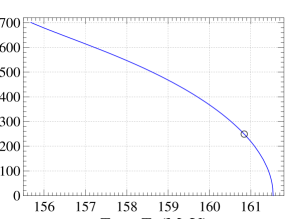 (iv)
(iv)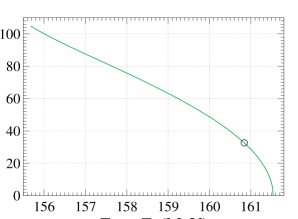
(v)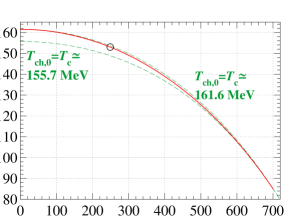 (vi)
(vi)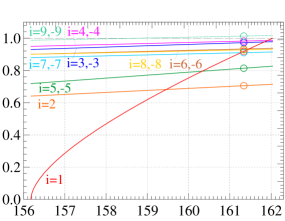
(i)![[Uncaptioned image]](/html/1812.07006/assets/x21.png)
(ii)![[Uncaptioned image]](/html/1812.07006/assets/x22.png)
(iii)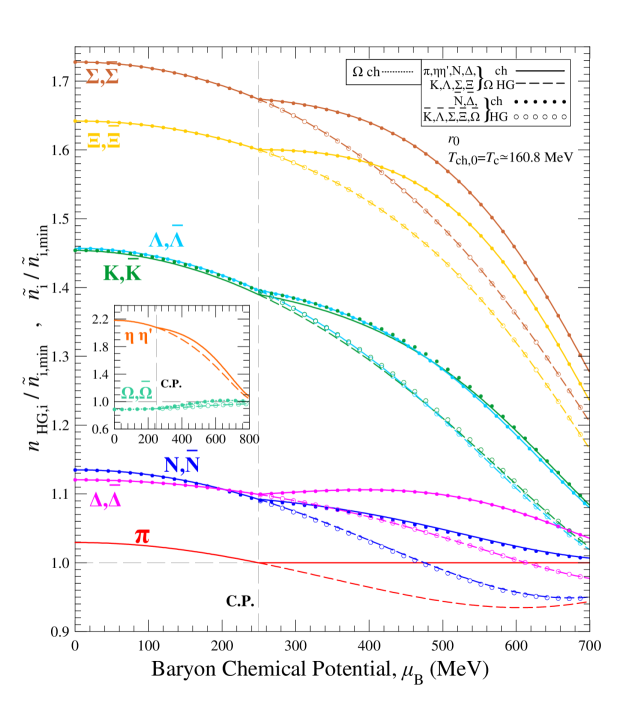
5.2 Critical Point with single temperature dependent hadron volume
The common hadron volume we used in the previous section fails to fit exactly the Lattice QCD pressure and entropy density, as it was discussed in subsection 4.1. In this section we shall use the approach of subsection 4.2 and we shall try to locate the critical point using the same radius for all hadrons, which now depends on temperature, . This radius is fixed by the fit on the Lattice Pressure at vanishing baryon density. However, the assumption that is independent of the chemical potentials enable us to transfer the value we have determined from the Lattice results at to every value of baryon chemical potential. This will be referred to as volume model (b).
(i)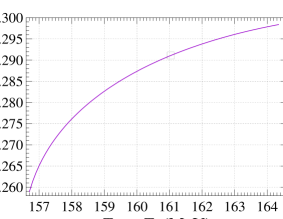 (ii)
(ii)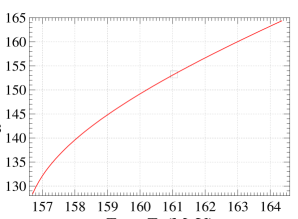
(iii)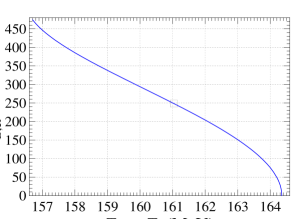 (iv)
(iv)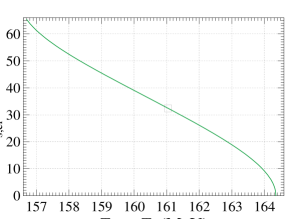
(v)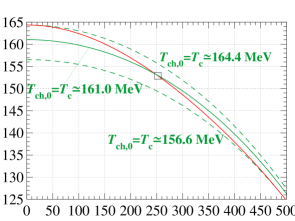 (vi)
(vi)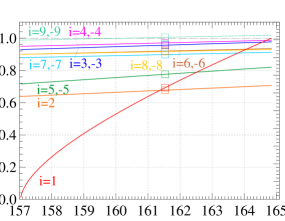
(i)![[Uncaptioned image]](/html/1812.07006/assets/x30.png)
(ii)![[Uncaptioned image]](/html/1812.07006/assets/x31.png)
(iii)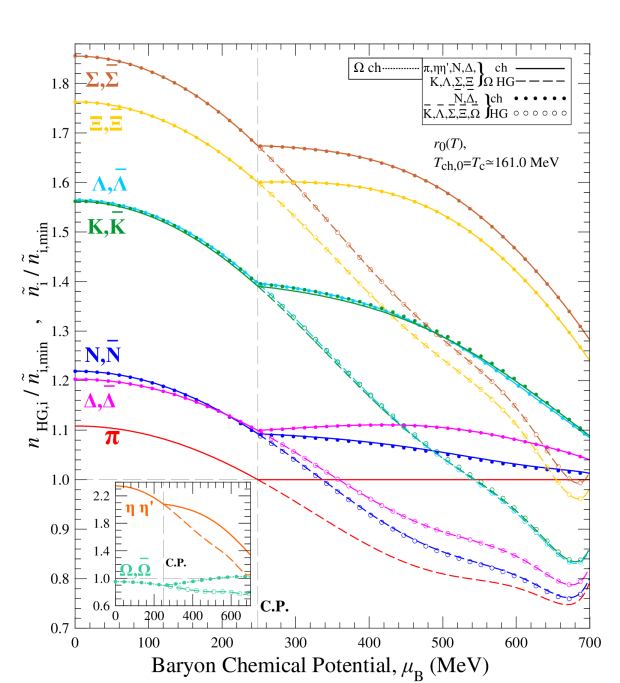
For the transition curve we use the parametrisation of eq. (20), leaving as a free parameter.
We calculate the position of the critical point, i.e. the value of the critical parameters (, , ) by solving the following set of equations:
| (51) |
| (52) |
| (53) |
| (54) |
However, we find that the lower value of that results in a real solution for the chiral pion mass is 156.5 MeV. Also, for 164.4 MeV the critical point is located at zero baryon density. In Fig. 12 we show our results for the position of the QCD critical point for all the accepted values of =156.5-164.4 MeV. In Fig. 12(i) we plot the calculated radius which corresponds to the temperature of the critical point as a function of . In Figs. 12(ii)-(iv) we depict the position of the point (, respectively) with varying . In Fig. 12(v) we show the solution at zero baryon density for the chiral mass of each family (as the ratio to the higher allowed chiral mass of the family) for different values of . Our findings are similar to the results of the hadronic radius which is independent of the temperature. However, the higher value of that allows for a critical point is shifted to lower values. Thus, the critical point can be located in the range of (0-498) MeV, which corresponds to mean hadronic radius at the critical point in the range of (0.253-0.298) fm. Also in Figs. 12 we depict by open square the critical point which is determined by the criterion discussed in the next section 6. This corresponds to 161.04 MeV and it is located at 248.41MeV and 153.21 MeV.
In Figs. 13 we show results for this value of . In (i) we show the ratios for the different families. The intersection of the pion family with the volume correction factor determines the position of the critical point. In (ii) we show the corresponding solutions for the chiral masses for each family and in (iii) we present the densities in the HG and chiral phases for all families.
5.3 Critical Point with meson and baryon radii
Turning to a more realistic scenario for the hadron volumes, we introduce separate volume radii for the mesons, and for the baryons, . Different hadron volumes have, also, been used through the bag-model where the volume varies with the hadron mass [20, 35] or energy [20]. In [34] different eigenvolumes have been used for several groups of hadrons. Here we assume that the mesonic radius only depends on the temperature, and the bayonic radius only depends on the baryon-chemical potential, . We, also, assume that remains constant at the crossover region with respect to . So, the baryon-chemical potential begins to affect the baryonic volume at the first order transition region, where the baryonic density has increased above a certain level. Having fixed, we determine the radius from a fit on the Lattice Pressure for a specific value . Then, these two values are passed on to the whole crossover region. Moreover, the fact that the radii are independent on the baryon-chemical potential () allows us to calculate densities through eq. (36), instead of eq. (43), for values of baryon-chemical potential up to the critical point. This will be referred to as volume model (c).
In the 1st order transition curve the baryon volume does depend on . Applying eq. (43), we have for mesonic families , so:
| (55) |
For the baryonic and antibaryonic families eq. (43) can be rewritten as
| (56) |
For baryons we have with , so . Similarly, for the antibaryons we have . Thus, eq. (56) is transformed to
| (57) |
In the last equation for this model (c) the volume is the common volume to all baryons and antibaryons , which is connected to the respective radius .
(i)![[Uncaptioned image]](/html/1812.07006/assets/x33.png) (ii)
(ii)![[Uncaptioned image]](/html/1812.07006/assets/x34.png)
(iii)![[Uncaptioned image]](/html/1812.07006/assets/x35.png) (iv)
(iv)![[Uncaptioned image]](/html/1812.07006/assets/x36.png)
(v)![[Uncaptioned image]](/html/1812.07006/assets/x37.png) (vi)
(vi)![[Uncaptioned image]](/html/1812.07006/assets/x38.png)
(vii)![[Uncaptioned image]](/html/1812.07006/assets/x39.png)
The extra parameter for the baryon radius, , allows us to impose the constraint that the chiral masses of both the pion and nucleon families acquire their maximum values at the critical point. For a specific choice of we have a freeze out curve which links the freeze out temperature with the baryon-chemical potential. So, in order to calculate the position of the critical point we have to evaluate the value of the critical parameters (, , ), as well as, the values of the meson radius, and baryon radius, . This is accomplished by solving, for given , the following set of five equations:
| (58) |
| (59) |
| (60) |
| (61) |
| (62) |
We find that for 157.5 MeV there is real solution for the chiral pion mass and that for 165.0 MeV the position of the critical point is located at zero baryon chemical potential. However, for 163.6 MeV the family develops a chiral mass which is slightly above the maximum allowed value (at most 0.4%). To stay on the safe side we exclude these cases for the solution of a critical point. Thus, the critical point is located in the interval 142-404 MeV and the area in which is allowed for the critical point is further suppressed compared to the case of the common hadronic radius. In Fig. 14 we show our results for the position of the QCD critical point for the values for =157.5-165.0 MeV. In Figs. 14(i)-(ii) we plot the calculated mesonic radius and baryonic radius which correspond to the conditions of the critical point as function of . In Figs. 14(iii)-(v) we depict the position of the critical point (, respectively) as a function of . In Fig. 14(vi) we illustrate the solution at zero baryon density for the chiral mass of each family (as the ratio to the higher allowed chiral mass of the family) with varying . Also, in Figs. 14 we show by a star the critical point which further fulfils the criterion described in the next Section 6. This corresponds to 160.73 MeV and it is located at 266.56 MeV and 151.74 MeV.
Next we can evaluate the thermodynamic variables on the crossover curve, for a given value of . The value of remains fixed to the value which was found from the equations that determined the critical point for this value of . So we obtain () for every value of by solving equations (58),(61) and (62), while the chiral masses for all families are calculated by eq. (12) with .
(i)![[Uncaptioned image]](/html/1812.07006/assets/x40.png)
(ii)![[Uncaptioned image]](/html/1812.07006/assets/x41.png)
(iii)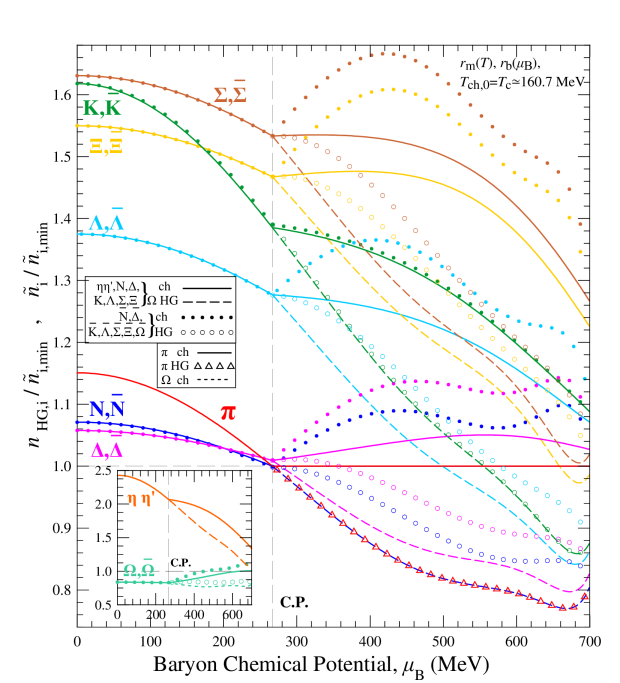
Turning, then, to the first order transition line, we have to evaluate for specific the set of variables (), since now, we allow to change. Given a value of , we determine from the lattice pressure curve for zero baryon density. The chiral masses of the pion and the nucleon family remain fixed at their corresponding maximum values. Since we allow the baryon radius to depend on and the meson radius does not depend on , we have to replace eqs. (59) and (60) by the equations:
| (63) |
| (64) |
where . The zero strangeness condition has to be imposed, as well, which in view of eqs. (55) and (57), acquires the form:
| (65) |
where the subscript denotes the absolute strangeness enclosed in the baryonic and antibaryonic families, i.e.
| (66) |
Eqs. (58),(61), (63)-(65) form a system of five equations which allows us to determine the set of variables (), for a given value of . The situation is simplified since eqs. (61), (63) allow us to solve for and directly. So, eqs.(58),(64) and (65) form a subset of three equations (one of which is a differential equation, though), which allows to evaluate , and . The chiral masses for all families except the pion () and the nucleon family () are calculated by eq. (12) with .
In Fig. 15 we depict all the calculations (as a function of ) for a specific value of 160.7 MeV which, also, fulfils the criterion described in section 6. In (i) we plot the ratios , where the simultaneous intersections of the volume correction factors for the pion and the nucleon family with the corresponding ratios determine the position of the critical point. In (ii) we plot the chiral masses of the hadronic families, where, at the first order transition line, the chiral masses of the pion and the nucleon families remain constant, retaining their maximum allowed values. In (iii) we display the densities of the families, with suitable normalisation, at the hadronic and chiral phases. We observe that in the 1st order transition curve, where the baryon volume depends on , the densities of the baryon families exhibit different behaviour than the corresponding antibaryon families due to the different sign that enters eq. (57).
5.4 Critical Point from Lattice QCD at finite baryon-chemical potential
Lattice calculation at finite values of baryon chemical potential have been carried out in [11, 12, 13, 14, 15, 16]. We use the results of the pressure as function of temperature for fixed values of from to with MeV step from [11]. These values are determined for vanishing strangeness chemical potential, . The temperature values of interest are in the range MeV. The lower value is given by the presented calculations and the upper is an approximate upper bound for the critical Lattice temperature for , which sets an upper temperature bound in the existence of the Hadron Gas. The values from the graph are then fitted with a 4th degree polynomial (as function of ) to produce a curve that fits the pressure points for each value of fixed . Totally, we have 8 such curves, which give us the pressure as function of at specific values of . Then, each time we need the pressure at a given point (, ), we evaluate from these 8 curves the pressure values for temperature and 8 values of . On these 8 values we perform a fit with a 6th degree polynomial, but only with the even powers present (since the pressure has to be an even function of ). This procedure gives us the pressure as function of chemical potential for the specific temperature and we can just read the value for the specific .
We, also, need to allow the critical temperature at , to vary. In such case we define the dimensionless temperature . If the critical temperature is shifted to the temperature for which stays unchanged is
| (67) |
where we have defined
| (68) |
For vanishing baryon chemical potential we demand that the dimensionless pressure stays the same at the same , so
| (69) |
This was the case for volume models (a), (b) and (c).
In [36, 37] the critical temperature is taken to be 158 MeV. For finite baryon chemical potential the critical temperature changes as ([36, 37]):
| (70) |
Demanding eq. (70) to stay unchanged, if we change the critical temperature from to , amounts to
| (71) |
Since is the temperature that corresponds to the lattice with , it should be related to through eq. (67). Combing eqs. (67)-(71) we get
| (72) |
Thus, for eq. (70) to remain unchanged the baryon chemical potential has to be shifted to
| (73) |
We assume the same behaviour for any other chemical potential describing the system:
| (74) |
Generalising eq. (69) for the pressure as function of any set of chemical potentials, as well, we get
| (75) |
Assuming that for a quantity the following relation holds:
| (76) |
then we have
| (77) |
Applying the above procedure to any kind of chemical potentials and any order of derivatives we get that for any susceptibility
| (78) |
Using equations (76)-(77) for the dimensionless pressure, we find for the dimensionless baryon density
| (79) |
After dealing with derivatives of chemical potentials, we turn to temperature derivatives. Assuming that we have defined a new dimensionless quantity:
| (80) |
then (76) leads to:
| (81) |
So
| (82) |
Also, for a dimensionless entropy density , we have:
| (83) |
Identifying in (80) and and using (82), (83) and (75) we arrive at:
| (84) |
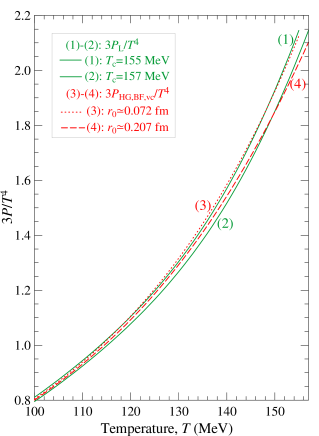
In Fig. 16 (i)-(ii) we have plotted the Lattice QCD results for the normalised pressure for vanishing value of strangeness chemical potential () extracted from Fig. 4 in [11] depicted as solid rhomboid points. These correspond to the value of 158 MeV. On the same graphs we present our reconstruction which is carried through the fit on these points. Also, we plot the corresponding results of the Ideal Hadron Gas (IHG), i.e. Hadron Gas with zero hadron volumes. It is evident that the Lattice QCD pressure for 158 MeV at certain domains rises above the IHG pressure. This means that at these domains, if we try to have a Hadron Gas description for the Lattice results, we will get a negative hadron volume which is physically impossible. However, if we shift the Lattice results to a higher temperature, using eqs. (67), (74) and (75), e.g. 161 MeV, we find that the Lattice pressure is lower than the IHG pressure, meaning than a positive solution for the hadron volume can make the two pressures identical.
We proceed by evaluating a volume parameter equal for all hadrons which depends on temperature and baryon chemical potential so that the Lattice QCD and Hadron Gas pressure be equal at any point of the plane. This amounts to solving, for specific , the equation:
| (85) |
where is the radius of the common hadron volume. At this point we make the assumption that the common hadron volume does not depend on the strangeness chemical potential, so we use the calculated from eq. (85) radii as input to evaluate our Hadron Gas model (called model (d)) for any point ().
(i)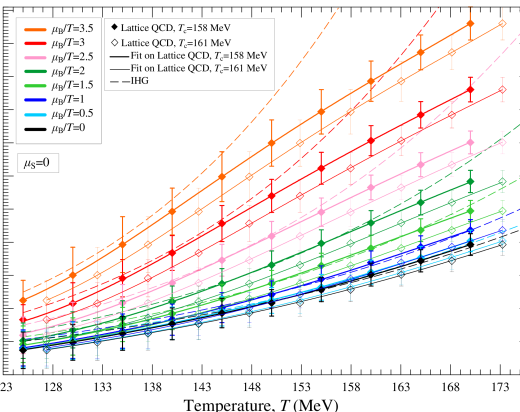
(ii)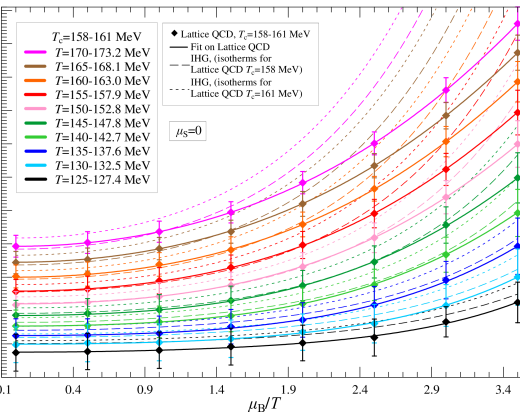
(i)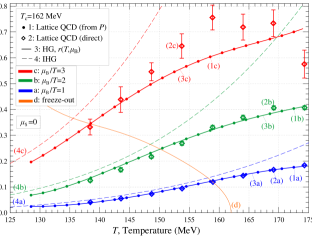 (ii)
(ii)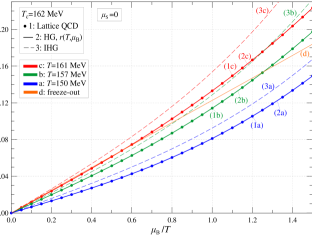
(iii)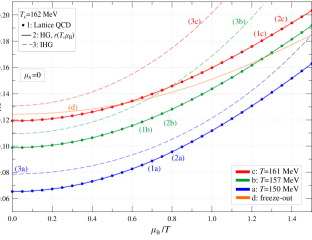 (iv)
(iv)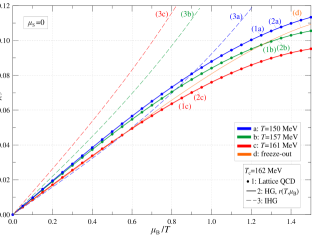
(v)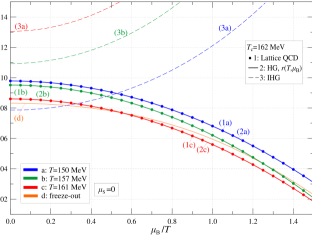
In Fig. 17 we depict the baryon susceptibilities. For the Lattice QCD we can only evaluate these susceptibilities for (solid lines on the graphs). The corresponding susceptibilities from the HG (circular points) show a calculation consistency for our model. In Fig. 17(i) we also include direct evaluation of from [11]. We note that the HG model needs to hold only for temperatures lower than the freeze-out curve described by eq. (20). For comparison we include the susceptibilities of the Ideal HG.
To locate the critical point for specific , apart from eqs. (85) and (61), we have to solve the set of equations:
| (86) |
| (87) |
(i)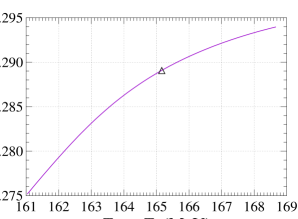 (ii)
(ii)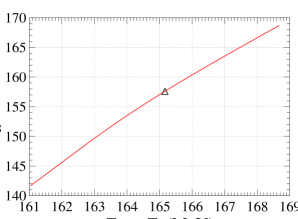
(iii)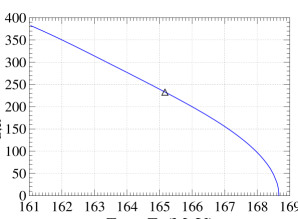 (iv)
(iv)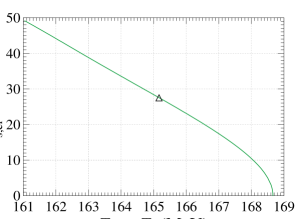
(v)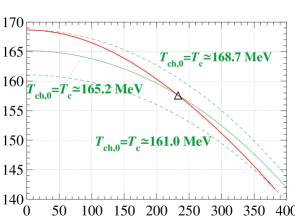 (vi)
(vi)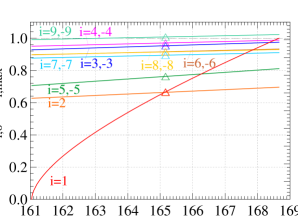
(i)![[Uncaptioned image]](/html/1812.07006/assets/x56.png)
(ii)![[Uncaptioned image]](/html/1812.07006/assets/x57.png)
(iii)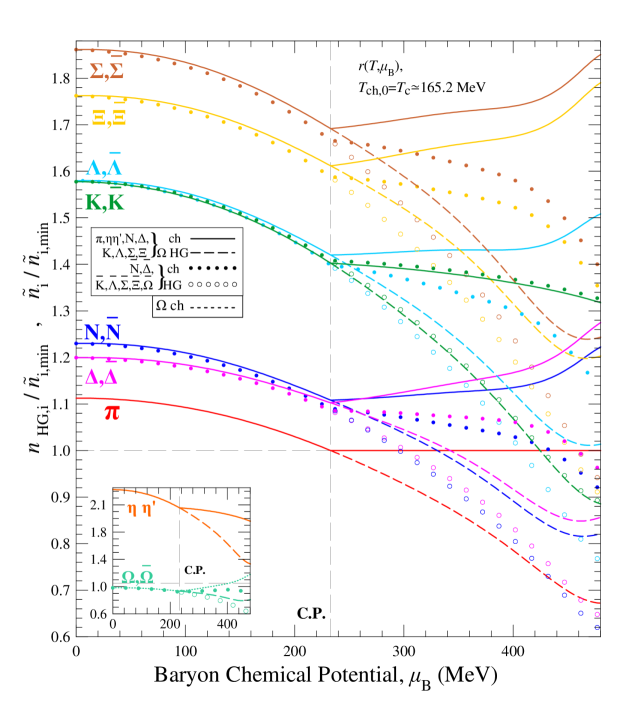
Eq. (87) acquires the same form as eq. (65), where we now identify . The derivative can be provided numerically from the values of at adjacent points evaluated through eq. 85.
We present solutions for the critical point in the same manner as in the previous subsections (5.1-5.3) in Figs. 18(i)-(vi). We find that for 161.0 MeV there is positive solution for the chiral pion mass and that for 168.7 MeV the position of the critical point is located at zero baryon chemical potential, thus, the values of between these values produce acceptable solutions for the critical point. We note that the rather high values of in the interval (166-168.7) MeV stay within the limit of the freeze-out temperature at low baryon-chemical potential MeV recorded in [38]. Also, in Figs. 18(i)-(vi) we show by triangle the critical point which further fulfils the criterion that the densities of and quarks which are contained in mesons and baryons are equal (described in the next Section 6). This corresponds to 165.2 MeV and it is located at 233.0 MeV and 157.6 MeV.
Next we can evaluate the thermodynamic variables on the crossover and the 1st order transition curve, for a specific value of which we choose to be the aforementioned one 165.2 MeV. The results are shown in Figs. 19(i)-(iii). We observe in Fig. 19(ii) that for some families the antibaryon chiral masses, at high values of rise above their maximum allowed values. On this effect we have to comment that: 1) The calculations are carried out at high 480 MeV and relative low 130 MeV where the Lattice QCD calculations may not be so precise. 2) Only one volume parameter is used for all hadrons. An introduction of a separate volume parameter for the baryons and antibaryons families may remedy the result. 3) The problem appears on antibaryon species existing in large positive , where their density is highly suppressed. Therefore, their presence is expected to have a minor effect on the system.
We end this section by presenting some further characteristics of the models we analysed. We utilise the solution for each model which further satisfies the criterion of the equality of the densities of and quarks contained in mesons and baryons (described in the next section).
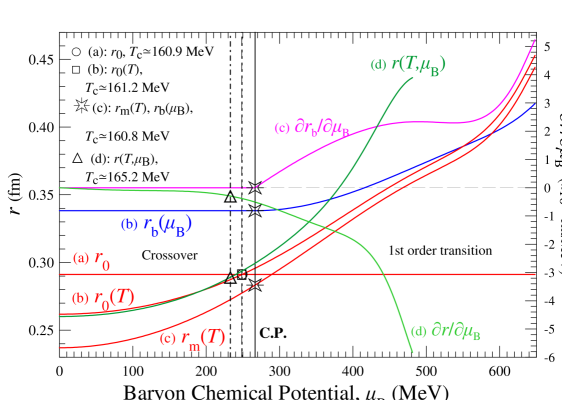
In Fig. 20 we present for the models (a)-(d) the solution on the transition curve (crossover-1st order) for the hadron radius. For model (c) there are two separate radii for mesons and baryon-antibaryons. We, also, present the solution for model (c) for the derivative of and for model (d) for the derivative of with respect to the baryon chemical potential on the transition curve.
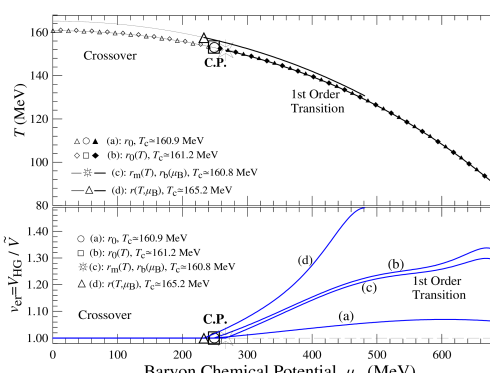
In Fig. 21 we show for all four models of subsections 5.1-5.4 the volume expansion ratio for the same values of as in Fig. 20. We, also, show the corresponding transition curves in the plane, as well as, the relevant critical points.
6 A criterion for the Critical Point
At the transition line and at low baryon density (crossover region) Hadron Gas consists mainly of mesons. At high baryon density (1st order transition) Hadron Gas consists mainly of baryons. Also, the temperature of the chiral phase transition at zero baryon-chemical potential is of the order of the mass of the lightest meson, the pion. The transition baryon-chemical potential of the chiral phase transition at zero temperature is of the order of the mass of the lightest baryon, the proton. We, therefore, postulate that the attributes of the crossover region are mainly due to mesons, while the attributes of the region of the 1st order transition are mainly due to baryons.
For this reason we calculate the density of quarks (, named collectively as quarks and quarks) contained in mesons and baryons. We note that both and quarks carry baryon number. So, since we are seeking the critical point at positive baryon density, we have to take into account the total density of both and quarks which are contained in hadrons, which is
| (88) |
| (89) |
where the index in the densities refers to the respective family of hadrons.
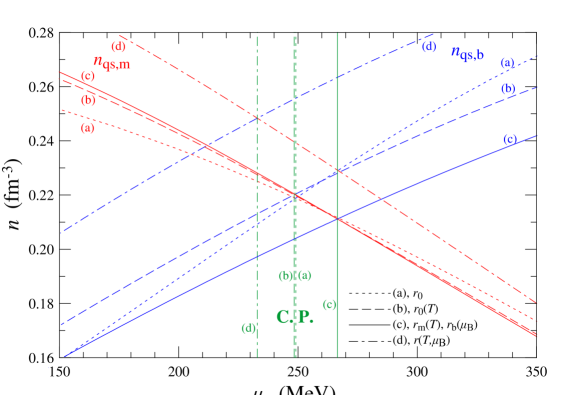
We evaluate the densities and for the critical points determined through the models (a) ( fixed), (b) (), (c) ( and ) and (d) (). Our results are shown in Fig. 22. We observe that for model (a) the critical point, which additionally satisfies the equality of the densities of the quarks contained in mesons and baryons, is located at 249 MeV. The model (b) gives almost equal 248 MeV, while model (c) evaluates this position at 267 MeV and model (d) at 233 MeV.
It is, also, possible to calculate and compare the densities of quarks, as well as, the densities of quarks alone, which are contained in mesons and baryons. However, this entails the exact knowledge of the factors for certain hadrons of family 2 with hidden strangeness and content . Also, by dealing with higher densities, that is inclusive densities of and quarks instead of separate densities, our results are less affected by any lack of knowledge of the mass spectrum of hadrons.
We remark, further, on the density of the antiquarks . The density of antiquarks contained in mesons is always equal to the density of quarks contained in the same mesons. However, the density of antiquarks contained in anti-baryons is significantly less than the density of the quarks contained in baryons, since we are in the positive baryon density region. Thus, nowhere in this region the density of antiquarks contained in mesons can become equal to the density of antiquarks contained in anti-baryons.
7 Conclusions
Guided by the lattice calculations which suggest that the QCD chiral restoration is completed, as temperature rises, well before the completion of deconfinement, we develop an effective description of the QCD state for temperatures near and above the chemical freeze-out curve. For temperatures in the region below the chemical freeze-out curve we adopt the hadronic resonance gas with the Bose/Fermi statistics and thermodynamically consistent volume corrections. The chiral phase consists of a few quark condensates, each of which shares the same quark content with a group of hadronic resonances with different masses. Between the two phases the particle number conservation is imposed as a minimum requirement of a phase transition, a condition which leads to the variation of the chiral masses along the transition curve.
We find that the pion particles with their partner resonances play the leading role in transforming the order of the transition from higher order to first order and in developing a critical point. The second family which may affect this transition is the family of nucleons. Thus, the exact knowledge of the specific spectrum of the rest of the hadronic particles is of secondary importance.
The position of the critical point is sensitive to the value of the radii of hadrons. For this reason, we use the Lattice calculations with three quark flavours for the pressure and entropy density below the critical temperature and fit it with the Hadron Gas equation of state in order to determine the hadronic volumes. We, also, link the lattice critical temperature with the freeze-out curve which we consider as our transition curve. We use four models for the hadron volumes, (a) which uses the same radius for all hadrons, constant for all temperatures, (b) which uses a common hadronic radius, which depends on temperature, (c) which uses different radius values for mesons and baryons, depending on temperature and baryon-chemical potential, respectively and (d) which uses a common hadronic radius, which depends on temperature and baryon-chemical potential. Our findings are summarised in Table 2. We observe that the critical point is limited by a maximum value of chemical potential which gradually diminishes from 701 MeV to 382 MeV as we move from model (a) to (d).
| Model (a) | Model (b) | Model (c) | Model (d) | |
| General solutions | ||||
| (MeV) | 161.5-155.7 | 164.4-156.5 | 163.6-157.5 | 168.7-161.0 |
| (MeV) | 161.5-84.8 | 164.4-125.0 | 160.9-137.4 | 168.7-141.7 |
| (MeV) | 0-701.0 | 0-497.6 | 141.5-403.6 | 0-382.3 |
| (fm) | 0.301-0.157 | 0.298-0.253 | 0.292-0.262 | 0.294-0.275 |
| (fm) | 0.343-0.321 | |||
| Solution which additionally satisfies | ||||
| (MeV) | 160.84 | 161.04 | 160.73 | 165.16 |
| (MeV) | 153.00 | 153.21 | 151.74 | 157.61 |
| (MeV) | 249.08 | 248.41 | 266.56 | 232.97 |
| (fm) | 0.2912 | 0.2911 | 0.2833 | 0.2891 |
| (fm) | 0.3383 | |||
We, also, calculate for the solutions of the critical point the densities of the quarks which are contained in mesons and baryons, motivated by the gradual increase of baryon density and decrease of meson density, as we move along the transition curve towards higher values of baryon chemical potential. We find that for all four models which we have used, the solution of the critical point which additionally satisfies equality of the two densities is located at (233-267) MeV and (152-158) MeV. Also, in this case, the hadronic volumes acquire realistic values. In models (a), (b) and (d) where a common volume is used, the hadronic radius is 0.29 fm. In model (c) this radius is 0.28 fm for mesons and 0.34 fm for baryons.
The group of the chiral QCD states, considerably fewer than the abundance of the hadronic states existing at lower temperatures, can be taken as starting point for the effective description of the EoS at higher temperatures, where quark deconfinement is completed.
References
- [1] J. Cleymans, H. Satz, Z. Phys. C 57 (1993) 135; J. Letessier, A. Tounsi, J. Rafelski, Phys. Lett. B 292 (1992) 417; J. Letessier, A. Tounsi, U. Heinz, J. Sollfrank, J. Rafelski, Phys. Rev. D 51 (1995) 3408; F. Becattini, M. Gaździcki, A. Kernen, J. Manninen, R. Stock, Phys. Rev. C 69 (2004) 024905; J. Cleymans, K. Redlich, Phys. Rev. Lett. 81 (1998) 5284.
- [2] A. Bazavov et. al., (HotQCD Collaboration), Phys. Rev. D 90 (2014) 094503; arXiv:1407.6387 [hep-lat].
- [3] K. Fukushima and T. Hatsuda, Rept. Prog. Phys. 74 (2011) 014001; arXiv:1005.4814 [hep-ph].
- [4] Sz. Borsányi, Z. Fodor, C. Hoelbling, S.D. Katz, S. Krieg, C. Ratti and K.K. Szabó, JHEP (2010) 2010: 73; arXiv:1005.3508 [hep-lat].
- [5] A. Bazavova, N. Brambillab, H.-T. Dingd, P. Petreczkye, H.-P. Schadlere, A. Vairob and J.H. Weber, Phys. Rev. D 93 (2016) 114502; arXiv:1603.06637 [hep-lat].
- [6] A.S. Kapoyannis, A.D. Panagiotou, Eur. Phys. J. C 77 (2017) 736-1.
- [7] T. Hatsuda and M. Prakash, Phys. Lett. B 224 (1989) 11.
- [8] G. Aarts, C. Allton, D. De Boni, S. Hands, B. Jager, C. Prakia and J.-I. Skullerud, JHEP06 (2017) 034.
- [9] L. McLerran and R. D. Pisarski, Nucl. Phys. A 796 (2007) 83; arXiv:0706.2191 [hep-ph].
- [10] A.S. Kapoyannis, Eur. Phys. J. C 51 (2007) 135; idid Eur. Phys. J. C 51 (2007) 1013.
- [11] S. Borsányi, Z. Fodor, J.N. Guenther, R. Kara, S.D. Katz, P. Parotto, A. Pásztor, C. Ratti, K.K. Szabó, Phys. Rev. Lett. 126 (2021) 232001; arXiv:2102.06660 [hep-lat].
- [12] A. Bazavov, H.-T. Ding, P. Hegdea, O. Kaczmarek, F. Karsch, E. Laermann, Y. Maezawa, S. Mukherjee, H. Ohno, P. Petreczky, H. Sandmeyer, P. Steinbrecher, C. Schmidt, S. Sharma, W. Soeldner and M. Wagner, Phys. Rev. D 95 (2017) 054504; arXiv:1701.04325 [hep-lat].
- [13] R.V. Gavai and S. Gupta, Phys. Rev. D 78 (2008) 114503.
- [14] S. Datta, R.V. Gavai and S. Gupta, Nucl. Phys. A 904-905 (2013) 883c.
- [15] P. de Forcrand and O. Philipsen, J. High Energy Phys. JHEP01 (2007) 077.
- [16] M.P. Lombardo, J. Phys. G: Nucl. Part. Phys. 35 (2008) 104019.
- [17] G.D. Yen, M.I. Gorenstein, W. Greiner, S.N. Yang, Phys. Rev. C 56 (1997) 2210.
- [18] Sz. Borsányi, G. Endrődi, Z. Fodor, S.D. Katz and K.K. Szabó, JHEP 1207 (2012) 056; arXiv:1204.6184 [hep-lat].
- [19] L. Giusti and M. Pepec, Phys. Lett. B 769 (2017) 385; arXiV:1612.00265 [hep-lat].
- [20] M. Albright, J. Kapusta and C. Young, Phys. Rev. C 90 (2014) 024915; arXiv:1404.7540 [nucl-th].
- [21] M. Tanabashi et al. (Particle Data Group), Phys. Rev. D 98 (2018) 030001.
- [22] P.A. Zyla et al. (Particle Data Group), Prog. Theor. Exp. Phys. 2020 (2020) 083C01 and 2021 update.
- [23] M. Albaladejo and J.A. Oller, Phys. Rev. D 86, (2012) 034003.
- [24] J. Cleymans, H. Oeschler, K. Redlich and S. Wheaton, Phys. Rev. C 73 (2006) 034905.
- [25] V. Vovchenko, V.V. Begun and M.I. Gorenstein, Phys. Rev. C 93 (2016) 064906; ibid Journal of Physics: Conf. Series 779 (2017) 012080.
- [26] A. Andronic, P. Braun-Munzinger, J. Stachelf and M. Winn, Phys. Let. B 718 (2012) 80.
- [27] P. Braun-Munzinger, D. Magestroa, K. Redlich and J. Stachel, Phys. Let. B 518 (2001) 41.
- [28] A. Andronic, P. Braun-Munzinger and J. Stachel, Nucl. Phys. A 772 (2006) 167.
- [29] A. Bohr, B. Mottelson, Nuclear Structure, vol. 1, Benjamin, New York, 1969, p. 251.
- [30] L.D. Roper, R.M. Wright, B.T. Feld, Phys. Rev. 138 (1964) 190.
- [31] P. Braun-Munzinger, I. Heppe and J. Stachel, Phys. Lett. B 465 (1999) 15.
- [32] M. Marczenko, D. Blaschke, K. Redlich, C. Sasaki, arXiv:1805.06886 [nucl-th]; idid, ibid talk at the CPOD-2018 Conference, Corfu, 23-26 September 2018.
- [33] S. Mukherjee, “QCD phase-diagram: searching for criticality”, talk at “Critical Point and Onset of Deconfinement”, Corfu, 2018. https://indico.cern.ch/event/731446/.
- [34] K.A. Bugaev, A.I. Ivanytskyi, V.V. Sagun, B.E. Grinyuk, D.O. Savchenko, G.M. Zinovjev, E.G. Nikonov, L.V. Bravina, E.E. Zabrodin, D.B. Blaschke, A.V. Taranenko, L. Turko, Universe 5 (2019) 63.
- [35] V. Vovchenko, M. Gorenstein, C. Greiner, H. Stoecker, Phys. Rev. C 99 (2019) 045204; arXiv:1811.05737 [hep-ph].
- [36] R. Bellwied, C. Ratti, S. Borsányi, P. Parotto, Z. Fodor, J. N. Guenther, S.D. Katz, A. Pásztor, D. Pesznyák, K.K. Szabó, Phys. Rev. D 104 (2021) 094508; arXiv:2102.06625 [hep-lat].
- [37] S. Borsányi, Z. Fodor, J.N. Guenther, R. Kara, S.D. Katz, P. Parotto, A. Pásztor, C. Ratti, K.K. Szabó, Phys. Rev. Lett. 125 (2020) 052001.
- [38] F. Becattini, M. Bleicher, T. Kollegger, T. Schuster, J. Steinheimer, R. Stock, Phys. Rev. Lett. 111 (2013) 082302.