11email: nayazatyan@bao.sci.am
Investigation of the stellar content in the IRAS 05168+3634 star-forming region
Abstract
Aims. We report the investigation results of the structure and content of a molecular cloud surrounding the source IRAS 05168+3634 (also known as Mol 9).
Methods. We present a photometric analysis using the data of J, H, K UKIDSS, [3.6], [4.5] m -IRAC and 3.4, 4.6, 12, 22 m WISE databases. A multi-color criteria was used to identify the candidates of young stellar objects (YSOs) in the molecular cloud; in addition to IRAS 05168+3634, there are four IRAS sources embedded in the same molecular cloud. Color-magnitude diagrams and the K luminosity function (KLF) were used to determine the basic parameters of stellar objects (spectral classes, masses, ages). To study the YSOs with longer wavelength photometry the radiative transfer models were used.
Results. Based on color-color and color-magnitude diagrams, we identified a rich population of embedded YSO candidates with infrared excess (Class 0/I and Class II) and their characteristics in a quite large molecular cloud located in a region of 24 arcmin radius. The molecular cloud includes 240 candidates of YSOs within the radii of subregions around five IRAS sources. The local distribution of identified YSOs in the molecular cloud frequently shows elongation and subclustering. The observed young subregions and parental molecular cloud morphologies are similar, especially when only the youngest Class I/0 sources are considered. The color-magnitude diagrams of the subregions suggest a very young stellar population. We construct the KLF of the subregions except for the IRAS 05162+3639 region) and it shows unusually low values for slope: 0.12–0.21. According to the values of the slopes of the KLFs, the age of the subregions can be estimated at 0.1–3 Myr. The spectral energy distributions (SEDs) are constructed for 45 Class I and 75 Class II evolutionary stage YSOs and the received parameters of these YSOs are well correlated with the results obtained by other methods.
Key Words.:
stars: pre-main sequence – stars: luminosity function – infrared: stars – radiative transfer – ISM: individual objects: IRAS 05168+36341 Introduction
Young embedded stellar clusters are important laboratories for understanding star formation process and early stellar evolution because they contain a statistically significant sample of stars formed from the same parental interstellar matter. The development of sensitive, large-format imaging arrays at near- and mid-infrared (NIR and MIR), submillimeter, and radio wavelengths has made it possible to obtain statistically significant and complete sampling of young embedded clusters within molecular clouds.
The widely accepted scenario of low- and intermediate-mass star formation is that they are formed by gravitational collapse, and the subsequent accretion of their parent molecular clouds and driving collimated outflows. However, the main mechanism leading to the formation of massive stars is debated as to whether it is disk accretion similar to that for lower mass stars (Yorke & Sonnhalter 2002). Unlike low-mass stars, the high-mass star evolution is a fast process that lasts for no more than about 106 yr including the main sequence. During their formation, massive stars usually stay within their birth sites in clustered environments (Guan et al. 2008a).
In this paper, we present a detailed study of a star-forming region in the vicinity of IRAS 05168+3634, which is also known as Mol 9 in the catalogue of Molinari et al. (1996). Within a 2 arcmin radius of IRAS 05168+3634, three objects have been detected with magnitudes of the Midcourse Space Experiment (MSX) survey (Egan et al. 2003), one of which is associated with IRAS 05168+3634. Zhang et al. (2005) have discovered a molecular outflow in this region.
IRAS 05168+3634 is a luminous young stellar object (YSO) (longitude = 170.657, latitude = -00.27) with estimated L=24 (Varricatt et al. 2010); it is located in a high-mass star-forming region in the pre-UC HII phase (Wang et al. 2009). Compact H II regions and H2O maser are sites of ongoing high-mass star formation which have not completely disrupted the surrounding dense, molecular gas. Thus, we have an opportunity to examine the stellar population in its initial configuration, before the rapid dynamical evolution which may occur once the molecular gas is cleared by stellar winds and the expanding region (Lada et al. 1984). There have been various detections in the region: H2O maser emission (Zhang et al. 2005), NH3 maser emission (Molinari et al. 1996), CS emission (Bronfman et al. 1996), a new detection of 44 GHz CH3OH methanol maser emission (Fontani et al. 2010), the SiO (J = 2–1) line (Harju et al. 1998), the main lines at 1665 MHz and 1667 MHz OH maser (Ruiz-Velasco et al. 2016), and four 13CO cores (Guan et al. 2008b). No radio source has been associated with IRAS 05168+3634. Molinari et al. (1998) have detected 6 cm radio emission 102 arcsec away from IRAS 05168+3634.
The embedded stellar cluster in this region was detected in the NIR and MIR by various authors (Kumar et al. 2006; Faustini et al. 2009; Azatyan et al. 2016). In Azatyan et al. (2016) it was shown that this is a bimodal cluster with 1.5 arcmin radius from geometric center of the cluster that does not coincide with IRAS 05168+3634. One of the subgroups is concentrated around IRAS 05168+3634 and it should be noted that it does not contain a rich population compared to other concentrations.
The distance estimations of this region are different. A kinematic distance was estimated of 6.08 kpc (Molinari et al. 1996) based on systemic local standard of rest (LSR) velocity VLSR = 15.51.9 km/s. The trigonometric parallax of IRAS 05168+3634 with VERA is 0.5320.053 mas, which corresponds to a distance of kpc, placing the region in the Perseus arm rather than the Outer arm (Sakai et al. 2012). This large difference of estimated distances causes some significant differences in physical parameters for individual members.
In the present paper, we tabulate of the YSO candidates in this star-forming region and discuss their spatial distribution. The observational data used to make the subsequent analysis are discussed in Section 2. The results and discussion are given in Section 3, and Section 4 concludes with the results of this work.
2 Observational data
For our study we used the data covering a wide infrared (IR) range from NIR to far-infrared (FIR) wavelengths. The first is the archival NIR photometric data and images in the J, H, and K bands of the Galactic Plane Survey DR6 (GPS, Lucas et al. 2008) with a resolution of 0.1 ″ /px, which is one of the five surveys of the UKIRT Infrared Deep Sky Survey (UKIDSS). UKIDSS GPS is complete to approximately 18.05 K mag, and for individual objects provides a probability (in percent) of being a star, galaxy, and noise accessible in VizieR service.
Mid-IR wavelengths are ideal for studying disks because these wavelengths are well removed from the peak of the underlying stellar energy distribution, resulting in much greater excesses over the underlying stellar photosphere. Archival MIR observations of this region were obtained using the Space Telescope under the Galactic Legacy Infrared Midplane Survey Extraordinaire 360 (GLIMPSE 360) program (Churchwell et al. 2009). GLIMPSE 360 observations were taken using the InfraRed Array Camera (IRAC, Fazio et al. 2004) in 3.6, 4.5 m bands with a resolution of 0.6 ″ /px. The point source photometric data in this star-forming region were downloaded from the NASA/IPAC Infrared Science Archive. We also used the Wide-field Infrared Survey Explorer (WISE, Wright et al. 2010) (3.4 m, 4.6 m, 12 m, and 22 m) and the MSX surveys (8.28 m, 12.13 m, 14.65 m, and 21.3 m) accessible in VizieR.
Since high-mass star formation happens deeply embedded, only observations at FIR and longer wavelengths can penetrate inside, and therefore provide essential information about such star-forming regions. This information may be provided by FIR wavelengths, in the range 70–500 m, obtained by using the Photodetector Array Camera and Spectrometer (PACS, Poglitsch et al. 2010) and the Spectral and Photometric Imaging Receiver (SPIRE, Griffin et al. 2010) on the 3.5 m Space Observatory (Pilbratt et al. 2010). For our analyses, we used PACS 70, 160 m and SPIRE 250, 350, and 500 m photometric data and images with resolutions varying from 5.5 ″ to 36 ″ . The point and extended source photometry were downloaded from the NASA/IPAC Infrared Science Archive. PACS data have better resolution with respect to the IRAS mission data; for this reason we used the data from the PACS 70 and 160 m catalogs instead of IRAS 60 and 100 m data.
3 Results and discussion
3.1 Structure of the molecular cloud
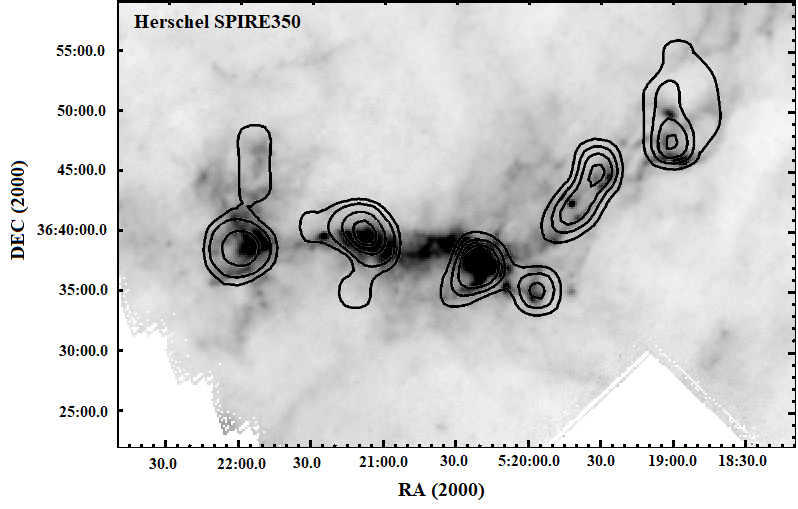
The IRAS 05168+3634 star-forming region has a more complicated structure in the FIR wavelengths than in the NIR and MIR. The complex structure of the region is clearly visible especially in the images of the PACS 160 m and SPIRE 250, 350, 500 m bands. Figure 1 shows the region in different wavelengths from NIR to FIR. Moving toward longer wavelengths in the PACS 160 m and the SPIRE 250, 350, 500 m bands images, the cloud filaments surrounding IRAS 05168+3634 become more visible and it is obvious that the IRAS 05168+3634 star-forming region is not limited in 1.5 arcmin radius from geometric center (Azatyan et al. 2016) but is more extended and is located within a 24 arcmin radius molecular cloud where the center of the molecular cloud is the conditionally selected source IRAS 05168+3634. Studying the common star-forming region in the molecular cloud, it turns out that apart from IRAS 05168+3634, there are four IRAS sources (IRAS 05184+3635, IRAS 05177+3636, IRAS 05162+3639, and IRAS 05156+3643) embedded in the same molecular cloud. On the MIR [4.5] m band image can be clearly seen that these IRAS objects, like IRAS 05168+3634, have a concentration of sources around them. There is very little information about these IRAS sources. IRAS 05184+3635 and IRAS 05177+3636 are associated with dark clouds DOBASHI 4334 and 4326, respectively (Dobashi 2011). In Casoli et al. (1986) the distances of IRAS 05184+3635 and IRAS 05177+3636 were assessed based on the 13CO velocities: -17 km/s and -15 km/s, respectively, as a result of which both IRAS 05184+3635 and IRAS 05177+3636 were evaluated at the same 1.4 kpc distance. The latter value coincides with the distance of IRAS 05168+3634 based on trigonometric parallax. This also indicates that these IRAS sources are most likely to be found in the same molecular cloud. On the other hand, Wouterloot & Brand (1989) estimated the distance of IRAS 05184+3635 based on the CO () line parameters, taking into account the same -17 km/s velocity value, at a distance of 9.4 kpc. It should be noted that it is hard to say which of the estimated distances is correct. There are two objects near IRAS 05177+3636 detected at submillimeter wavelengths (Di Francesco et al. 2008). IRAS 05162+3639 is associated with the H2O maser (Sunada et al. 2007). A high proper-motion star has been detected in the LSPM-NORTH catalog 0.35 arcmin from the IRAS 05156+3643 (Lépine & Shara 2005) probably compatible with IRAS 05156+3643 within the error bars.
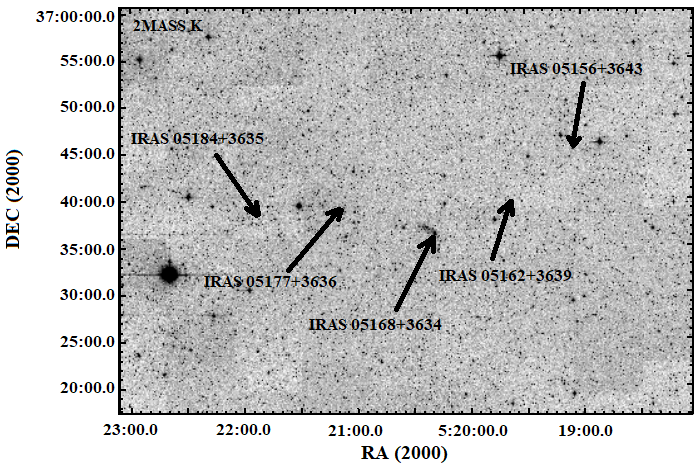
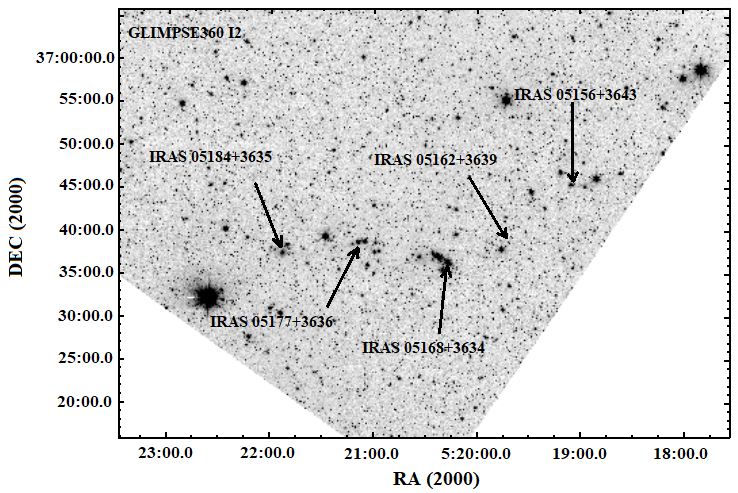
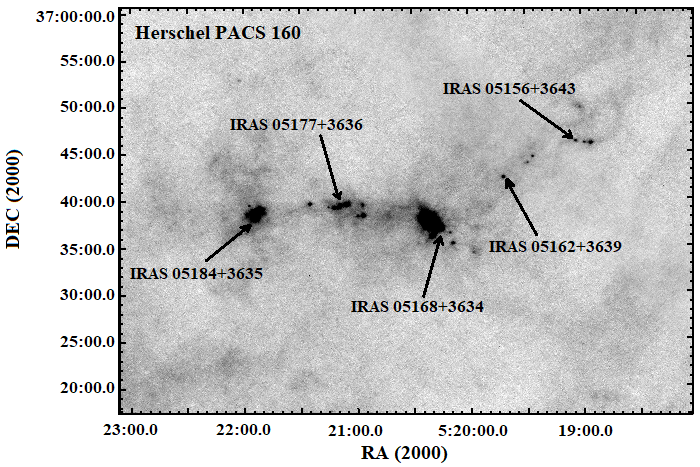
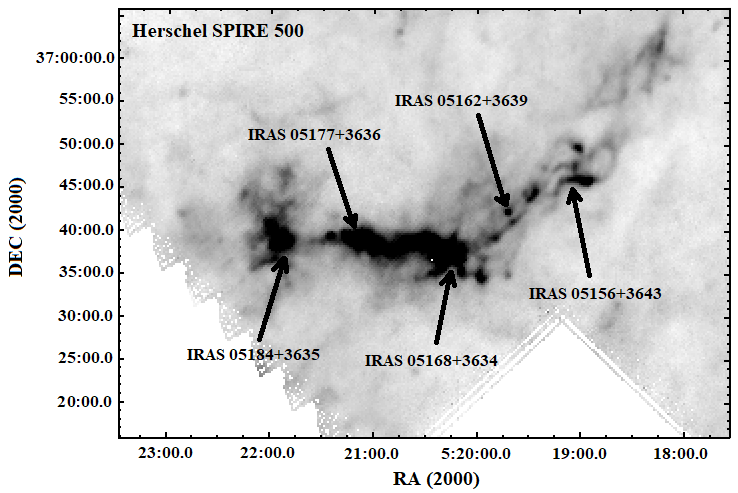
We have constructed a map of the distribution of stellar surface density within a 48 ′ 48 ′ region to investigate the structure of each concentration in the molecular cloud, using photometric data of the PACS Point Source Catalog: 160 m and Extended Source List (red band). The density was determined simply by dividing the number of stellar objects in a 200 ″ 200 ″ area with a step size of 100 ″ . Figure 2 shows the map of the distribution of stellar surface density based on PACS 160 m photometry.
In the case of the homogeneous distribution of stars in the field, it is known that the number of stars is comparable to the surface area occupied by those stars. We wanted to determine how much the distribution of stars in this field differs from the homogeneous distribution. Table 1 shows the surface area of all subregions according to the isodences in Col. 2 and the number of stars on those surface areas in Col. 3. The labels STR and STotal are the total surface area of five subregions and the surface area within a 24 arcmin radius (IRAS 05168+3634 is considered the center), respectively. The ratios of STR/STotal=0.02 and NTR/NTotal=0.7 indicate what fraction of the surface area within a 24 arcmin radius is the total surface area of the subregions and how much of the objects in the whole field are on the total surface area of the subregion, respectively.
| Name | Surface area | Objects |
|---|---|---|
| (arcmin2) | ||
| (1) | (2) | (3) |
| IRAS 05184+3635 | 5.245 | 6 |
| IRAS 05177+3636 | 10.072 | 7 |
| IRAS 05168+3634 | 11.14 | 7 |
| IRAS 05162+3639 | 5.384 | 6 |
| IRAS 05156+3643 | 10.068 | 6 |
| STR= 41.909 | NTR= 32 | |
| STotal=1808.64 | NTotal=43 |
From these values, it is possible to estimate the difference between the distribution of stars in our field and the homogeneous distribution. As a result, the distribution of stars in our field is 35 times different from the homogeneous distribution, which is a fairly high value. On the other hand, the distribution of sources in the field repeats the shape of the molecular cloud seen in FIR wavelengths, which suggests that the distribution of these subregions is not accidental, that is, they are connected to each other and belong to the same molecular cloud. From this, we can conclude with high probability that all five IRAS star-forming regions are at the same distance. Since only the IRAS 05168+3634 star-forming region has estimated distances (see Section 1), we can say that IRAS 05184+3635, IRAS 05177+3636, IRAS 05162+3639, and IRAS 05156+3643 are also located at a distance of 6.08 kpc (kinematic estimation) or 1.88 kpc (based on the trigonometric parallax). These distance estimations are used in future calculations in this paper.
3.2 Selection of objects
For the selection of objects in the molecular cloud, we used the data of NIR, MIR, and FIR catalogs (see Section 2) within a radius of 24 arcmin concerning the conditionally selected IRAS 05168+3634. We chose GPS UKIDSS-DR6 as the main catalog, and the other catalogs were cross-matched with it. As was mentioned in Section 2, the GPS UKIDSS-DR6 catalog for individual objects provides a probability (in percent) of being a star, galaxy, and noise; therefore, we selected objects with a probability of being noise ¡ 50%, and taking into account the completeness limit of UKIDSS survey in K band, the objects that have a measured magnitude of K18.02 were removed from the list. This yielded approximately 48000 objects. The MIR and FIR photometric catalogs were cross-matched with the GPS UKIDSS-DR6 catalog within 3 of combined error matching radius (Col. 3 in Table 2). Matching radii are evaluated taking into account the positional accuracy of each catalog (Col. 2 in Table 2). However, several catalogs provide photometric measurements for extended sources, for which positional errors are larger than values provided in catalogs. These catalogs are the PACS Point Source Catalog: Extended Source List and the SPIRE Point Source Catalog: 250,350,500 m; therefore, the cross-match was done by eye for these catalogs and then a combined photometric catalog was obtained. In the next sections, the set of steps that we used to identify the YSOs.
| Catalog name | Positional accuracy | 3 of combined error | Reference |
| (arcsec) | (arcsec) | ||
| (1) | (2) | (3) | (4) |
| GPS UKIDSS-DR6 | 0.3 | 1 | |
| GLIMPSE 360 | 0.3 | 1.2 | 2 |
| ALLWISE | 1 | 3 | 3 |
| MSX | 3.3 | 10 | 4 |
| IRAS | 16 | 48 | 5 |
| PACS:Extended source | 2.4 | 7.2 | 6 |
| PACS: 70 m | 1.5 | 5 | 7 |
| PACS: 160 m | 1.7 | 5.2 | 8 |
| SPIRE:250,350,500 m | 1.7 | 5.2 | 9 |
1. Lucas et al. (2008); 2. Churchwell et al. (2009); 3. Wright et al. (2010); 4. Egan et al. (2003); 5. Neugebauer et al. (1984); 6. Maddox et al. (2017); 7. Poglitsch et al. (2010); 8. Poglitsch et al. (2010); 9. Griffin et al. (2010). 222 (1) Name of catalog used, (2) Positional accuracy of each catalog, (3) 3 of combined error of cross-matched catalogs, (4) Source of data used.
3.3 Color-color diagrams
According to the star formation theory, the IR excess of young stars is caused by a circumstellar disk and gas-dust envelope, which are known as two of the main characteristics of YSOs (Lada & Lada 2003; Hartmann 2009). Therefore, it is possible to carry out the selection of YSOs in the region as they contain the IR excess in the NIR and/or MIR ranges.
One of the most powerful tools for identifying YSO candidates via reddening and excess is their location on color-color diagrams. The choice of colors depends on the available data. We have constructed four color-color diagrams. The investigated region is quite large and there is a high probability of selecting objects that do not belong to the molecular cloud as a result of photometric measurement errors; therefore, we chose as YSOs those stars that are classified as objects with IR excess in at least two color-color diagrams to minimize the likelihood of choosing incorrectly.
The first IR excess object identification was carried out with (J-H) versus (H-K) color-color diagram. Figure 3 (top left panel) shows the (J-H) versus (H-K) color-color diagram where the solid and dashed curves represent the locus of the intrinsic colors of dwarf and giant stars, taken from Bessell & Brett (1988) after being converted to the CIT system using the relations given by Carpenter (2001). The parallel solid lines drawn from the base and tip of the dwarf and giant loci, are the interstellar reddening vectors (Rieke & Lebofsky 1985). The locus of unreddened classical T Tauri stars (CTTSs) is taken from Meyer et al. (1997). The region bounded by the dashed lines where the pre-main sequence (PMS) stars with intermediate mass, i.e., Herbig Ae/Be stars are usually found (Hernández et al. 2005). The objects with different evolutionary stages have certain places in this diagram (Lada & Adams 1992): Classical Be stars, objects located to the left and objects located to the right of reddening vectors. Classical Be stars have J-K ¡ 0.6 and H-K ¡ 0.3 color indexes, and we removed them from the list. There is no real physical explanation for those objects which are located to the left of reddening vectors, so we also removed these objects. However, it is possible that among Classical Be stars and objects located to the left of reddening vectors that there will be objects that belong to a molecular cloud. For further study, we chose objects located to the right of reddening vectors and the deviation of YSOs from the main sequence (MS) on this diagram can have two causes: the presence of IR excess and interstellar absorption, which also leads to the reddening of an object. In the latter case, the deviation from MS will be directed along reddening vectors. We have selected as YSOs those stars that have a considerable, accurately expressed IR excess.
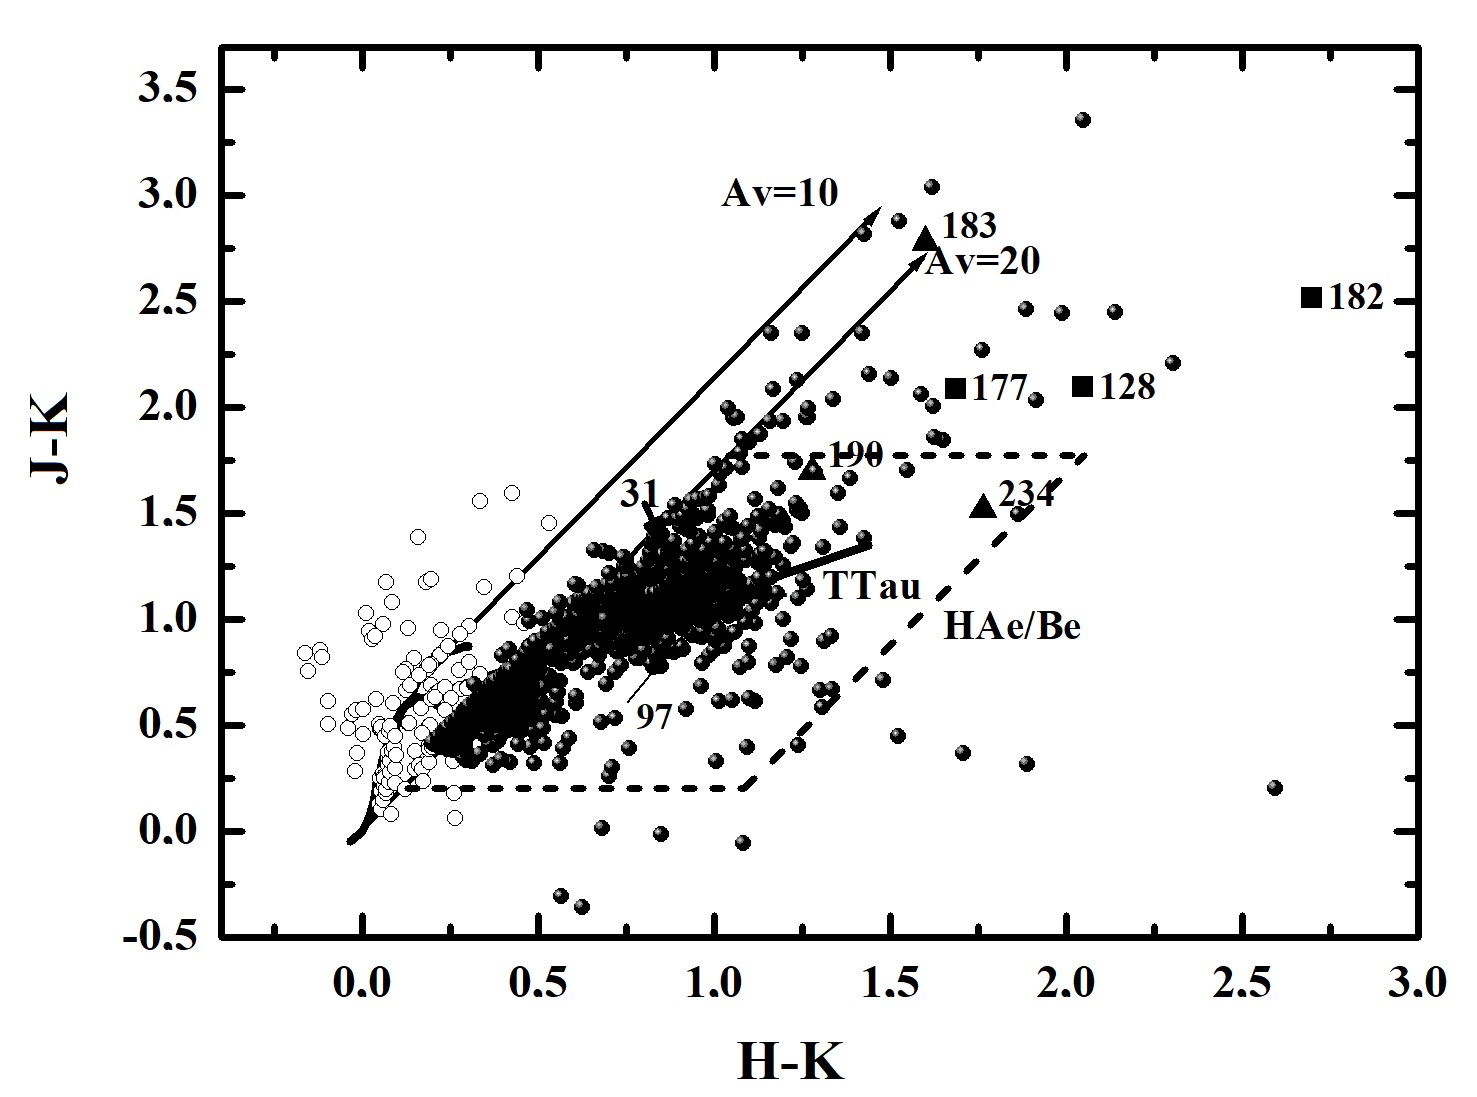
The reddening of classified YSOs cannot be caused only by interstellar absorption and, at least partially, IR excess is created by presence of a circumstellar disk and an envelope. Therefore, the objects that are located to the right of reddening vectors in the (J-H) versus (H-K) diagram can be considered YSO candidates. Among the selected YSOs and objects within the reddening band of the MS and giant, we classified as Class I evolutionary stage objects those which have (J-K) ¿ 3 mag color index (Lada & Adams 1992) and located in the top right in the (J-H) versus (H-K) diagram. Other objects in the reddening band are generally considered to be either field stars or Class III objects with comparably small NIR excess, and making the right selection among them is very difficult, so we added to our list those objects classified as YSOs in at least two other color-color diagrams.
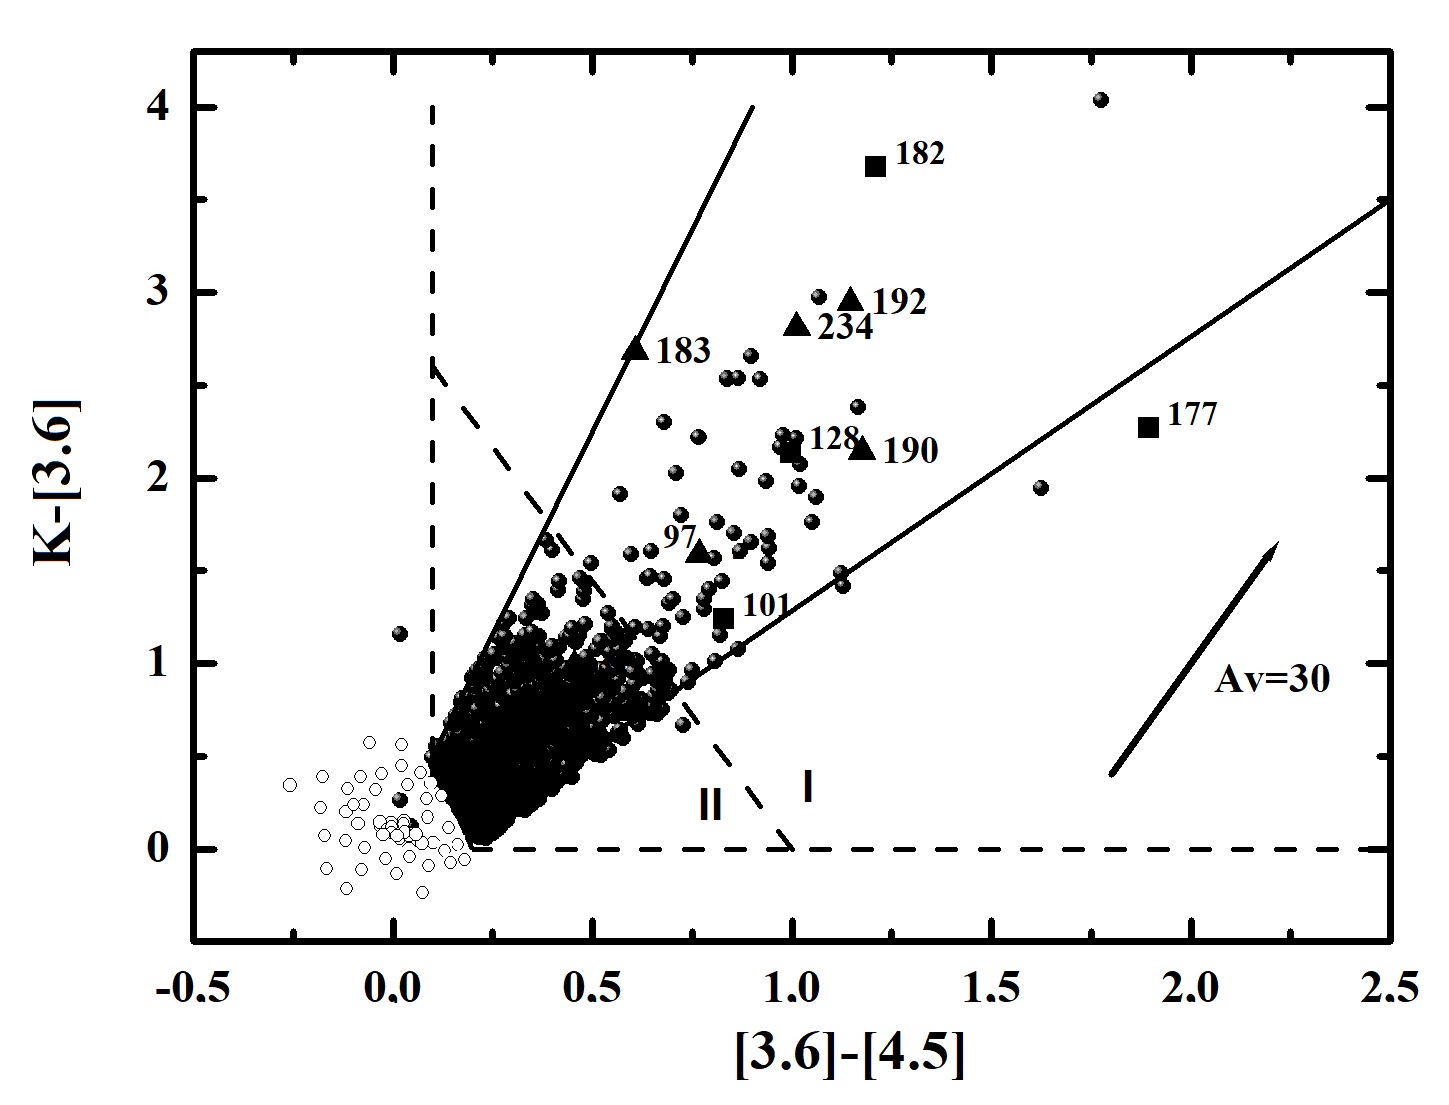
Not all objects in the main sample were detected in J, H, K bands simultaneously; therefore, we used the data of the GLIMPSE 360 catalog to construct color-color diagram combining NIR and MIR photometry in order to identify sources with IR excesses and to compile a more complete excess/disk census for the region. Since the 4.5 m band is the most sensitive band to YSOs of the four IRAC bands (Gutermuth et al. 2006), we used the K-[3.6] versus [3.6]-[4.5] color-color diagram. Figure 3 (top right panel) shows the K-[3.6] versus [3.6]-[4.5] color-color diagram, where the diagonal lines outline the region of location of YSOs with both Class I and Class II evolutionary stages. The de-reddened colors are separated into Class I and II domains by the dashed line. Arrow shows the extinction vector (Flaherty et al. 2007). All the lines in the K- [3.6] versus [3.6]-[4.5] diagram are taken from Allen et al. (2007). Both the (J-H) versus (H-K) and the K- [3.6] versus [3.6]-[4.5] color-color diagrams are widely used for the separation of YSOs with different evolutionary classes (Meyer et al. 1997; Gutermuth et al. 2006; Allen et al. 2007).
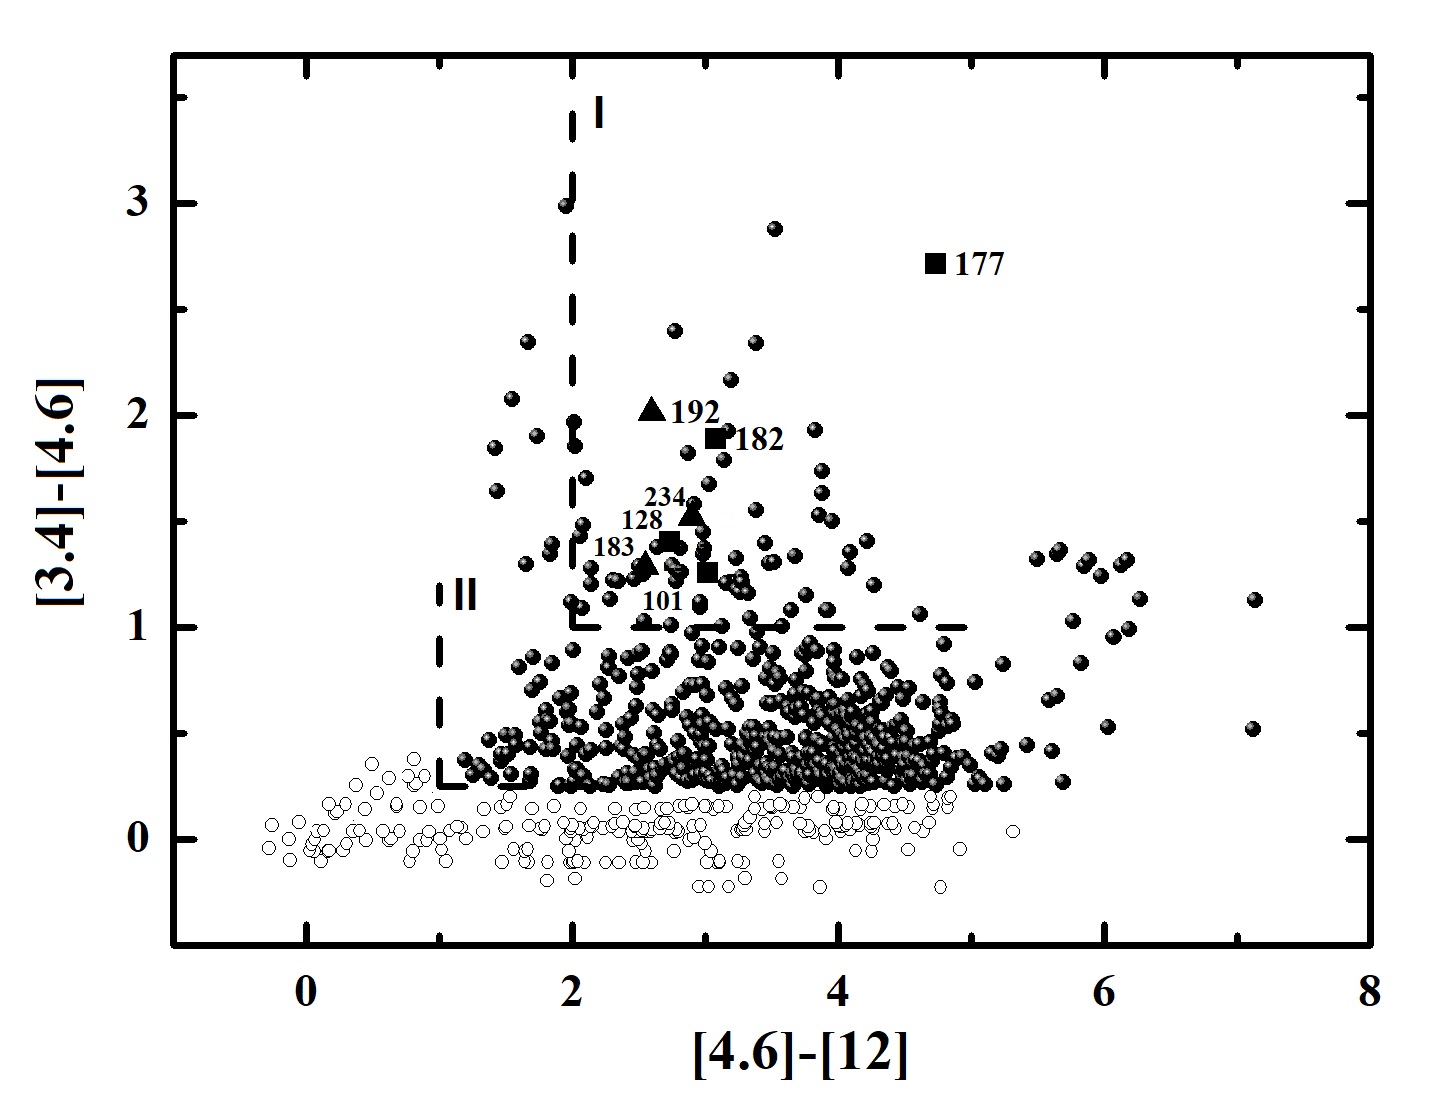
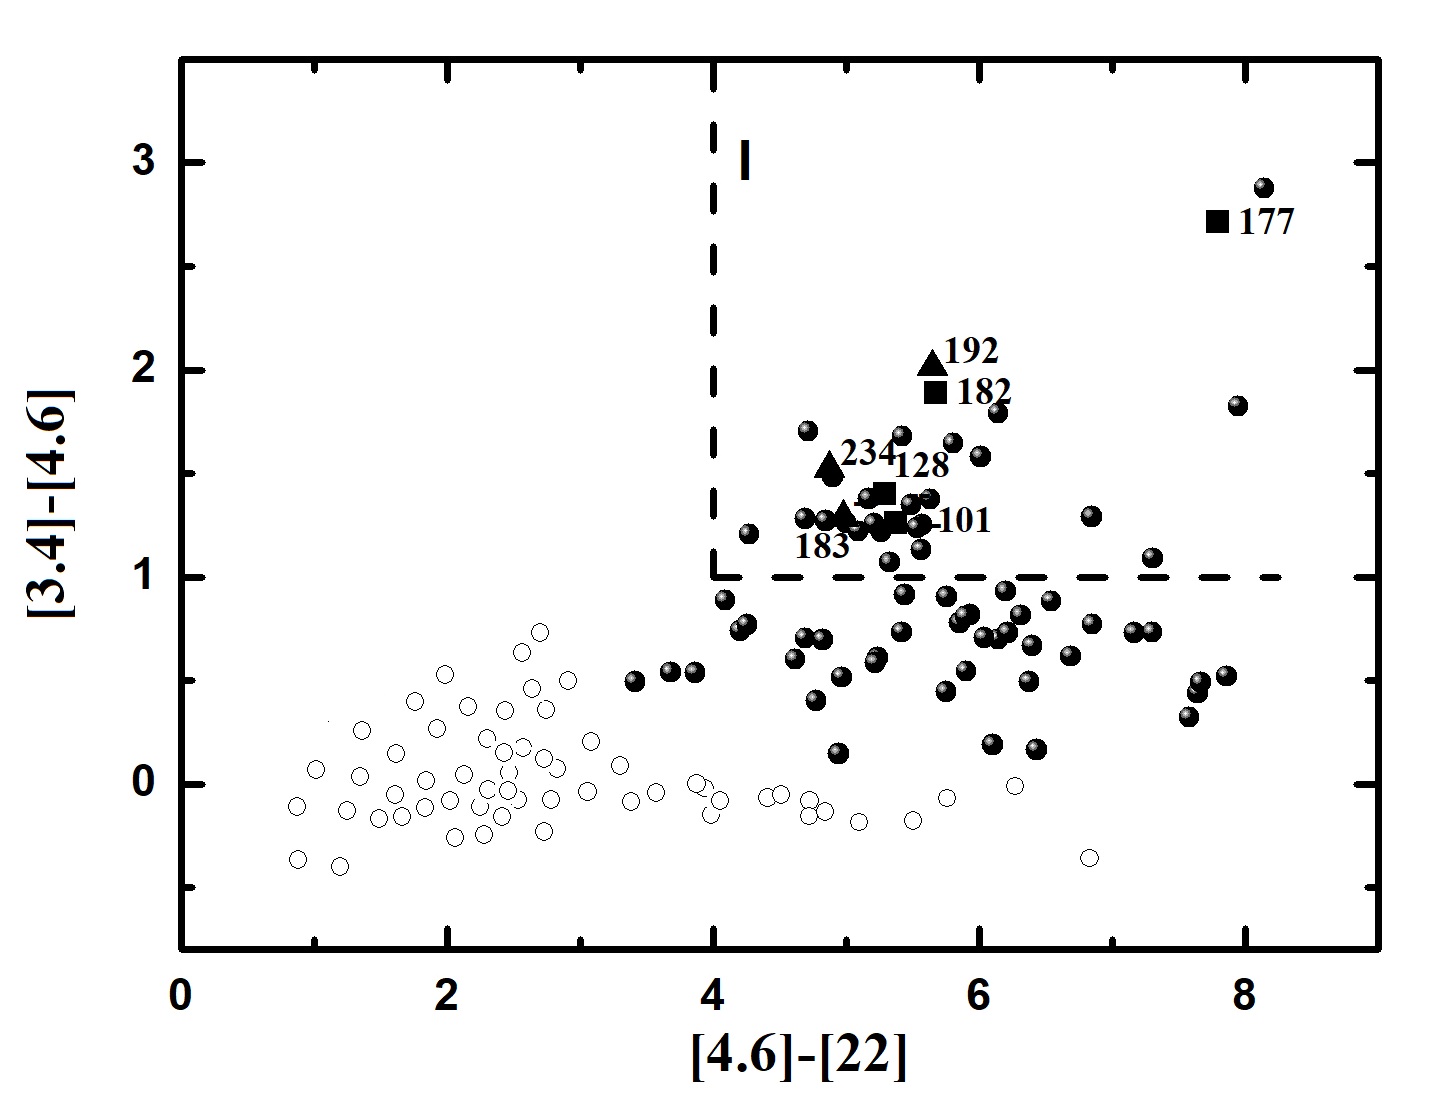
We also constructed two other color-color diagrams using the list of objects with good WISE detections, i.e., those possessing photometric uncertainty ¡ 0.2 mag in WISE bands. Figure 3 (lower left panel) shows the [3.4]-[4.6] versus [4.6]-[12] color-color diagram. As was mentioned for the previous color-color diagrams, the objects with different evolutionary stages are located in certain places in this diagram too (Koenig et al. 2012), i.e., Class I YSOs are the reddest objects, and are selected if their colors match [3.4]-[4.6] ¿ 1.0 and [4.6]-[12] ¿ 2.0. Class II YSOs are slightly less red objects and are selected with colors [3.4]-[4.6]-([3.4]-[4.6]) ¿ 0.25 and [4.6]-[12]-([4.6]-[12]) ¿ 1.0, where (…) indicates a combined photometric error, added in quadrature.
We can check the accuracy of previous classification of stars that possess photometric errors ¡ 0.2 mag in WISE band 4. Previously classified Class I sources were re-classified as Class II if [4.6]-[22] ¡ 4.0 and Class II stars have been placed back in the unclassified pool if [3.4]-[12] ¡ -1.7 ([12]-[22]) + 4.3 (Koenig et al. 2012). However, there are no incorrect selections in the pre-classified objects with 1, 2, 3 bands and it confirms the results obtained in the [3.4]-[4.6] versus [4.6]-[12] color-color diagram (Figure 3, lower right panel).
In total, we selected 1224 YSOs within a 24 arcmin radius, and they are indicated with filled circles. IRAS and MSX sources are indicated by triangles and squares, respectively, and they are labeled in the diagrams. Unfortunately, with this kind of selection of YSOs we cannot find the exact number of YSOs. T Tauri objects with comparably small amounts of NIR excesses may be located in the reddening band, and therefore are excluded from the selection. On the other hand, there can be fore-/background objects among the selected YSOs.
Figure 4 shows the distribution of classified YSOs in the field. Class I and Class II objects are indicated by filled circles and crosses, respectively. It can be clearly seen from the image that Class II objects are distributed more homogeneously on the field than Class I objects, which are located in certain areas and show clear concentrations. This confirms the assumption that, unlike the Class II objects, Class I objects did not have enough time to leave their birthplaces after formation. There are several Class I objects in the field that are far from the main concentrations, and because the distribution of Class I objects is closer to the initial distribution it can be argued that the Class I objects either have some measurement errors in magnitudes or that they do not belong to the molecular cloud. Since the distribution of stars and clearly visible concentrations repeat the shape of the molecular cloud, the probability of superposition is very small because in that case there would be other similar concentrations in the field, which are not detected outside the molecular cloud filaments.
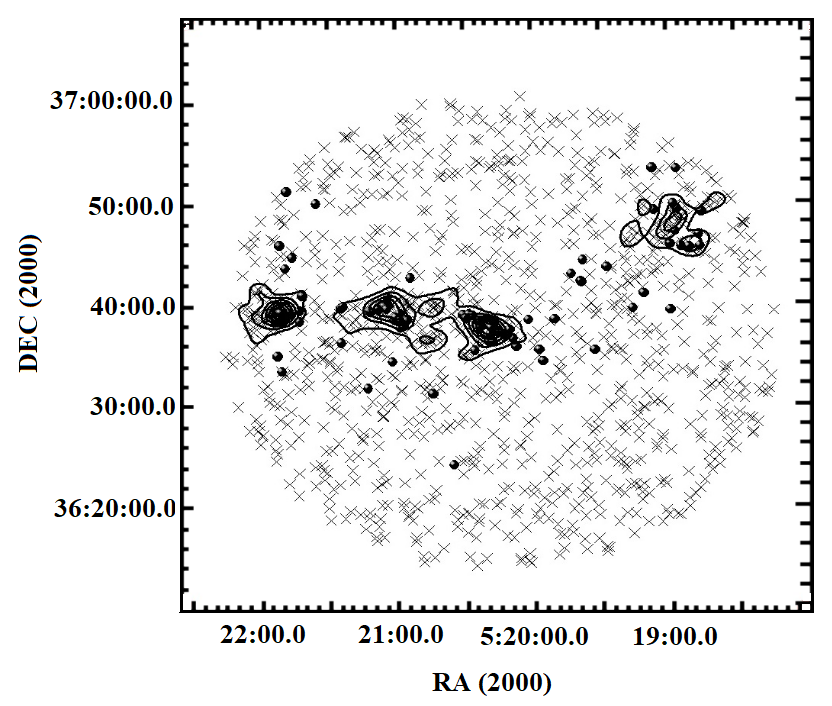
Since the region is quite large, the probability of being fore-/background objects within the selected Class II objects is very high, and in the case of Class I objects that possibility is small as they are not detected outside the molecular cloud filaments. In order to minimize the number of incorrect Class II objects, further investigations will only be performed on concentration areas. For that purpose, we have constructed map of the distribution of stellar surface density within a 48 ′ 48 ′ region to investigate the structure and size of each concentration in the molecular cloud, using the coordinates of selected YSOs. The contours of the distribution of stellar surface density is overplotted on Figure 4 and four subregions are clearly seen, each one surrounding one IRAS source. We refined the radius of each subregion relative to their geometric centers based on the density distribution of selected YSOs. The stellar density was determined for each ring of width 0.1 ′ by dividing the number of stars by the surface area. The radius of the subregions was considered the value from which according to Poisson statistics the fluctuations of the stellar density in the rings become random. Table 3 presents the coordinates of IRAS sources in Cols. 2 and 3, the coordinates of geometric centers are in Cols. 4 and 5, and the radii based on stellar density distribution are in the last column. There is no evidence of a real concentration only around IRAS 05162+3639. On the other hand, two objects from the GPS UKIDSS-DR6 catalog were identified with IRAS 05162+3639 as a result of a cross-match, i.e., IRAS 05162+3639 is probably a binary object and three more Class I objects are located very close to it, but they do not show any real concentration. Therefore, the 0.25 arcmin value of radius given in Table 3 is conditional and includes these three Class I objects and the binary associated with IRAS 05162+3639. As was already mentioned above, the objects within the determined radii will be explored in greater detail, so further studies will be conducted for the 240 YSOs of the 1224 selected from color-color diagrams; this total number of objects falls within the already-defined radii of five subregions. However, with this kind of choice, we lose a large number of objects that are actually located in the molecular cloud filaments but are left out of the determined radius of subregions. Otherwise, we would increase the number of non-members. Therefore, in this case, it would be possible to insist that the objects belonging to the molecular cloud were chosen as accurately as possible and that each subregion represents a separate star-forming region. Table LABEL:tab:5 shows the catalog of 240 selected YSOs with NIR and MIR photometry, while Table LABEL:tab:6 presents the fluxes for those YSOs which have FIR photometry. In the SPIRE 250, 350, 500 m catalogs, the photometry of objects was determined by four methods: Timeline Fitter value (TML), Daophot, Sussextractor, and Timeline Fitter 2 (TM2). For the slightly extended sources that were accepted in the SPIRE 250, 350, 500 m catalog, the TM2 value provides the best guess for an extended flux (Griffin et al. 2010). All selected YSOs in subregions that have measured fluxes at the 250, 350, 500 m wavelengths are classified as extended sources in the SPIRE 250, 350, 500 m catalogs. Taking into account the above, only TM2 photometry is presented in Table LABEL:tab:6.
| IRAS | (2000) | (2000) | (2000) | (2000) | Radius |
|---|---|---|---|---|---|
| (hh mm ss) | (dd mm ss) | (hh mm ss) | (dd mm ss) | (arcmin) | |
| (1) | (2) | (3) | (4) | (5) | (6) |
| 05184+3635 | 05 21 53.2 | +36 38 20.4 | 05 21 52.6 | +36 39 07.1 | 2.5 |
| 05177+3636 | 05 21 09.4 | +36 39 37.1 | 05 21 02.8 | +36 38 28.5 | 3.5 |
| 05168+3634 | 05 20 16.4 | +36 37 18.7 | 05 20 22.3 | +36 37 33.9 | 3 |
| 05162+3639 | 05 19 38.4 | +36 42 25.0 | 05 19 38.4 | +36 42 25.0 | 0.25 |
| 05156+3643 | 05 19 03.6 | +36 46 15.7 | 05 19 04.0 | +36 48 02.0 | 2.8 |
3.4 Color-magnitude diagrams
The color-magnitude diagram is a useful tool for studying the nature of the stellar population within star-forming regions and for estimating its spectral types. The distribution of the 240 identified YSOs in the K versus J-K color-magnitude diagrams are shown in Figure 5 with different symbols for each subregion. We use the K versus J-K diagram because with this combination we get the maximum contrast between the IR excess produced by the presence of the disk, which affects mostly K, and the interstellar extinction, which has a greater effect on J. In Figure 5 the zero age main sequence (ZAMS, thick solid curve) and PMS isochrones for ages 0.1, 0.5, and 5 Myr (thin solid curves) are taken from Siess et al. (2000). We used the conversion table of Kenyon et al. (1994). The J and K photometry of the selected YSOs are corrected for two different distances: 6.1 and 1.88 kpc because, as mentioned above, all subregions with high probability are located at the same distance (see Section 3.1).
According to the COBE/DIRBE and IRAS/ISSA maps (Schlegel et al. 1998), we have estimated the interstellar extinction (Av) values toward five IRAS sources provided in Table 4. There is data of observations of 13CO cores, providing N column density (Guan et al. 2008b), only in the IRAS 05168+3634 star-forming region and using the conversion factor between column density and interstellar extinction N (Av mag) (Bohlin et al. 1978) have we received a value of Av=4.8 mag for interstellar extinction. The average of both interstellar extinction values (Av=4.5 mag) for the IRAS 05168+3634 star-forming region is used to correct the J and K magnitudes. Correction of the J and K magnitudes for the other four regions was done with the interstellar extinction estimated according to the COBE/DIRBE and IRAS/ISSA maps.
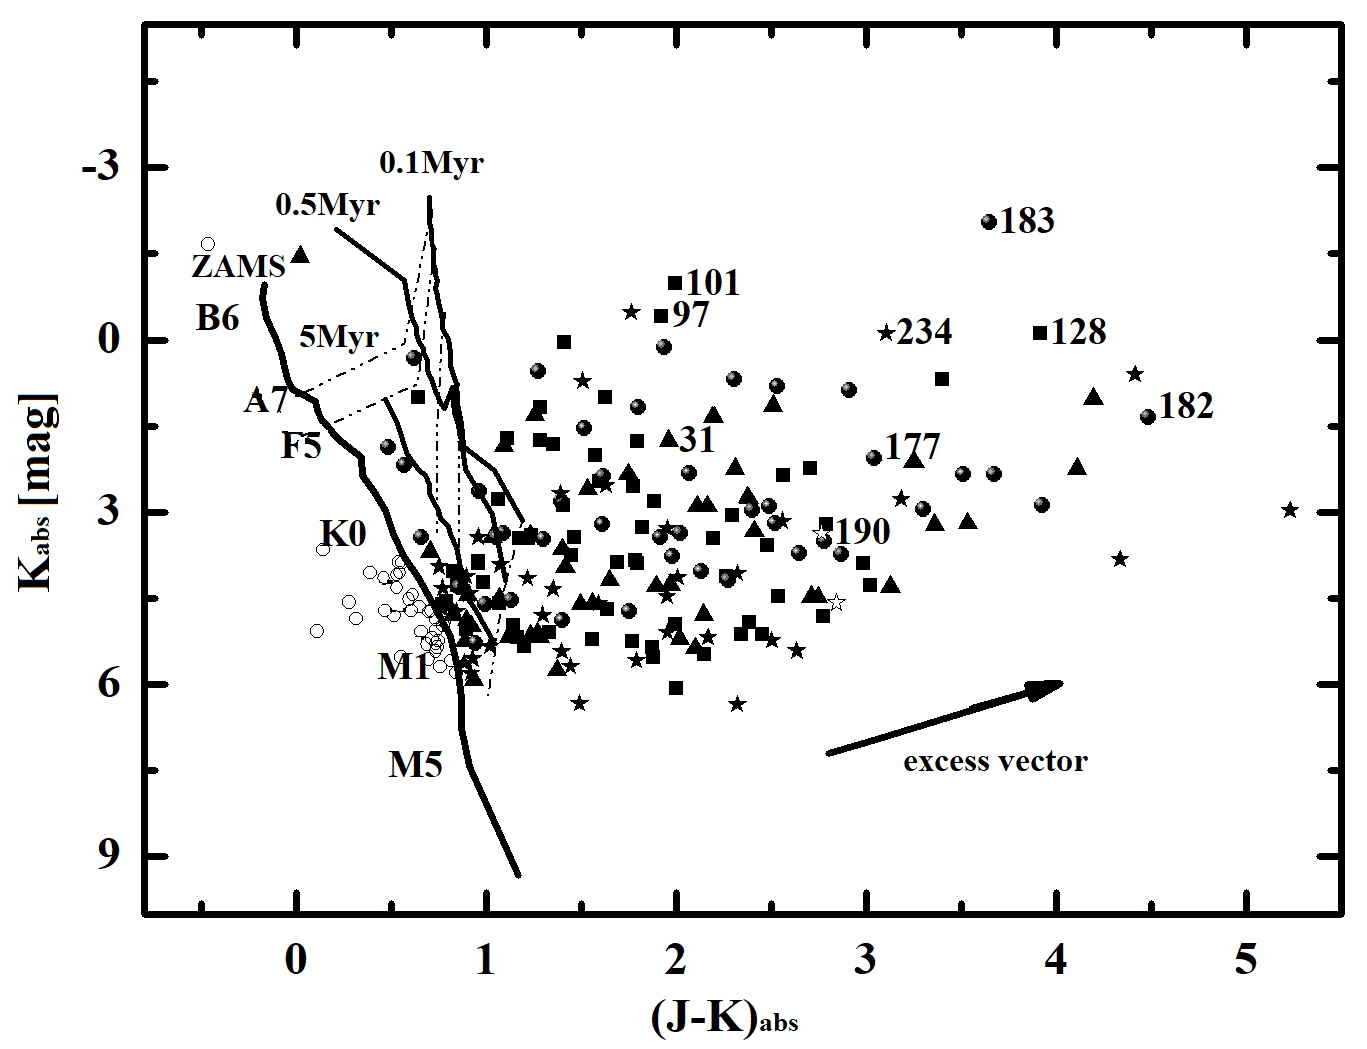
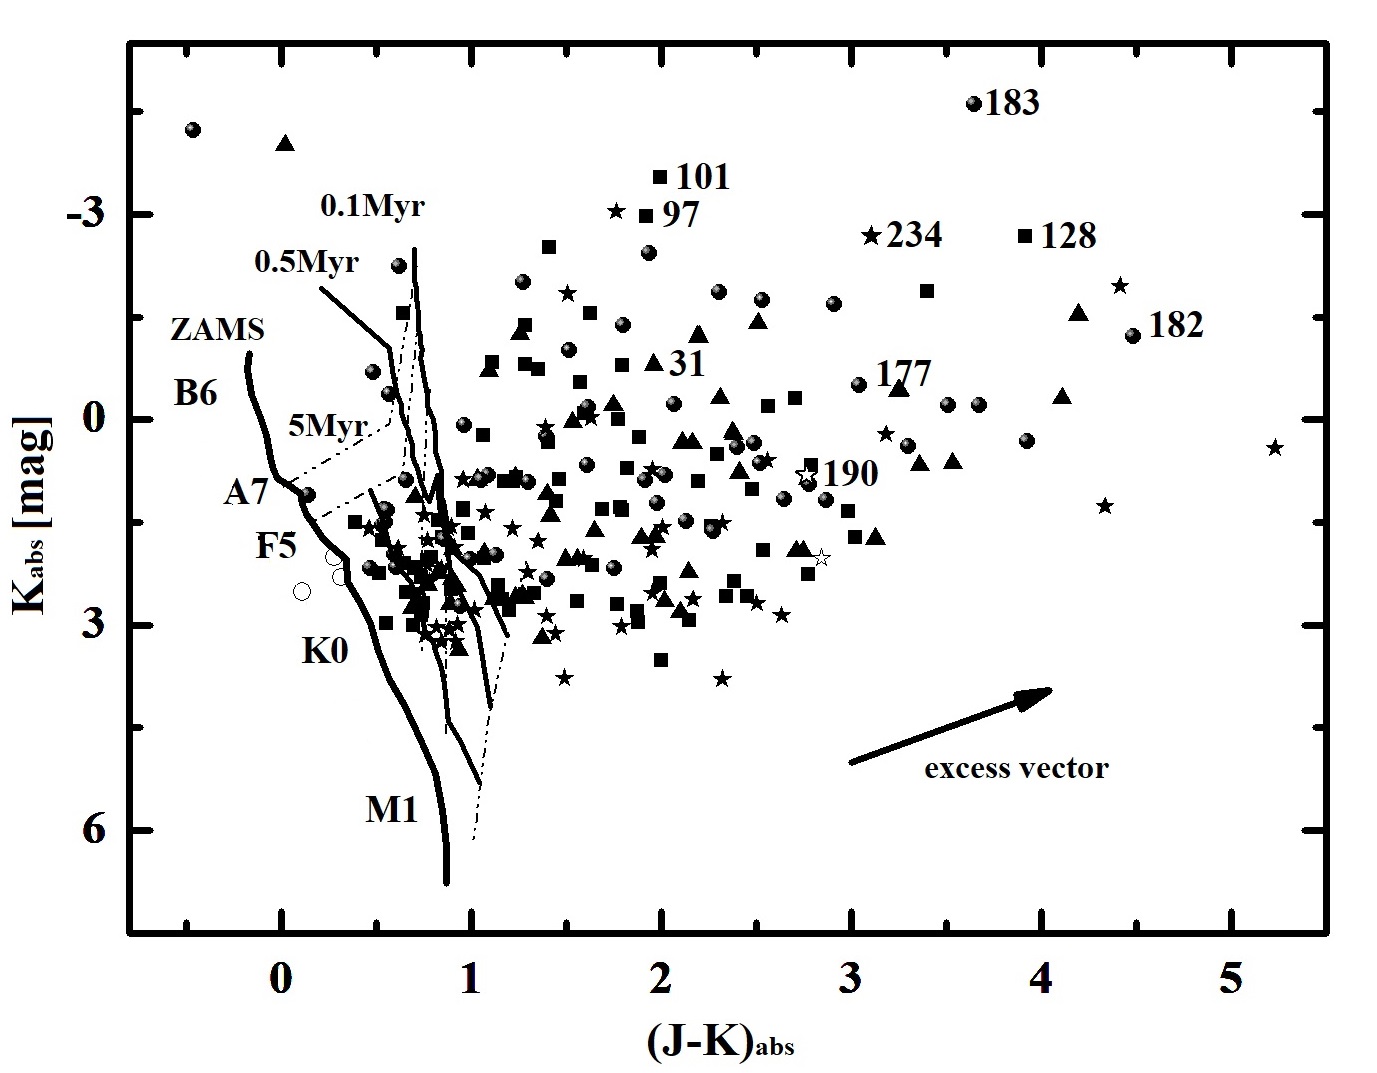
In general, the selected YSOs (according to the color-color diagrams) are distributed to the right of 0.1 Myr isochrones especially in the case of 6.1 kpc distance, and this distribution confirms that they are YSOs. The YSOs associated with IRAS and MSX sources are located within the range of the largest IR excess sources in both color-magnitude diagrams. Only a few identified as YSOs objects in the color-color diagrams are located to the left (open circles) of ZAMS, which means non-membership, i.e., they are probably fore-/background objects. At different distances, the numbers of non-members are different, but it must be taken into account that the J and K magnitude corrections we made for objects belonging to an individual subregion using interstellar extinction values estimated toward IRAS sources only, which means those values would be different from the interstellar extinction values toward each object, and as a result some objects fall left of ZAMS. Thus, those objects were not removed from the list of YSOs (Table LABEL:tab:5), but are shown as open circles in both color-magnitude diagrams. The results of the selection with the color-color and color-magnitude diagrams are presented in the Table 4 separately for each subregion depending on distance.
According to the results of color-color and color-magnitude diagrams, within the selected radius of each subregion the youngest is the IRAS 05168+3634 star-forming region since Class I objects represent a fairly large percentage. The next youngest subregion by Class I objects is IRAS 05177+3636, and it should be noted, even though there is no real concentration around IRAS 05162+3639, that only the Class I objects are inside the conditional selected radius. Finally, the subregions around IRAS 05184+3635 and IRAS 05156+3643 in the outer part of the molecular cloud are the oldest. However, it must be kept in mind that Class II objects have had enough time after formation and have left their birthplaces, so perhaps most of them are beyond the determined dimensions of subregions. Table 4 shows the percentage of Class I objects in each subregion.
The distribution of the YSOs on the K versus J-K color-magnitude diagram can be used to estimate their approximate age and mass based on the evolutionary models for objects with ages older than 1 Myr (Preibisch 2012). It is evident from Figure 5 that the YSOs in the molecular cloud in general are distributed to the right of 1 Myr isochrone, where the estimation of age and mass of those YSOs will be incorrect.
However, the color-magnitude diagrams show a certain distribution of mass in each subregion. Let us try to estimate the mass limit for each subregion. Since NIR color excess, displayed in the color-color diagrams (Figure 3), is usually caused by the presence of disks around young stars, then by incorporating theoretical accreting disk models, the excess effect on the K versus J-K diagram can be accurately represented by vectors of approximately constant slope for disks around Class II T Tauri stars. The components of the vector are (1.01, -1.105) and (1.676, 1.1613) in magnitude units (López-Chico & Salas 2007). More massive YSOs are usually much more embedded than T Tauri stars, and that correction is unlikely to apply to such objects. However, the presence of a spherical envelope around the disk should cause a greater decrease in J-K for the same variation in K, than in the case of a “naked” disk (Cesaroni et al. 2015). Therefore, the López-Chico & Salas (2007) correction can be used to obtain a lower and an upper limit to the mass of each subregion for two different distances. Table 4 shows the results of mass completeness limit determination. Objects located in the IRAS 05184+3635, IRAS 5168+3634, and IRAS 05156+3643 star-forming regions are explicitly targeted at specific mass ranges for two distances, and for objects in the IRAS 05177+3636 star-forming region there is no similar dependency. It can be seen in color-magnitude diagrams and from estimated values of mass completeness limit shown in Table 4 Cols. 10 and 11. For the total content of four real subregions based on excess vector analysis, the following result is derived. At a distance of 1.88 kpc, approximately 80 % of the total content of the subregions have ¡ 1 solar mass, and the remaining 20 % objects have 1–3 solar masses. Only two objects have ¿ 7 solar masses that are clearly distinguished from the rest of the objects in the color-magnitude diagrams. At a distance of 6.1 kpc, approximately 20 % of the total content of the subregions have ¡ 1 solar mass, about 70 % objects have 1–3 solar masses, and the mass was estimated in the range 3–7 solar masses in only 7 % of the cases. There are only five objects with mass ¿ 7 solar masses.
| IRAS | CCD | CMD-1.88 kpc | CMD-6.1 kpc | Class I | Av | Mass limit | slope | ||||
|---|---|---|---|---|---|---|---|---|---|---|---|
| Mem. | Class I | Mem. | Class I | Mem. | Class I | (mag) | Msun | ||||
| (%) | (%) | (%) | 1.88kpc | 6.1kpc | |||||||
| (1) | (2) | (3) | (4) | (5) | (6) | (7) | (8) | (9) | (10) | (11) | (12) |
| 05184+3635 | 52 | 21 | 48 | 23 | 52 | 21 | 11 | 1.4 | 0.3-1.5 | 0.8-5 | 0.12 0.04 |
| 05177+3636 | 79 | 28 | 65 | 34 | 79 | 28 | 22 | 1.34 | 0.2-2.2 | 0.7- ¿7 | 0,2 0.02 |
| 05168+3634 | 57 | 43 | 45 | 54 | 56 | 45 | 24 | 4.3 (4.5) | 0.5-2.5 | 0.9- ¿7 | 0.21 0.05 |
| 05162+3639 | 5 | 5 | 5 | 5 | 1.23 | ||||||
| 05156+3643 | 47 | 20 | 40 | 23 | 47 | 20 | 9 | 1.03 | 0.2-1.6 | 0.6-3 | 0.15 0.04 |
3.5 K luminosity function
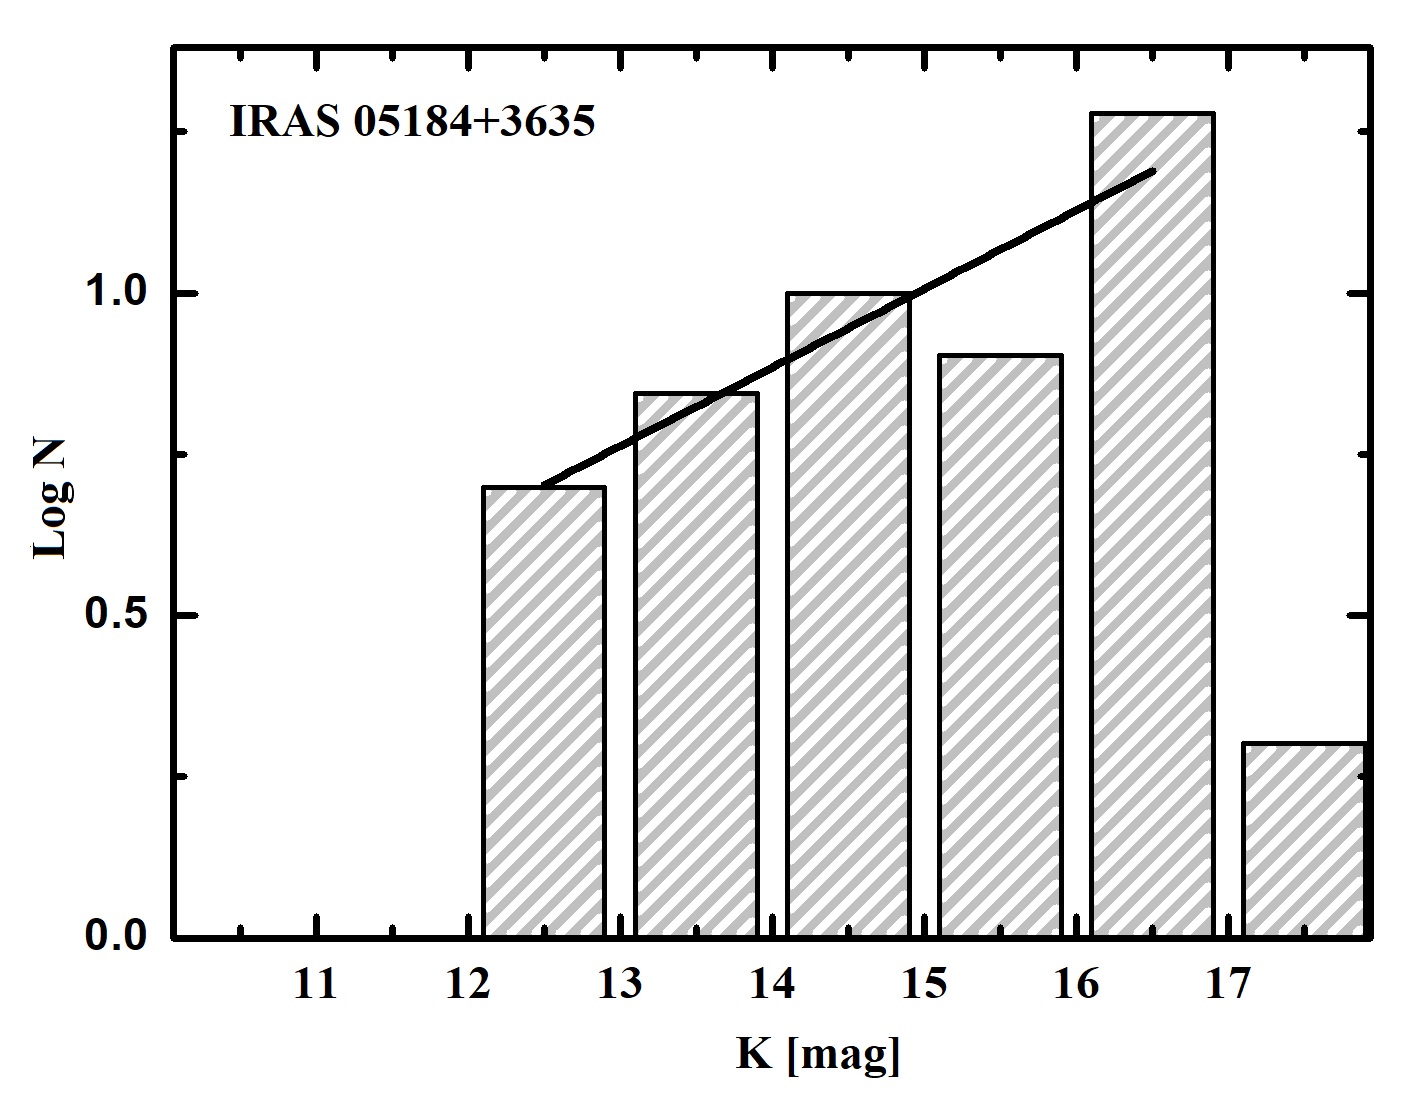
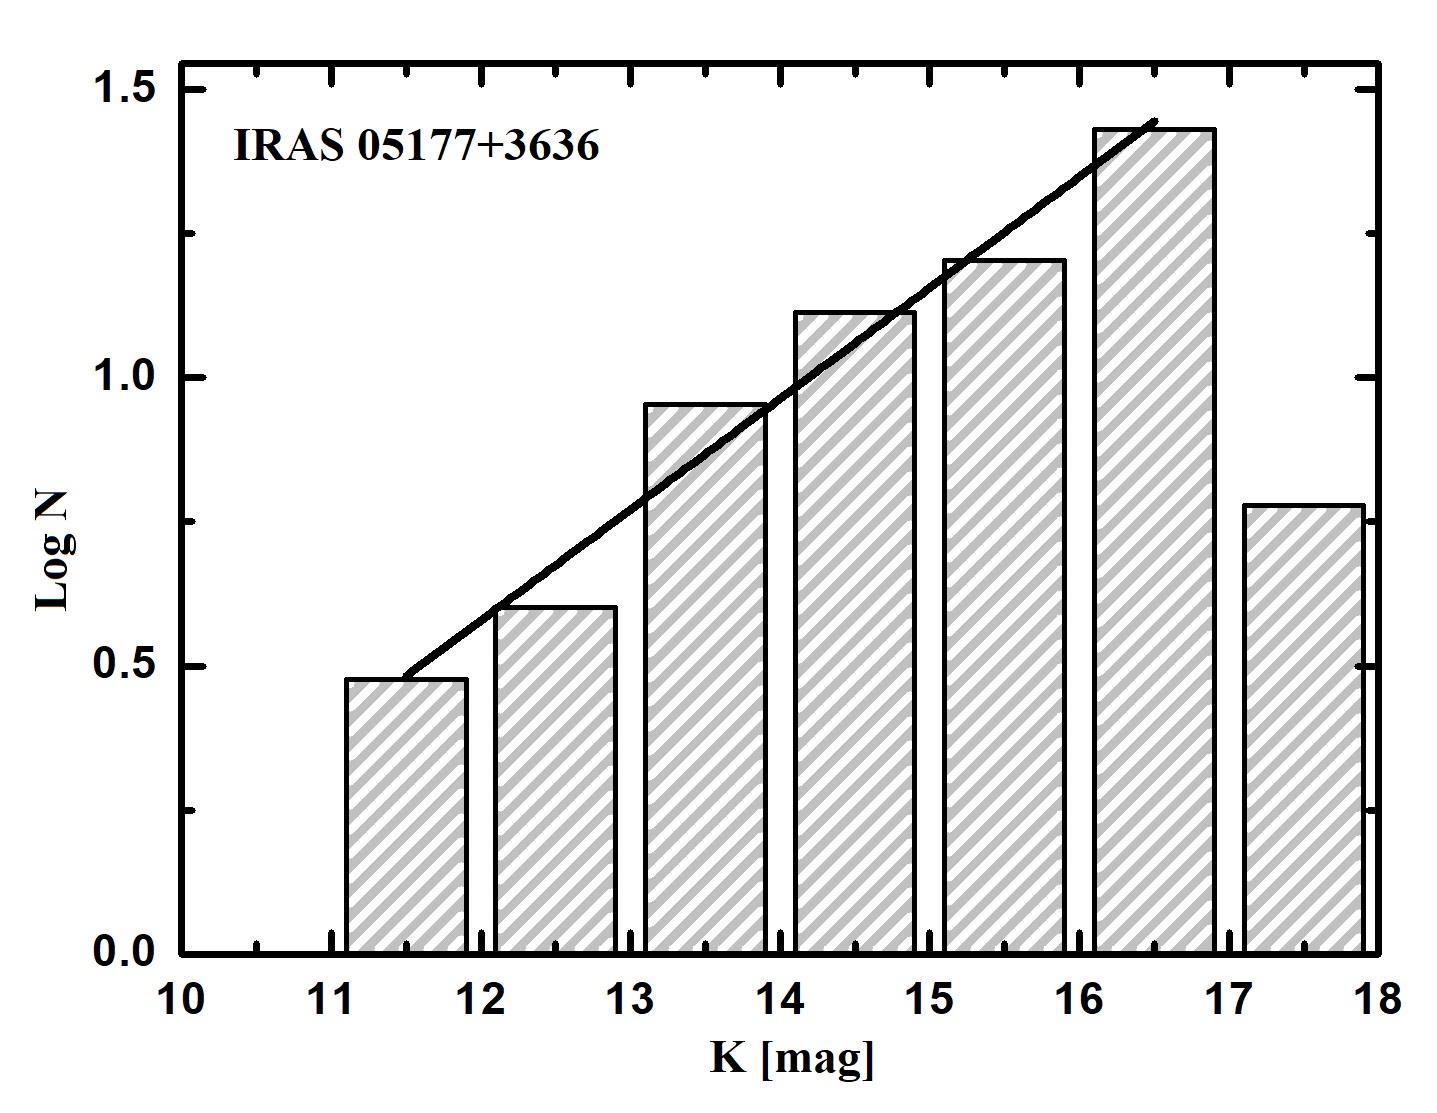
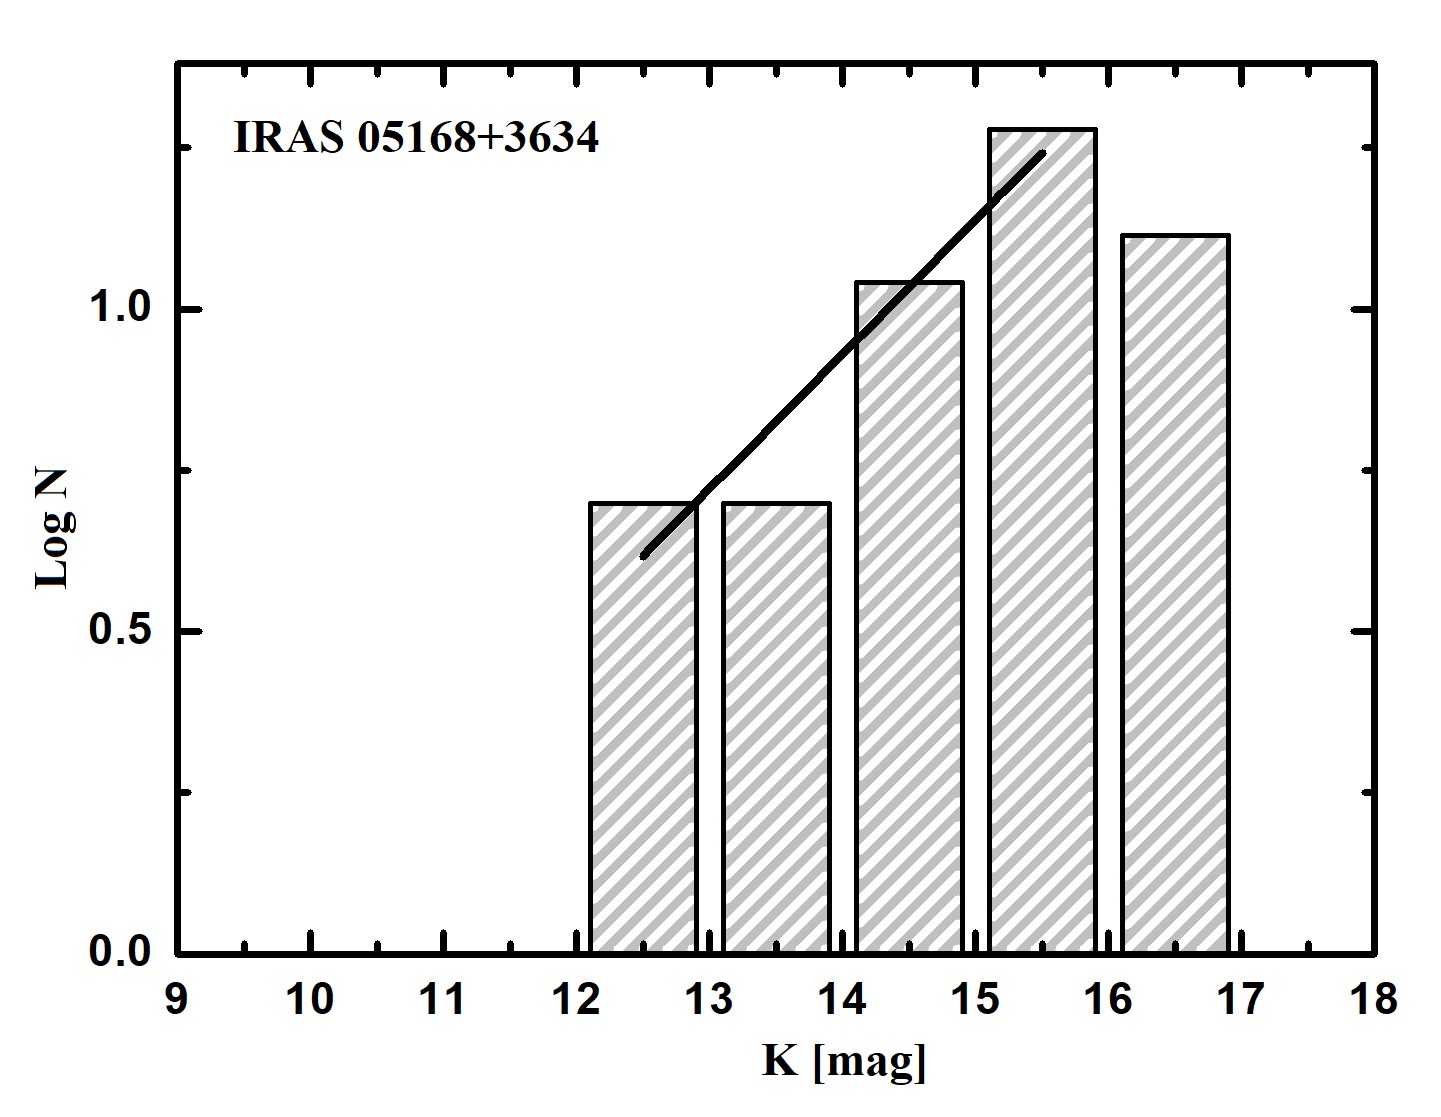
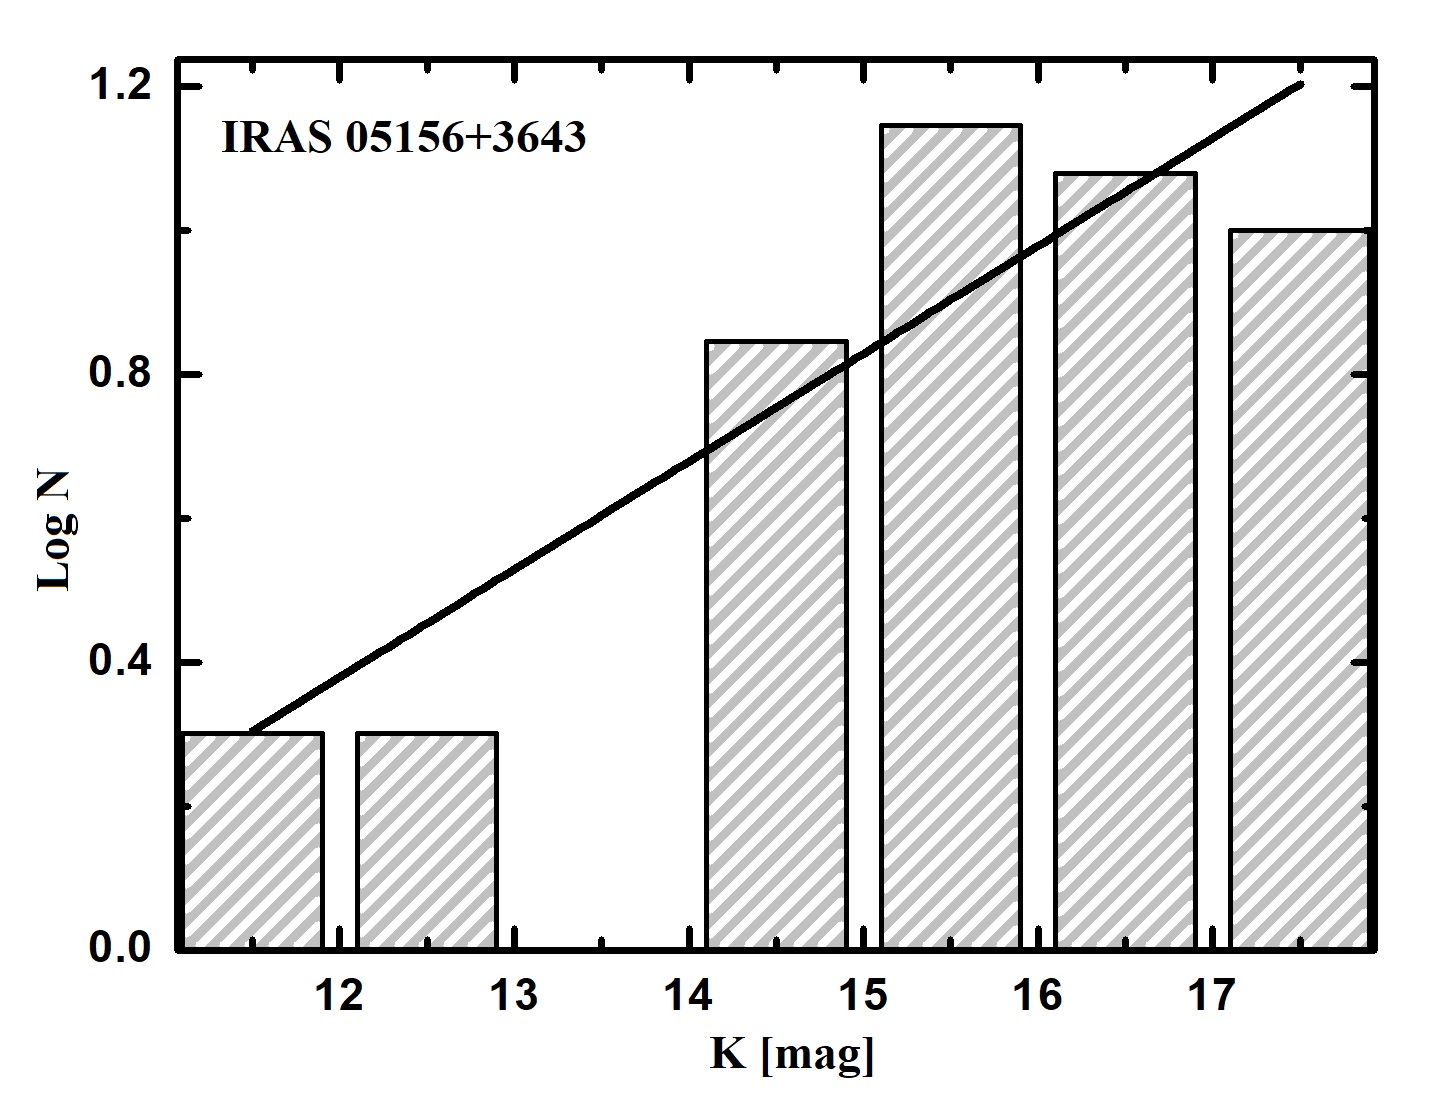
The luminosity function in the K-band (KLF) is frequently used in studies of young clusters and star-forming regions as a diagnostic tool of the initial mass function (IMF) and the star formation history of their stellar populations (Zinnecker et al. 1993; Lada & Lada 1995; Jose et al. 2012). Thus, the observed KLF is a result of the IMF, the PMS evolution, and the star-forming history. Due to the uncertainty in the selected YSO ages (see Figure 5), it is impossible to derive an individual mass for each source and therefore the mass-luminosity relation cannot be constructed in order to get the IMF. Nevertheless, it is possible to construct the KLF to constrain the age of the embedded stellar population in each star-forming region independently. As pointed out by Lada et al. (1996), the age of a subregion can be estimated by comparing its KLF to the observed KLFs of other young clusters, i.e., the KLF slope could be an age indicator of young clusters. The KLF can be defined as dN(K)/dK, where is the slope of the power law and N(K) is the number of stars brighter than K mag. The KLF slope is estimated by fitting the number of YSOs in 1 mag bins using a linear least-squares fitting routine. Since the slope is not affected by the intracluster extinction as long as the extinction is independent of the stellar mass (Megeath et al. 1996), we can use all the sources in the sample to define the slope without the complication of extinction correction. Therefore, Figure 6 shows the observed KLFs of YSOs detected in four subregions separately. In the case of the IRAS 05162+3639 subregion, there are not enough YSOs to construct the KLF and so it is impossible to estimate the value of the slope. The KLFs corresponding fitted slopes are provided in Table 4, which are lower than the typical values reported for young embedded clusters (0.4; e.g., Lada et al. 1991; Lada & Lada 2003; Baug et al. 2015) and within the errors, the KLFs for all four subregions seem to match each other. For clusters up to 10 Myr old, the KLF slope gets steeper as the cluster gets older (Ali & Depoy 1995; Lada & Lada 1995). There are many studies on the KLFs of young clusters. Megeath et al. (1996) found similar values of slopes around the W3 IRS 5 cluster (=0.24), and that it is consistent with an age of 0.3 Myr with a Miller-Scalo IMF. Ojha et al. (2004) estimated the KLF slope of NGC 7538 to be =0.280.02 and with an age of 1 Myr.
In addition, according to the calculation of Massi et al. (2000), values between 0.2 and 0.28 are consistent with an age range of 0.1–3 Myr. The values of the observable subregions are close to this range of values; therefore, the age of all four subregions can be estimated between 0.1 and 3 Myr, which also closely reflects the location of stellar objects relative to the isochrones. The KLF of the IRAS 05156+3643 star-forming region differs from the other subregions, i.e., a sharp decline does not occur in the end, which means that in this case the KLF reflects the real picture of the subregion, and in the remaining cases the decline is abrupt, reflecting the completeness limit of the survey. The KLF of IRAS 05156+3643 star-forming region complicates the resolution of the slope value, but in any case it falls within the 0.15–0.28 range.
3.6 SED analysis
In order to learn about the evolutionary stages of the YSOs that have measured magnitudes in longer wavelengths, we constructed their spectral energy distributions (SEDs) and fitted them with the radiative transfer models of Robitaille et al. (2007). The models assume an accretion scenario in the star formation process where a central star is surrounded by an accretion disk, an infalling flattened envelope, and the presence of bipolar cavities. We used the command-line version of the SED fitting tool where a large number of precomputed models are available. The SEDs are constructed for 45 Class I and 75 Class II evolutionary stage YSOs. This procedure was done using wavelengths ranging from 1.1 m to 160 m, in particular J, H, and K (UKIDSS); 3.6 and 4.5 m ( IRAC); 3.4, 4.6, 12, and 22 m (WISE); 8.28, 12.13, 14.65, and 21.3 m (MSX); 12 and 25 m (IRAS); and 70 and 160 m ( PACS). We took the apparent magnitudes of those surveys where the object was detected as a point source, i.e., we did not take data from the PACS extended source list and SPIRE 250,350,500 m surveys (all YSOs in the molecular cloud were detected as extended in the SPIRE survey). We also did not take the IRAS 60 and 100 m data, but instead we took the PACS Point Source Catalogs 70 and 160 m data, which provide better resolution than the IRAS 60 and 100 m. The SED fit was carried out using both distance estimations: 1.88 and 6.1 kpc. We used the ranges of the interstellar extinction (Av) and the distances of 1–40 mag, and 5.5–6.5 kpc and 1.6–2 kpc, respectively.
Figure 7 shows the constructed SEDs for those objects associated with IRAS sources in the near and far distances. To identify the representative values of different physical parameters, the tool retrieved the best fit model and all models for which the differences between their values and the best were smaller than 3N, where N is the number of the data points used (as suggested in Robitaille et al. 2007). This approach was taken because the sampling of the model grid is too sparse to effectively determine the minima of the surface and consequently obtain the confidence intervals.
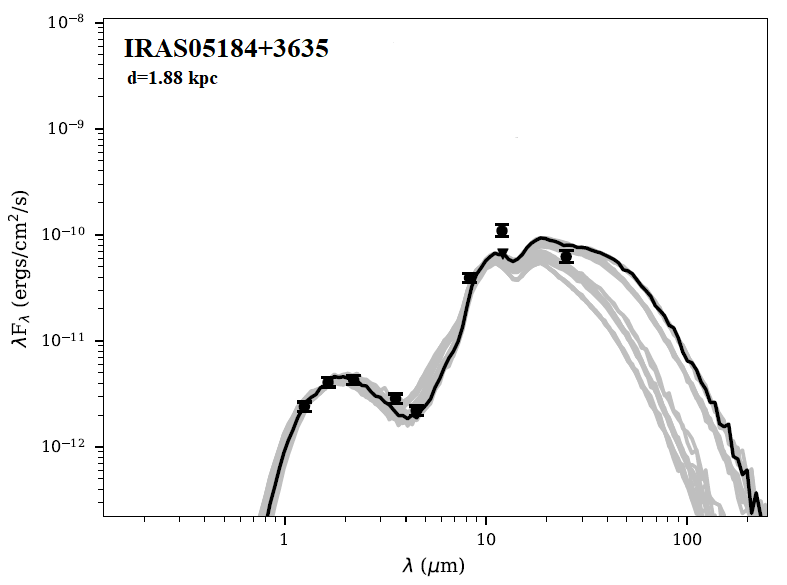
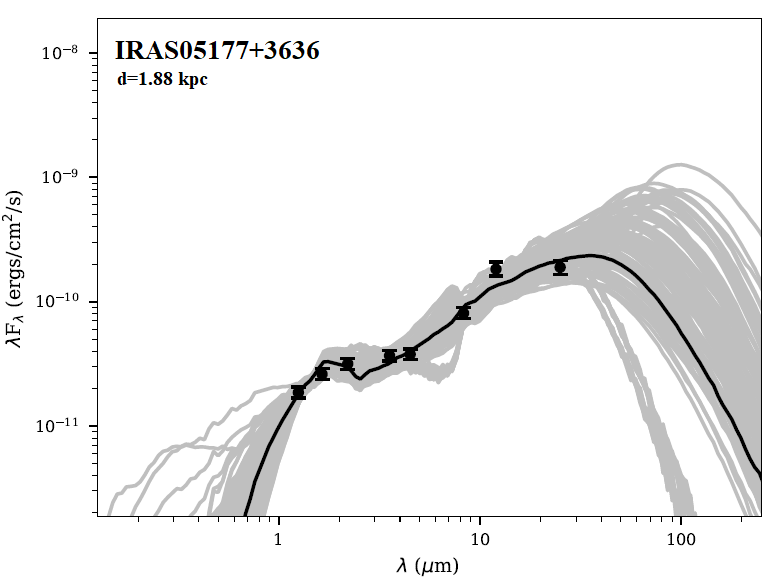
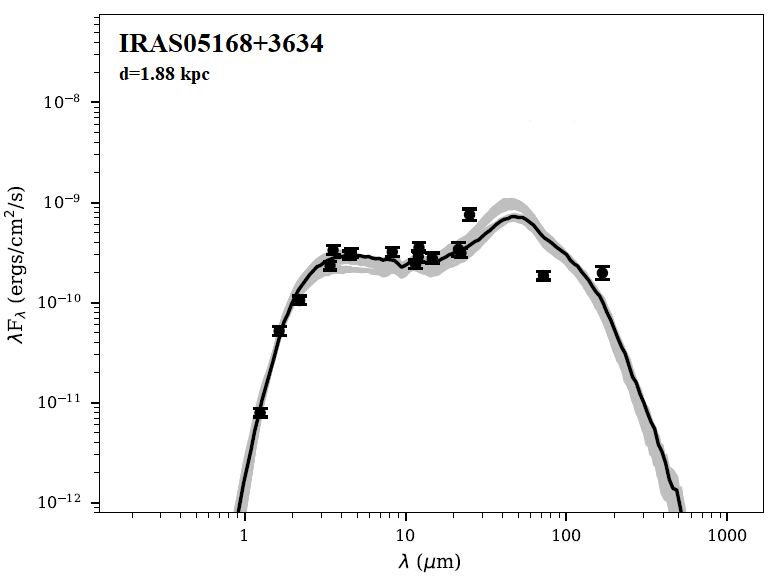
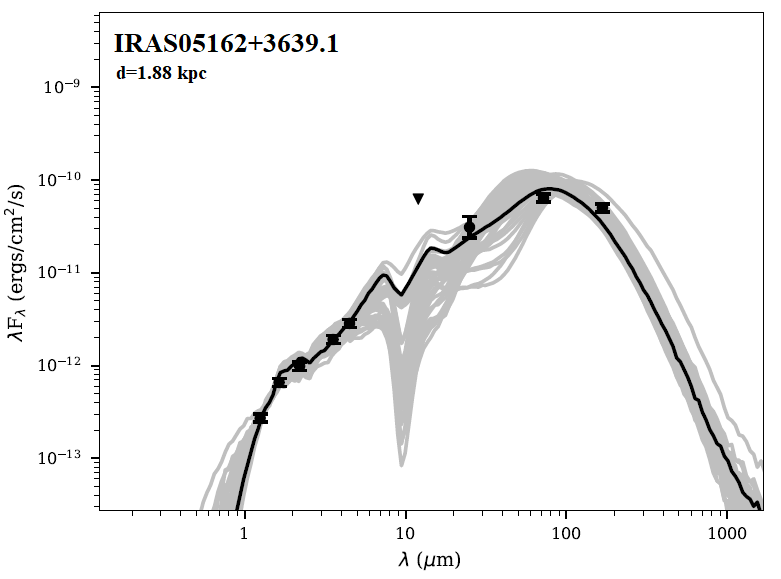
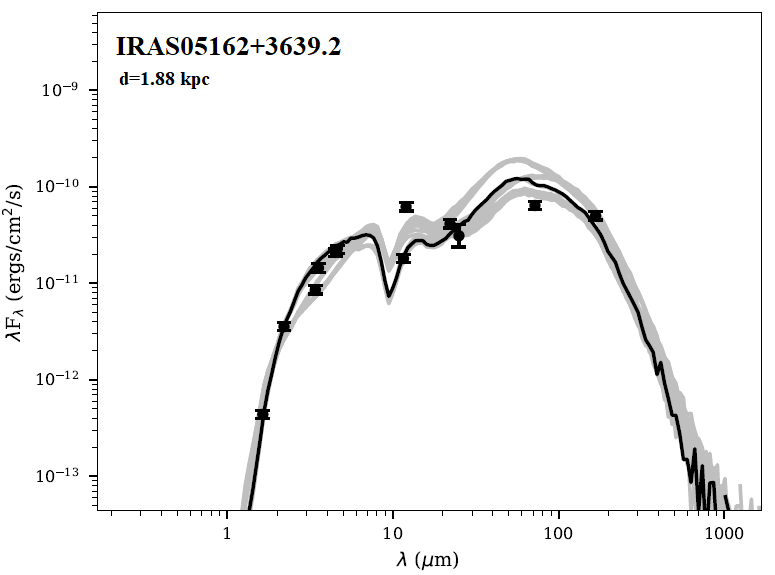
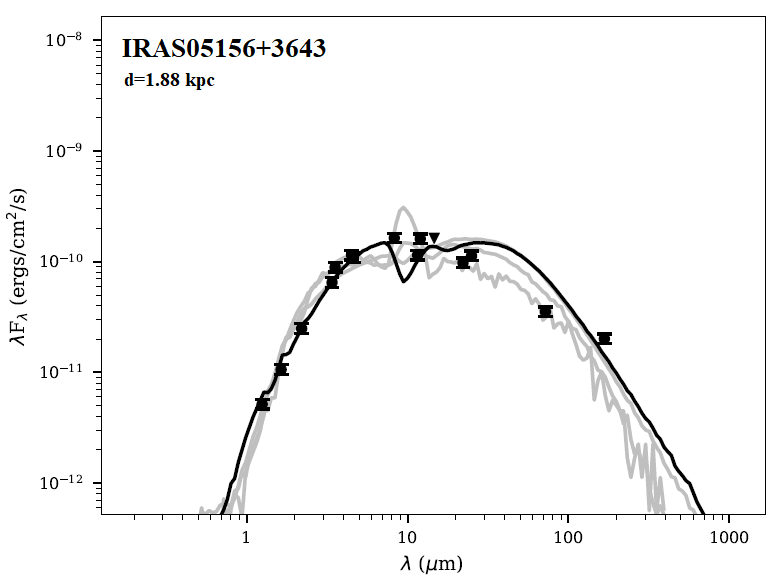
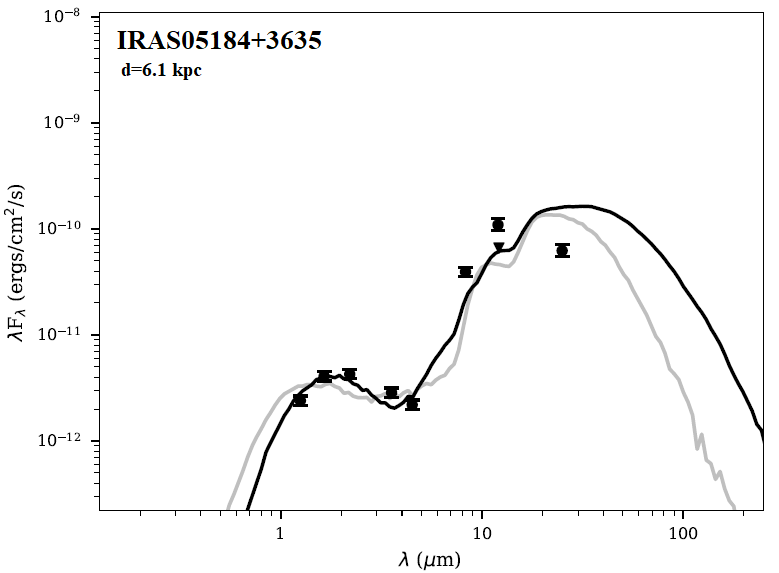
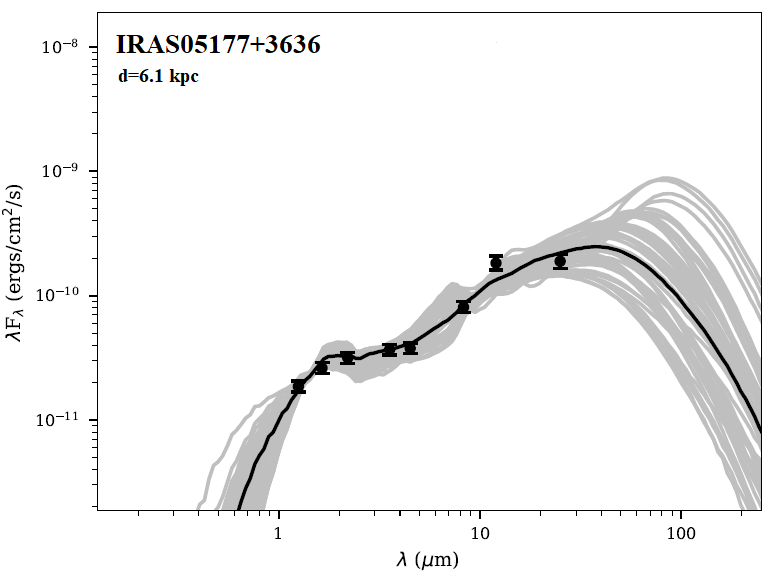
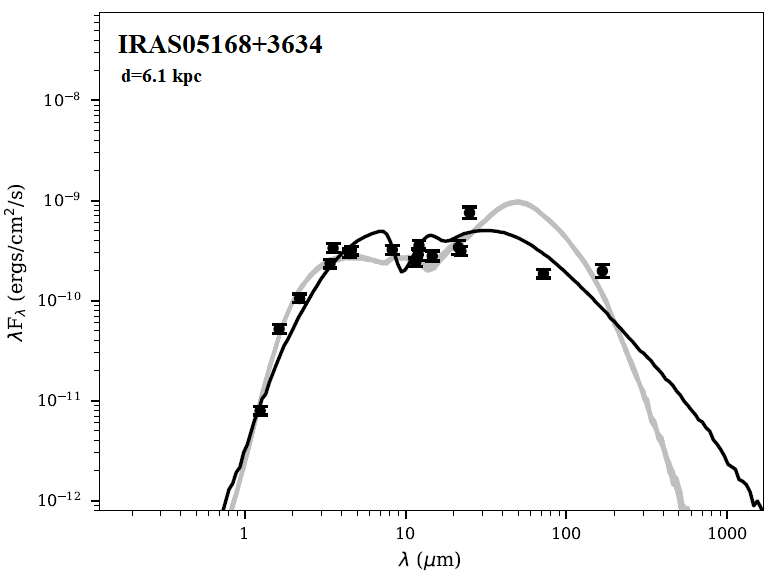
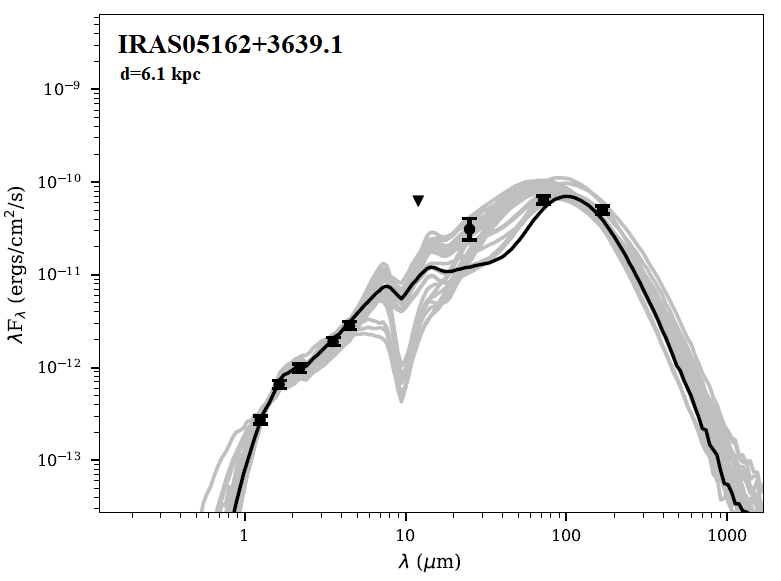
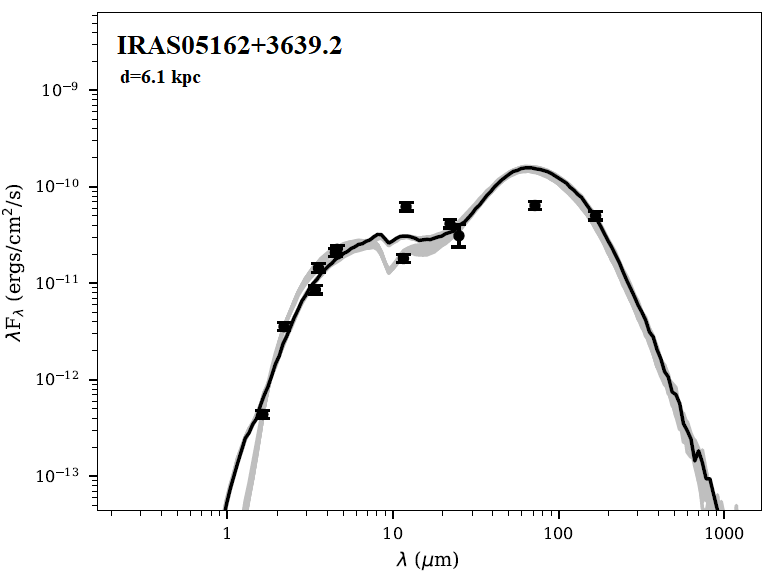
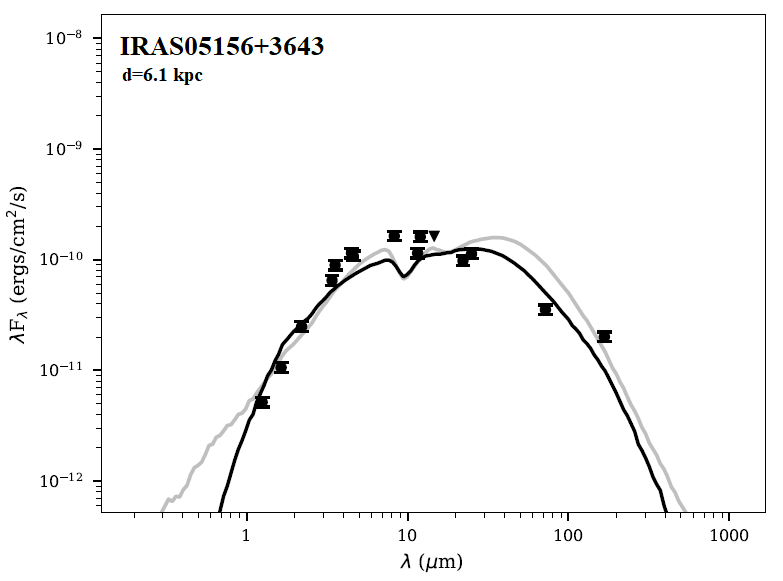
Table LABEL:tab:7 shows the weighted means and the standard deviations of parameters for all models with ¡ 3N at near and far distances: 1.88 and 6.1 kpc. In Table LABEL:tab:7, the members of subregions are separated from each other and the parameters of member of each subregion are listed in the following order: first, the received parameters of IRAS sources, then the parameters of MSX sources (if there is an identical object with any MSX source in that subregion). Next are the parameters of Class I objects, and finally those of Class II. The numbering of the objects was done according to Table LABEL:tab:5.
According to the results of SED fitting tool at distances of 1.88 and 6.1 kpc, objects associated with IRAS and MSX sources can be classified as middle-mass YSOs (Table LABEL:tab:7), which confirms the results obtained in the color-color and color-magnitude diagrams. The results of the SED fitting tool in general confirm the age estimations obtained by the KLF slope for each subregion. The ratio between disk accretion and envelope infall rates of our objects correspond closely to those parameters given for Class I objects in Grave & Kumar (2009).
3.7 Substructures of molecular cloud
In this section, we give an overview of the substructures of four clearly visible subregions found in the molecular cloud. Figure 8 shows the local density (LD) distribution of selected YSOs (N = 240) within the obtained radii (see Section 3.3) on the K-band images. A LD has been decided for each object on the surface with a radius equal to the distance to the closest n-th star. The value of LD for the first isodense exceeds the density of a field with a value of 3. We investigate separately the substructures of subregions, and the distributions of Class I and Class II evolutionary stage objects in the subregions. Each of the subregions is an embedded cluster.
The LD distribution of all the YSOs in the subregions shows elongated structures. The elongated structure was also evident in some of the earlier studies of clusters (Carpenter et al. 1997; Hillenbrand & Hartmann 1998). The elongation appears to be a result of the primordial structure in the cloud, and the elongation is aligned with the filamentary structure seen in the parent molecular cloud (Allen et al. 2007) and they are often composed of subregions (Lada et al. 1996; Chen et al. 1997; Megeath & Wilson 1997; Allen et al. 2002). All subregions have an expressed elongation and each consists of subgroups.
Figure 8 (top left panel) shows the LD distribution of YSOs in the IRAS 05184+3635 star-forming region. The IRAS 05184+3635 star-forming region has a bimodal structure and the main concentration of objects is located 40 arcsec northwest (NW) of IRAS 05184+3635, which is associated with a MSX object (G170.8276+00.0098).
The LD distribution of YSOs in the IRAS 05177+3636 star-forming region is shown in Figure 8 (top right panel). The IRAS 05177+3636 star-forming region also has a bimodal structure and consists of two main subgroups, each with an elongation. There are three MSX sources in the IRAS 05177+3636 star-forming region, one of them (G170.7268-00.1012) is associated with IRAS 05177+3636. The second MSX source (G170.7196-00.1118) is located in the northeast (NE) subgroup with IRAS 05177+3636, and the third (G170.7247-00.1388) is in the second subgroup 2.2 arcmin to the southwest (SW) of IRAS 05177+3636. However, it should be noted that IRAS 05177+3636 and all the MSX sources are on the edges of two subgroups.
The LD distribution in IRAS 05168+3634 star-forming region demonstrates unique elongation (Figure 8, bottom left panel). There are no clearly visible subgroups, but three poles associated with MSX sources can be seen. One of the subgroups is located around IRAS 05168+3634, which is the dominant object in the given subgroup. IRAS 05168+3634 is identified with MSX G170.6575-00.2685. Another subgroup is found to the NE of IRAS 05168+3634. Molinari et al. (1998) detected 6 cm radio emission 102 arcsec away from IRAS 05168+3634 whose coordinates are =05:20:23.53, =+36:38:17.58.
The location of the second MSX G170.6589-00.2334 object is 2.118 arcmin NE of the position of IRAS 05168+3634. The third subgroup in the IRAS 05168+3634 star-forming region is located to the southeast (SE) of the IRAS 05168+3634.
The MSX G170.6758-00.2691 object in the IRAS 05168+3634 star-forming region is 1.135 arcmin SE of the position of IRAS 05168+3634 and is located in the subgroup. In the case of the IRAS 05168+3634 subregion the IRAS and MSX sources are also located in the edges of subgroups.
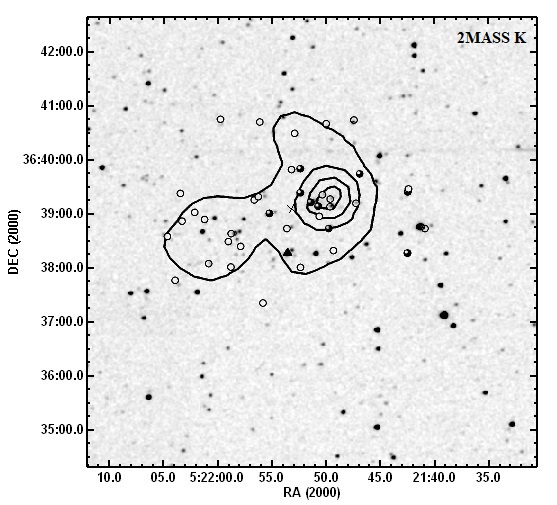
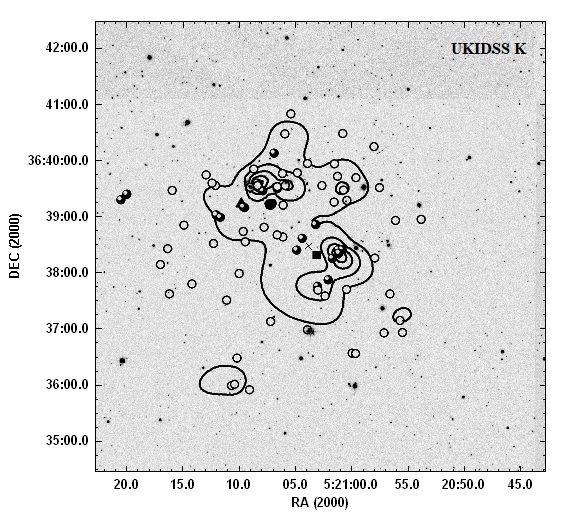
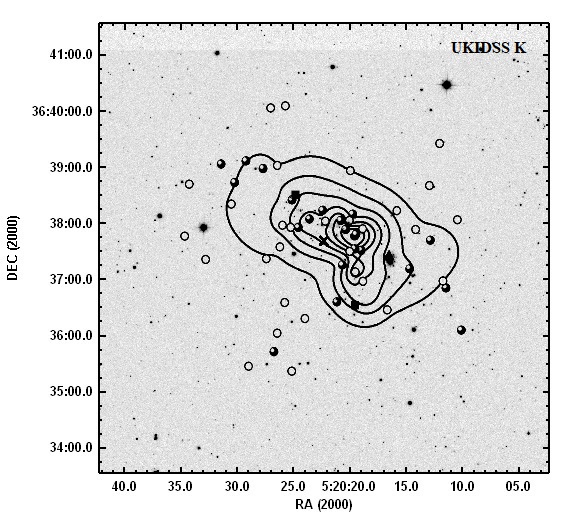
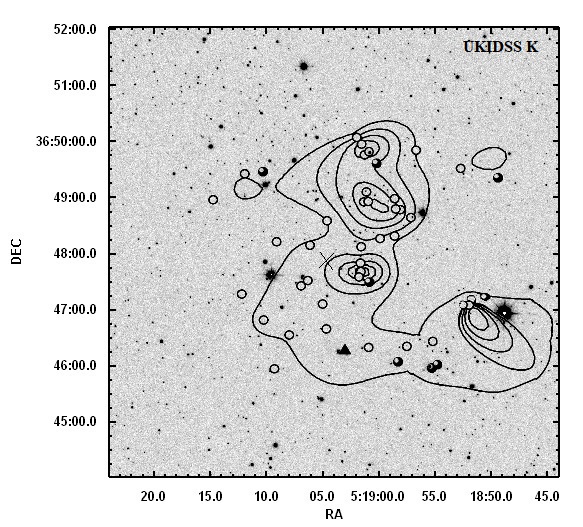
The IRAS 05156+3643 star-forming region has the most complex structure (Figure 8, bottom right panel). It consists of three subgroups that show elongated structures, and one of them is even composed of two smaller subgroups. IRAS 05156+3643 is out of these three subgroups. This IRAS object is associated with MSX G170.3964-00.3827.
The LD distribution on the IRAS 05162+3639 star-forming region cannot provide any information because there are only five objects. It should be noted that all of these five objects were classified as Class I evolutionary stage objects (see text above), and that two of them were identified with IRAS 05162+3639. This binary needs a separate study and it should be noted that the results obtained from the SED are likely to be incorrect.
If the observed morphologies of embedded clusters result from the filamentary and clumpy nature of the parental molecular clouds, then the younger Class 0/I objects, which have the least time to move away from their star formation sites, should show more pronounced structures than the older, PMS Class II and Class III stellar objects. However, there is no difference between the distributions of Class I and II objects in the field of the subregions, but there is a big difference between the distributions of Class I and II objects in the molecular cloud as a whole (Figure 3).
4 Conclusion
Our investigations show that the IRAS 05168+3634 star-forming region, considered in previous studies, has a more complicated structure in the FIR wavelengths. Studies in FIR wavelengths suggest that the IRAS 05168+3634 star-forming region is located in a quite large molecular cloud within a region of approximately 24 arcmin radius (the center of the molecular cloud is conditionally selected as IRAS 05168+3634), which in turn consists of four additional star-forming regions. From the statistical analysis it follows that all IRAS star-forming regions are at the same distance: 6.1 kpc (Molinari et al. 1996) or 1.88 kpc (Sakai et al. 2012), i.e., there is a small probability that these star-forming regions may be the result of superposition. In addition, these regions repeat the shape of the molecular cloud. Also the distances of IRAS 05184+3635 and IRAS 05177+3636 assessed based on the 13CO velocities were evaluated at the same 1.4 kpc value, which coincides with the distance of IRAS 05168+3634 based on trigonometric parallax.
In this paper, we also analyzed the stellar content of the molecular cloud and separately for each star-forming region associated with IRAS sources using the J, H, K UKIDSS-DR6; [3.6], [4.5] m GLIMPSE 360; and [3.4], [4.6], [12], [22] m ALLWISE survey images and photometric data to construct color-color and color-magnitude diagrams, which are useful tools for identifying YSO candidates. Using NIR and MIR photometric data, we obtain the census of the young stellar populations and their characteristics within a 24 arcmin radius region surrounding the molecular cloud, which includes 1224 candidate YSOs, 240 of which are concentrated around five IRAS sources. We classified 71 YSOs as evolutionary stage Class I objects and 132–169 YSOs (depending on the distance) as evolutionary stage Class II objects within the radii of subregions. One can see, depending on the color-color and color-magnitude diagrams, the number of Class II evolutionary stage objects is changing, but the number of Class I evolutionary stage objects is not changing, and the conclusion is that the selection of Class I objects is highly accurate. It should be noted that, unlike the Class II objects, the Class I objects are located mainly in the filaments of the molecular cloud, i.e., the distribution of Class I objects reflects the initial state of the parent molecular cloud. The estimated distances and the interstellar extinctions of each subregion were taken into account in the corrections of J and K magnitudes for the color-magnitude diagrams, which generates a great difference in the number of Class II objects. From the color-magnitude diagram analysis using evolutionary models of various ages by Siess et al. (2000), there is a large distribution of ages, but the age of most of them is on the order of 105 years. A mass completeness limit has been quoted for two distances. Selected YSOs located in the IRAS 05184+3635, IRAS 05168+3634, and IRAS 05156+3643 star-forming regions are explicitly targeted at a specific mass range for two distances; for objects in the IRAS 05177+3636 star-forming region there is no similar dependency. The members of the IRAS 05184+3635 and IRAS 05156+3643 subregions are targeted to a lower mass range, i.e., the members of IRAS 05184+3635 are distributed in the ranges of 0.3–1.5 and 0.8–5 Msun and the members of IRAS 05156+3643 in the ranges 0.2–1.6 and 0.6-3 Msun at distances of 1.88 and 6.1 kpc, respectively. Conversely, the members of the IRAS 05168+3634 subregion are distributed in a higher mass range, i.e., they are at 0.5–2.5 and 0.9–7 Msun at distances of 1.88 and 6.1 kpc, respectively.
We have also calculated the slope of the KLFs for four subregions, namely IRAS 05184+3635, IRAS 05177+3636, IRAS 05168+3634, and IRAS 05156+3643. The KLF of these subregions shows unusually low values for the slope: 0.12–0.21. According to the values of the slopes of the KLFs, the age of all four subregions can be estimated between 0.1 and 3 Myr. There are not enough YSOs within the radius of the IRAS 05162+3639 subregion, so the KLFs for this subregion were not constructed.
The SEDs were constructed for 45 and 75 YSOs with evolutionary stages Class I and Class II, respectively. This procedure was done using wavelengths ranging from 1.1 m to 160 m. According to the results of the SED fitting tool, IRAS 05184+3635, IRAS 05177+3636, and IRAS 05162+3639 can be classified as Class I for both distances. The sources IRAS 05168+3634 and IRAS 05156+3643 can be classified as flat-spectrum objects for both distances. At the distance of 6.1 kpc, all IRAS sources have 6–7 Msun, except for IRAS 05156+3643, and one of the two objects associated with the IRAS 05162+3639 binary object (both have 3 Msun mass). At the distance of 1.88 kpc, estimated masses vary considerably only in the case of IRAS 05184+3635 and IRAS 05177+3636, and the mass estimation is the highest for IRAS 05168+3634: 5 Msun. The results of the SED fitting tool, in general, are well correlated with the age estimations obtained by the KLF slope for each subregion. According to the results of the SED fitting tool, at distances of 1.88 and 6.1 kpc, IRAS and MSX sources can be classified as middle-mass YSOs, which confirms the results obtained in the color-color and color-magnitude diagrams.
All star-forming regions have complicated structures. They contained the subgroups, which are mainly associated with IRAS and MSX sources. The observed young subregions and parental molecular cloud morphologies are similar and elongated. This is particularly well expressed when only the youngest Class I/0 sources are considered. Perhaps the similarities in morphologies result from the distribution of fragmentation sites in the parent cloud. The Class I sources are often distributed along filamentary structures, while the Class II sources are more widely distributed. A similar distribution of Class II evolutionary stage objects can be explained by the fact that these objects have had enough time to leave their own birthplaces. In the case of Class I evolutionary stage objects, that time is small, and this is why they are located on the filaments of parent molecular cloud, thus they clearly reflect the initial state of the parent cloud.
Acknowledgements.
I am very grateful to the anonymous referee for the helpful comments and suggestions. I thank my supervisor Dr. Elena Nikoghosyan for her support. This research has made use the data obtained at UKIRT, which is supported by NASA and operated under an agreement among the University of Hawaii, the University of Arizona, and Lockheed Martin Advanced Technology Center; operations are enabled through the cooperation of the East Asian Observatory. We gratefully acknowledge the use of data from the NASA/IPAC Infrared Science Archive, which is operated by the Jet Propulsion Laboratory, California Institute of Technology, under contract with the National Aeronautics and Space Administration. I thank my colleagues in the GLIMPSE 360 Legacy Surveys. This work was made possible by a research grant from the Armenian National Science and Education Fund (ANSEF) based in New York, USA.References
- Ali & Depoy (1995) Ali, B. & Depoy, D. L. 1995, AJ, 109, 709
- Allen et al. (2007) Allen, L., Megeath, S. T., Gutermuth, R., et al. 2007, Protostars and Planets V, 361
- Allen et al. (2002) Allen, L. E., Myers, P. C., Di Francesco, J., et al. 2002, ApJ, 566, 993
- Azatyan et al. (2016) Azatyan, N. M., Nikoghosyan, E. H., & Khachatryan, K. G. 2016, Astrophysics, 59, 339
- Baug et al. (2015) Baug, T., Ojha, D. K., Dewangan, L. K., et al. 2015, MNRAS, 454, 4335
- Bessell & Brett (1988) Bessell, M. S. & Brett, J. M. 1988, PASP, 100, 1134
- Bohlin et al. (1978) Bohlin, R. C., Savage, B. D., & Drake, J. F. 1978, ApJ, 224, 132
- Bronfman et al. (1996) Bronfman, L., Nyman, L.-A., & May, J. 1996, A&AS, 115, 81
- Carpenter (2001) Carpenter, J. M. 2001, AJ, 121, 2851
- Carpenter et al. (1997) Carpenter, J. M., Meyer, M. R., Dougados, C., Strom, S. E., & Hillenbrand, L. A. 1997, AJ, 114, 198
- Casoli et al. (1986) Casoli, F., Dupraz, C., Gerin, M., Combes, F., & Boulanger, F. 1986, A&A, 169, 281
- Cesaroni et al. (2015) Cesaroni, R., Massi, F., Arcidiacono, C., et al. 2015, A&A, 581, A124
- Chen et al. (1997) Chen, H., Tafalla, M., Greene, T. P., Myers, P. C., & Wilner, D. J. 1997, ApJ, 475, 163
- Churchwell et al. (2009) Churchwell, E., Babler, B. L., Meade, M. R., et al. 2009, PASP, 121, 213
- Di Francesco et al. (2008) Di Francesco, J., Johnstone, D., Kirk, H., MacKenzie, T., & Ledwosinska, E. 2008, ApJS, 175, 277
- Dobashi (2011) Dobashi, K. 2011, PASJ, 63, S1
- Egan et al. (2003) Egan, M. P., Price, S. D., Kraemer, K. E., et al. 2003, VizieR Online Data Catalog, 5114
- Faustini et al. (2009) Faustini, F., Molinari, S., Testi, L., & Brand, J. 2009, A&A, 503, 801
- Fazio et al. (2004) Fazio, G. G., Hora, J. L., Allen, L. E., et al. 2004, ApJS, 154, 10
- Flaherty et al. (2007) Flaherty, K. M., Pipher, J. L., Megeath, S. T., et al. 2007, ApJ, 663, 1069
- Fontani et al. (2010) Fontani, F., Cesaroni, R., & Furuya, R. S. 2010, A&A, 517, A56
- Grave & Kumar (2009) Grave, J. M. C. & Kumar, M. S. N. 2009, A&A, 498, 147
- Griffin et al. (2010) Griffin, M. J., Abergel, A., Abreu, A., et al. 2010, A&A, 518, L3
- Guan et al. (2008a) Guan, X., Wu, Y., & Ju, B. 2008a, MNRAS, 391, 869
- Guan et al. (2008b) Guan, X., Wu, Y., & Ju, B. 2008b, MNRAS, 391, 869
- Gutermuth et al. (2006) Gutermuth, R. A., Pipher, J. L., Myers, P. C., et al. 2006, in Bulletin of the American Astronomical Society, Vol. 38, American Astronomical Society Meeting Abstracts #208, 87
- Harju et al. (1998) Harju, J., Lehtinen, K., Booth, R. S., & Zinchenko, I. 1998, A&AS, 132, 211
- Hartmann (2009) Hartmann, L. 2009, Accretion Processes in Star Formation: Second Edition (Cambridge University Press)
- Hernández et al. (2005) Hernández, J., Calvet, N., Hartmann, L., et al. 2005, AJ, 129, 856
- Hillenbrand & Hartmann (1998) Hillenbrand, L. A. & Hartmann, L. W. 1998, ApJ, 492, 540
- Jose et al. (2012) Jose, J., Pandey, A. K., Ogura, K., et al. 2012, MNRAS, 424, 2486
- Kenyon et al. (1994) Kenyon, S. J., Gomez, M., Marzke, R. O., & Hartmann, L. 1994, AJ, 108, 251
- Koenig et al. (2012) Koenig, X. P., Leisawitz, D. T., Benford, D. J., et al. 2012, ApJ, 744, 130
- Kumar et al. (2006) Kumar, M. S. N., Keto, E., & Clerkin, E. 2006, A&A, 449, 1033
- Lada & Adams (1992) Lada, C. J. & Adams, F. C. 1992, ApJ, 393, 278
- Lada et al. (1996) Lada, C. J., Alves, J., & Lada, E. A. 1996, AJ, 111, 1964
- Lada & Lada (2003) Lada, C. J. & Lada, E. A. 2003, ARA&A, 41, 57
- Lada et al. (1984) Lada, C. J., Margulis, M., & Dearborn, D. 1984, ApJ, 285, 141
- Lada et al. (1991) Lada, E. A., Depoy, D. L., Evans, II, N. J., & Gatley, I. 1991, ApJ, 371, 171
- Lada & Lada (1995) Lada, E. A. & Lada, C. J. 1995, AJ, 109, 1682
- Lépine & Shara (2005) Lépine, S. & Shara, M. M. 2005, AJ, 129, 1483
- López-Chico & Salas (2007) López-Chico, T. & Salas, L. 2007, Rev. Mexicana Astron. Astrofis., 43, 155
- Lucas et al. (2008) Lucas, P. W., Hoare, M. G., Longmore, A., et al. 2008, MNRAS, 391, 136
- Maddox et al. (2017) Maddox, N., Jarvis, M. J., Banerji, M., et al. 2017, MNRAS, 470, 2314
- Massi et al. (2000) Massi, F., Lorenzetti, D., Giannini, T., & Vitali, F. 2000, A&A, 353, 598
- Megeath et al. (1996) Megeath, S. T., Herter, T., Beichman, C., et al. 1996, A&A, 307, 775
- Megeath & Wilson (1997) Megeath, S. T. & Wilson, T. L. 1997, AJ, 114, 1106
- Meyer et al. (1997) Meyer, M. R., Calvet, N., & Hillenbrand, L. A. 1997, AJ, 114, 288
- Molinari et al. (1996) Molinari, S., Brand, J., Cesaroni, R., & Palla, F. 1996, A&A, 308, 573
- Molinari et al. (1998) Molinari, S., Brand, J., Cesaroni, R., Palla, F., & Palumbo, G. G. C. 1998, A&A, 336, 339
- Neugebauer et al. (1984) Neugebauer, G., Habing, H. J., van Duinen, R., et al. 1984, ApJ, 278, L1
- Ojha et al. (2004) Ojha, D. K., Tamura, M., Nakajima, Y., et al. 2004, ApJ, 616, 1042
- Pilbratt et al. (2010) Pilbratt, G. L., Riedinger, J. R., Passvogel, T., et al. 2010, A&A, 518, L1
- Poglitsch et al. (2010) Poglitsch, A., Waelkens, C., Geis, N., et al. 2010, A&A, 518, L2
- Preibisch (2012) Preibisch, T. 2012, Research in Astronomy and Astrophysics, 12, 1
- Rieke & Lebofsky (1985) Rieke, G. H. & Lebofsky, M. J. 1985, ApJ, 288, 618
- Robitaille et al. (2007) Robitaille, T. P., Whitney, B. A., Indebetouw, R., & Wood, K. 2007, ApJS, 169, 328
- Ruiz-Velasco et al. (2016) Ruiz-Velasco, A. E., Felli, D., Migenes, V., & Wiggins, B. K. 2016, ApJ, 822, 101
- Sakai et al. (2012) Sakai, N., Honma, M., Nakanishi, H., et al. 2012, PASJ, 64, 108
- Schlegel et al. (1998) Schlegel, D. J., Finkbeiner, D. P., & Davis, M. 1998, ApJ, 500, 525
- Siess et al. (2000) Siess, L., Dufour, E., & Forestini, M. 2000, A&A, 358, 593
- Sunada et al. (2007) Sunada, K., Nakazato, T., Ikeda, N., et al. 2007, PASJ, 59, 1185
- Varricatt et al. (2010) Varricatt, W. P., Davis, C. J., Ramsay, S., & Todd, S. P. 2010, MNRAS, 404, 661
- Wang et al. (2009) Wang, K., Wu, Y. F., Ran, L., Yu, W. T., & Miller, M. 2009, A&A, 507, 369
- Wouterloot & Brand (1989) Wouterloot, J. G. A. & Brand, J. 1989, A&AS, 80, 149
- Wright et al. (2010) Wright, E. L., Eisenhardt, P. R. M., Mainzer, A. K., et al. 2010, AJ, 140, 1868
- Yorke & Sonnhalter (2002) Yorke, H. W. & Sonnhalter, C. 2002, ApJ, 569, 846
- Zhang et al. (2005) Zhang, Q., Hunter, T. R., Brand, J., et al. 2005, ApJ, 625, 864
- Zinnecker et al. (1993) Zinnecker, H., McCaughrean, M. J., & Wilking, B. A. 1993, in Protostars and Planets III, ed. E. H. Levy & J. I. Lunine, 429–495
| ID | (2000) | (2000) | J | H | K | [3.6] m | [4.5] m | W1 | W2 | W3 | W4 | Final/class |
| (hh mm ss) | (dd mm ss) | (mag) | (mag) | (mag) | (mag) | (mag) | (mag) | (mag) | (mag) | (mag) | ||
| (1) | (2) | (3) | (4) | (5) | (6) | (7) | (8) | (9) | (10) | (11) | (12) | (13) |
| IRAS 05184+3635 | ||||||||||||
| 1 | 5 21 41.35 | 36 38 46.50 | 10.333 0.000 | 10.642 0.000 | 10.076 0.000 | 9.595 0.043 | 9.433 0.040 | 10.109 0.021 | 9.957 0.018 | 9.098 0.032 | 8.375 0.294 | Class II |
| 2∗*∗*- objects that are located to the left of ZAMS in one color - magnitude diagram, | 5 21 42.79 | 36 39 29.08 | 17.751 0.036 | 17.182 0.039 | 16.825 0.056 | 16.146 0.101 | 15.999 0.109 | Class II | ||||
| 3 | 5 22 1.21 | 36 39 3.86 | 16.155 0.010 | 15.563 0.008 | 15.213 0.012 | 15.048 0.063 | 14.866 0.084 | Class II | ||||
| 4∗*∗*- objects that are located to the left of ZAMS in one color - magnitude diagram, | 5 21 46.99 | 36 39 45.13 | 17.678 0.034 | 17.076 0.036 | 16.725 0.052 | 16.395 0.093 | 16.174 0.125 | 17.240 0.181 | 17.229 6.892 | 12.403 4.961 | 8.745 3.498 | Class II |
| 5 | 5 21 58.99 | 36 40 43.70 | 17.378 0.024 | 16.752 0.026 | 16.314 0.032 | 15.994 0.082 | 15.839 0.087 | Class II | ||||
| 6∗*∗*- objects that are located to the left of ZAMS in one color - magnitude diagram, | 5 22 2.46 | 36 39 24.05 | 17.509 0.030 | 16.869 0.026 | 16.497 0.039 | 15.819 0.069 | 15.469 0.070 | Class II | ||||
| 7 | 5 21 55.61 | 36 40 40.58 | 17.113 0.022 | 16.437 0.018 | 15.973 0.024 | 15.548 0.073 | 15.374 0.093 | 15.461 0.048 | 15.052 0.088 | 11.995 4.798 | 8.569 3.428 | Class II |
| 8 | 5 22 2.91 | 36 37 51.02 | 17.674 0.035 | 16.958 0.028 | 16.512 0.039 | 16.049 0.091 | 15.800 0.067 | 16.150 0.070 | 16.269 0.229 | 12.345 4.938 | 8.978 3.591 | Class II |
| 9 | 5 22 2.30 | 36 38 54.28 | 17.899 0.043 | 17.181 0.035 | 16.773 0.050 | 16.112 0.079 | 15.852 0.082 | Class II | ||||
| 10 | 5 21 52.87 | 36 37 30.75 | 18.624 0.083 | 17.897 0.067 | 17.450 0.093 | 16.877 0.180 | 16.408 0.083 | Class II | ||||
| 11 | 5 21 52.09 | 36 38 5.11 | 17.541 0.031 | 16.814 0.025 | 16.406 0.036 | 16.246 0.069 | 16.024 0.113 | Class II | ||||
| 12 | 5 21 50.48 | 36 38 59.69 | 18.210 0.054 | 17.428 0.049 | 16.691 0.050 | 16.225 0.085 | 16.006 0.120 | Class II | ||||
| 13 | 5 21 58.10 | 36 38 5.36 | 18.051 0.049 | 17.260 0.037 | 16.695 0.047 | 15.870 0.053 | 15.494 0.060 | Class II | ||||
| 14 | 5 21 52.85 | 36 39 49.51 | 16.230 0.010 | 15.427 0.007 | 14.959 0.010 | 14.333 0.054 | 14.092 0.046 | 14.735 0.036 | 14.573 0.067 | 12.297 4.919 | 8.861 3.544 | Class II |
| 15 | 5 21 58.07 | 36 38 41.04 | 14.709 0.003 | 13.867 0.002 | 13.378 0.003 | 12.710 0.042 | 12.459 0.038 | ClassII | ||||
| 16 | 5 21 55.34 | 36 37 26.73 | 17.338 0.026 | 16.496 0.019 | 16.030 0.026 | 15.737 0.080 | 15.590 0.054 | 15.461 0.047 | 15.781 0.156 | 11.427 0.202 | 8.382 0.350 | Class II |
| 17 | 5 21 47.50 | 36 40 42.53 | 14.327 0.002 | 13.438 0.002 | 12.831 0.002 | 11.964 0.035 | 11.572 0.037 | 12.046 0.023 | 11.507 0.021 | 9.532 0.058 | 7.826 0.188 | Class II |
| 18 | 5 22 3.58 | 36 38 38.01 | 16.397 0.012 | 15.502 0.008 | 14.925 0.010 | 14.152 0.055 | 13.777 0.043 | 13.895 0.027 | 13.467 0.033 | 12.364 4.946 | 8.969 3.588 | Class II |
| 19 | 5 21 54.58 | 36 41 13.34 | 18.888 0.105 | 17.947 0.070 | 17.277 0.080 | 16.588 0.130 | 16.267 0.082 | Class II | ||||
| 20 | 5 21 50.47 | 36 38 59.59 | 18.152 0.054 | 17.209 0.036 | 16.680 0.047 | 16.225 0.085 | 16.006 0.120 | Class II | ||||
| 21 | 5 21 57.26 | 36 38 27.37 | 18.152 0.054 | 17.200 0.035 | 16.644 0.045 | 16.333 0.131 | 16.164 0.114 | Class II | ||||
| 22 | 5 22 0.01 | 36 38 9.05 | 17.142 0.022 | 16.145 0.014 | 15.487 0.016 | 14.666 0.040 | 14.099 0.043 | 14.861 0.039 | 14.272 0.049 | 11.713 0.327 | 8.313 3.325 | Class II |
| 23 | 5 21 52.60 | 36 40 28.29 | 16.813 0.017 | 15.810 0.010 | 15.173 0.012 | 14.829 0.064 | 14.487 0.093 | 15.084 0.042 | 15.107 0.099 | 12.579 5.032 | 8.984 3.594 | Class II |
| 24 | 5 21 49.27 | 36 38 22.94 | 17.863 0.040 | 16.851 0.029 | 16.127 0.030 | 14.957 0.055 | 14.397 0.047 | 14.514 0.034 | 13.705 0.038 | 10.220 0.091 | 7.808 0.211 | Class II |
| 25 | 5 21 49.26 | 36 38 22.92 | 17.919 0.044 | 16.887 0.027 | 16.120 0.028 | 14.957 0.055 | 14.397 0.047 | 14.514 0.034 | 13.705 0.038 | 10.220 0.091 | 7.808 0.211 | Class II |
| 26 | 5 21 42.87 | 36 38 20.27 | 19.231 0.136 | 18.132 0.093 | 16.893 0.060 | 14.354 0.042 | 13.487 0.043 | 14.912 0.040 | 13.537 0.034 | 10.542 0.102 | 7.906 0.184 | Class I |
| 27 | 5 21 56.08 | 36 39 17.04 | 17.602 0.033 | 16.457 0.018 | 15.714 0.019 | 15.156 0.059 | 14.875 0.061 | Class II | ||||
| 28 | 5 21 49.89 | 36 40 38.79 | 17.945 0.045 | 16.784 0.025 | 15.812 0.021 | 14.916 0.113 | 14.531 0.130 | Class II | ||||
| 29 | 5 21 55.72 | 36 39 20.40 | 15.894 0.008 | 14.728 0.004 | 14.122 0.005 | 13.337 0.043 | 12.790 0.036 | 13.373 0.035 | 12.674 0.031 | 10.578 0.135 | 6.531 0.106 | Class II |
| 30 | 5 21 49.89 | 36 40 38.76 | 17.998 0.045 | 16.749 0.027 | 15.791 0.022 | 14.916 0.113 | 14.531 0.130 | Class II | ||||
| 31 | 5 21 53.22 | 36 38 20.43 | 15.480 0.006 | 14.171 0.003 | 13.283 0.003 | 12.294 0.040 | 11.839 0.045 | Class II/I | ||||
| 32 | 5 21 53.27 | 36 38 46.47 | 15.855 0.008 | 14.528 0.004 | 13.868 0.004 | 13.273 0.057 | 13.120 0.048 | 13.202 0.026 | 12.880 0.031 | 8.402 0.035 | 5.301 0.045 | Class II |
| 33 | 5 21 42.85 | 36 39 25.82 | 18.691 0.083 | 17.362 0.046 | 16.309 0.035 | 15.300 0.059 | 14.624 0.049 | Class I | ||||
| 34 | 5 21 47.31 | 36 39 13.54 | 17.508 0.029 | 16.168 0.016 | 14.859 0.010 | 13.418 0.039 | 12.593 0.037 | 13.116 0.025 | 12.223 0.024 | 10.214 0.075 | 8.625 0.481 | Class I |
| 35 | 5 21 53.54 | 36 40 4.15 | 18.986 0.115 | 17.617 0.052 | 16.731 0.048 | 16.262 0.108 | 16.043 0.094 | Class II | ||||
| 36 | 5 21 49.54 | 36 39 18.09 | 16.768 0.015 | 15.353 0.008 | 14.419 0.007 | 13.265 0.063 | 12.797 0.035 | Class II | ||||
| 37 | 5 21 50.20 | 36 39 22.73 | 16.904 0.017 | 15.441 0.008 | 14.285 0.006 | 13.086 0.047 | 12.536 0.053 | Class II | ||||
| 38 | 5 21 50.20 | 36 39 22.70 | 16.883 0.018 | 15.415 0.007 | 14.269 0.006 | 13.086 0.047 | 12.536 0.053 | Class II | ||||
| 39 | 5 21 49.55 | 36 39 10.02 | 15.301 0.005 | 13.823 0.002 | 12.872 0.002 | 11.897 0.029 | 11.530 0.035 | 12.166 0.023 | 11.556 0.022 | 9.748 0.052 | 6.318 0.091 | Class II |
| 40 | 5 21 49.54 | 36 39 18.05 | 16.827 0.017 | 15.338 0.007 | 14.425 0.007 | 13.265 0.063 | 12.797 0.035 | Class II | ||||
| 41 | 5 21 49.54 | 36 39 9.98 | 15.306 0.005 | 13.810 0.002 | 12.870 0.002 | 11.897 0.029 | 11.530 0.035 | 12.166 0.023 | 11.556 0.022 | 9.748 0.052 | 6.318 0.091 | Class II |
| 42 | 5 22 0.37 | 36 38 56.22 | 15.421 0.005 | 13.909 0.002 | 12.673 0.002 | 11.213 0.045 | 10.744 0.030 | 11.615 0.023 | 10.846 0.020 | 8.649 0.030 | 6.592 0.085 | Class II |
| 43 | 5 21 58.31 | 36 38 32.62 | 16.313 0.011 | 14.742 0.004 | 13.766 0.004 | 12.815 0.051 | 12.409 0.034 | Class II | ||||
| 44 | 5 21 52.10 | 36 39 24.75 | 18.948 0.111 | 17.354 0.041 | 16.000 0.025 | 14.313 0.046 | 13.373 0.042 | Class I | ||||
| 45 | 5 21 53.26 | 36 39 24.74 | 18.990 0.115 | 17.295 0.039 | 16.007 0.025 | 15.254 0.066 | 15.043 0.061 | 15.426 0.052 | 14.656 0.069 | 12.302 4.921 | 7.804 0.201 | Class II |
| 46 | 5 21 49.65 | 36 38 46.61 | 17.146 0.021 | 15.304 0.007 | 13.654 0.004 | 11.123 0.031 | 10.285 0.030 | 11.916 0.023 | 10.538 0.021 | 7.895 0.022 | 5.368 0.040 | Class I |
| 47 | 5 21 49.65 | 36 38 46.56 | 17.145 0.022 | 15.285 0.007 | 13.659 0.004 | 11.123 0.031 | 10.285 0.030 | 11.916 0.023 | 10.538 0.021 | 7.895 0.022 | 5.368 0.040 | Class I |
| 48 | 5 21 52.10 | 36 39 50.58 | 19.190 0.139 | 17.061 0.032 | 15.824 0.022 | 15.104 0.056 | 14.911 0.075 | 15.527 0.053 | 15.743 0.180 | 12.250 4.900 | 8.616 3.446 | Class I |
| 49 | 5 21 50.58 | 36 39 10.51 | 18.345 0.061 | 16.189 0.016 | 14.747 0.009 | 13.834 0.061 | 13.356 0.059 | Class I | ||||
| 50 | 5 21 50.57 | 36 39 10.44 | 18.490 0.074 | 16.139 0.014 | 14.718 0.008 | 13.834 0.061 | 13.356 0.059 | Class I | ||||
| 51 | 5 21 51.21 | 36 39 14.61 | 16.981 0.019 | 14.537 0.004 | 12.548 0.002 | 10.473 0.109 | 9.452 0.043 | 10.668 0.021 | 9.184 0.019 | 7.097 0.016 | 4.285 0.031 | Class I |
| 52 | 5 21 54.77 | 36 39 2.78 | 18.119 0.052 | 15.658 0.009 | 13.771 0.004 | 12.012 0.031 | 10.961 0.033 | 12.585 0.024 | 11.005 0.020 | 8.086 0.023 | 4.992 0.039 | Class I |
| IRAS 05177+3636 | ||||||||||||
| 53∗*∗*- objects that are located to the left of ZAMS in one color - magnitude diagram, | 5 20 57.32 | 36 40 31.55 | 17.059 0.019 | 16.736 0.026 | 16.315 0.036 | 15.862 0.074 | 15.666 0.050 | Class II | ||||
| 54∗*∗*- objects that are located to the left of ZAMS in one color - magnitude diagram, | 5 20 56.26 | 36 41 13.28 | 16.193 0.010 | 15.781 0.011 | 15.575 0.020 | 15.502 0.066 | 15.298 0.048 | Class II | ||||
| 55∗*∗*- objects that are located to the left of ZAMS in one color - magnitude diagram, | 5 21 9.90 | 36 36 6.29 | 16.599 0.013 | 16.125 0.015 | 15.841 0.023 | 15.593 0.098 | 15.322 0.064 | 15.324 0.044 | 15.505 0.116 | 11.825 4.730 | 8.344 3.338 | Class II |
| 56∗*∗*- objects that are located to the left of ZAMS in one color - magnitude diagram, | 5 21 4.01 | 36 38 51.52 | 17.347 0.025 | 16.868 0.030 | 16.383 0.038 | 15.943 0.083 | 15.829 0.059 | Class II | ||||
| 57∗*∗*- objects that are located to the left of ZAMS in one color - magnitude diagram, | 5 20 52.22 | 36 40 55.48 | 17.828 0.038 | 17.330 0.045 | 17.047 0.069 | 16.837 0.141 | 16.667 0.094 | Class II | ||||
| 58∗*∗*- objects that are located to the left of ZAMS in one color - magnitude diagram, | 5 20 52.14 | 36 38 22.87 | 18.008 0.045 | 17.476 0.051 | 17.083 0.072 | 16.732 0.127 | 16.380 0.076 | Class II | ||||
| 59∗*∗*- objects that are located to the left of ZAMS in one color - magnitude diagram, | 5 21 19.82 | 36 38 13.97 | 17.183 0.022 | 16.647 0.024 | 16.254 0.034 | 15.934 0.088 | 15.797 0.095 | Class II | ||||
| 60 | 5 20 57.35 | 36 39 39.30 | 13.396 0.001 | 12.845 0.001 | 12.526 0.002 | 12.232 0.024 | 12.086 0.023 | 8.714 0.035 | 7.141 0.141 | Class II | ||
| 61∗*∗*- objects that are located to the left of ZAMS in one color - magnitude diagram, | 5 21 5.58 | 36 36 56.21 | 17.489 0.028 | 16.933 0.031 | 16.604 0.047 | 16.235 0.085 | 16.025 0.073 | Class II | ||||
| 62∗*∗*- objects that are located to the left of ZAMS in one color - magnitude diagram, | 5 20 54.53 | 36 40 12.86 | 17.044 0.019 | 16.480 0.021 | 16.169 0.031 | 16.048 0.075 | 15.857 0.062 | 16.094 0.067 | 16.613 6.645 | 12.373 4.949 | 8.765 3.506 | Class II |
| 63∗*∗*- objects that are located to the left of ZAMS in one color - magnitude diagram, | 5 21 0.81 | 36 40 32.39 | 17.843 0.039 | 17.249 0.042 | 16.874 0.059 | 16.621 0.095 | 16.396 0.059 | Class II | ||||
| 64∗*∗*- objects that are located to the left of ZAMS in one color - magnitude diagram, | 5 20 49.42 | 36 39 14.36 | 17.732 0.035 | 17.137 0.038 | 16.757 0.053 | 16.425 0.106 | 16.230 0.067 | Class II | ||||
| 65∗*∗*- objects that are located to the left of ZAMS in one color - magnitude diagram, | 5 21 18.65 | 36 37 34.02 | 17.172 0.021 | 16.569 0.023 | 16.235 0.033 | 15.874 0.080 | 15.743 0.069 | Class II | ||||
| 66∗*∗*- objects that are located to the left of ZAMS in one color - magnitude diagram, | 5 20 56.94 | 36 40 14.57 | 17.769 0.036 | 17.155 0.038 | 16.807 0.056 | 16.604 0.109 | 16.398 0.082 | Class II | ||||
| 67 | 5 20 56.14 | 36 39 55.77 | 17.133 0.021 | 16.506 0.021 | 16.134 0.030 | 15.881 0.075 | 15.723 0.055 | Class II | ||||
| 68∗*∗*- objects that are located to the left of ZAMS in one color - magnitude diagram, | 5 20 50.16 | 36 37 33.85 | 17.905 0.041 | 17.276 0.043 | 16.942 0.063 | 16.482 0.084 | 16.241 0.103 | Class II | ||||
| 69 | 5 21 13.15 | 36 40 5.39 | 16.869 0.016 | 16.228 0.017 | 15.792 0.022 | 15.333 0.074 | 15.227 0.069 | Class II | ||||
| 70 | 5 21 15.76 | 36 37 47.52 | 17.099 0.020 | 16.451 0.020 | 16.082 0.029 | 15.829 0.076 | 15.558 0.068 | Class II | ||||
| 71 | 5 21 11.26 | 36 37 25.21 | 16.604 0.013 | 15.936 0.013 | 15.551 0.018 | 15.275 0.072 | 15.106 0.044 | 15.518 0.051 | 15.751 0.157 | 12.412 4.965 | 8.837 3.535 | Class II |
| 72 | 5 21 7.78 | 36 40 24.44 | 18.093 0.048 | 17.398 0.048 | 16.704 0.051 | 16.026 0.071 | 15.754 0.061 | 16.164 0.070 | 16.408 0.269 | 12.056 4.822 | 8.223 0.300 | Class II |
| 73 | 5 20 55.69 | 36 39 41.96 | 16.555 0.013 | 15.837 0.012 | 15.370 0.015 | 15.071 0.058 | 14.913 0.042 | Class II | ||||
| 74 | 5 21 2.11 | 36 40 19.64 | 16.591 0.013 | 15.869 0.012 | 15.404 0.016 | 15.021 0.048 | 14.812 0.041 | 15.132 0.040 | 14.896 0.071 | 12.342 4.937 | 8.865 3.546 | Class II |
| 75 | 5 20 55.78 | 36 37 39.92 | 17.686 0.034 | 16.958 0.032 | 16.562 0.045 | 16.327 0.090 | 16.098 0.072 | 15.686 0.052 | 15.395 0.104 | 12.112 4.845 | 8.495 3.398 | Class II |
| 76 | 5 20 54.61 | 36 36 12.15 | 16.954 0.018 | 16.206 0.016 | 15.741 0.021 | 15.511 0.058 | 15.327 0.052 | Class II | ||||
| 77 | 5 21 3.71 | 36 41 12.90 | 16.382 0.011 | 15.585 0.009 | 14.979 0.011 | 13.970 0.039 | 13.358 0.025 | Class II | ||||
| 78 | 5 21 0.83 | 36 36 44.86 | 17.863 0.039 | 17.053 0.035 | 16.492 0.042 | 16.041 0.074 | 15.882 0.056 | 15.917 0.063 | 16.543 0.298 | 12.014 4.806 | 8.950 0.502 | Class II |
| 79 | 5 20 58.54 | 36 37 31.33 | 15.594 0.006 | 14.773 0.005 | 14.301 0.006 | 13.991 0.049 | 13.849 0.025 | 13.968 0.028 | 13.822 0.037 | 12.209 4.884 | 8.784 3.514 | Class II |
| 80 | 5 20 51.52 | 36 39 59.32 | 17.405 0.026 | 16.577 0.023 | 16.109 0.030 | 15.800 0.084 | 15.645 0.058 | Class II | ||||
| 81 | 5 21 13.89 | 36 40 16.47 | 18.290 0.058 | 17.451 0.050 | 16.859 0.058 | 16.488 0.085 | 16.243 0.088 | Class II | ||||
| 82 | 5 21 2.98 | 36 41 40.15 | 14.580 0.003 | 13.726 0.002 | 13.243 0.003 | 12.504 0.032 | 12.057 0.021 | 12.630 0.024 | 12.028 0.024 | 10.064 0.078 | 8.374 0.296 | Class II |
| 83 | 5 21 3.71 | 36 41 12.88 | 16.383 0.011 | 15.502 0.009 | 14.920 0.011 | 13.970 0.039 | 13.358 0.025 | Class II | ||||
| 84 | 5 21 9.64 | 36 38 1.80 | 16.431 0.011 | 15.509 0.009 | 14.979 0.011 | 14.595 0.053 | 14.473 0.038 | 14.748 0.039 | 14.851 0.073 | 12.350 4.940 | 8.936 3.574 | Class II |
| 85 | 5 21 8.95 | 36 39 31.86 | 13.200 0.001 | 12.266 0.001 | 11.562 0.001 | 9.956 0.080 | 9.307 0.084 | Class I | ||||
| 86 | 5 20 46.12 | 36 39 15.97 | 18.165 0.052 | 17.226 0.041 | 16.607 0.047 | 16.202 0.078 | 16.063 0.066 | Class II | ||||
| 87 | 5 20 57.58 | 36 38 22.67 | 16.647 0.014 | 15.645 0.010 | 14.954 0.011 | 13.610 0.044 | 12.907 0.033 | Class I | ||||
| 88 | 5 21 4.03 | 36 40 18.54 | 14.783 0.003 | 13.779 0.002 | 13.268 0.003 | 12.526 0.062 | 12.091 0.025 | 12.633 0.024 | 12.078 0.023 | 10.316 0.103 | 7.934 0.251 | Class II |
| 89 | 5 20 58.94 | 36 40 2.17 | 16.041 0.008 | 15.023 0.006 | 14.406 0.007 | 13.522 0.027 | 12.709 0.026 | 11.108 0.192 | 8.678 3.471 | Class II | ||
| 90 | 5 21 10.65 | 36 35 28.49 | 18.070 0.047 | 17.051 0.035 | 16.207 0.033 | 15.317 0.087 | 14.776 0.096 | Class II | ||||
| 91 | 5 21 4.72 | 36 38 54.39 | 14.920 0.004 | 13.891 0.002 | 13.340 0.003 | 12.457 0.033 | 12.186 0.021 | 12.722 0.026 | 12.295 0.024 | 10.437 0.098 | 8.082 0.302 | Class II |
| 92 | 5 21 24.93 | 36 39 42.65 | 15.336 0.005 | 14.301 0.003 | 13.533 0.003 | 12.380 0.094 | 11.560 0.077 | 12.571 0.024 | 11.281 0.022 | 8.774 0.030 | 4.432 0.025 | Class I |
| 93 | 5 21 4.71 | 36 40 0.58 | 14.217 0.002 | 13.173 0.001 | 12.704 0.002 | 12.346 0.045 | 12.116 0.025 | 12.128 0.023 | 11.583 0.021 | 9.202 0.034 | 5.680 0.045 | Class II |
| 94 | 5 21 16.79 | 36 39 7.70 | 16.945 0.018 | 15.889 0.012 | 15.270 0.014 | 14.988 0.060 | 14.821 0.053 | 14.965 0.040 | 14.890 0.077 | 12.441 4.976 | 8.560 3.424 | Class II |
| 95 | 5 21 10.25 | 36 35 30.38 | 17.434 0.027 | 16.375 0.019 | 15.408 0.016 | 14.264 0.080 | 13.684 0.068 | 14.064 0.029 | 13.333 0.034 | 9.806 0.061 | 7.117 0.108 | Class II |
| 96 | 5 21 9.08 | 36 39 32.79 | 14.382 0.002 | 13.296 0.001 | 12.526 0.002 | 9.150 0.017 | 7.888 0.012 | 5.066 0.009 | 2.889 0.015 | Class I | ||
| 97 | 5 21 9.39 | 36 39 37.12 | 13.255 0.001 | 12.152 0.001 | 11.104 0.001 | 9.519 0.035 | 8.751 0.023 | Class I | ||||
| 98 | 5 21 8.84 | 36 38 45.20 | 15.811 0.007 | 14.702 0.004 | 13.987 0.005 | 13.537 0.043 | 13.358 0.039 | 13.713 0.028 | 13.493 0.033 | 12.417 4.967 | 8.720 3.488 | Class II |
| 99 | 5 20 59.77 | 36 39 8.53 | 18.982 0.108 | 17.869 0.074 | 16.880 0.060 | 15.980 0.071 | 15.240 0.046 | Class I | ||||
| 100 | 5 20 59.52 | 36 37 44.48 | 18.519 0.071 | 17.396 0.048 | 16.731 0.052 | 16.405 0.099 | 16.229 0.088 | Class I | ||||
| 101 | 5 20 59.62 | 36 38 26.75 | 12.763 0.001 | 11.637 0.001 | 10.542 0.001 | 9.307 0.040 | 8.477 0.021 | 9.665 0.023 | 8.408 0.018 | 5.389 0.012 | 3.031 0.019 | Class I |
| 102 | 5 21 18.90 | 36 38 35.75 | 17.363 0.025 | 16.170 0.016 | 15.352 0.015 | 14.480 0.059 | 14.141 0.073 | 14.374 0.034 | 14.121 0.050 | 10.105 0.073 | 7.973 3.189 | Class II |
| 103 | 5 21 3.97 | 36 39 35.15 | 15.310 0.005 | 14.104 0.003 | 13.286 0.003 | 11.965 0.048 | 11.599 0.023 | 11.973 0.024 | 11.159 0.021 | 8.888 0.031 | 4.845 0.032 | Class II |
| 104 | 5 21 3.70 | 36 40 2.05 | 16.841 0.016 | 15.632 0.010 | 14.791 0.009 | 13.822 0.039 | 13.298 0.026 | 13.799 0.028 | 13.021 0.028 | 10.525 0.108 | 7.168 0.122 | Class II |
| 105 | 5 21 4.70 | 36 39 57.62 | 17.306 0.024 | 16.091 0.015 | 15.388 0.016 | 13.590 0.052 | 12.866 0.033 | Class I | ||||
| 106 | 5 21 5.10 | 36 40 46.39 | 19.817 0.232 | 18.598 0.144 | 17.590 0.114 | 16.133 0.088 | 15.494 0.052 | Class I | ||||
| 107 | 5 21 8.31 | 36 35 22.66 | 19.150 0.126 | 17.928 0.078 | 17.044 0.070 | 16.041 0.098 | 15.801 0.106 | Class II | ||||
| 108 | 5 20 55.03 | 36 36 12.86 | 18.773 0.089 | 17.523 0.054 | 16.778 0.055 | 16.524 0.096 | 16.211 0.067 | Class II | ||||
| 109 | 5 21 9.10 | 36 38 59.38 | 16.448 0.012 | 15.156 0.006 | 14.334 0.006 | 13.890 0.045 | 13.674 0.029 | 14.034 0.030 | 13.660 0.035 | 12.465 4.986 | 8.171 3.268 | Class II |
| 110 | 5 21 7.28 | 36 40 2.19 | 16.081 0.009 | 14.761 0.005 | 14.076 0.005 | 13.269 0.050 | 12.912 0.023 | 13.013 0.026 | 12.280 0.025 | 10.069 0.062 | 6.864 0.093 | Class II |
| 111 | 5 20 48.86 | 36 36 57.60 | 18.697 0.084 | 17.320 0.045 | 16.474 0.041 | 16.091 0.078 | 15.859 0.074 | Class II | ||||
| 112 | 5 20 56.84 | 36 38 34.50 | 16.674 0.014 | 15.240 0.007 | 13.883 0.004 | 11.927 0.080 | 10.907 0.043 | Class I | ||||
| 113 | 5 21 7.27 | 36 40 5.43 | 18.124 0.050 | 16.663 0.025 | 15.633 0.019 | 14.096 0.061 | 13.598 0.029 | Class I | ||||
| 114 | 5 21 6.44 | 36 39 4.90 | 19.379 0.155 | 17.903 0.076 | 17.004 0.067 | 16.491 0.083 | 16.254 0.068 | Class II | ||||
| 115 | 5 20 48.56 | 36 36 41.30 | 19.044 0.115 | 17.560 0.056 | 16.434 0.040 | 15.676 0.094 | 15.349 0.057 | Class II | ||||
| 116 | 5 20 56.33 | 36 38 34.12 | 18.753 0.088 | 17.232 0.041 | 15.988 0.027 | 14.666 0.066 | 13.973 0.048 | Class I | ||||
| 117 | 5 21 12.70 | 36 40 1.84 | 17.406 0.026 | 15.870 0.012 | 14.981 0.011 | 14.280 0.051 | 13.869 0.038 | 14.615 0.033 | 14.181 0.046 | 12.493 4.997 | 8.752 3.501 | Class II |
| 118 | 5 20 50.91 | 36 36 40.72 | 19.331 0.149 | 17.767 0.067 | 16.651 0.049 | 16.105 0.104 | 15.588 0.057 | 15.943 0.060 | 15.823 0.149 | 12.579 5.032 | 8.380 3.352 | Class II |
| 119 | 5 21 8.22 | 36 39 59.67 | 17.106 0.020 | 15.538 0.009 | 14.584 0.008 | 13.959 0.046 | 13.789 0.031 | 14.199 0.032 | 13.582 0.037 | 11.604 0.286 | 6.892 0.094 | Class II |
| 120 | 5 20 59.50 | 36 37 39.10 | 19.222 0.134 | 17.642 0.060 | 16.654 0.049 | 16.039 0.089 | 15.769 0.065 | Class II | ||||
| 121 | 5 21 12.99 | 36 38 42.80 | 17.806 0.037 | 16.118 0.015 | 15.101 0.012 | 14.510 0.048 | 14.347 0.038 | 14.841 0.041 | 14.614 0.066 | 12.430 4.972 | 8.156 0.417 | Class II |
| 122 | 5 21 18.31 | 36 39 55.50 | 16.695 0.014 | 14.862 0.005 | 13.763 0.004 | 13.203 0.050 | 12.853 0.040 | 13.400 0.025 | 12.936 0.028 | 12.409 4.964 | 8.768 3.507 | Class II |
| 123 | 5 21 2.19 | 36 38 33.63 | 19.339 0.150 | 17.468 0.051 | 16.337 0.036 | 15.742 0.066 | 15.482 0.069 | 16.263 0.079 | 15.955 0.183 | 12.491 4.996 | 7.977 0.223 | Class I |
| 124 | 5 21 24.16 | 36 39 50.17 | 18.625 0.078 | 16.674 0.025 | 15.412 0.016 | 14.774 0.054 | 14.535 0.041 | Class I | ||||
| 125 | 5 21 1.49 | 36 38 49.98 | 17.760 0.036 | 15.807 0.011 | 14.741 0.009 | 13.299 0.026 | 12.167 0.023 | 9.882 0.061 | 6.602 0.079 | Class I | ||
| 126 | 5 20 56.73 | 36 38 29.60 | 15.831 0.007 | 13.825 0.002 | 12.202 0.001 | 10.637 0.066 | 9.832 0.030 | 10.559 0.024 | 9.211 0.020 | 7.377 0.018 | 3.722 0.023 | Class I |
| 127 | 5 20 58.12 | 36 37 53.43 | 19.054 0.115 | 16.971 0.032 | 15.803 0.023 | 15.126 0.069 | 14.899 0.044 | Class I | ||||
| 128 | 5 21 5.50 | 36 39 37.26 | 15.548 0.006 | 13.454 0.002 | 11.405 0.001 | 9.270 0.038 | 8.271 0.022 | 9.443 0.024 | 8.042 0.020 | 5.306 0.014 | 2.747 0.017 | Class I |
| 129 | 5 21 12.60 | 36 39 21.83 | 16.586 0.023 | 13.800 0.004 | 10.828 0.037 | 9.760 0.022 | 11.219 0.032 | 9.516 0.021 | 7.407 0.020 | 4.801 0.061 | Class I | |
| 130 | 5 21 12.05 | 36 39 18.55 | 17.596 0.115 | 13.560 0.047 | 11.784 0.024 | 14.469 0.285 | 11.592 0.058 | 8.067 0.030 | 3.449 0.022 | Class I | ||
| 131 | 5 21 6.60 | 36 39 55.02 | 16.423 0.020 | 14.843 0.010 | 13.409 0.046 | 12.927 0.031 | 13.560 0.030 | 12.469 0.028 | 10.390 0.081 | 5.166 0.038 | Class I | |
| IRAS 05168+3634 | ||||||||||||
| 132∗*∗*- objects that are located to the left of ZAMS in one color - magnitude diagram, | 5 20 20.20 | 36 37 59.90 | 10.460 0.000 | 10.817 0.000 | 10.191 0.000 | 10.071 0.042 | 10.024 0.020 | 9.845 0.021 | 9.679 0.017 | 9.000 0.035 | 3.247 0.008 | Class II |
| 133∗∗**∗∗**- objects that are located to the left of ZAMS in both color - magnitude diagrams | 5 20 15.70 | 36 38 11.00 | 17.765 0.043 | 17.262 0.042 | 16.923 0.064 | 16.408 0.094 | 16.128 0.105 | Class II | ||||
| 134∗*∗*- objects that are located to the left of ZAMS in one color - magnitude diagram, | 5 20 11.59 | 36 39 27.50 | 16.382 0.013 | 15.831 0.012 | 15.510 0.018 | 15.376 0.068 | 15.168 0.070 | Class II | ||||
| 135∗∗**∗∗**- objects that are located to the left of ZAMS in both color - magnitude diagrams | 5 20 26.28 | 36 40 10.41 | 17.761 0.042 | 17.142 0.038 | 16.714 0.053 | 16.448 0.075 | 16.258 0.083 | Class II | ||||
| 136∗∗**∗∗**- objects that are located to the left of ZAMS in both color - magnitude diagrams | 5 20 25.70 | 36 35 7.78 | 17.433 0.032 | 16.783 0.027 | 16.423 0.041 | 16.189 0.086 | 15.862 0.092 | 16.388 0.098 | 15.972 0.202 | 12.449 4.980 | 8.851 3.540 | Class II |
| 137∗*∗*- objects that are located to the left of ZAMS in one color - magnitude diagram, | 5 20 35.90 | 36 37 41.83 | 17.206 0.026 | 16.470 0.021 | 15.945 0.026 | 15.299 0.068 | 14.884 0.043 | 15.197 0.043 | 14.810 0.076 | 12.003 4.801 | 8.350 0.522 | Class II |
| 138∗*∗*- objects that are located to the left of ZAMS in one color - magnitude diagram, | 5 20 20.10 | 36 38 56.48 | 17.772 0.043 | 17.009 0.033 | 16.573 0.046 | 16.213 0.087 | 16.082 0.074 | Class II | ||||
| 139∗*∗*- objects that are located to the left of ZAMS in one color - magnitude diagram, | 5 20 29.81 | 36 35 13.37 | 16.996 0.022 | 16.227 0.017 | 15.724 0.022 | 14.710 0.049 | 14.146 0.039 | 15.056 0.040 | 14.593 0.065 | 11.798 4.719 | 8.538 3.415 | Class II |
| 140 | 5 20 35.46 | 36 38 41.09 | 14.934 0.004 | 14.164 0.003 | 13.718 0.004 | 13.280 0.036 | 12.917 0.025 | 13.422 0.039 | 12.996 0.037 | 11.189 0.192 | 8.547 3.419 | Class II |
| 141∗*∗*- objects that are located to the left of ZAMS in one color - magnitude diagram, | 5 20 24.45 | 36 36 7.61 | 17.021 0.022 | 16.218 0.016 | 15.732 0.022 | 15.178 0.057 | 15.005 0.045 | Class II | ||||
| 142∗*∗*- objects that are located to the left of ZAMS in one color - magnitude diagram, | 5 20 26.36 | 36 36 25.79 | 17.190 0.026 | 16.382 0.019 | 15.913 0.026 | 15.512 0.072 | 15.181 0.051 | 15.840 0.062 | 17.121 6.848 | 12.120 4.848 | 8.763 3.505 | Class II |
| 143 | 5 20 18.97 | 36 36 34.19 | 13.522 0.002 | 12.712 0.001 | 12.172 0.001 | 11.086 0.021 | 10.354 0.020 | 7.375 0.017 | 3.053 0.019 | Class II | ||
| 144∗*∗*- objects that are located to the left of ZAMS in one color - magnitude diagram, | 5 20 33.88 | 36 37 15.21 | 17.906 0.048 | 17.078 0.036 | 16.570 0.046 | 16.165 0.083 | 16.019 0.057 | Class II | ||||
| 145∗*∗*- objects that are located to the left of ZAMS in one color - magnitude diagram, | 5 20 28.11 | 36 37 15.88 | 17.693 0.040 | 16.864 0.029 | 16.369 0.039 | 16.066 0.091 | 15.798 0.066 | Class II | ||||
| 146 | 5 20 12.56 | 36 38 39.47 | 15.335 0.006 | 14.496 0.004 | 14.033 0.005 | 13.169 0.042 | 12.735 0.027 | 13.399 0.025 | 12.837 0.028 | 11.018 0.153 | 8.641 3.456 | Class II |
| 147 | 5 20 27.69 | 36 40 8.26 | 16.677 0.016 | 15.782 0.011 | 15.289 0.015 | 14.974 0.047 | 14.829 0.038 | 15.139 0.041 | 15.182 0.102 | 12.198 4.879 | 8.357 3.343 | Class II |
| 148 | 5 20 16.59 | 36 36 17.77 | 18.804 0.110 | 17.839 0.072 | 17.129 0.077 | 16.071 0.100 | 15.738 0.092 | Class II | ||||
| 149 | 5 20 13.90 | 36 37 49.56 | 16.185 0.011 | 15.207 0.007 | 14.488 0.007 | 13.749 0.039 | 13.293 0.036 | 13.690 0.027 | 12.898 0.029 | 10.298 0.094 | 8.665 3.466 | Class II |
| 150 | 5 20 11.29 | 36 36 50.58 | 17.747 0.042 | 16.738 0.026 | 16.157 0.032 | 15.796 0.081 | 15.652 0.079 | Class II | ||||
| 151 | 5 20 20.55 | 36 37 49.25 | 17.041 0.022 | 15.993 0.013 | 15.220 0.014 | 13.969 0.058 | 13.241 0.062 | Class I | ||||
| 152 | 5 20 26.82 | 36 37 29.47 | 18.177 0.062 | 17.104 0.036 | 16.453 0.042 | 15.910 0.080 | 15.737 0.074 | Class II | ||||
| 153 | 5 20 19.63 | 36 37 1.02 | 17.073 0.023 | 15.963 0.013 | 15.288 0.015 | 14.818 0.062 | 14.605 0.065 | Class II | ||||
| 154 | 5 20 9.91 | 36 38 0.47 | 18.247 0.066 | 17.113 0.037 | 16.386 0.040 | 15.886 0.077 | 15.709 0.110 | Class II | ||||
| 155 | 5 20 25.67 | 36 38 23.10 | 16.781 0.018 | 15.607 0.010 | 14.657 0.009 | 13.459 0.050 | 12.781 0.037 | Class I | ||||
| 156 | 5 20 22.49 | 36 37 59.04 | 14.409 0.003 | 13.157 0.001 | 12.403 0.002 | 11.689 0.133 | 11.134 0.084 | Class II | ||||
| 157 | 5 20 31.43 | 36 38 18.54 | 17.353 0.029 | 16.072 0.014 | 15.320 0.015 | 14.860 0.056 | 14.725 0.043 | Class II | ||||
| 158 | 5 20 25.79 | 36 37 51.90 | 18.875 0.116 | 17.575 0.056 | 16.742 0.054 | 16.180 0.093 | 15.992 0.100 | Class II | ||||
| 159 | 5 20 21.40 | 36 36 26.66 | 15.650 0.007 | 14.325 0.003 | 13.401 0.003 | 12.218 0.044 | 11.578 0.025 | 12.091 0.022 | 11.423 0.023 | 9.512 0.048 | 5.023 0.029 | Class I |
| 160 | 5 20 26.58 | 36 37 54.16 | 16.574 0.015 | 15.185 0.007 | 14.228 0.006 | 12.833 0.043 | 12.417 0.025 | 13.354 0.026 | 12.548 0.026 | 10.265 0.081 | 8.707 3.483 | Class II |
| 161 | 5 20 27.09 | 36 35 50.87 | 19.067 0.138 | 17.639 0.059 | 16.585 0.047 | 16.027 0.107 | 15.574 0.057 | 15.888 0.066 | 15.681 0.162 | 11.958 4.783 | 8.029 3.212 | Class II |
| 162 | 5 20 14.46 | 36 37 4.70 | 14.643 0.003 | 13.170 0.001 | 11.977 0.001 | 9.930 0.049 | 9.061 0.027 | 10.137 0.022 | 8.885 0.020 | 6.353 0.017 | 3.314 0.021 | Class I |
| 163 | 5 20 16.46 | 36 36 42.03 | 17.414 0.031 | 15.940 0.013 | 15.069 0.012 | 14.164 0.041 | 13.793 0.045 | Class II | ||||
| 164 | 5 20 18.94 | 36 37 50.41 | 15.565 0.007 | 14.079 0.003 | 13.033 0.002 | 11.913 0.042 | 11.459 0.040 | 11.695 0.022 | 10.991 0.020 | 9.292 0.048 | 6.300 0.088 | Class II |
| 165 | 5 20 19.89 | 36 38 6.82 | 17.969 0.051 | 16.470 0.021 | 15.219 0.014 | 13.632 0.052 | 13.035 0.040 | Class I | ||||
| 166 | 5 20 17.40 | 36 36 56.46 | 17.944 0.050 | 16.312 0.018 | 15.298 0.015 | 14.734 0.056 | 14.441 0.055 | Class II | ||||
| 167 | 5 20 18.91 | 36 36 50.13 | 18.338 0.072 | 16.647 0.024 | 15.627 0.020 | 15.200 0.067 | 14.934 0.057 | Class II | ||||
| 168 | 5 20 11.01 | 36 36 42.80 | 18.304 0.070 | 16.602 0.023 | 15.054 0.012 | 13.294 0.040 | 12.481 0.029 | 13.824 0.028 | 12.605 0.028 | 10.259 0.079 | 7.340 0.174 | Class I |
| 169 | 5 20 20.18 | 36 37 24.49 | 16.980 0.021 | 15.262 0.007 | 14.182 0.006 | 13.149 0.038 | 12.664 0.029 | Class II | ||||
| 170 | 5 20 27.07 | 36 39 2.70 | 18.750 0.103 | 16.965 0.032 | 15.890 0.025 | 15.352 0.068 | 15.134 0.045 | 15.504 0.051 | 14.774 0.070 | 11.884 4.754 | 7.607 0.159 | Class II |
| 171 | 5 20 30.05 | 36 39 7.69 | 17.945 0.050 | 16.010 0.014 | 14.815 0.010 | 14.168 0.041 | 13.941 0.032 | 14.491 0.034 | 13.997 0.050 | 12.494 4.998 | 8.125 3.250 | Class I |
| 172 | 5 20 31.12 | 36 38 42.97 | 19.042 0.135 | 17.095 0.036 | 16.039 0.029 | 15.362 0.061 | 15.211 0.052 | 15.651 0.051 | 16.175 0.217 | 12.212 4.885 | 8.623 3.449 | Class I |
| 173 | 5 20 25.05 | 36 37 51.82 | 17.977 0.051 | 16.023 0.014 | 14.756 0.009 | 13.681 0.046 | 13.114 0.040 | 13.929 0.030 | 13.067 0.031 | 11.360 0.218 | 8.564 3.426 | Class I |
| 174 | 5 20 28.42 | 36 38 59.11 | 15.580 0.007 | 13.584 0.002 | 12.543 0.002 | 11.993 0.039 | 11.814 0.023 | 12.159 0.024 | 11.851 0.024 | 11.592 0.283 | 8.337 3.335 | Class I |
| 175 | 5 20 21.00 | 36 37 59.66 | 15.934 0.009 | 13.937 0.002 | 12.669 0.002 | 11.280 0.049 | 10.800 0.035 | Class I | ||||
| 176 | 5 20 19.08 | 36 37 25.70 | 18.950 0.125 | 16.912 0.031 | 15.574 0.019 | 14.443 0.072 | 13.889 0.039 | Class I | ||||
| 177 | 5 20 25.33 | 36 38 28.84 | 17.685 0.040 | 15.598 0.009 | 13.911 0.005 | 11.645 0.068 | 9.749 0.023 | 12.209 0.024 | 9.497 0.021 | 4.758 0.014 | 1.701 0.010 | Class I |
| 178 | 5 20 27.40 | 36 35 29.80 | 16.371 0.013 | 14.233 0.003 | 12.730 0.002 | 11.330 0.037 | 10.536 0.022 | 11.658 0.023 | 10.453 0.021 | 8.312 0.025 | 6.183 0.063 | Class I |
| 179 | 5 20 9.53 | 36 35 54.38 | 18.830 0.113 | 16.560 0.023 | 14.797 0.010 | 12.586 0.041 | 11.575 0.036 | 12.839 0.024 | 11.568 0.022 | 8.786 0.033 | 6.723 0.097 | Class I |
| 180 | 5 20 19.69 | 36 37 27.04 | 18.864 0.115 | 16.514 0.021 | 15.353 0.016 | 14.377 0.052 | 13.945 0.037 | Class I | ||||
| 181 | 5 20 12.48 | 36 37 37.00 | 19.186 0.155 | 16.835 0.029 | 15.585 0.019 | 14.974 0.057 | 14.723 0.053 | Class I | ||||
| 182 | 5 20 19.63 | 36 36 22.94 | 18.410 0.076 | 15.895 0.012 | 13.195 0.003 | 9.521 0.042 | 8.308 0.025 | 9.884 0.020 | 7.997 0.019 | 4.914 0.011 | 2.323 0.012 | Class I |
| 183 | 5 20 16.44 | 36 37 18.70 | 14.183 0.002 | 11.404 0.000 | 9.804 0.000 | 7.124 0.038 | 6.516 0.024 | 7.661 0.030 | 6.374 0.025 | 3.827 0.015 | 1.397 0.014 | Class I |
| 184 | 5 20 20.86 | 36 37 8.90 | 18.445 0.079 | 15.629 0.010 | 14.202 0.006 | 13.410 0.036 | 13.238 0.023 | Class I | ||||
| 185 | 5 20 32.42 | 36 39 4.10 | 18.602 0.090 | 15.725 0.011 | 14.198 0.006 | 13.321 0.039 | 13.115 0.028 | 13.722 0.027 | 13.155 0.031 | 12.540 5.016 | 8.884 3.554 | Class I |
| 186 | 5 20 22.74 | 36 38 11.34 | 19.385 0.185 | 16.348 0.018 | 14.729 0.009 | 13.536 0.046 | 12.927 0.038 | Class I | ||||
| 187 | 5 20 24.00 | 36 38 1.51 | 18.043 0.086 | 16.428 0.041 | 13.897 0.106 | 12.975 0.083 | 14.086 0.039 | 12.262 0.035 | 9.392 0.054 | 4.314 0.034 | Class I | |
| 188 | 5 20 19.57 | 36 37 43.80 | 17.574 0.056 | 15.247 0.014 | 13.643 0.071 | 12.772 0.042 | 13.106 0.028 | 11.462 0.023 | 10.026 0.095 | 5.657 0.035 | Class I | |
| IRAS 05162+3639 | ||||||||||||
| 189 | 5 19 30.83 | 36 43 55.65 | 19.135 0.085 | 17.471 0.039 | 16.083 0.028 | 15.175 0.075 | 14.515 0.074 | 15.334 0.050 | 14.406 0.059 | 10.613 0.123 | 8.050 0.288 | Class I |
| 190 | 5 19 41.76 | 36 42 24.60 | 17.844 0.042 | 16.148 0.017 | 14.870 0.010 | 12.730 0.038 | 11.554 0.031 | Class I | ||||
| 191 | 5 19 41.15 | 36 44 37.62 | 17.893 0.084 | 16.458 0.041 | 14.803 0.056 | 13.905 0.047 | 15.197 0.044 | 14.032 0.047 | 10.772 0.138 | 8.501 0.389 | Class I | |
| 192 | 5 19 42.00 | 36 42 30.04 | 16.593 0.025 | 13.480 0.003 | 10.537 0.035 | 9.390 0.040 | 11.251 0.023 | 9.238 0.021 | 6.639 0.015 | 3.588 0.015 | Class I | |
| 193 | 5 19 46.13 | 36 43 13.58 | 17.523 0.059 | 16.489 0.042 | 15.550 0.089 | 14.865 0.079 | 15.613 0.057 | 14.960 0.081 | 11.386 0.229 | 8.402 0.423 | Class I | |
| IRAS 05156+3643 | ||||||||||||
| 194∗*∗*- objects that are located to the left of ZAMS in one color - magnitude diagram, | 5 19 12.35 | 36 49 36.47 | 16.273 0.007 | 15.878 0.010 | 15.637 0.019 | 15.442 0.073 | 15.270 0.073 | 15.507 0.047 | 15.482 0.120 | 12.385 4.954 | 8.424 3.370 | Class II |
| 195∗*∗*- objects that are located to the left of ZAMS in one color - magnitude diagram, | 5 18 53.30 | 36 47 7.94 | 16.714 0.010 | 16.193 0.012 | 15.925 0.024 | 15.660 0.076 | 15.444 0.108 | Class II | ||||
| 196∗*∗*- objects that are located to the left of ZAMS in one color - magnitude diagram, | 5 19 2.22 | 36 47 45.32 | 17.365 0.017 | 16.827 0.022 | 16.409 0.037 | 16.106 0.095 | 15.929 0.096 | Class II | ||||
| 197∗*∗*- objects that are located to the left of ZAMS in one color - magnitude diagram, | 5 18 52.57 | 36 47 14.34 | 17.451 0.019 | 16.910 0.024 | 16.540 0.041 | 16.069 0.077 | 15.824 0.108 | Class II | ||||
| 198∗*∗*- objects that are located to the left of ZAMS in one color - magnitude diagram, | 5 19 1.56 | 36 49 4.99 | 18.066 0.032 | 17.513 0.041 | 17.074 0.068 | 16.736 0.124 | 16.600 0.117 | Class II | ||||
| 199∗*∗*- objects that are located to the left of ZAMS in one color - magnitude diagram, | 5 18 57.85 | 36 48 46.99 | 18.302 0.039 | 17.728 0.050 | 17.285 0.082 | 16.886 0.152 | 16.487 0.111 | Class II | ||||
| 200∗*∗*- objects that are located to the left of ZAMS in one color - magnitude diagram, | 5 19 10.70 | 36 46 50.54 | 18.114 0.034 | 17.537 0.042 | 17.182 0.075 | 16.679 0.120 | 16.477 0.141 | Class II | ||||
| 201 | 5 18 57.38 | 36 50 3.22 | 16.362 0.008 | 15.771 0.009 | 15.436 0.016 | 15.292 0.089 | 15.048 0.096 | 14.721 0.038 | 14.793 0.075 | 12.418 4.967 | 8.952 3.581 | Class II |
| 202 | 5 19 1.73 | 36 49 16.24 | 16.752 0.011 | 16.143 0.012 | 15.806 0.022 | 15.337 0.074 | 15.110 0.070 | 15.128 0.039 | 15.727 0.149 | 11.993 4.797 | 8.792 3.517 | Class II |
| 203 | 5 19 9.56 | 36 48 19.44 | 17.230 0.016 | 16.621 0.018 | 16.212 0.031 | 15.993 0.079 | 15.674 0.093 | Class II | ||||
| 204 | 5 19 5.22 | 36 46 40.29 | 17.109 0.014 | 16.490 0.016 | 16.165 0.030 | 15.894 0.073 | 15.744 0.082 | 15.660 0.056 | 14.784 0.072 | 12.285 4.914 | 7.845 0.251 | Class II |
| 205 | 5 18 59.17 | 36 48 56.82 | 16.673 0.010 | 16.044 0.011 | 15.604 0.018 | 15.363 0.066 | 15.184 0.079 | Class II | ||||
| 206 | 5 19 12.61 | 36 47 19.92 | 18.141 0.035 | 17.503 0.041 | 17.037 0.066 | 16.670 0.127 | 16.259 0.118 | Class II | ||||
| 207 | 5 18 58.77 | 36 48 55.83 | 16.993 0.013 | 16.319 0.014 | 15.908 0.024 | 15.759 0.074 | 15.551 0.066 | Class II | ||||
| 208 | 5 18 59.27 | 36 48 26.00 | 18.013 0.031 | 17.334 0.035 | 16.820 0.054 | 16.583 0.084 | 16.355 0.092 | Class II | ||||
| 209 | 5 19 6.63 | 36 48 15.58 | 16.681 0.010 | 16.001 0.011 | 15.628 0.019 | 15.500 0.068 | 15.263 0.082 | 15.078 0.039 | 15.180 0.091 | 11.870 4.748 | 8.823 3.529 | Class II |
| 210 | 5 18 53.51 | 36 49 42.67 | 18.168 0.035 | 17.477 0.040 | 17.110 0.070 | 16.725 0.118 | 16.603 0.112 | Class II | ||||
| 211 | 5 19 0.52 | 36 48 23.20 | 16.050 0.006 | 15.347 0.006 | 14.919 0.010 | 14.734 0.051 | 14.551 0.065 | 14.800 0.034 | 14.948 0.079 | 12.478 4.991 | 8.765 3.506 | Class II |
| 212 | 5 19 1.97 | 36 49 4.66 | 18.379 0.042 | 17.674 0.048 | 17.287 0.082 | 16.828 0.122 | 16.708 0.145 | Class II | ||||
| 213 | 5 18 52.77 | 36 47 7.32 | 17.026 0.013 | 16.278 0.013 | 15.634 0.018 | 14.655 0.046 | 14.095 0.061 | 14.532 0.033 | 14.069 0.042 | 12.215 4.886 | 8.964 3.586 | Class II |
| 214 | 5 18 59.27 | 36 49 8.53 | 16.649 0.010 | 15.842 0.009 | 15.400 0.015 | 15.171 0.060 | 15.002 0.062 | Class II | ||||
| 215 | 5 19 5.15 | 36 48 43.47 | 19.481 0.114 | 18.644 0.116 | 17.815 0.134 | 16.850 0.110 | 16.496 0.118 | Class II | ||||
| 216 | 5 19 1.48 | 36 50 1.59 | 17.747 0.024 | 16.903 0.024 | 16.274 0.033 | 15.807 0.082 | 15.354 0.102 | Class II | ||||
| 217 | 5 19 2.15 | 36 50 10.28 | 18.787 0.061 | 17.894 0.058 | 17.169 0.074 | 16.345 0.111 | 16.125 0.106 | Class II | ||||
| 218 | 5 19 10.75 | 36 49 38.97 | 18.068 0.032 | 17.161 0.030 | 15.943 0.025 | 13.716 0.053 | 12.738 0.035 | 14.030 0.037 | 12.774 0.029 | 9.965 0.065 | 7.564 0.179 | Class I |
| 219 | 5 19 0.83 | 36 49 48.31 | 13.885 0.002 | 12.958 0.001 | 12.202 0.001 | 10.715 0.028 | 9.591 0.058 | 11.000 0.023 | 9.762 0.021 | 6.491 0.016 | 4.228 0.022 | Class I |
| 220 | 5 19 2.38 | 36 47 39.53 | 17.349 0.017 | 16.397 0.015 | 15.823 0.022 | 15.483 0.066 | 15.317 0.083 | Class II | ||||
| 221 | 5 19 7.41 | 36 47 29.26 | 15.728 0.005 | 14.746 0.004 | 14.161 0.005 | 13.820 0.045 | 13.483 0.045 | Class II | ||||
| 222 | 5 18 51.34 | 36 47 15.71 | 18.485 0.046 | 17.484 0.040 | 16.913 0.058 | 14.934 0.094 | 13.998 0.055 | Class I | ||||
| 223 | 5 19 2.57 | 36 50 17.73 | 19.033 0.076 | 17.964 0.062 | 17.067 0.068 | 16.507 0.128 | 16.031 0.096 | Class II | ||||
| 224 | 5 19 8.48 | 36 46 33.48 | 18.703 0.057 | 17.618 0.045 | 16.575 0.043 | 15.751 0.101 | 15.411 0.076 | Class II | ||||
| 225 | 5 19 1.52 | 36 46 19.54 | 15.822 0.005 | 14.706 0.004 | 14.016 0.005 | 12.939 0.036 | 12.428 0.034 | 13.217 0.025 | 12.334 0.025 | 9.593 0.049 | 5.790 0.037 | Class II |
| 226 | 5 18 55.95 | 36 46 26.10 | 17.840 0.026 | 16.718 0.020 | 16.072 0.027 | 15.734 0.085 | 15.486 0.088 | Class II | ||||
| 227 | 5 19 6.83 | 36 47 35.49 | 12.942 0.001 | 11.788 0.001 | 11.003 0.001 | 10.604 0.034 | 10.476 0.030 | 10.799 0.022 | 10.499 0.021 | 10.422 0.097 | 8.994 3.598 | Class II |
| 228 | 5 19 9.74 | 36 45 55.09 | 16.899 0.012 | 15.623 0.008 | 14.772 0.009 | 13.824 0.041 | 13.310 0.035 | 14.123 0.030 | 13.405 0.033 | 10.917 0.148 | 8.248 3.299 | Class II |
| 229 | 5 19 1.88 | 36 49 58.01 | 17.800 0.025 | 16.441 0.016 | 15.618 0.018 | 15.144 0.059 | 14.954 0.071 | Class II | ||||
| 230 | 5 19 5.53 | 36 47 8.66 | 19.707 0.140 | 18.325 0.086 | 16.898 0.058 | 16.041 0.093 | 15.551 0.075 | Class II | ||||
| 231 | 5 19 2.23 | 36 47 55.04 | 19.008 0.074 | 17.571 0.043 | 16.667 0.047 | 16.350 0.101 | 16.161 0.090 | Class II | ||||
| 232 | 5 19 1.47 | 36 47 33.64 | 17.614 0.022 | 16.121 0.012 | 14.256 0.006 | 12.840 0.054 | 11.710 0.037 | 12.813 0.024 | 11.022 0.022 | 7.881 0.022 | 4.879 0.026 | Class I |
| 233 | 5 18 58.20 | 36 46 20.51 | 18.047 0.031 | 16.534 0.017 | 15.551 0.017 | 15.085 0.057 | 14.886 0.062 | 15.521 0.047 | 15.364 0.101 | 12.353 4.941 | 8.465 3.386 | Class II |
| 234 | 5 19 3.62 | 36 46 15.68 | 14.644 0.002 | 13.128 0.001 | 11.364 0.001 | 8.553 0.033 | 7.541 0.021 | 9.051 0.022 | 7.530 0.021 | 4.630 0.014 | 2.655 0.018 | Class I |
| 235 | 5 19 15.09 | 36 49 7.01 | 19.399 0.107 | 17.879 0.057 | 16.722 0.050 | 15.847 0.068 | 15.516 0.092 | Class II | ||||
| 236 | 5 18 50.23 | 36 49 32.09 | 20.325 0.245 | 18.765 0.128 | 17.829 0.134 | 15.935 0.087 | 14.873 0.063 | 16.072 0.076 | 14.953 0.080 | 12.067 0.425 | 8.469 3.388 | Class I |
| 237 | 5 19 2.17 | 36 48 13.68 | 17.374 0.018 | 15.643 0.008 | 14.640 0.008 | 14.233 0.071 | 13.953 0.061 | 14.450 0.032 | 14.177 0.052 | 12.156 4.862 | 8.646 3.458 | Class II |
| 238 | 5 18 56.01 | 36 45 55.86 | 19.821 0.154 | 17.615 0.044 | 15.311 0.014 | 12.656 0.054 | 11.758 0.050 | Class I | ||||
| 239 | 5 18 55.53 | 36 45 59.84 | 16.678 0.010 | 14.230 0.002 | 12.089 0.001 | 9.922 0.041 | 8.950 0.036 | 10.167 0.024 | 8.886 0.021 | 6.745 0.017 | 4.196 0.022 | Class I |
| 240 | 5 18 58.96 | 36 46 2.92 | 19.860 0.160 | 16.504 0.016 | 14.455 0.007 | 13.338 0.046 | 12.812 0.041 | 13.853 0.028 | 12.783 0.026 | 12.137 4.855 | 7.455 0.132 | Class I |
| ID | Name | [8.28] m | [12.13] m | [14.65] m | [21.3] m | [12] m | [25] m | [60] m | [100] m | [70] m | [160] m | [250] m | [350] m | [500] m |
| (mJy) | (mJy) | (mJy) | (mJy) | (mJy) | (mJy) | (mJy) | (mJy) | (mJy) | (mJy) | (mJy) | (mJy) | (mJy) | ||
| (1) | (2) | (3) | (4) | (5) | (6) | (7) | (8) | (9) | (10) | (11) | (12) | (13) | (14) | (15) |
| 15 | 391 64 | |||||||||||||
| 31 | IRAS 05184+3635 | 109 11 | 266 53 | 440 57 | 523 68 | 5800 638 | 19500 5070 | 1415 10.552∗*∗*-fluxes taken from PACS: Extended source list catalog in blue band (70 m), | ||||||
| 51 | 928 152 | 6942 5.215∗∗**∗∗**- fluxes taken from PACS: Extended source list catalog in red band (160 m) | ||||||||||||
| 60 | 1059 94 | |||||||||||||
| 85 | 1006 103 | 4069 671 | ||||||||||||
| 90 | 130 41 | |||||||||||||
| 92 | 2322 20 | 3421 110 | ||||||||||||
| 95 | 130 41 | |||||||||||||
| 96 | 1006 103 | 4069 671 | ||||||||||||
| 97 | IRAS 05177+3636 | 224 22 | 738 52 | 1590 127 | 4290 987 | 15900 2703 | ||||||||
| 101 | G170.7247-00.1388 | 171 20 | 814 125 | 1444 979 | ||||||||||
| 112 | 2951 34 | 7689 279 | ||||||||||||
| 126 | 2951 34 | 7689 279 | ||||||||||||
| 128 | G170.7196-00.1118 | 181 21 | 1261 58 | 3683 349 | ||||||||||
| 130 | 2693 70 | 5185 594 | ||||||||||||
| 177 | G170.6589-00.2334 | 159 19 | 859 143 | 5163 813 | ||||||||||
| 178 | 291 47 | |||||||||||||
| 182 | G170.6758-00.2691 | 185 22 | 662 132 | 525 105 | 1735 75 | 5052 7.704∗∗**∗∗**- fluxes taken from PACS: Extended source list catalog in red band (160 m) | ||||||||
| 183 | IRAS 05168+3634 | 891 89 | 1450 171 | 1370 161 | 2450 408 | 1160 81 | 6340 444 | 167000 23380 | 379000 45480 | 4472 103 | 11125 1724 | |||
| 189 | 109 32 | |||||||||||||
| 190 | IRAS 05162+3639 | 250 125 | 269 73 | 1280 179 | 4590 872 | 1545 12 | 2814 74 | |||||||
| 192 | IRAS 05162+3639 | 250 125 | 269 73 | 1280 179 | 4590 872 | 1545 12 | 2814 74 | |||||||
| 216 | 7684 212 | 4171.5 111 | 2295 72 | |||||||||||
| 219 | 270 22 | 574 60 | 7684 212 | 4171.5 111 | 2295 72 | |||||||||
| 229 | 7684 212 | 4171.5 111 | 2295 72 | |||||||||||
| 232 | 185 12 | |||||||||||||
| 234 | IRAS 05156+3643 | 455 46 | 797 159 | 649 58 | 947 85 | 1810 181 | 3020 332 | 853 18 | 1128 66 | 2031 119 | ||||
| 238 | 7098.4 126 | 5575 105 | ||||||||||||
| 239 | 892 29 | 2668 136 | 6201 102 | 7098.4 126 | 5575 105 | |||||||||
| 240 | 144 43 | 932 149 |
| ID | Av | Stellar age | Stellar mass | Temperature | MdotE | MdotD | LTotal | Nfit | Ndata | ||||||||
| (mag) | (Log)(yr) | (M⊙) | (Log)(K) | (Log)(M) | (Log)(M) | (Log)(L⊙) | |||||||||||
| 1.88 | 6.1 | 1.88 | 6.1 | 1.88 | 6.1 | 1.88 | 6.1 | 1.88 | 6.1 | 1.88 | 6.1 | 1.88 | 6.1 | 1.88 | 6.1 | ||
| (1) | (2) | (3) | (4) | (5) | (6) | (7) | (8) | (9) | (10) | (11) | (12) | (13) | (14) | (15) | (16) | (17) | (18) |
| IRAS 05184+3635 | |||||||||||||||||
| 31 | 12.1 2.0 | 6.9 0.3 | 6.6 5.9 | 5.9 5.8 | 3.1 0.6 | 6.8 0.7 | 4.1 3.3 | 4.1 3.9 | 0.0 0.0 | -5.3 -5.2 | -8.4 -8.4 | -7.6 -7.5 | 1.9 1.5 | 3.0 2.8 | 29 | 2 | 8 |
| 46 | 12.9 3.0 | 13.0 3.8 | 6.5 6.5 | 6.2 6.0 | 2.2 0.4 | 4.4 0.8 | 3.9 3.2 | 4.0 3.3 | -4.9 -4.6 | -4.4 -4.1 | -6.9 -6.8 | -6.2 -5.8 | 1.7 1.8 | 2.4 1.7 | 71 | 76 | 9 |
| 47 | 13.1 2.9 | 13.1 3.9 | 6.7 6.3 | 6.2 6.0 | 2.2 0.4 | 4.4 0.8 | 3.9 3.3 | 4.0 3.3 | -4.9 -4.6 | -4.4 -4.1 | -6.8 -6.8 | -6.2 -5.8 | 1.7 1.7 | 2.4 1.7 | 70 | 71 | 9 |
| 48 | 11.7 1.2 | 11.5 2.1 | 6.6 6.3 | 5.9 5.8 | 0.6 0.2 | 1.4 0.7 | 3.6 2.5 | 3.6 2.6 | -5.9 -5.0 | -5.4 -4.8 | -7.8 -6.4 | -7.6 -7.0 | 0.0 0.4 | 0.9 1.1 | 3859 | 2238 | 7 |
| 51 | 21.1 3.3 | 15.7 2.7 | 5.8 5.6 | 6.0 5.2 | 3.7 0.7 | 4.8 0.8 | 3.8 3.1 | 4.1 3.4 | -5.5 -5.5 | -5.9 -5.8 | -7.1 -6.9 | -6.5 -6.3 | 1.9 1.6 | 2.7 2.1 | 57 | 46 | 10 |
| 52 | 12.0 2.4 | 16.4 5.1 | 5.2 5.1 | 5.7 5.7 | 0.8 0.3 | 4.3 1.1 | 3.6 2.7 | 3.8 3.2 | -5.3 -5.3 | -4.8 -4.9 | -6.2 -6.4 | -6.1 -6.0 | 0.9 0.5 | 2.2 1.8 | 115 | 54 | 9 |
| 26 | 5.6 1.3 | 3.5 2.1 | 5.9 6.2 | 5.9 5.9 | 0.4 0.4 | 1.4 1.1 | 3.5 3.0 | 3.7 3.4 | -4.8 -5.1 | -4.5 -4.2 | -7.4 -7.2 | -6.0 -5.9 | 0.2 0.1 | 1.8 2.0 | 17 | 30 | 9 |
| 34 | 10.5 2.7 | 9.6 1.9 | 6.6 6.4 | 6.7 6.2 | 1.5 0.5 | 2.8 0.5 | 3.7 3.2 | 4.0 3.3 | -6.3 -5.9 | -7.1 -6.3 | -7.5 -7.4 | -8.0 -7.6 | 0.9 0.8 | 1.8 1.3 | 68 | 216 | 9 |
| 42 | 11.7 1.5 | 6.8 1.5 | 6.5 6.2 | 6.6 6.2 | 2.6 0.4 | 3.8 0.7 | 3.8 3.2 | 4.1 3.4 | -6.3 -6.1 | -5.9 -5.6 | -7.4 -7.4 | -7.1 -7.0 | 1.5 1.0 | 2.2 1.5 | 439 | 193 | 9 |
| 1 | 0.0 0.0 | 0.0 0.0 | 6.1 4.9 | 6.5 5.8 | 3.4 0.1 | 6.9 0.1 | 3.8 2.3 | 4.3 2.6 | 0.0 0.0 | 0.0 0.0 | -12.6 -12.5 | -11.7 -12.1 | 1.7 0.2 | 3.2 1.5 | 11 | 3 | 9 |
| 32 | 10.2 1.9 | 5.5 1.4 | 6.8 6.1 | 5.7 5.6 | 2.3 0.5 | 2.6 0.5 | 4.0 3.2 | 3.7 2.9 | -5.5 -5.3 | -4.4 -4.5 | -8.2 -8.0 | -6.6 -6.9 | 1.5 0.9 | 1.7 1.4 | 59 | 83 | 9 |
| 39 | 5.9 0.5 | 6.1 1.4 | 5.5 4.5 | 5.3 4.7 | 0.9 0.1 | 3.3 0.6 | 3.6 2.4 | 3.7 2.9 | -5.3 -5.8 | -4.4 -4.6 | -7.6 -7.8 | -7.1 -7.1 | 0.7 -0.3 | 1.8 1.1 | 465 | 124 | 9 |
| 41 | 5.9 0.5 | 6.2 1.5 | 5.5 4.5 | 5.3 4.7 | 0.9 0.1 | 3.3 0.7 | 3.6 2.4 | 3.7 2.9 | -5.3 -5.8 | -4.4 -4.6 | -7.6 -7.8 | -7.1 -7.1 | 0.7 -0.3 | 1.8 1.1 | 473 | 125 | 9 |
| 17 | 5.3 0.3 | 2.9 0.5 | 6.3 5.6 | 6.4 5.3 | 1.7 0.1 | 3.5 0.3 | 3.7 2.6 | 3.9 2.7 | -6.7 -6.7 | -5.8 -6.0 | -7.7 -8.0 | -7.4 -7.9 | 0.8 -0.2 | 1.9 0.8 | 905 | 254 | 9 |
| 29 | 3.4 1.2 | 4.6 0.8 | 5.5 5.7 | 5.4 4.7 | 0.5 0.4 | 1.9 0.3 | 3.6 2.9 | 3.6 2.6 | -4.9 -5.0 | -4.5 -4.5 | -7.7 -7.5 | -7.0 -7.0 | 0.6 0.7 | 1.2 0.6 | 69 | 133 | 9 |
| 16 | 4.7 2.2 | 6.0 2.1 | 6.5 6.3 | 6.7 6.3 | 0.6 0.1 | 1.9 0.6 | 3.6 2.5 | 3.9 3.4 | -5.7 -5.4 | -6.0 -5.8 | -7.2 -7.4 | -7.1 -7.3 | 0.2 0.0 | 1.3 0.9 | 12 | 35 | 9 |
| 22 | 4.9 0.8 | 4.9 0.8 | 6.3 6.0 | 6.3 6.0 | 0.3 0.1 | 1.3 0.3 | 3.5 2.7 | 3.7 2.9 | -6.7 -6.7 | -5.7 -5.4 | -8.3 -8.5 | -7.3 -7.4 | -0.5 -1.1 | 0.8 0.5 | 602 | 511 | 8 |
| 45 | 7.4 2.5 | 10.3 2.8 | 6.2 6.1 | 6.1 6.1 | 0.6 0.2 | 1.5 0.7 | 3.6 2.9 | 3.8 3.3 | -4.5 -4.4 | -5.1 -5.0 | -6.3 -5.7 | -7.5 -7.3 | 0.7 0.8 | 1.5 1.5 | 98 | 617 | 8 |
| 15 | 2.7 0.3 | 2.7 0.3 | 5.9 5.2 | 5.3 4.7 | 1.1 0.2 | 2.3 0.5 | 3.7 2.7 | 3.7 2.8 | -4.8 -5.7 | -4.0 -4.5 | -6.7 -7.2 | -6.9 -7.3 | 1.3 0.5 | 1.7 1.2 | 73 | 121 | 6 |
| 24 | 0.6 0.0 | 6.6 4.4 | 6.3 0.0 | 6.3 6.2 | 1.4 0.0 | 1.6 1.0 | 3.7 0.0 | 3.8 3.5 | 0.0 0.0 | -4.9 -4.5 | -7.4 0.0 | -7.1 -6.7 | 0.4 0.0 | 1.6 1.7 | 1 | 60 | 9 |
| 25 | 1.1 0.0 | 6.3 4.4 | 6.3 0.0 | 6.2 6.2 | 1.4 0.0 | 1.5 0.9 | 3.7 0.0 | 3.7 3.4 | 0.0 0.0 | -4.8 -4.5 | -7.4 0.0 | -7.1 -6.7 | 0.4 0.0 | 1.4 1.6 | 1 | 46 | 9 |
| IRAS 05177+3636 | |||||||||||||||||
| 97 | 4.4 1.8 | 3.0 1.0 | 5.8 5.9 | 4.1 4.0 | 2.6 1.3 | 5.5 0.9 | 3.8 3.6 | 3.6 2.8 | -4.1 -3.9 | -3.5 -3.6 | -6.0 -5.8 | -5.0 -5.0 | 2.4 2.5 | 2.6 2.0 | 122 | 51 | 8 |
| 101 | 8.6 1.9 | 2.0 1.0 | 6.3 6.1 | 6.0 5.3 | 4.2 0.8 | 5.5 0.6 | 3.9 3.3 | 4.2 3.3 | -6.2 -6.4 | -7.3 -7.4 | -7.7 -7.5 | -7.1 -6.7 | 2.2 1.6 | 2.9 2.1 | 58 | 38 | 12 |
| 128 | 19.5 3.3 | 8.1 0.8 | 5.9 5.1 | 6.0 4.8 | 4.5 0.7 | 5.5 0.3 | 3.9 2.8 | 4.2 3.0 | -7.0 -7.1 | -8.3 -9.6 | -7.5 -7.6 | -6.4 -7.7 | 2.4 1.7 | 2.8 1.6 | 3 | 8 | 12 |
| 126 | 10.3 4.8 | 10.2 5.0 | 5.0 4.6 | 4.9 4.6 | 2.1 0.6 | 6.8 0.7 | 3.6 2.6 | 3.7 2.8 | -3.7 -3.9 | -3.4 -3.8 | -6.3 -6.3 | -6.0 -5.8 | 1.6 1.1 | 2.6 1.8 | 17 | 12 | 11 |
| 123 | 5.7 2.1 | 9.0 2.7 | 5.1 5.1 | 6.3 6.2 | 0.4 0.2 | 1.0 0.6 | 3.6 2.6 | 3.7 3.3 | -4.6 -4.2 | -5.0 -4.8 | -7.5 -7.3 | -7.0 -6.9 | 0.5 0.5 | 1.3 1.2 | 88 | 108 | 8 |
| 125 | 6.2 1.2 | 9.4 1.9 | 4.8 4.6 | 5.3 4.9 | 0.3 0.1 | 2.2 0.5 | 3.5 2.6 | 3.7 2.8 | -5.0 -4.9 | -4.8 -4.9 | -7.2 -7.7 | -6.7 -7.0 | 0.3 -0.2 | 1.5 1.0 | 191 | 166 | 7 |
| 130 | 29.0 6.1 | 28.9 6.3 | 4.8 5.0 | 4.8 4.9 | 1.6 0.6 | 4.6 1.9 | 3.6 2.7 | 3.7 3.1 | -4.2 -4.6 | -3.6 -4.0 | -6.2 -6.0 | -5.0 -5.0 | 1.6 1.4 | 2.5 2.0 | 39 | 7 | 9 |
| 129 | 31.9 4.5 | 27.7 3.7 | 6.6 6.1 | 6.5 5.9 | 3.5 0.5 | 5.7 0.7 | 4.1 3.3 | 4.3 3.4 | -6.1 -5.4 | -5.1 -4.5 | -7.5 -7.2 | -5.9 -5.3 | 2.1 1.4 | 3.0 2.4 | 442 | 252 | 8 |
| 92 | 0.7 0.5 | 0.5 0.6 | 5.1 4.6 | 4.7 4.4 | 2.3 0.6 | 4.3 1.1 | 3.6 2.8 | 3.7 3.1 | -4.2 -4.2 | -3.2 -3.6 | -7.7 -7.5 | -6.6 -6.6 | 1.6 1.1 | 2.2 1.4 | 6 | 2 | 11 |
| 85 | 9.3 2.7 | 3.8 1.7 | 5.9 5.5 | 5.8 5.4 | 3.7 0.7 | 5.2 0.6 | 3.8 3.0 | 4.0 3.4 | -4.8 -4.5 | -4.6 -3.9 | -7.0 -7.4 | -6.7 -6.2 | 2.0 1.5 | 2.6 1.8 | 22 | 45 | 7 |
| 112 | 6.4 2.1 | 5.6 1.2 | 3.6 3.6 | 3.8 3.5 | 0.8 0.2 | 4.1 1.8 | 3.6 3.0 | 3.6 3.2 | -3.5 -4.1 | -2.8 -3.2 | -6.2 -6.1 | -5.2 -5.4 | 1.3 0.7 | 2.4 2.0 | 7 | 3 | 7 |
| 131 | 12.3 3.0 | 9.2 3.7 | 5.5 5.3 | 4.9 4.7 | 1.2 0.5 | 3.8 1.4 | 3.7 2.9 | 3.7 3.0 | -5.0 -5.2 | -4.1 -4.2 | -7.4 -7.3 | -6.8 -6.9 | 1.2 1.1 | 2.1 1.6 | 117 | 10 | 8 |
| 96 | 0.6 0.5 | 0.2 0.3 | 3.2 2.3 | 3.5 3.5 | 0.3 0.2 | 2.3 0.2 | 3.5 2.5 | 3.6 2.2 | -5.3 -5.4 | -4.6 -5.7 | -4.9 -5.2 | -4.6 -4.8 | 1.2 0.5 | 2.3 1.6 | 3 | 3 | 9 |
| 103 | 4.1 1.2 | 5.5 1.8 | 5.5 5.0 | 5.5 5.4 | 1.2 0.4 | 3.3 0.7 | 3.6 2.8 | 3.7 3.0 | -4.8 -4.9 | -4.4 -4.3 | -7.6 -7.6 | -6.6 -6.4 | 0.9 0.6 | 1.8 1.5 | 33 | 163 | 9 |
| 93 | 4.7 1.4 | 1.8 0.9 | 6.1 6.1 | 5.6 5.7 | 1.6 0.6 | 2.3 0.6 | 3.7 3.2 | 3.7 3.1 | -5.1 -4.9 | -4.4 -4.4 | -8.3 -7.8 | -7.1 -7.0 | 1.2 1.2 | 1.6 1.4 | 125 | 186 | 9 |
| 60 | 0.7 1.2 | 1.1 1.0 | 4.6 3.3 | 4.9 4.2 | 0.4 0.1 | 2.3 0.4 | 3.6 2.3 | 3.6 2.5 | -4.0 -4.7 | -3.4 -4.1 | -9.0 -9.2 | -6.8 -7.8 | 0.5 0.0 | 1.7 1.2 | 3 | 4 | 8 |
| 95 | 2.5 1.6 | 1.8 0.7 | 4.9 4.8 | 5.0 4.8 | 0.3 0.1 | 1.2 0.6 | 3.5 2.8 | 3.6 2.8 | -4.9 -5.0 | -4.5 -4.6 | -7.3 -7.4 | -6.9 -7.1 | 0.2 -0.1 | 1.1 0.8 | 34 | 20 | 10 |
| 110 | 8.6 3.3 | 5.6 1.6 | 6.4 6.3 | 5.7 5.9 | 1.4 0.9 | 1.9 0.7 | 3.8 3.5 | 3.7 3.2 | -5.5 -5.4 | -4.8 -4.7 | -8.3 -7.8 | -7.4 -7.1 | 1.4 1.4 | 1.4 1.5 | 102 | 283 | 9 |
| 102 | 8.5 2.1 | 8.8 1.9 | 6.5 6.3 | 6.2 6.0 | 0.8 0.4 | 2.2 0.6 | 3.6 2.9 | 3.8 3.3 | -7.1 -6.8 | -5.7 -5.6 | -8.2 -8.2 | -7.3 -7.4 | -0.1 -0.3 | 1.6 1.6 | 47 | 108 | 8 |
| 82 | 3.7 0.3 | 3.1 0.5 | 6.4 5.7 | 6.1 5.7 | 1.4 0.1 | 3.5 0.6 | 3.7 2.7 | 3.8 2.9 | -6.7 -6.8 | -6.4 -6.8 | -7.7 -8.0 | -7.1 -7.6 | 0.5 -0.4 | 1.5 0.7 | 405 | 138 | 9 |
| 91 | 4.2 0.5 | 4.2 1.0 | 6.1 5.6 | 5.7 5.2 | 0.9 0.2 | 3.1 0.6 | 3.6 2.6 | 3.7 2.9 | -6.0 -6.1 | -5.4 -5.2 | -8.0 -8.1 | -7.4 -7.4 | 0.4 -0.1 | 1.5 0.8 | 911 | 163 | 9 |
| 88 | 3.5 0.3 | 3.6 0.2 | 6.1 5.4 | 5.8 4.6 | 0.9 0.1 | 3.2 0.2 | 3.6 2.5 | 3.7 2.6 | -5.9 -6.3 | -5.4 -5.9 | -7.8 -8.2 | -7.2 -7.8 | 0.4 -0.4 | 1.5 0.3 | 754 | 155 | 9 |
| 104 | 4.4 1.4 | 5.8 1.1 | 5.0 4.7 | 5.7 5.4 | 0.2 0.1 | 1.4 0.3 | 3.5 2.8 | 3.7 2.9 | -5.0 -5.2 | -4.7 -4.9 | -8.0 -8.0 | -6.9 -7.1 | 0.0 -0.1 | 1.5 1.2 | 53 | 152 | 9 |
| 89 | 4.4 0.2 | 5.3 0.5 | 6.2 5.0 | 6.5 5.8 | 0.6 0.1 | 2.5 0.3 | 3.6 2.3 | 3.8 2.9 | -6.1 -7.1 | -6.4 -6.6 | -7.9 -8.7 | -7.4 -7.5 | 0.2 -0.6 | 1.3 0.4 | 583 | 595 | 6 |
| 119 | 7.8 2.2 | 9.3 2.8 | 5.3 5.0 | 5.6 5.2 | 0.3 0.1 | 2.6 0.8 | 3.5 2.8 | 3.7 3.0 | -5.1 -5.3 | -5.1 -5.2 | -7.5 -7.7 | -7.8 -8.0 | 0.0 -0.6 | 1.3 0.7 | 51 | 59 | 9 |
| 72 | 0.8 0.9 | 2.8 2.4 | 4.8 4.5 | 6.2 6.3 | 0.5 0.4 | 2.1 1.2 | 3.5 2.7 | 3.7 3.3 | -4.0 -3.9 | -3.7 -3.5 | -7.2 -7.0 | -7.1 -6.9 | 0.8 0.9 | 1.7 1.7 | 76 | 69 | 8 |
| 121 | 9.5 1.9 | 8.6 2.4 | 6.4 6.2 | 5.6 5.3 | 0.6 0.3 | 1.5 0.6 | 3.6 2.8 | 3.6 2.8 | -6.0 -5.8 | -5.3 -5.1 | -8.2 -8.2 | -8.0 -7.7 | -0.1 -0.5 | 0.9 0.5 | 543 | 645 | 8 |
| 78 | 0.8 0.7 | 4.2 1.5 | 5.0 4.7 | 6.4 6.3 | 0.5 0.2 | 1.1 0.7 | 3.6 2.6 | 3.6 3.0 | -4.0 -3.9 | -4.5 -3.9 | -7.1 -7.0 | -7.0 -7.0 | 0.7 0.7 | 1.0 1.4 | 36 | 101 | 8 |
| 90 | 2.2 0.5 | 2.3 0.3 | 5.2 4.8 | 5.0 4.4 | 0.4 0.0 | 2.1 0.3 | 3.5 2.5 | 3.6 2.7 | -5.0 -5.7 | -4.3 -5.2 | -7.2 -7.8 | -6.5 -7.0 | 0.6 0.3 | 1.7 1.2 | 310 | 354 | 6 |
| 122 | 9.2 1.9 | 6.0 5.5 | 3.1 0.6 | 3.7 2.9 | -6.1 -5.8 | -7.7 -7.5 | 1.5 1.0 | 197 | 7 | ||||||||
| IRAS 05168+3634 | |||||||||||||||||
| 183 | 15.3 1.0 | 6.9 2.9 | 6.0 5.4 | 5.9 5.5 | 5.1 0.3 | 7.1 1.1 | 4.2 3.2 | 4.3 3.8 | -7.4 -7.4 | -5.2 -4.8 | -8.0 -7.9 | -4.4 -4.1 | 2.8 2.0 | 3.4 2.7 | 30 | 6 | 17 |
| 182 | 23.5 1.7 | 11.4 3.0 | 6.5 5.6 | 5.5 5.7 | 4.9 0.5 | 5.5 4.7 | 4.2 3.3 | 4.1 4.1 | 0.0 0.0 | -4.7 -4.8 | -8.6 -9.6 | -4.7 -4.7 | 2.7 1.7 | 3.7 3.8 | 10 | 3 | 11 |
| 177 | 6.0 4.0 | 8.9 6.9 | 5.0 5.6 | 5.1 5.2 | 1.9 0.7 | 6.6 1.4 | 3.6 3.2 | 3.9 3.7 | -4.8 -4.9 | -4.5 -4.9 | -5.0 -5.1 | -4.3 -4.3 | 2.0 2.0 | 3.1 2.6 | 41 | 30 | 12 |
| 168 | 7.6 1.4 | 10.5 1.3 | 5.4 5.6 | 6.2 5.9 | 0.4 0.2 | 2.0 0.4 | 3.5 2.7 | 3.8 3.0 | -5.3 -5.6 | -4.9 -4.8 | -7.2 -7.6 | -6.6 -6.8 | 0.3 0.2 | 1.5 1.1 | 187 | 109 | 9 |
| 178 | 14.4 2.3 | 12.9 2.6 | 5.6 5.0 | 5.8 4.9 | 2.2 0.5 | 4.7 0.9 | 3.7 2.9 | 3.9 3.0 | -5.5 -6.0 | -5.3 -5.4 | -6.4 -8.1 | -7.9 -7.9 | 1.2 0.5 | 2.3 1.6 | 65 | 23 | 10 |
| 179 | 18.3 2.7 | 15.3 1.8 | 6.8 6.0 | 6.6 5.9 | 2.2 0.3 | 3.5 0.4 | 3.9 3.1 | 4.1 3.2 | -5.2 -5.0 | -5.3 -5.1 | -7.2 -7.3 | -6.8 -6.6 | 1.5 0.9 | 2.2 1.8 | 85 | 170 | 9 |
| 173 | 11.9 0.6 | 11.4 2.4 | 6.1 5.1 | 5.9 5.6 | 0.7 0.0 | 2.3 0.6 | 3.6 2.2 | 3.7 2.9 | -5.7 -5.8 | -5.3 -5.2 | -8.2 -8.2 | -7.3 -7.0 | 0.2 -0.5 | 1.3 0.7 | 5592 | 1937 | 8 |
| 172 | 9.9 1.4 | 10.0 1.5 | 6.7 6.3 | 5.9 5.7 | 0.7 0.2 | 1.3 0.6 | 3.6 2.4 | 3.6 2.5 | -5.5 -4.8 | -5.5 -4.9 | -7.7 -7.0 | -7.7 -7.1 | 0.2 0.5 | 0.8 1.1 | 1384 | 2004 | 7 |
| 174 | 11.6 2.5 | 3.3 1.7 | 6.2 5.8 | 5.3 4.9 | 2.6 0.6 | 2.7 0.8 | 3.7 3.0 | 3.7 2.4 | -6.8 -6.3 | -5.3 -5.7 | -9.9 -9.4 | -7.4 -7.2 | 1.1 0.5 | 1.5 0.8 | 142 | 9 | 8 |
| 185 | 17.1 2.0 | 16.4 3.6 | 5.9 5.6 | 5.3 5.0 | 1.1 0.3 | 3.0 0.9 | 3.6 2.6 | 3.7 2.9 | -5.5 -5.0 | -4.3 -4.1 | -7.8 -7.5 | -6.8 -6.3 | 0.6 0.5 | 1.7 1.5 | 3544 | 424 | 7 |
| 187 | 14.4 3.1 | 13.3 3.4 | 5.0 4.8 | 4.8 4.6 | 1.5 0.5 | 4.6 1.2 | 3.6 2.8 | 3.7 2.8 | -4.2 -4.3 | -3.8 -3.9 | -6.5 -6.2 | -6.0 -5.7 | 1.4 1.0 | 2.3 1.9 | 175 | 102 | 8 |
| 162 | 4.9 1.8 | 4.7 0.7 | 5.6 5.5 | 5.7 5.1 | 2.7 0.8 | 5.5 0.6 | 3.7 3.1 | 4.0 3.0 | -4.3 -4.4 | -4.1 -4.4 | -6.1 -5.8 | -5.4 -5.4 | 1.9 1.5 | 2.7 1.7 | 47 | 47 | 9 |
| 188 | 23.9 6.4 | 23.3 5.8 | 5.4 5.5 | 5.2 5.0 | 0.9 0.5 | 3.4 1.0 | 3.6 2.9 | 3.7 2.5 | -5.0 -4.7 | -4.3 -4.1 | -7.4 -7.0 | -6.7 -6.5 | 0.9 1.0 | 1.8 1.3 | 854 | 422 | 8 |
| 159 | 2.1 0.8 | 3.6 0.9 | 5.4 4.9 | 5.3 4.6 | 1.2 0.3 | 3.5 0.5 | 3.6 2.8 | 3.7 2.7 | -5.0 -5.4 | -4.3 -4.5 | -7.5 -7.4 | -6.8 -6.8 | 1.0 0.5 | 1.8 1.1 | 76 | 119 | 9 |
| 143 | 1.3 0.2 | 2.1 0.5 | 5.9 5.1 | 5.8 5.5 | 2.7 0.5 | 5.3 1.1 | 3.8 3.0 | 4.1 3.6 | -4.4 -5.0 | -3.5 -3.6 | -6.8 -7.1 | -6.0 -5.9 | 1.9 1.0 | 2.7 2.3 | 19 | 27 | 7 |
| 132 | 0.0 0.0 | 0.0 0.0 | 5.3 5.1 | 5.0 3.4 | 1.9 0.4 | 5.0 0.1 | 3.7 2.1 | 3.7 2.1 | -4.9 -4.7 | -3.4 -4.9 | -7.6 -7.5 | -7.5 -9.1 | 1.3 0.4 | 2.2 0.6 | 9 | 2 | 9 |
| 164 | 9.2 2.1 | 9.0 2.4 | 5.6 5.5 | 5.7 5.6 | 1.2 0.5 | 4.1 0.9 | 3.6 2.8 | 3.8 3.2 | -5.4 -5.2 | -4.6 -4.4 | -7.5 -7.4 | -7.3 -7.2 | 0.9 0.7 | 2.0 1.5 | 761 | 164 | 9 |
| 160 | 10.8 1.6 | 8.3 1.7 | 6.6 6.3 | 6.6 6.2 | 1.5 0.4 | 3.1 0.4 | 3.7 3.1 | 4.0 3.3 | -6.8 -6.3 | -7.9 -7.1 | -8.1 -7.8 | -8.1 -7.5 | 0.8 0.7 | 1.9 1.4 | 126 | 189 | 8 |
| 149 | 6.0 2.0 | 6.1 1.6 | 6.6 6.5 | 6.1 5.5 | 0.9 0.4 | 2.7 0.7 | 3.6 3.0 | 3.7 3.1 | -6.6 -6.4 | -6.3 -6.2 | -8.3 -8.2 | -7.7 -7.5 | 0.1 -0.2 | 1.5 1.6 | 73 | 49 | 8 |
| 146 | 2.9 0.3 | 3.1 0.4 | 6.1 5.6 | 6.5 5.9 | 0.6 0.1 | 2.7 0.3 | 3.6 2.6 | 3.8 2.9 | -6.2 -6.4 | -6.6 -6.6 | -7.8 -8.2 | -7.3 -7.4 | 0.1 -0.5 | 1.4 0.5 | 443 | 315 | 8 |
| 140 | 1.7 0.2 | 2.0 0.4 | 6.2 5.4 | 6.1 5.7 | 0.6 0.1 | 2.5 0.4 | 3.6 2.5 | 3.7 2.8 | -6.4 -6.5 | -6.1 -6.2 | -8.5 -8.8 | -7.8 -7.7 | 0.0 -0.9 | 1.2 0.4 | 2350 | 613 | 8 |
| 170 | 5.7 1.8 | 8.8 1.8 | 5.9 5.9 | 6.2 5.9 | 0.6 0.2 | 1.4 0.5 | 3.6 2.7 | 3.8 3.1 | -4.3 -4.2 | -5.1 -5.1 | -5.8 -5.4 | -7.1 -7.1 | 1.0 1.2 | 1.4 1.3 | 79 | 255 | 8 |
| 137 | 2.6 0.9 | 5.4 1.0 | 6.1 5.8 | 6.5 6.0 | 0.3 0.1 | 2.0 0.4 | 3.5 2.7 | 3.9 3.1 | -5.5 -5.6 | -4.5 -4.3 | -7.6 -7.9 | -7.0 -6.5 | 0.0 -0.4 | 1.7 1.3 | 57 | 184 | 8 |
| IRAS 05162+3639 | |||||||||||||||||
| 190 | 6.3 3.1 | 7.8 2.5 | 4.8 4.7 | 4.2 4.0 | 1.0 0.4 | 3.1 0.6 | 3.6 2.7 | 3.6 2.8 | -3.9 -4.2 | -3.3 -3.7 | -6.3 -6.1 | -5.7 -5.6 | 1.2 0.5 | 2.1 1.4 | 37 | 21 | 8 |
| 192 | 34.6 3.0 | 19.5 3.8 | 5.9 5.2 | 6.0 5.2 | 4.5 0.3 | 5.4 0.2 | 3.9 3.0 | 4.2 3.0 | -5.6 -5.5 | -7.2 -7.2 | -7.5 -7.7 | -6.7 -6.8 | 2.2 1.8 | 2.8 1.7 | 20 | 15 | 12 |
| 189 | 7.7 2.5 | 8.3 2.2 | 5.0 4.7 | 5.3 4.9 | 0.2 0.1 | 1.1 0.3 | 3.5 2.6 | 3.6 2.8 | -5.2 -5.1 | -4.8 -4.7 | -7.5 -7.7 | -7.2 -7.0 | -0.1 -0.3 | 0.9 0.4 | 31 | 39 | 10 |
| 191 | 17.8 1.8 | 18.1 1.8 | 6.1 5.6 | 6.2 5.7 | 0.6 0.1 | 2.1 0.3 | 3.6 2.6 | 3.8 2.9 | -5.8 -6.1 | -5.2 -5.2 | -7.8 -8.3 | -6.6 -6.3 | 0.0 -0.4 | 1.6 1.6 | 160 | 178 | 8 |
| 193 | 12.6 2.4 | 10.8 1.6 | 6.4 6.0 | 5.7 5.5 | 0.5 0.2 | 0.9 0.2 | 3.6 2.7 | 3.6 2.7 | -6.3 -5.9 | -5.3 -5.5 | -7.9 -8.1 | -7.5 -7.7 | -0.1 -0.4 | 0.9 0.7 | 88 | 310 | 8 |
| IRAS 05156+3643 | |||||||||||||||||
| 234 | 2.1 0.8 | 1.4 1.9 | 6.2 6.3 | 3.8 2.7 | 3.4 3.6 | 2.9 1.2 | 4.1 3.9 | 3.6 2.5 | -6.0 -5.9 | -4.7 -5.4 | -4.8 -5.1 | -4.6 -4.7 | 3.2 3.4 | 2.3 0.4 | 4 | 2 | 14 |
| 239 | 22.8 1.5 | 14.0 1.0 | 5.6 4.5 | 6.0 5.5 | 4.4 0.3 | 4.7 0.5 | 3.7 2.6 | 4.1 3.5 | -5.1 -6.2 | -5.6 -5.2 | -8.9 -10.0 | -6.1 -5.7 | 2.0 0.9 | 2.6 1.7 | 7 | 17 | 11 |
| 240 | 21.1 2.1 | 20.5 3.0 | 4.9 4.5 | 4.9 4.6 | 0.4 0.1 | 1.6 0.3 | 3.6 2.6 | 3.6 2.6 | -4.2 -4.6 | -3.5 -4.0 | -8.0 -7.9 | -7.8 -7.5 | 0.3 -0.3 | 1.4 0.7 | 11 | 6 | 10 |
| 232 | 4.6 2.5 | 4.4 2.4 | 3.6 3.3 | 4.3 4.3 | 0.2 0.0 | 1.3 0.3 | 3.5 2.5 | 3.6 2.6 | -5.7 -6.1 | -5.0 -5.4 | -6.3 -6.5 | -5.9 -5.9 | 0.4 -0.5 | 1.5 0.7 | 51 | 63 | 10 |
| 218 | 3.6 1.7 | 8.1 2.1 | 6.0 6.2 | 6.7 6.2 | 0.8 0.6 | 2.1 0.4 | 3.6 3.0 | 3.9 3.2 | -4.9 -5.0 | -4.6 -4.6 | -7.4 -7.2 | -6.6 -6.3 | 0.7 0.6 | 1.5 0.8 | 23 | 69 | 9 |
| 219 | 9.7 2.9 | 5.4 2.8 | 6.5 6.5 | 5.5 5.3 | 3.2 0.5 | 5.2 1.0 | 3.9 3.4 | 3.8 3.1 | -8.3 -8.1 | -5.4 -5.3 | -7.3 -7.4 | -6.0 -5.6 | 1.8 1.4 | 2.4 1.8 | 5 | 18 | 11 |
| 236 | 4.8 1.2 | 4.5 1.0 | 5.0 5.0 | 5.3 5.4 | 0.6 0.2 | 1.9 0.6 | 3.6 2.7 | 3.6 2.8 | -4.3 -4.7 | -3.9 -4.3 | -6.2 -6.1 | -5.8 -5.6 | 1.0 0.7 | 1.9 1.6 | 298 | 385 | 8 |
| 225 | 3.8 0.9 | 4.4 1.0 | 4.8 4.3 | 5.4 5.2 | 0.3 0.1 | 1.9 0.3 | 3.5 2.8 | 3.7 2.8 | -4.6 -5.0 | -4.4 -4.5 | -7.3 -7.6 | -6.5 -6.8 | 0.3 -0.2 | 1.4 0.9 | 61 | 167 | 9 |
| 227 | 6.3 0.3 | 0.0 0.0 | 6.1 4.7 | 6.2 4.2 | 3.4 0.1 | 6.1 0.1 | 3.7 2.4 | 4.3 2.3 | 0.0 0.0 | 0.0 0.0 | -11.9 -13.3 | -11.5 -13.5 | 1.6 0.2 | 3.0 1.0 | 6 | 3 | 8 |
| 228 | 6.9 1.0 | 7.0 1.0 | 6.2 5.8 | 6.4 5.9 | 0.4 0.1 | 2.1 0.3 | 3.5 2.7 | 3.8 2.9 | -6.0 -6.1 | -6.0 -5.8 | -7.9 -8.2 | -7.2 -7.2 | -0.1 -0.8 | 1.3 0.7 | 605 | 559 | 8 |
| 204 | 1.0 0.9 | 3.5 2.2 | 5.0 4.9 | 6.6 6.5 | 0.7 0.5 | 2.1 0.9 | 3.6 2.7 | 3.9 3.4 | -3.9 -3.8 | -4.1 -3.6 | -7.0 -6.9 | -7.5 -7.1 | 1.0 1.0 | 1.6 1.6 | 34 | 63 | 8 |
| 213 | 5.7 0.9 | 6.6 6.1 | 1.9 0.4 | 3.8 3.2 | -6.9 -6.7 | -7.6 -7.8 | 1.2 1.0 | 651 | 7 | ||||||||