Assessing the impact of non-vaccinators: quantifying the average length of infection chains in outbreaks of vaccine-preventable disease
Abstract
Analytical expressions for the basic reproduction number, , have been obtained in the past for a wide variety of mathematical models for infectious disease spread, along with expressions for the expected final size of an outbreak. However, what has so far not been studied is the average number of infections that descend down the chains of infection begun by each of the individuals infected in an outbreak (we refer to this quantity as the “average number of descendant infections” per infectious individual, or ANDI). ANDI includes not only the number of people that an individual directly contacts and infects, but also the number of people that those go on to infect, and so on until that particular chain of infection dies out. Quantification of ANDI has relevance to the vaccination debate, since with ANDI one can calculate the probability that one or more people are hospitalised (or die) from a disease down an average chain of infection descending from an infected un-vaccinated individual.
Here we obtain estimates of ANDI using both deterministic and stochastic modelling formalisms. With both formalisms we find that even for relatively small community sizes and under most scenarios for and initial fraction vaccinated, ANDI can be surprisingly large when the effective reproduction number is , leading to high probabilities of adverse outcomes for one or more people down an average chain of infection in outbreaks of diseases like measles.
1 Introduction
In 1998, Andrew Wakefield published a study that purported a link between the Mumps/Measles/Rubella (MMR) vaccines and autism [1, 2]. The study has been widely debunked [3, 4, 5, 6], and has since been retracted by the publisher due to research misconduct and fraud [7]. However, the study has had a significant and continuing negative impact on attitudes towards vaccination in developed countries, even though the American Academy of Pediatrics, the Royal College of Paediatrics and Child Health, the Institute of Medicine, and the World Health Organization have considered the evidence and endorsed the safety and continuing use of vaccines, including the MMR vaccine [8]. Vaccine refusal is rising [9, 10], and delayed or partial vaccination is also becoming an increasing problem [10].
From the perspective of public health policy, the focus tends to be on the population-level risk of an infectious disease outbreak due to substandard vaccination coverage, and the potential number of hospitalisations or deaths that might result should an outbreak occur [11, 10].
At the individual level however, the anti-vaccine proponents in the vaccination debate tend to over-estimate the risks to the individual should they get vaccinated, while often under-estimating the risks of adverse outcomes should they end up catching the disease [12, 13]. From the individual perspective, the argument might indeed be made for some diseases that an un-vaccinated but healthy older child or adult might be at somewhat lower risk of adverse outcome should they get the disease. However, largely overlooked both in the literature and in the vaccination debate is quantification of the impact that an individual’s decision not to vaccinate might have on the health outcomes of others in an outbreak situation, particularly for vulnerable individuals in the population like young infants who are too young to be vaccinated; hospitalisations or deaths that, but for that individual’s decision to not vaccinate, would potentially not have occurred downstream in the infection chain that began with the deliberately un-vaccinated individual [14].
In this analysis we quantify the average number of infections that are produced down the chain of infection that begins with an individual. These infections include not only the people that an individual directly infects, but the people that those go on to infect, and so on until the chain of infection eventually dies out. We refer to this quantity as the “average number of descendant infections” per infectious individual, or ANDI.
Quantification of ANDI allows assessment of the risk to others posed by the infection of an individual. For example, if the probability of hospitalisation upon catching a disease is , the probability that an individual’s infection results in the hospitalisation of at least one other person down the chain of infection that began with them is . For large ANDI, this approaches one even for relatively small . Thus the risk to an individual should they catch the disease might be low, but the risk may be high that a long chain of infection that began with that individual resulted in the hospitalisation or death of another.
Here we set up the mathematical and computational formalisms for estimation of ANDI, using in this introductory work a Susceptible, Infected, Recovered (SIR) model. We begin by deriving an expression for ANDI from the SIR deterministic model, and compare the results to those obtained using a stochastic Agent Based Monte Carlo (ABMC) computational approach that keeps track of who infects whom. Deterministic modelling methods have the advantage of computational tractability [15, 16], especially for large population sizes, but for values of the effective reproduction number, , close to one, deterministic models do a poor job of estimation of various quantities associated with an outbreak, including quantities like the final size and duration [17, 18].
Using these modelling formalisms, we estimate ANDI for a variety of population sizes, values of , and pre-outbreak prevalence of vaccinated individuals.
As we will show, ANDI grows as , but ANDI does not rise monotonically in . Rather, relatively small values of maximise ANDI, and even for population sizes representing a small community (for example, ) ANDI can be surprisingly high, with each infected individual producing on average one dozen to several dozen descendant infections. Simulation of a measles-like outbreak in a small community with sub-standard vaccination prevalence shows that, even in that small population, the probability that at least one person is hospitalised down an average chain of infection is nearly 100%.
In the following sections, we describe the deterministic and computational modelling methodology, followed by a presentation of representative results and discussion.
2 Methods and Materials
2.1 The Kermack-McKendrick deterministic SIR epidemic model
We begin with a compartmental deterministic model that describes the spread of a disease in a population that consists of susceptible individuals who can catch the disease, infectious individuals who may infect them, and recovered and immune individuals. The ordinary differential equations describing the dynamics of the Susceptible, Infected, Recovered (SIR) epidemic model are [19]
| (1) |
Here we assume that the dynamics of the outbreak occur on a much shorter time scale than those of population vital dynamics and the dynamics of movements in and out of the population, and thus the population size is constant .
It is well known that the basic reproduction number when the entire population is naïve prior to the outbreak is [19], and the effective reproduction number is , where is the fraction immune to the disease before the outbreak. An outbreak occurs when [19]. There is also the final size relation when [20]
| (2) |
For a given population size and , the final size as a fraction of the population, , grows monotonically in .
2.1.1 Assessing the average number of descendant infections, ANDI
Let be the number of descendant infections down the infection chain begun by an individual who was infected at time . Since the total number of new infections occurring after time is , and the fraction of subsequent infections due to a particular individual at time is on average 111As an example, when time , the index case of the outbreak is responsible for 100% of the subsequent infections. However, near the peak of an outbreak, when may be, for example, a larger number like 100, the probability that one of those infectious people is responsible for any given subsequent infection during the remaining outbreak is 1/100., we have
| (3) |
This relation is valid provided .
Let be the probability that a susceptible individual is newly infected at time . Since the rate of new infections for an model is , and the total number of individuals infected in the outbreak is , we have
The average number of descendant infections caused by all individuals in the outbreak is the time average of the NDI for infected individuals at time , weighted by the probability that the individuals were newly infected at time :
| (4) | |||||
| (5) |
2.1.2 Expected dependence of ANDI on the population size
2.2 Limitations of the deterministic approach
In the derivations presented in Methods Section 2.1, note that Equation 3 only holds when . The possibility that is problematic if the number of susceptible individuals still left to infect, , is also greater than one (particularly if it is much greater than one); in this case, effects due to population stochasticity will be non-negligible in the overall outbreak dynamics, and the deterministic approximation will likely be poor. The deterministic approximation will also be poor for small population sizes, because population stochasticity will again be non-negligible in that case.
To determine the conditions for which is large when , we begin by solving for the phase curve, , obtained from the solution of the Equations 1. Equations 1 can be recast as
| (7) | |||||
Integrating Equation 7 with respect to yields
| (8) |
For an outbreak with initial conditions and , we see that Equation 8 is satisfied when
| (9) | |||||
Substituting this into Equation 8 yields the phase relation
| (10) |
Now when the number still left to infect is , we have . We thus have
| (11) |
Note that we can recast this as
| (12) | |||||
We recognise the first two terms as the two sides of the final size relation in Equation 2, multiplied by . The first two terms thus cancel, yielding
| (13) |
When , we obtain
| (14) |
Now, for , 222Proof: Consider the function . Then and for . Thus the maximum of for is ., thus from Equation 14 we obtain
| (15) |
Solving for thus yields
| (16) |
As , we see from Equation 2 that . Thus, as , we see from Equation 16 that by the time falls to one the number still left to infect in the outbreak, , can be large, and thus the deterministic formalism in such cases will yield a poor description of the evolution of the SIR system.
2.3 Stochastic Modelling Methods
To estimate not only the expected value of ANDI, but also the range in that quantity due to population stochasticity, we used an ABMC model, since it is only this stochastic modelling formalism that allows us to keep track of who infects whom at the individual level.
ABMC simulations of epidemics involve setting up probabilistic and/or heuristic “rules” for the interactions of individuals in the population, and the sojourn times spent in the disease states [21]. In the ABMC simulation for the dynamics of an SIR model with homogeneous mixing, at each time step of length (in units of ), we determined if an infectious individual recovered, with average probability . If a sampled uniformly distributed random number was less than , the individual was moved to the recovered class.
Additionally, at each time step we calculated the expected number of contacts that each susceptible person made with infectious people, , and sampled a Poisson distributed number with this mean. To emulate homogeneous mixing, we assumed that there was no preferential mixing of the population, and each individual was equally likely to contact any other individual in the population during a particular time step. If the sampled number of contacts with infectious people was greater than zero, the susceptible individual was moved to the infectious class. An individual was randomly sampled from the list of infectious individuals as the parent of this new infection.
For each infected individual we kept track of the time at which they were infected, who infected them, and also who they subsequently infected. From this information, we calculated the number of infected descendants of each individual, and the average and range of ANDI for all individuals infected in the outbreak.
Due to population stochasticity, not all outbreaks progress [22, 23, 24, 25]; indeed, the probability that no individuals are infected beyond the first initial infection is [26, 27]. There has also been a distinction made between “minor” outbreaks where just a few individuals are infected before the outbreak sputters out, and “major” outbreaks where the final size is much closer to the deterministic prediction [26]. Here we take a conservative approach, and estimate ANDI from both minor and major outbreaks in the ABMC simulations; this will underestimate ANDI compared to estimation using only major outbreaks, and thus in essence represents the “best case scenario” assessment of risk to the population posed by un-vaccinated individuals.
To cross-check the fidelity of the ABMC simulations, we also employed a continuous-time Markov chain (CTMC) SIR model [22], and compared the final size distributions given by the two simulation methods to ensure that they were consistent (note that the CTMC model cannot track who infects whom).
For even moderate population sizes and even modestly large , the ABMC simulations were computationally intensive, and required the use of high performance computing resources to achieve a large number of stochastic realisations of the system. The simulations in this analysis were performed using the high performance computing platforms at Arizona State University and Texas Tech University. The authors have produced a library for the R statistical programming language that contains functions that perform both the deterministic and stochastic modelling methods applied in this analysis. The R ANDI library can be downloaded from the GitHub repository https://github.com/smtowers/ANDI. To do this at the R command line, type
  require("devtools")
  install_github("smtowers/ANDI")
  require("ANDI")
An example R script showing the use of the methods can be found at https://github.com/smtowers/ANDI/example.R.
2.4 Modelling scenarios examined
We used both the deterministic and stochastic formalisms to obtain estimates of ANDI and the outbreak final size for values of between to in steps of , under the assumption that the initial population was entirely susceptible except for one infectious individual. We did this for population sizes , , , and , and also for with a smaller selection of representative values of . For each value of and , we performed at least stochastic realisations. The stochastic modelling formalism was computationally intensive and the complexity grows non-linearly in ; thus, due to the wide variety of reproduction number values we examined, it was computationally infeasible to examine larger population sizes in this analysis. However, with the population sizes we did examine, we were able to estimate the apparent dependence of ANDI on , , and the final size.
The one group SIR model we employed in this analysis did not explicitly include a vaccinated class, but we were nevertheless able to examine scenarios that involved a fraction of the population that was effectively vaccinated and fully immune to the disease prior to the outbreak by including those individuals in the initial conditions for the “recovered” class. An example of a disease for which this is a good approximation is measles, for which the vaccine is known to have an efficacy in excess of 95% [10, 28, 29, 30], usually conferring life-long humoral immunity [31]. Measles has a high basic reproduction number in the absence of vaccination, between to [32, 10]. Thus, even though vaccination rates usually exceed 90% in most areas of the US, the effective reproduction number is still high enough that outbreaks are possible [10].
Using the deterministic and stochastic modelling formalisms, we thus simulated a measles-like outbreak with basic reproduction number in a population size of , examining various scenarios where the pre-immune fraction, , was sampled from to in steps of .
3 Results
3.1 Relationship between ANDI and and the final size
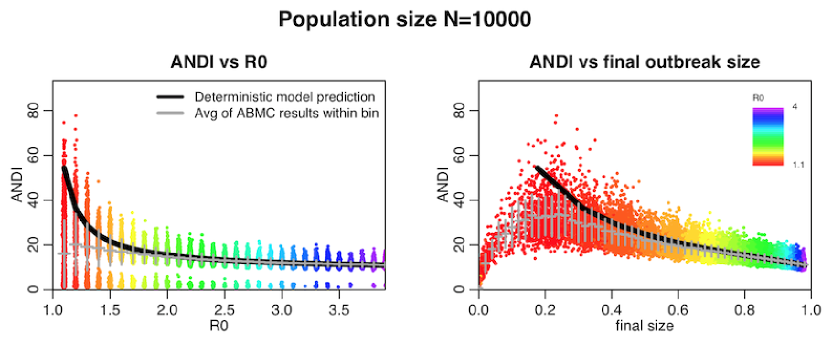
In Figure 1 we show the results of the deterministic and ABMC simulations, showing the predicted ANDI versus , and versus the final size of the outbreak, when the population size is and for the various hypotheses of for outbreaks occurring in entirely naïve populations. In Figure 2 we show the results when the population size is and for the various hypotheses of . For values of the deterministic and ABMC modelling results are in agreement. For small values of the predictions diverge, and the ABMC model is preferred.
For an outbreak in a small community with population , the ABMC results indicate that ANDI is maximised for middling values of around to , and for outbreak final sizes around 20%.
3.2 Relationship between ANDI and the population size
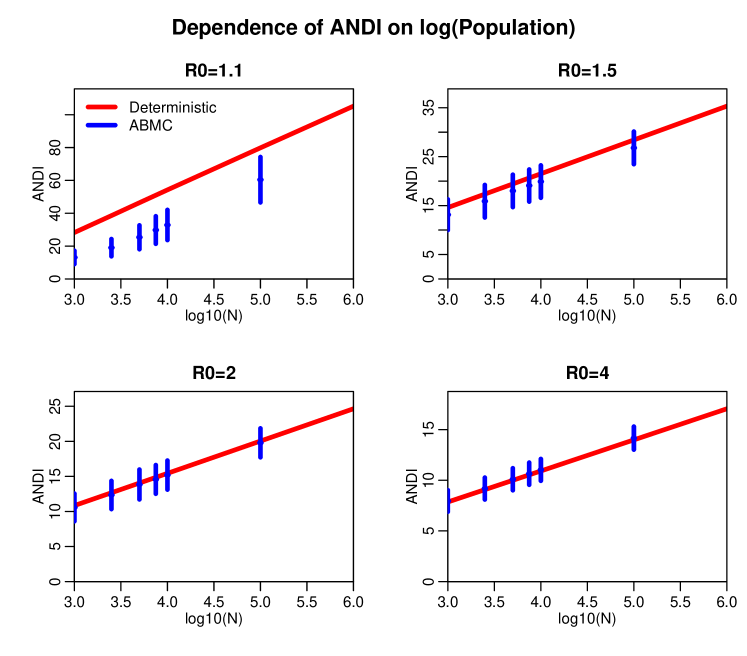
In Figure 3 we show the variation of ANDI versus the logarithm of the population size for the deterministic and ABMC simulations under a range of values of the reproduction number. Both the deterministic and ABMC modelling results for ANDI show a linear dependence on , but for small values of the disagreement between the ABMC and deterministic intercept terms is due to the poor approximation of the deterministic model under those conditions, for the reasons discussed in Methods Section 2.2.

3.3 Relationship between ANDI and pre-immunity of the population
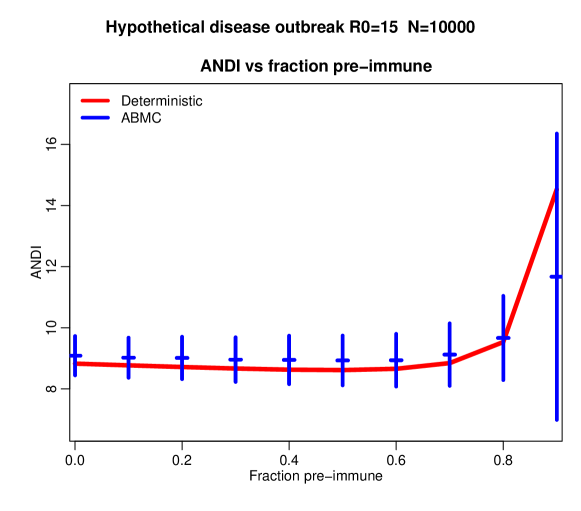
Using the deterministic and stochastic modelling formalisms, we simulated an SIR outbreak with basic reproduction number in a population size of , and with hypotheses of the pre-immune fraction, , ranging from to in steps of . The results showing ANDI versus the pre-immune fraction are shown in Figure 4.
From Figure 4, we note that ANDI is almost constant for low to middling values of , but rises as approaches the point where becomes close to one. This emulates the situation in some developed countries where, in some locales, vaccination coverage has dropped just below the level where measles outbreaks are now possible.
From Figure 4, we note that in small community of population size , the ABMC simulations indicate that ANDI is approximately 12 when for our hypothetical measles outbreak (95% CI ). For larger population sizes, this will grow as . The case hospitalisation rate of measles is high, with post-outbreak analyses estimating it to be between [33, 34, 35, 36]. The U.S. Centers for Disease Control (CDC) estimates on average 25% of cases require hospitalisation, and approximately result in death (see https://www.cdc.gov/measles/about/complications.html, accessed December, 2018). From the ABMC simulation, the estimated probability that at least one person in an average descendant chain of infection in a population size of is hospitalised in this hypothetical measles outbreak with is thus (95% CI ), and the estimated probability that at least one person in an average descendant chain of infection dies is (95% CI ).
4 Discussion and Summary
In this introductory work, we for the first time have quantified the average number of descendant infections, ANDI, that spread down the chains of infection that begin with individuals infected in an outbreak. Quantification of ANDI is necessary to quantify the risk to others posed by the infection of un-vaccinated individuals in an outbreak of a vaccine-preventable disease; the higher the ANDI, the more likely at least one person down an average chain of infection is hospitalised or dies.
Unlike outbreak final size, which grows linearly in population size, , and grows monotonically in , we found that ANDI grows as , and is larger for relatively small values of rather than for large values, and in such cases ANDI can be remarkably high, with average infection chains consisting of many people even in modestly sized communities. The fact that ANDI does not grow in can be conceptualised as follows; the final size grows monotonically in , but because of the rapid proliferation of the number infected early in a high outbreak, there are many more infected individuals subsequently “sharing the pie” of those left to infect in outbreak. However, our stochastic simulations showed that as , effects due to population stochasticity begin to dominate, and the chains of infection tend to die out quicker, leading to a reduction in ANDI. The apparent dependence of ANDI on is similar to the dependence of the average path length in random networks [37]. Further study is needed to elucidate the potential reasons for this.
While the model examined in this introductory work was a Susceptible, Infected, Recovered model without a specific “vaccinated” compartment, it can nevertheless be used to simulate outbreaks in populations where a fraction of the population has immunity to the disease prior to the outbreak (for example, because they had been vaccinated with a highly effective vaccine). In our analysis we simulated a hypothetical measles-type outbreak in a relatively small community of people, assuming some fraction of the population had prior immunity due to completely effective vaccination. When the fraction of pre-immune individuals in the population is just below the limit where an outbreak can occur, with effective reproduction number (similar to the estimated in observed measles outbreaks in populations with just-substandard vaccine coverage [29]), we found that ANDI is approximately a dozen individuals. Because ANDI is large, we found that the probability that at least one individual gets hospitalised down an average descendant infection is close to one in this hypothetical outbreak, even for this modest population size. The probability will grow even closer to one for larger population sizes, due to the dependence of ANDI on . Because the average descendant chain of infection can be remarkably long, the un-vaccinated individual may likely not even directly know the person(s) hospitalised down their infection chain, and it is this distance of association that can lead to under-estimation of the impact of non-vaccination on others.
It is important to note that infants under the age of one year are too young to be vaccinated for most infectious diseases, and also tend to be at highest risk of hospitalisation upon catching such diseases. Approximately of the population consists of infants too young to be vaccinated for measles333The 2017 census data on the U.S. population in one year age group can be downloaded from https://bit.ly/2CEtI8W, accessed December, 2018.; thus, when 5% to 10% of the population is un-vaccinated (for example), a relatively large fraction of that un-vaccinated population consists of infants. Indeed, in a recent outbreak of measles in California, it was observed that almost 25% of the cases in un-vaccinated individuals occurred in infants too young to be vaccinated [35]. Thus, while individuals in descendant infection chains include purposely un-vaccinated individuals, a significant fraction can consist of vunerable people who had no choice but to be un-vaccinated [14].
The model used in this initial work made several simplifying assumptions, including homogeneous mixing of the individuals. It also did not explicitly include a vaccinated class, but as mentioned above, we could nevertheless use the model to assess ANDI in the scenario of where a portion of the individuals in a population are vaccinated with a fully effective vaccine. The deterministic and stochastic formalisms we have developed form the basis for a wide array of future related work, including expanding the model to include partially effective vaccination, age groups, other heterogeneities in transmission, latent periods, etc. While we examined measles-type outbreaks in this analysis, the modelling formalism can be expanded to simulate outbreaks for a wide variety of other vaccine-preventable diseases, including pertussis, influenza, and varicella.
We expect this work and its future derivatives will be impactful in informing the vaccination debate, particularly for hesitant parents who might be swayed by the realisation that what might appear to be a personal decision that only affects their child actually has potential grave impacts on others in society.
References
- Wakefield et al. [1998] AJ Wakefield, SH Murch, A Anthony, J Linnell, DM Casson, M Malik, M Berelowitz, AP Dhillon, MA Thomson, P Harvey, et al. Ileal-lymphoid-nodular hyperplasia, non-specific colitis, and pervasive developmental disorder in children (RETRACTED). The Lancet, 351:637–41, 1998.
- Wakefield [1999] Andrew J Wakefield. MMR vaccination and autism. The Lancet, 354(9182):949–950, 1999.
- Flaherty [2011] Dennis K Flaherty. The vaccine-autism connection: a public health crisis caused by unethical medical practices and fraudulent science. Annals of Pharmacotherapy, 45(10):1302–1304, 2011.
- Mrozek-Budzyn et al. [2010] Dorota Mrozek-Budzyn, Agnieszka Kieltyka, and Renata Majewska. Lack of association between measles-mumps-rubella vaccination and autism in children: A case-control study. The Pediatric infectious disease journal, 29(5):397–400, 2010.
- Kaye et al. [2001] James A Kaye, Maria del Mar Melero-Montes, and Hershel Jick. Mumps, measles, and rubella vaccine and the incidence of autism recorded by general practitioners: a time trend analysis. BMJ, 322(7284):460–463, 2001.
- Dales et al. [2001] Loring Dales, Sandra Jo Hammer, and Natalie J Smith. Time trends in autism and in MMR immunization coverage in California. JAMA, 285(9):1183–1185, 2001.
- Fang et al. [2012] Ferric C Fang, R Grant Steen, and Arturo Casadevall. Misconduct accounts for the majority of retracted scientific publications. Proceedings of the National Academy of Sciences, 109(42):17028–17033, 2012.
- Elliman and Bedford [2002] David AC Elliman and Helen E Bedford. Measles, mumps and rubella vaccine, autism and inflammatory bowel disease. Pediatric drugs, 4(10):631–635, 2002.
- Sugerman et al. [2010] David E Sugerman, Albert E Barskey, Maryann G Delea, Ismael R Ortega-Sanchez, Daoling Bi, Kimberly J Ralston, Paul A Rota, Karen Waters-Montijo, and Charles W LeBaron. Measles outbreak in a highly vaccinated population, San Diego, 2008: role of the intentionally undervaccinated. Pediatrics, 125(4):747–755, 2010.
- Majumder et al. [2015] Maimuna S Majumder, Emily L Cohn, Sumiko R Mekaru, Jane E Huston, and John S Brownstein. Substandard vaccination compliance and the 2015 measles outbreak. JAMA pediatrics, 169(5):494–495, 2015.
- for Disease Control et al. [2010] Centers for Disease Control, Prevention (CDC, et al. National, state, and local area vaccination coverage among adolescents aged 13-17 years—United States, 2009. MMWR. Morbidity and mortality weekly report, 59(32):1018, 2010.
- Kata [2010] Anna Kata. A postmodern Pandora’s box: anti-vaccination misinformation on the Internet. Vaccine, 28(7):1709–1716, 2010.
- Kata [2012] Anna Kata. Anti-vaccine activists, Web 2.0, and the postmodern paradigm–an overview of tactics and tropes used online by the anti-vaccination movement. Vaccine, 30(25):3778–3789, 2012.
- Caplan et al. [2012] Arthur L Caplan, David Hoke, Nicholas J Diamond, and Viktoriya Karshenboyem. Free to choose but liable for the consequences: Should non-vaccinators be penalized for the harm they do? The Journal of Law, Medicine & Ethics, 40(3):606–611, 2012.
- Aparicio and Pascual [2007] Juan Pablo Aparicio and Mercedes Pascual. Building epidemiological models from R0: an implicit treatment of transmission in networks. Proceedings of the Royal Society of London B: Biological Sciences, 274(1609):505–512, 2007.
- Rahmandad and Sterman [2008] Hazhir Rahmandad and John Sterman. Heterogeneity and network structure in the dynamics of diffusion: Comparing agent-based and differential equation models. Management Science, 54(5):998–1014, 2008.
- Greenwood and Gordillo [2009] Priscilla E Greenwood and Luis F Gordillo. Stochastic epidemic modeling. In Mathematical and statistical estimation approaches in epidemiology, pages 31–52. Springer, 2009.
- Tritch and Allen [2018] William Tritch and Linda JS Allen. Duration of a minor epidemic. Infectious Disease Modelling, 3:60–73, 2018.
- Brauer and Castillo-Chavez [2012] Fred Brauer and Carlos Castillo-Chavez. Mathematical models in population biology and epidemiology, volume 40. Springer, 2012.
- Miller [2012] Joel C Miller. A note on the derivation of epidemic final sizes. Bulletin of mathematical biology, 74(9):2125–2141, 2012.
- Helbing [2012] Dirk Helbing. Agent-based modeling. In Social self-organization, pages 25–70. Springer, 2012.
- Allen [2010] Linda JS Allen. An introduction to stochastic processes with applications to biology. Chapman and Hall/CRC, 2010.
- Allen and van den Driessche [2013] Linda JS Allen and P van den Driessche. Relations between deterministic and stochastic thresholds for disease extinction in continuous-and discrete-time infectious disease models. Mathematical biosciences, 243(1):99–108, 2013.
- House et al. [2013] Thomas House, Joshua Ross, and David Sirl. How big is an outbreak likely to be? methods for epidemic final-size calculation. Proceedings of the Royal Society A, 469(2150):1–22, 2013.
- Black and Ross [2015] Andrew J Black and JV Ross. Computation of epidemic final size distributions. Journal of theoretical biology, 367:159–165, 2015.
- Whittle [1955] P Whittle. The outcome of a stochastic epidemic—a note on Bailey’s paper. Biometrika, 42(1-2):116–122, 1955.
- Bailey et al. [1975] Norman TJ Bailey et al. The mathematical theory of infectious diseases and its applications. Charles Griffin & Company Ltd, 5a Crendon Street, High Wycombe, Bucks HP13 6LE., 1975.
- Janaszek et al. [2003] Wieslawa Janaszek, Nigel J Gay, and Wlodzimierz Gut. Measles vaccine efficacy during an epidemic in 1998 in the highly vaccinated population of Poland. Vaccine, 21(5-6):473–478, 2003.
- Mossong and Muller [2000] Joël Mossong and CP Muller. Estimation of the basic reproduction number of measles during an outbreak in a partially vaccinated population. Epidemiology & Infection, 124(2):273–278, 2000.
- van Boven et al. [2010] Michiel van Boven, Mirjam Kretzschmar, Jacco Wallinga, Philip D O’Neill, Ole Wichmann, and Susan Hahné. Estimation of measles vaccine efficacy and critical vaccination coverage in a highly vaccinated population. Journal of the Royal Society Interface, 7(52):1537–1544, 2010.
- Amanna et al. [2007] Ian J Amanna, Nichole E Carlson, and Mark K Slifka. Duration of humoral immunity to common viral and vaccine antigens. New England Journal of Medicine, 357(19):1903–1915, 2007.
- Plans-Rubió [2012] Pedro Plans-Rubió. Evaluation of the establishment of herd immunity in the population by means of serological surveys and vaccination coverage. Human vaccines & immunotherapeutics, 8(2):184–188, 2012.
- Van den Hof et al. [2002] Susan Van den Hof, Marina AE Conyn-van Spaendonck, and Jim E van Steenbergen. Measles epidemic in the Netherlands, 1999–2000. The Journal of infectious diseases, 186(10):1483–1486, 2002.
- Domínguez et al. [2008] Angela Domínguez, Nuria Torner, Irene Barrabeig, Ariadna Rovira, Cristina Rius, Joan Cayla, Elsa Plasencia, Sofia Minguell, M Rosa Sala, Ana Martínez, et al. Large outbreak of measles in a community with high vaccination coverage: implications for the vaccination schedule. Clinical infectious diseases, 47(9):1143–1149, 2008.
- Zipprich et al. [2015] Jennifer Zipprich, Kathleen Winter, Jill Hacker, Dongxiang Xia, James Watt, and Kathleen Harriman. Measles outbreak–California, December 2014-February 2015. MMWR. Morbidity and mortality weekly report, 64(6):153–154, 2015.
- Grammens et al. [2017] Tine Grammens, Carole Schirvel, Sylvie Leenen, Nathalie Shodu, Veronik Hutse, Elise Mendes da Costa, and Martine Sabbe. Ongoing measles outbreak in Wallonia, Belgium, December 2016 to March 2017: characteristics and challenges. Eurosurveillance, 22(17), 2017.
- Fronczak et al. [2004] Agata Fronczak, Piotr Fronczak, and Janusz A Hołyst. Average path length in random networks. Physical Review E, 70(5):056110, 2004.