The ISM Properties and Gas Kinematics of a Redshift 3 Massive Dusty Star-forming Galaxy
Abstract
We present CO ( = 10; 32; 54; 109) and 1.2-kpc resolution [CII] line observations of the dusty star-forming galaxy (SFG) HXMM05 — carried out with the Karl G. Jansky Very Large Array, the Combined Array for Research in Millimeter-wave Astronomy, the Plateau de Bure Interferometer, and the Atacama Large Millimeter/submillimeter Array, measuring an unambiguous redshift of = 2.9850 0.0009. We find that HXMM05 is a hyper-luminous infrared galaxy ( (4 1) ) with a total molecular gas mass of (2.1 0.7)(/0.8) . The CO ( = 1 0) and [CII] emission are extended over 9 kpc in diameter, and the CO line FWHM exceeds 1100 km s-1. The [CII] emission shows a monotonic velocity gradient consistent with a disk, with a maximum rotation velocity of = 616 100 km s-1 and a dynamical mass of (7.7 3.1) . We find a star formation rate (SFR) of 2900 yr-1. HXMM05 is thus among the most intensely star-forming galaxies known at high redshift. Photo-dissociation region modeling suggests physical conditions similar to nearby SFGs, showing extended star formation, which is consistent with our finding that the gas and dust emission are co-spatial. Its molecular gas excitation resembles the local major merger Arp 220. The broad CO and [CII] lines and a pair of compact dust nuclei suggest the presence of a late-stage major merger at the center of the extended disk, again reminiscent of Arp 220. The observed gas kinematics and conditions together with the presence of a companion and the pair of nuclei suggest that HXMM05 is experiencing multiple mergers as a part of the evolution.
Subject headings:
infrared: galaxies – galaxies: high-redshift – galaxies: ISM – galaxies: evolution – galaxies: starburst – radio lines: ISM1. Introduction
Most of the stellar mass in the Universe is assembled in the first few billion years of cosmic time, in the redshift range 1 3 (see e.g., review by Madau & Dickinson, 2014). Galaxies at this epoch typically have higher star formation rates (SFRs) compared to the present day. Among the high- galaxy populations discovered, dusty star-forming galaxies (DSFGs) represent the most IR-luminous systems at this peak epoch. They are typically gas-rich, with molecular gas masses exceeding 1010 and IR luminosities exceeding those of nearby (ultra-)luminous infrared galaxies (U/LIRG; 1011-13 ; see reviews by Carilli & Walter 2013; Casey et al. 2014). Given the differences found between nearby ULIRGs and high- DSFGs (e.g., Younger et al., 2010; Rujopakarn et al., 2011, 2013), studying their interstellar medium (ISM) properties, gas dynamics, and star-forming environments directly are essential to understanding how galaxies are initially assembled at early epochs.
In the classical model of disk galaxy formation (Fall & Efstathiou, 1980), disk galaxies form out of the gas that is cooling off from the hot halos associated with dark matter (DM) potential wells while maintaining the specific angular momentum as the gas settles into rotationally supported disks (Mo et al., 1998). The structure and dynamics of disk galaxies are therefore closely correlated with the properties of their parent DM halos. Probing the structure and dynamics of disk galaxies at high redshift can thus inform us about the processes driving the assembly history of galaxies at early cosmic times. For instance, by tracing the gas dynamics, the Tully-Fisher relation (Tully & Fisher, 1977), which links the angular momentum of the parent DM halo of a disk galaxy with the luminosity/mass of its stellar populations, can be studied out to earlier epochs. Past observations have led to two physical pictures for the nature and origin of DSFGs: compact irregular starbursts resulting from major mergers (of two or more disks) and extended disk-like galaxies with high SFRs (e.g., Tacconi et al., 2006, 2008; Shapiro et al., 2008; Engel et al., 2010; Riechers et al., 2010; Ivison et al., 2010a, 2011; Riechers et al., 2011a, c; Hodge et al., 2012; Riechers et al., 2013; Ivison et al., 2013; Bothwell et al., 2013; Riechers et al., 2014b; Hodge et al., 2015; Oteo et al., 2016a; Riechers et al., 2017) resulting from minor mergers and/or cold gas accreted from the intergalactic medium (IGM; also known as cold mode accretion; CMA; e.g., Kereš et al. 2005; Dekel et al. 2009a; Davé et al. 2010). However, as individual DSFGs can fall into either physical picture, a third interpretation is that DSFGs are a heterogeneous population composed of both compact starbursts and extended disks (e.g., Hayward et al. 2013), presumably observed at different stages of evolution. Determining their gas kinematics is therefore key to better understanding their formation mechanisms and shedding light on whether major mergers or continuous accretion dominate and sustain their intense star formation. However, such studies require high spatial resolution and sensitivity in order to image their gas reservoirs, and thus, are relatively expensive to carry out. To date, only a handful of high- galaxies have been mapped in their molecular gas at high resolution, revealing a mixture of rotating disks and galaxy mergers (e.g., Swinbank et al., 2011; Hodge et al., 2012; Ivison et al., 2013; Oteo et al., 2016b, 2017a, 2018).
With the goal to better understand the star-forming conditions and the gas dynamics of high- DSFGs, we observed multi- CO and [CII] line emission in HerMES J022547-041750 (HXMM05; RA, Dec = 02h25m47s, 04°17′50″; J2000), one of the brightest DSFGs known, at 015 resolution. Line emission from different rotational transitions of CO is useful for determining molecular gas mass and physical properties of the ISM. The [CII] (2P3/2 2P1/2) fine-structure line at rest-frame157.7 is one of the brightest emission lines in star-forming galaxies, and can contribute up to 1% of the FIR luminosity of galaxies (Malhotra et al., 1997; Nikola et al., 1998; Colbert et al., 1999). In addition, [CII] and CO ( = 1 0) line emission trace similar gas kinematics in nearby star-forming galaxies (e.g., Mittal et al. 2011; Braine et al. 2012; Kramer et al. 2013; Pineda et al. 2013), making the former a powerful probe of high- gas kinematics, especially when paired with the exceptional capabilities of the Atacama Large Millimeter/submillimeter Array (ALMA).
The target HXMM05 was discovered in the Herschel Multi-tiered Extragalactic Survey (HerMES; Oliver et al. 2012) as one of 29 high- strongly-lensed galaxy candidates identified (Wardlow et al., 2013; Bussmann et al., 2015). The parent sample was selected based on a flux density threshold of 80 mJy at 500 . The surface density of such bright DSFGs is (0.31 0.06) deg-2 (Wardlow et al. 2013). Previous high-resolution imaging obtained with the Hubble Space Telescope (HST) and ALMA and lens modeling of resolution dust continuum data at 870 show that HXMM05 is at most weakly lensed, with magnification factor (Bussmann et al., 2015)111The orientation of the HST image of HXMM05 shown in Figure 3 of Calanog et al. (2014); Bussmann et al. (2015) is incorrect (i.e., North is down instead of up), but the correct locations of all galaxies were used in the lens modeling.. HXMM05 is therefore intrinsically extremely IR-luminous, unlike other typically strongly-lensed DFSGs in the parent sample with similar sub-millimeter flux densities. Bussmann et al. (2015) find a total of three unlensed, intrinsically-bright DSFGs out of the parent sample of 29. This yields a surface density of 0.03 deg-2 for such sources, which makes them even rarer than strongly-lensed DSFGs. HXMM05 therefore belongs to a rare and understudied luminous/massive high- galaxy population. Currently, the general consensus is these unlensed DSFG with 100 mJy appear to be predominantly major galaxy mergers (e.g., HXMM01 and G09v124; Fu et al. 2013; Ivison et al. 2013). In this work, we investigate the nature of HXMM05 — to examine whether it is a dispersion-dominated merger, or an isolated HyLIRG. We securely determine its redshift to be = 2.9850 through multi- CO and [CII] line observations, indicating that HXMM05 is near the peak epoch of cosmic star formation.
This paper is structured as follows. In §2, we summarize the observations and procedures used to reduce the data. We also briefly describe the ancillary data used in our analysis. In §3, we present the main results. In §4, we present the results from spectral energy distribution (SED) modeling and dynamical modeling of the [CII] line data using the tilted-ring and “envelope”-tracing methods. In §5, we discuss the properties of HXMM05 and compare them to those of other galaxy populations. We discuss the key implications of our findings in §6, and summarize the main results and present our conclusions in §7. Throughout this paper, we use a concordance CDM cosmology, with parameters from the WMAP9 results: = km s-1 Mpc-1, = , and = (Hinshaw et al., 2013).
2. Observations and Ancillary Data
| Observation | Telescope | Date | Calibrators | aaSynthesized beam size obtained with “natural” weighting and after combining all tracks of the same spectral setup. | Array config. | ||||
|---|---|---|---|---|---|---|---|---|---|
| (hr) | Bandpass | Flux | Gain | (major minor, PA) | (GHz) | ||||
| (1) | (2) | (3) | (4) | (5) | (6) | (7) | (8) | (9) | (10) |
| 870 | SMA | 25-Aug-2010 | 1.08 | 3C84 | Uranus | J0238166, J0217017 | 099 0.78, 68.2 | Subcompact | 342.017 |
| 25-Sep-2010 | 2.06 | 3C454.3 | Uranus, Callisto | — | — | Extended | 342.003 | ||
| 05-Aug-2011 | 2.93 | 3C454.3 | Uranus, MWC349A | — | — | Extended | 340.224 | ||
| CO ( = 3 2) | CARMA | 02-Sep-2010 | 1.57 | 3C84 | Uranus | J0239025 | 768 500, 53 | D | 89.9117 |
| 03-Sep-2010 | 2.43 | — | — | — | — | — | 93.5887 | ||
| 04-Sep-2010 | 2.09 | — | — | — | — | — | 103.3739 | ||
| 05-Sep-2010 | 2.33 | — | — | — | — | — | 89.9115 | ||
| 12-Sep-2010 | 1.65 | — | — | — | — | — | 107.0499 | ||
| 2.3 mm | PdBI | 21-Sep-2010 | 0.8 | B0215+015 | MWC349 | B0215+015 | 1485 259, 35.8 | D | 131.1 |
| CO ( = 5 4) | 23-Sep-2010 | 0.6 | 3C454.3 | — | — | — | — | 145.4 | |
| 26-Sep-2010 | 0.6 | — | — | — | 743 408, 111.2 | — | 145.4 | ||
| CO ( = 1 0) | VLA | 20-Sep-2014 | 1.40 | 3C147 | 3C147 | J02150222 | 121 080, 36 | DnC | Ka-band |
| 17-Nov – 11-Dec-2014 | 8.96 | J05424951 | J05424951 | — | — | C | — | ||
| [CII] | ALMA 12 m bbCycle-2 data. For observation details of the ALMA cycle-0 data, see Bussmann et al. (2015). | 15-Jun-2015 | 0.15 | J22321143 | Ceres | J02410815 | 018 014, 61.3 | 21784 [m] | 472.661 |
| 27-Aug-2015 | 0.15 | J02240659 | J02240659 | J02410815 | — | 151574 [m] | 472.665 | ||
| CO ( = 10 9) | ALMA ACA ccCycle-4 data. | 11-Sep-2017 | 0.45 | J00060623 | Uranus | J02170144 | 535 365, 85 | ACA | 289.995 |
| 16-Sep-2017 | 0.45 | J05223627 | — | — | — | — | — | ||
Note. — Columns: (1) line or continuum wavelength observed; (2) telescope; (3) date of observations; (4) on-source time; (57) calibrators; (8) clean beam size (untapered); (9) array configuration or baseline range; (10) local oscillator frequency for observations obtained with the SMA, CARMA, and ALMA, or observed frequency for observations made with the PdBI and VLA.
2.1. Combined Array for Research in Millimeter-wave Astronomy (CARMA) CO ( = 3 2)
Based on the Herschel/SPIRE multi-band colors of , we expected the redshift of HXMM05 to be 2 3.5, and its CO ( = 3 2) line — at rest-frame frequency = 345.79599 GHz — to be redshifted into the 3 mm receiver window of CARMA. We therefore performed a blind CO line search in HXMM05 with CARMA in the D array configuration. Five tracks were executed under excellent weather conditions between 2010 September 02 and 21 (Program ID: cx310; PI: D. Riechers). A total of 10.1 hours of on-source time was obtained after combining all data. We scanned the 3 mm window using four distinct frequency setups, covering a frequency range of = 84.98111.97 GHz. For each setup, the correlator provided sixteen spectral windows, each with a bandwidth of 494.792 MHz and 95 channels, resulting in an effective bandwidth of 3.75 GHz per sideband after accounting for overlapping edge channels. This correlator setup provides a spectral resolution of = 5.208 MHz (i.e., = 18 km s-1 at = 86.8 GHz). All tracks used the same calibrators, as summarized in Table 1. We estimate a flux calibration accuracy of 15%.
The miriad package was used to calibrate the visibility data. The calibrated visibility data were imaged and deconvolved using the CLEAN algorithm with natural weighting, yielding a synthesized beam size of 768 500, at a position angle (PA) of 53°. The final rms noise is typically = 2.26 mJy beam-1 over a channel width of 90 km s-1. We form four continuum images at = 90, 93.4, 103, and 107 GHz, by averaging across the line-free channels in each setup (i.e., one per spectral tuning). The final rms of the continuum images are = 0.17, 0.37, 0.33, and 0.43 mJy beam-1, respectively.
2.2. Plateau de Bure Interferometer (PdBI) CO ( = 5 4) and 131 GHz Continuum
We detected a single line in the CARMA data (see §3.1). Based on the SPIRE colors, the line is most likely CO( = 32), suggesting a redshift of 2.985 for HXMM05. This redshift was spectroscopically confirmed through the detection of a second CO line, which was observed with IRAM PdBI (Program ID: U–3; PI: N. Fiolet). Based on the redshift suggested by the CARMA data, we expected the CO ( = 5 4) line ( = 576.26793 GHz) to be redshifted to an observed frequency of = 144.6093 GHz. Observations were carried out in good weather conditions in the D array configuration with six antennas on 2010 September 23 and 26. A total on-source time of 1.4 hours was obtained in the combined tracks. The 2 mm receivers were used to cover the expected frequency of the CO ( = 5 4) line and the underlying continuum. The WideX correlator was used, providing a spectral resolution of 1.95 MHz (about 4 km s-1 at ) over an effective bandwidth of 3.6 GHz, in dual polarization mode. Calibrators used for bandpass, flux, and complex gain calibrations are listed in Table 1. We estimate a flux calibration accuracy of 15%.
The gildas package was used to calibrate and analyze the visibility data. The calibrated visibility data were imaged and deconvolved using the CLEAN algorithm with natural weighting, yielding a synthesized beam of 743 408 at PA = 111. The final rms noise is 5.53 mJy beam-1 over 20 MHz (41.3 km s-1). A continuum image at an average frequency of = 145.4 GHz was produced by averaging over the line-free channels ( = 3.12 GHz), yielding an rms noise of 0.44 mJy beam-1.
We also observed the = 131.1 GHz continuum emission in HXMM05 with the PdBI (Program ID: U–3; PI: N. Fiolet) to rule out an alternative redshift option. Observations were carried out on 2010 September 21 under good weather conditions in the D array configuration for 0.6 hours of on-source time (Table 1). The visibility data were calibrated using gildas. Imaging and deconvolution were performed using the CLEAN algorithm with natural weighting. We formed a continuum image by averaging across all channels within an effective bandwidth of 3.6 GHz, reaching an rms of = 0.21 mJy beam-1 and a beam size of 1485 259 at PA = 36.
2.3. NSF’s Karl G. Jansky Very Large Array (VLA) CO ( = 1 0)
Based on the redshift determined from the CO( = 32) and CO ( = 5 4) lines, we targeted the CO ( = 1 0) line ( = 115.27120 GHz) in HXMM05 using the the VLA, for a total of ten observing sessions (Program ID: 14B-302; PI: S. Bussmann). One session was carried out on 2014 September 20 in the DnC array configuration and the remaining nine sessions were carried out between 2014 November 17 and December 11 in the C array configuration, A total of 10.5 hours of on-source time was obtained in the combined ten sessions. The Ka-band receivers were used to cover the redshifted CO ( = 1 0) line. The WIDAR correlator was used in full polarization mode, providing a total bandwidth of 2 GHz covered by sixteen sub-bands, each with a bandwidth of 128 MHz and a channel spacing of 2 MHz (29 km s-1). Calibrators are listed in Table 1. We estimate a flux calibration accuracy of 15%.
Visibility data were calibrated and analyzed using version 4.7.1 of the casa package. We combined all calibrated data and imaged the visibilities using the CLEAN algorithm with natural weighting to maximize sensitivity, yielding a synthesized beam size of 121 080 at PA = 36. The final rms noise is 0.041 mJy beam-1 over 6 MHz (62 km s-1), or 0.028 mJy beam-1 per = 145 km s-1 velocity bin. A continuum image at = 31.27 GHz was produced by averaging over all the line-free channels, yielding an rms noise of = 3.19 Jy beam-1. To examine the kinematics of the CO ( = 1 0) line emission at higher resolution, we made an additional line cube using Briggs weighting with robustness = 0.5. An rms noise of = 0.031 mJy beam-1 per velocity bin ( = 145 km s-1) is reached in the resulting line cube, with a beam size of 094 071 at PA = 31.
2.4. ALMA [CII]
We observed the [CII] fine-structure line ( = 1900.536900 GHz) in HXMM05 with ALMA on 2015 June 15 and August 27 during Cycle 2 (ID: 2013.1.00749.S, PI: D. Riechers). The [CII] line is redshifted to Band 8 at the redshift of HXMM05 determined from our CO data ( = 2.9850). We employed the frequency division mode (FDM) correlator setup with dual polarization, providing an effective bandwidth of 7.5 GHz and a spectral resolution of 1.95 MHz (1.2 km s-1). The on-source time, baseline coverage, and calibrators used in each track are listed in Table 1. All data were calibrated manually due to the uncertain flux scale of Ceres, which was used as the flux calibrator in one of the two tracks. The calibrated amplitudes of both the phase and bandpass calibrators are consistent with those found in the ALMA Calibrator Source Catalogue. The flux scale was also verified by comparing the calibrated amplitudes of the same phase calibrator across the two tracks. We estimate a flux calibration accuracy of 15%.
All data were calibrated using casa version 4.5.0 and were then combined, imaged, and deconvolved using the CLEAN algorithm with natural weighting, yielding a synthesized beam of 018014 at PA = 61.3°. To obtain an optimal balance between sensitivity and spectral resolution, we binned the data cubes to spectral resolutions of = 25 km s-1 and 300 km s-1, reaching typical rms noise values of = 2.36 and 0.75 mJy beam-1 per channel, respectively. A continuum image was obtained by averaging across the line-free channels and excluding any channels that were affected by atmospheric features. The bandwidth used to form the continuum images is 5.47 GHz, yielding an rms noise level of = 0.22 mJy beam-1.
We also imaged the visibilities with -tapering applied at 500 k (311.5 m) to recover potential diffuse low surface brightness emission and structure on larger spatial scales. After tapering, a line cube binned to a spectral resolution of = 150 km s-1 was imaged and deconvolved using the CLEAN algorithm and natural weighting. We used the tapered data cube and image to define the apertures used for extracting the line and underlying continuum fluxes, and the line spectrum (see §3). The beam size for the tapered data is 031 026 at PA = 69.5, which is roughly twice the untapered beam size. The final rms noise is = 0.33 mJy beam-1 for the tapered continuum map, and = 1.25 mJy beam -1 per 150 km s-1 bin for the data cube.
2.5. ALMA CO( = 109)
In ALMA Cycle 4, we observed the CO( = 109) line ( = 1151.98545200 GHz) in HXMM05 on 2017 September 11 and 16 (ID: 2016.2.00105.S, PI: D. Riechers) using the 7 m Atacama Compact Array (ACA). The CO ( = 10 9) line is redshifted to Band 7 for HXMM05. We employed the time division mode (TDM) correlator setup with dual polarization, providing an effective bandwidth of 7.5 GHz and a spectral resolution of 15.6 MHz (16.2 km s-1). The on-source time, baseline coverage, and calibrators of each track are listed in Table 1. We conservatively estimate a flux calibration accuracy of 15%.
All data were calibrated using version 5.1.1 of casa, and were then combined, imaged, and deconvolved using the CLEAN algorithm with natural weighting. This yields a clean beam of 535365 at PA = 85°. We binned the data cube to a spectral resolution of = 49 km s-1, reaching a typical rms noise of = 1.20 mJy beam-1 per channel. A continuum image was obtained by averaging across the line-free channels over a bandwidth of 5.61 GHz, yielding an rms noise of = 0.37 mJy beam-1.
2.6. Ancillary Data
| Wavelength/Band | Frequency | Flux Density | Instrument/Band | |
|---|---|---|---|---|
| () | (GHz) | |||
| 0.15 | 2000000 | 2.29 | Jy | GALEX/FUV |
| 0.23 | 1300000 | 2.29 | Jy | GALEX/NUV |
| 0.38 | 780000 | 0.19 | Jy | CFHT/ |
| 0.49 | 610000 | 0.14 | Jy | CFHT/ |
| 0.63 | 480000 | 0.20 | Jy | CFHT/ |
| 0.76 | 390000 | 0.24 | Jy | CFHT/ |
| 0.88 | 340000 | 0.11 | Jy | VISTA/-Band |
| 0.89 | 340000 | 0.35 | Jy | CFHT/ |
| 1.02 | 290000 | 0.31 | Jy | VISTA/-Band |
| 1.16 | 260000 | 0.10 | Jy | HST/F110W |
| 1.25 | 240000 | 0.35 | Jy | VISTA/-Band |
| 1.65 | 180000 | 0.55 | Jy | VISTA/-Band |
| 2.15 | 140000 | 0.78 | Jy | VISTA/-Band |
| 3.4 | 88174 | 0.20 | mJy | WISE/W1 |
| 3.6 | 83275 | 1.25 | Jy | Spitzer/IRAC |
| 4.5 | 66620 | 1.25 | Jy | Spitzer/IRAC |
| 4.6 | 65172 | 0.19 | mJy | WISE/W2 |
| 5.8 | 51688 | 8.61 1.54 | Jy | Spitzer/IRAC |
| 8.0 | 37474 | 8.14 4.84 | Jy | Spitzer/IRAC |
| 12 | 24983 | 0.52 | mJy | WISE/W3 |
| 22 | 13627 | 3.24 | mJy | WISE/W4 |
| 24 | 12491 | 1.08 0.02 | mJy | Spitzer/MIPS |
| 70 | 4283 | ¡10.8 | mJy | Spitzer/MIPS |
| 100 | 2998 | 17.3 | mJy | Herschel/PACS |
| 160 | 1874 | 90.0 | mJy | Spitzer/MIPS |
| 160 | 1874 | 86.3 17.9 | mJy | Herschel/PACS |
| 250 | 1200 | 106 7 | mJy | Herschel/SPIRE |
| 350 | 857 | 120 10 | mJy | Herschel/SPIRE |
| 500 | 600 | 92.1 7.6 | mJy | Herschel/SPIRE |
| 635 | 472 | 52.5 5.9 | mJy | ALMA |
| 870 | 345 | 18.0 0.4 | mJy | ALMA |
| 870 | 345 | 21.5 3.1 | mJy | SMA |
| 1037 | 289 | 11.8 0.8 | mJy | ALMA ACA |
| 1200 | 250 | 8.9 0.9 | mJy | MAMBO |
| 2061.3 | 145.4 | 1.31 | mJy | PdBI |
| 2284.7 | 131.1 | 0.63 | mJy | PdBI |
| 2801.8 | 107 | 1.30 | mJy | CARMA |
| 2910.6 | 103 | 0.98 | mJy | CARMA |
| 3000 aaContinuum emission measured in an image obtained by combining all four spectral setups covering the 3 mm window. | 100 | 0.50 0.11 | mJy | CARMA |
| 3209.8 | 93.4 | 1.11 | mJy | CARMA |
| 3331.0 | 90 | 0.50 | mJy | CARMA |
| 9586.8 | 31.3 | 0.0184 0.00314 | mJy | VLA |
Note. — All upper limits are 3 limits. Uncertainties on the SPIRE flux densities include those due to confusion noise. Uncertainties quoted here for the radio and mm interferometric measurements (i.e., with ALMA, CARMA, PdBI, SMA, and VLA) do not include those from absolute flux calibration (15%), which are accounted for in the SED modeling.
References. — GALEX limits are from XMM-LSS DIS (Pierre et al., 2004; Martin et al., 2005). CFHT limits are from CFHTLS-D1 (Chiappetti et al., 2005). VISTA limits are from the VIDEO survey (Jarvis et al., 2013). HST limit is taken from Calanog et al. (2014). Upper limits from Spitzer/IRAC and MIPS observations are the survey depths of SWIRE and SERVS (Lonsdale et al., 2003; Nyland et al., 2017). Herschel/PACS limit at 100 is obtained from Level 5 observations of the XMM-VIDEO3 field (Oliver et al., 2012). PACS 160 flux density is obtained from the DR4 PACS catalog of the XMM-VIDEO3 field. Herschel/SPIRE and MAMBO photometry are from Wardlow et al. (2013). ALMA 870 flux density is from Bussmann et al. (2015).
2.6.1 Herschel/SPIRE and PACS, and MAMBO 1.2 mm
HXMM05 was observed with Herschel/PACS and SPIRE at 100, 160, 250, 350, and 500 as part of the HerMES project (Oliver et al. 2012). HXMM05 remains undetected at 100 down to a 5 limit of 28.8 mJy, but is detected at 160 . The 160 photometry was extracted from the Level 5 XMM-VIDEO3 data using a positional prior from the Spitzer/MIPS 24 catalog with aperture photometry, and with appropriate aperture corrections applied (PACS DR4). For the SPIRE photometry, we adopted the fluxes reported by Wardlow et al. (2013), which were extracted using StarFinder (Diolaiti et al., 2000). We also include the 1.2 mm photometry obtained with the IRAM 30-m telescope/MAMBO in modeling the SED of HXMM05 (Wardlow et al. 2013; Table 2.6; see §4.1).
2.6.2 SMA 870
We also make use of 870 continuum data obtained with the Submillimeter Array (SMA; IDs: 2010A-S091 and 2011A-S068, PIs: A. Cooray and S. Bussmann; Wardlow et al. 2013). Observations were carried out in the extended and subcompact array configurations on 2010 August 16 and September 25, and 2011 August 05, with local oscillator frequencies of 342.224 GHz and 342.003 GHz (extended), and 340.017 GHz (subcompact), respectively. The on-source time of each track is listed in Table 1. Uranus was used as the primary flux calibrator, and the quasars J0238166 and J0217017 were used as complex gain calibrators for all three tracks. Quasars 3C454.3 and 3C84 were used for bandpass calibration. MWC349A and Callisto were observed as secondary flux calibrators in the extended configuration tracks.
All visibility data were calibrated using the IDL-based mir package and imaged using miriad. We combined all tracks to form a continuum image using the CLEAN algorithm with natural weighting, yielding a synthesized beam of 099 078 at PA = 68.2 and an rms noise of 0.92 mJy beam-1 over the full bandwidth of 7.5 GHz.
2.6.3 ALMA Cycle-0 870
We previously observed the 870 continuum emission in HXMM05 with ALMA in Band 7 (ID: 2011.0.00539.S; PI: D. Riechers; also see Bussmann et al. 2015). Visibilities were imaged using the CLEAN algorithm with Briggs weighting (robustness = 0.5), yielding a synthesized beam of 050 040 (PA = 76.4) and an rms noise of = 0.28 mJy beam-1.
2.6.4 Spitzer/IRAC and MIPS Near- and Mid-IR
HXMM05 was observed with Spitzer/IRAC and MIPS as part of the Spitzer Wide-area InfraRed Extragalactic Survey (SWIRE; Lonsdale et al. 2003) in the XMM-LSS field. The survey depths (5) for point sources are 3.7, 5.4, 48, and 37.8 Jy for the IRAC channels at 3.6, 4.5, 5.8 and 8.0 , respectively, and 230 Jy, 18 mJy, and 150 mJy for the MIPS bands at 24, 70, and 160 , respectively222http://swire.ipac.caltech.edu/swire/astronomers/program.html. In the MIPS bands, HXMM05 is detected at 24 (SWIRE catalog DR2)333https://irsa.ipac.caltech.edu/data/SPITZER/SWIRE/docs/delivery_doc_r2_v2.pdf. The 24 photometry was extracted using aperture photometry and SExtractor (Savage & Oliver, 2007). Appropriate aperture corrections have been applied. HXMM05 remains undetected at 70 and 160 ; we adopt 3 levels as the upper limits for the non-detections (see Table 2.6).
In the post-cryogenic period of Spitzer, more sensitive continuum images at 3.6 and 4.5 were obtained in the deeper Spitzer Extragalactic Representative Volume Survey (SERVS), which reaches 5 limits of 1.25 Jy (Mauduit et al., 2012; Nyland et al., 2017). For the two SWIRE images observed at longer wavelengths (IRAC 5.8 and 8.0 ), we perform aperture photometry to extract the fluxes of HXMM05 at the centroid position determined from the SMA 870 map. Final flux densities are reported in Table 2.6.
2.6.5 Wide-field Infrared Survey Explorer (WISE) Near- and Mid-IR
HXMM05 was observed with WISE as part of the ALLWISE program. Its flux density limits are reported in the ALLWISE source catalog available on the NASA/IRAC Infrared Science Archive (IRSA) and were extracted through profile-fitting. In Vega magnitude units, we find 15.460 0.040, 14.905 0.065, 12.457, and 8.817 for the four WISE bands (at 3.4, 4.6, 12, and 22 , respectively). The latter two are 3 upper limits. Since a few sources with IR emission near HXMM05 are detected in the Spitzer images, we expect emission toward HXMM05 to be unresolved and blended within the WISE beam. As such, we adopt all the WISE fluxes as upper limits only, yielding 3 limits of 0.20, 0.19, 0.52, and 3.24 mJy, respectively (Table 2.6).
2.6.6 Visible and Infrared Survey Telescope for Astronomy (VISTA) Near-IR
The XMM-LSS field was imaged with VISTA in the -, -, -, -, and -bands as part of the VISTA Deep Extragalactic Observations (VIDEO) Survey (Jarvis et al., 2013), reaching 5 limits of 25.7, 24.6, 24.5, 24.0, and 23.5 AB mag for a point source in a 2′′ diameter aperture. HXMM05 is undetected in all bands. In Table 2.6, we report the corresponding 3 levels as upper limits.
2.6.7 CFHT UV-optical-IR
HXMM05 was imaged with the CFHT/MegaCam in , , , , bands as part of the CFHT Legacy Survey Deep-1 field (CFHTLS-D1). In the final CFHTLS release (version T0007), the sensitivity limits corresponding to 80% completeness for a point source are 26.3, 26.0, 25.6, 25.4, and 25.0 AB mag for the five bands, respectively, or 3 point-source sensitivities of 0.19, 0.14, 0.20, 0.24, 0.35 Jy. We show the 0.8′′ resolution CFHT deep field images retrieved from the CFHT Science Archive from the Canadian Astronomy Data Centre (CADC) in the Appendix. HXMM05 remains undetected in all bands according to the T0007 CFHTLS-Deep catalog (Hudelot et al. 2012; Table 2.6).
2.6.8 Galaxy Evolution Explorer (GALEX) Near and Far-UV
UV emission in the HXMM05 field was observed with GALEX in the FUV-1500 and NUV-2300 bands as part of the XMM-LSS Deep Imaging Survey (DIS). HXMM05 was covered in the XMMLSS_00 tile, which was observed for 75262 and 60087 seconds in the NUV and the FUV bands, respectively444Based on the images and catalog released in GR6., reaching 3 limits of 25.5 in AB mag (Pierre et al., 2004; Martin et al., 2005).
2.6.9 XMM-Newton X-ray
HXMM05 is located in the CFHTLS-D1 field, which was observed with the European Photon Imaging Camera (EPIC) onboard XMM-Newton for an integration time of around 20 ks in the XMM Medium Deep Survey (XMDS; Chiappetti et al. 2005), reaching 3 point source limits of 3.7 erg s-1 cm-2 and 1.2 erg s-1 cm-2 in the soft (0.52 keV) and hard (210 keV) X-ray bands, respectively. These limits correspond to 7.4 erg s-1 (soft) and 9.5 erg s-1 (hard) at = 2.9850, which reach the levels of powerful Seyfert galaxies (Elvis et al., 1978). HXMM05 remains undetected in these observations.
3. Results
| Line | FWHM | Deconvolved source size at FWHM | ||||
|---|---|---|---|---|---|---|
| (mJy) | (km s-1) | (Jy km s-1) | (arcsecarcsec, deg) | (kpc) | (mJy) | |
| CO( = 10) aa Emission from both X-Main and X-NE. | 0.55 0.11 | 1118 307 | 0.65 0.22 | — | — | (0.07 0.03) ccNot detected. |
| X-Main | 0.44 0.07 | 1100 210 | 0.51 0.13 | 1.12 0.37 0.81 0.45, 173 49 bbOnly marginally resolved. | 8.86.4 | (0.05 0.02) ccNot detected. |
| X-NE | 0.26 0.04 | 718 130 | 0.20 0.05 | 1.12 0.41 0.26 0.42, 72 37 bbOnly marginally resolved. | 8.82.0 | (0.02 0.01) ccNot detected. |
| CO ( = 3 2) | 6.21 0.98 | 791 157 | 5.21 1.32 | —- | — | (0.23 0.26) ccNot detected. |
| CO ( = 5 4) | 9.38 2.49 | 500 159 | 4.97 2.06 | — | — | (0.16 0.43) ccNot detected. |
| CO ( = 10 9) | 3.72 0.23 | 760 55 | 3.01 0.29 | — | — | — ddContinuum emission was subtracted from the line cubes before extracting the spectrum. |
| [CII] | 183 10 | 687 53 | 133 12 | 0.91 0.08 0.75 0.07, 29 17 | 7.25.9 | — ddContinuum emission was subtracted from the line cubes before extracting the spectrum. |
Note. — The higher- CO lines are unresolved.
| Instrument/Component | Wavelength | Deconvolved source size at FWHM | |||
|---|---|---|---|---|---|
| () | (mJy beam-1) | (mJy) | (arcsecarcsec, deg) | (kpc) | |
| ALMA Total | 635 | 5.61 0.22 | 52.5 5.9 | — | — |
| XD1 peak | 4.95 0.38 | 28.1 2.4 | 0.39 0.05 0.36 0.05, 17 87 | 3.1 2.8 | |
| XD2 peak | 2.75 0.28 | 15.7 1.8 | 0.39 0.06 0.35 0.06, 174 89 | 3.1 2.8 | |
| ALMA | 870 | 10.61 0.35 | 17.96 0.43 | 0.62 0.02 0.54 0.02, 85 10 | 4.94.2 |
| SMA | 870 | 12.8 1.2 | 21.5 3.1 | 0.75 0.23 0.66 0.27, 112 89 | 5.9 5.2 |
3.1. CO Line Emission and Redshift Identification
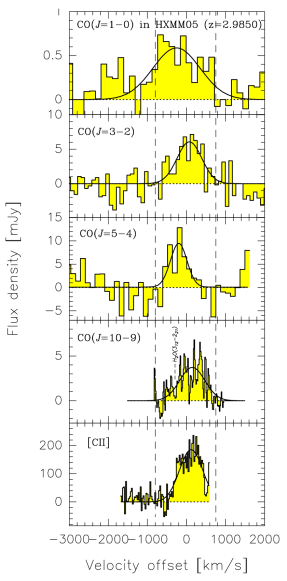
From the first two CO lines we detected — CO ( = 3 2) and CO ( = 5 4) with CARMA and the PdBI — we spectroscopically determine the redshift of HXMM05 to be = 2.9850 0.0009. The CO( = 32; 54; 109) lines remain spatially unresolved, and are detected at 8, 6, and 5 significance, respectively (Figures 1 and 2). Due to the near-equatorial declination of HXMM05 and the sparse -sampling of the data, the PdBI synthesized beam is highly elongated, and the image fidelity is heavily affected by strong sidelobes. We fit single Gaussian profiles to the line spectra, as shown in Figure 1. The resulting best-fit parameters are summarized in Table 3. We note that given the broad linewidths observed up to the = 109 transition, the lack of emission at km s-1 in the CO ( = 5 4) line may be attributed to the limited S/N of the data. The true CO ( = 5 4) flux may be a factor of two higher.
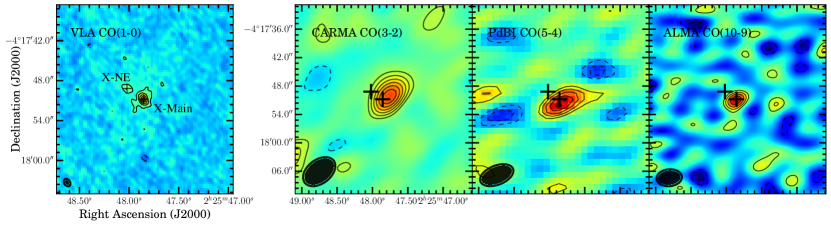
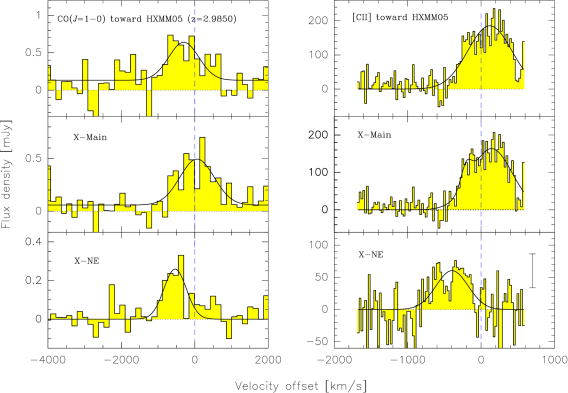
Upon determining the redshift of HXMM05, we observed the CO ( = 1 0) line with the VLA. We detect marginally spatially-resolved CO ( = 1 0) line emission at 14 peak significance (Figure 2). The emission centroid is centered at the position of HXMM05, but shifts from NW to SE with increasing velocity. A second peak is detected at 26 NE of HXMM05, at 6 significance in the blueshifted channels (see Figure 2), corresponding to a projected separation of 20 kpc. In the subsequent sections of this paper, this NE component is referred to as X-NE, and the main component is referred to as “X-Main”.
We extract a spectrum using an aperture defined by the 2 contours centered at the coordinates of HXMM05 (middle left panel of Figure 3), and a spectrum for just X-NE (bottom left panel of Figure 3). The centroid of X-NE is blueshifted by 535 55 km s-1 with respect to X-Main. Assuming that the line detected is CO ( = 1 0) , the redshift of X-NE would be = 2.9779 0.0007. We also extract a spectrum for the HXMM05 system as a whole, including emission from both X-Main and X-NE (top panel of Figure 1 and top left panel of Figure 3). The best-fit linewidths and intensities are listed in Table 3. The CO ( = 1 0) line is remarkably broad (1100 km s-1 FWHM) and shows a hint of a double-horned profile, which likely results from contributions from both X-Main and X-NE (see Figure 3).
We fit 2D Gaussians to the two components detected in the velocity-integrated line intensity map, finding a deconvolved source size of (112 037) (081 045) at PA = 173 49 for HXMM05. This corresponds to a physical diameter of 8.8 kpc 6.4 kpc at = 2.9850. For the NE component, we find a deconvolved source size of (112 041) (026 042) at PA = 72 37, which corresponds to a physical size of 8.8 kpc 2.0 kpc at = 2.9779. The extent of the cold molecular gas in both HXMM05 and the NE component are consistent with those observed in other DSFGs (e.g., Ivison et al., 2011; Riechers et al., 2011a).
3.2. [CII] Line Emission
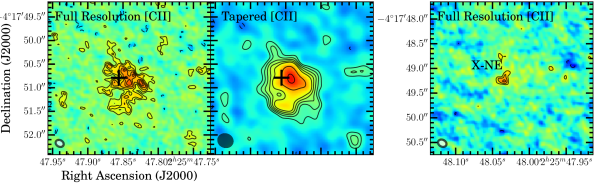
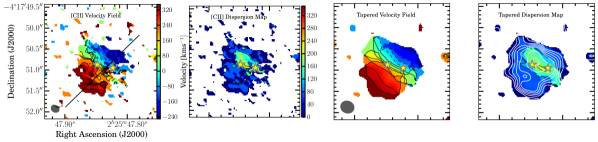
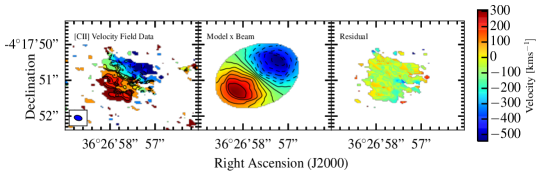
We detect spatially resolved [CII] line emission toward HXMM05 at a peak significance of 13 (in a tapered intensity map). At the full spatial resolution of the data (015), HXMM05 is resolved over 25 beams. To better determine the line profile shape, we create two [CII] line cubes — with and without -tapering (see §2). The 635 continuum emission has been subtracted from both line cubes in the -plane. We collapse them to form velocity-integrated line intensity (i.e., zeroth moment) maps as shown in Figure 4. We show the [CII] line spectrum of HXMM05 in the last panel of Figure 1 and the top right panel of Figure 3. The best-fit parameters obtained from fitting a single-Gaussian are listed in Table 3, together with those derived for the CO lines.
We extract separate spectra for X-Main and X-NE from the high resolution data cube using an aperture defined by the 1 contours of the tapered intensity map. The resulting spectrum of X-Main is shown in the middle right panel of Figure 3. Fitting a single Gaussian yields a peak flux density of = 172 8 mJy, a line FWHM of = 667 46 km s-1, and a line intensity of = 122 10 Jy km s-1. We also fit a double-Gaussian profile, yielding best-fit peak fluxes of = 53 30 and 164 10 mJy, and line FWHMs of = 167 85 and 659 101 km s-1, respectively. The peaks are separated by = 346 124 km s-1. X-NE is detected at 6 significance (see bottom right panel of Figure 3 and also Figure 4). We fit a 2D Gaussian to the tapered intensity map of X-Main, which yields a deconvolved FWHM source size of (091 008) (075 007), or a physical size of (7.2 0.6) (5.9 0.6) kpc, consistent with the extent seen in the higher resolution image.
The first and second moment maps of the [CII] emission representing the velocity and the velocity dispersion of X-Main along the line-of-sight (LOS) are shown in Figure 5. Moment maps are created from the line cube after clipping at 3 per channel. Structures on the scale of the angular resolution ( kpc) are seen in the channel maps (see Appendix §A). A velocity gradient along the NW-to-SE direction, varying over a velocity range of 600 km s-1, is seen in the velocity field (Figure 5). The dispersion map is remarkably uniform across the whole galaxy, with 75 km s-1, except in the central 02 region, where the dispersion reaches its peak at 200 km s-1.
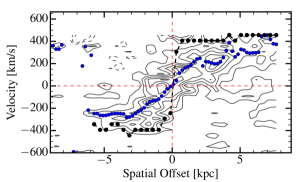
A position-velocity (PV) diagram extracted along the major kinematic axis of X-Main (see §4.2.1) is shown in Figure 6. The rising part of a rotation curve and the outer envelope are both detected. The latter is usually more pronounced in more inclined disks (as seen in nearby galaxies; see review by Sofue & Rubin 2001). The PV diagram is consistent with broad [CII] line emission, which varies by 700 km s-1 within about 9 kpc.
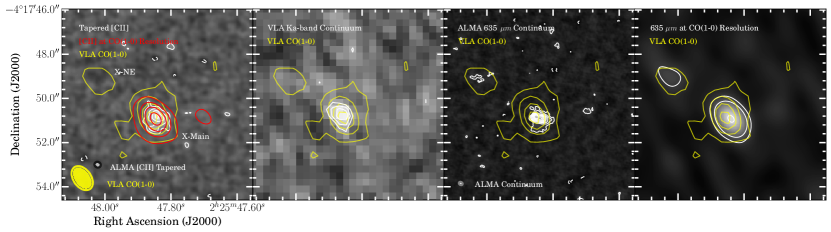
We find comparable deconvolved source sizes for CO ( = 1 0) and [CII] emission (see Table 3), as confirmed by the comparable extents found after convolving the high resolution [CII] data to the CO ( = 1 0) line resolution (Figure 7). At the resolution of the VLA data, the velocity gradient seen in the CO ( = 1 0) line emission is consistent with that of the [CII] line, but more sensitive and higher angular resolution data are required to match the detailed velocity structures of both lines.
3.3. H2O Line Emission
The H2O (; 312) lines at redshifted frequencies of 279.383 and 289.367 GHz are covered by the ALMA CO ( = 10 9) line observations. We do not detect the ground state H2O line in emission or absorption down to a 3 limit of 0.80 Jy km s-1 beam-1, assuming the same linewidth as the CO ( = 10 9) line (760 km s-1). The H2O(312) line is next to the CO ( = 10 9) line and is at most weakly detected; we conservatively report a 3 upper limit of 0.87 Jy km s-1 beam-1, assuming the same linewidth as for the CO ( = 10 9) line.
3.4. Continuum
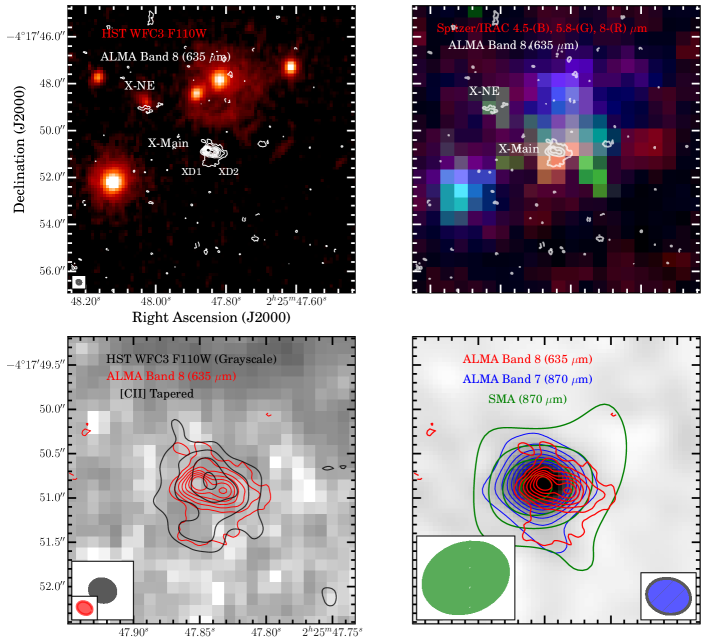
We show the Spitzer/IRAC images in Figure 8. Sources near HXMM05 are detected in the IRAC IR and CFHT NUV bands (see also Appendix §B), but HXMM05 remains undetected.
Among the four 3 mm spectral setups of the CARMA observations, we do not detect continuum emission in the individual tunings. A final continuum image created by averaging across all the tunings yields a weak detection at 4 significance (see Table 2.6). In the PdBI 2 mm setups, continuum emission remains undetected. On the other hand, we detect Ka-band continuum emission underlying the CO ( = 1 0) line at 31.3 GHz at 5 significance, which remains unresolved at the resolution and sensitivity of the VLA data (Figure 7, see Table 2.6). The centroid of the 31.3 GHz continuum emission coincides with that of the CO ( = 1 0) line emission, and its flux density is consistent with that obtained from fitting a four-parameter model (Gaussian plus a first order polynomial) to the CO ( = 1 0) line spectrum extracted at the peak pixel. We also detect unresolved continuum emission at observed-frame 1 mm (rest-frame 260 ) underlying the CO ( = 10 9) line at 15 significance (Table 2.6).
Continuum emission underlying the [CII] line at observed-frame 635 is detected at a peak significance of 31 (see Table 2.6). Two dust peaks, separated by 2.4 kpc, are detected at high significance. One peak coincides with the 870 emission centroid (Figure 8) and with the CO ( = 1 0) emission centroid of X-Main (see Figure 7), whereas the other dust peak is offset to the SW (we denote these as XD1 and XD2, respectively, hereafter). We measure the total continuum flux density using an aperture defined by the 1 contours. We fit a two-component 2D Gaussian to the continuum image and find deconvolved source sizes of (039 005) (036 005) for XD1 and (039 006) (035 006) for XD2, corresponding to physical sizes of about 3 kpc for both components. Since the deconvolved source sizes are larger than the beam size, the size measurements are not limited by the resolution of the observations. The peak flux densities are 4.95 0.38 mJy beam-1 for XD1 and 2.75 0.28 mJy beam-1 for XD2 (Table 4). Based on their total flux densities and sizes, their brightness temperatures in the Rayleigh-Jeans limit are 1.12 and 0.63 K, respectively, corresponding to = 4.5 and 2.5 K in the rest-frame.
We overplot the 635 continuum emission with the SMA and ALMA data observed at 870 in Figure 8. We fit a single-component elliptical Gaussian model to each of the 870 images. Only XD1 is detected at 870 . We also convolve the 635 data to the native resolution of the ALMA 870 data, and find a spatial offset between two peaks emission centroids. The emission centroids are determined by fitting a two-component Gaussian model to the 635 data and a single component Gaussian model to the 870 data. We thus conclude that XD2 is likely to be much fainter than XD1 at 870 , in order for it to remain undetected down to a 3 limit of 0.84 mJy beam-1.
While the [CII] emission shows a monotonic velocity gradient (Figure 5), which suggests that HXMM05 is a rotating disk with ordered motions, the dust continuum is almost exclusively produced at the two peaks embedded within the kpc-scale [CII] disk (Figure 8). Likely due to the limited surface brightness sensitivity of our observations, the [CII] line emission appears more irregular compared to the continuum.
We detect low surface brightness emission in the outer region of the 635 dust continuum map, which is consistent with the overall extent of the [CII] and CO ( = 1 0) emission (Figures 7 and 8). This diffuse component is likely to be more optically thin compared to XD1 and XD2, which likely dominate the dust optical depth estimated at 635 based on the integrated SED model (see §4.1), given that they contribute 80% to the total continuum flux at this wavelength. X-NE (which is detected in CO and [CII] line emission) is also weakly detected in the continuum at 635 at 3 significance, and in the UV, optical, and NIR wavebands (see the last two panels of Figure 7, Figure 8, and Figure 18 in Appendix §B).
4. Analysis
4.1. Spectral Energy Distribution Modeling
We use the extensive multi-wavelength photometric data available in the XMM-LSS field to determine the IR, dust, and stellar properties of HXMM05 via SED modeling. Previously, Wardlow et al. (2013) modeled the dust SED of HXMM05 by fitting a simple modified blackbody to the photometry measured at (sub-)mm wavebands (Herschel-SMA-MAMBO), assuming a dust emissivity index of = 1.5. This model suggests an IR luminosity (rest-frame = 81000 ) of (3.2 0.4) 1013 and a dust temperature of = (45 1) K. Here, we update the SED with more photometric data obtained since, covering UV through radio wavelengths (see Table 2.6). We model the observed dust SED using a modified blackbody (MBB) and the full SED using the magphys code (da Cunha et al., 2015) to derive a stellar mass in a self-consistent way from the dust and stellar emission.
4.1.1 Modified Blackbody Model
We model the dust SED of HXMM05 by assuming a single-temperature modified blackbody, which is parameterized by the characteristic dust temperature . We fit MBB-based SED models to 16 photometric points covering rest-frame IR-to-mm wavelengths (observed-frame 24 3 mm; see Table 2.6) using the code mbb_emcee (e.g., Riechers et al., 2013; Dowell et al., 2014). To account for the absolute flux-scale uncertainties associated with the photometry obtained with ALMA, SMA, PdBI, and CARMA, we add in quadrature an additional 15% uncertainty. The model consists of a MBB component that accounts for the FIR emission and a power-law component blue-ward thereof to describe the warmer dust emission at mid-IR wavelengths. The dust optical depth (as a function of wavelength) is taken into account via the parameter , where dust emission at (rest-frame) is optically thick (). The dust mass is calculated using
| (1) |
where is the luminosity distance and is the Planck function. In estimating the dust mass, we assume an absorption mass coefficient of = 2.64 m2 kg-1 at = 125.0 (Dunne et al., 2003). This (general) model is therefore parameterized by five free parameters: a characteristic dust temperature (); emissivity index (); power-law index (); normalization factor (); and . We impose uniform priors such that 1 K, [0.1, 20.0], [1.0, 400.0] , and [0.1, 20.0]. We adopt the statistical means and 68th percentiles of the resulting posterior probability distributions as the “best-fit” parameters. For comparison with literature values, we also fit MBB+power-law models without the wavelength-dependent optical depth parameter (i.e., assuming optically thin dust emission). All the best-fit parameters are listed in Table 5. We note that the 160 photometry data is poorly fitted, which may suggest the presence of a warmer dust component in HXMM05. However, with the data at hand, this dust component cannot be constrained. Fitting models to photometry excluding the 160 data yields physical parameters that are consistent with those listed in Table 5 within the uncertainties.
| Parameter | General | Optically thin | |
|---|---|---|---|
| (K) | 64 | 49 | |
| 2.2 | 1.8 | ||
| 2.2 | 2.1 | ||
| aaRest-frame wavelength where = 1. | () | 170 | — |
| bbNormalization factor/flux density at observed-frame 500 . | (mJy) | 81 | 67 |
| ccRest-frame 42.5122.5 luminosity. | (1013 ) | 2.4 | 2.2 |
| ddRest-frame 81000 luminosity. | (1013 ) | 4.6 | 4.5 |
| eeDerived assuming an absorption mass coefficient of = 2.64 m2 kg-1 at = 125.0 (Dunne et al., 2003). | (109 ) | 1.4 | 4.3 |
| Parameter | All Photometry | Excluding 160 aaThe 160 photometry forces the dust peak to shorter wavelengths, such that the photometry data long-ward thereof are poorly fitted — motivating the choice of reporting both fits (see §4.1.2). | |
|---|---|---|---|
| (K) | 48 | 44 | |
| bbRest-frame 81000 luminosity. | (1013 ) | 4.1 | 3.9 |
| SFR ccAssuming a Chabrier (2003) IMF. | ( yr-1) | 3250 | 2900 |
| (1011 ) | 7.2 | 12 | |
| sSFR | (Gyr-1) | 4.7 | 2.4 |
| ddDerived by assuming the same absorption mass coefficient of = 2.64 m2 kg-1 at = 125.0 as in the MBB models. | (109 ) | 3.0 | 3.4 |
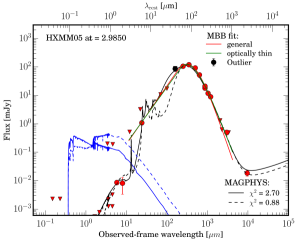
4.1.2 MAGPHYS model
To determine the stellar mass of HXMM05, we fit models to its full SED, sampled by the FUV-to-radio wavelength photometry using the high- extension of magphys (da Cunha et al., 2008, 2015). This code exploits a large library of optical and IR templates that are linked together physically through energy balance, such that the UV-to-optical starlight is absorbed by dust and re-radiated in the FIR. A detailed explanation of the magphys code and the model priors are given by da Cunha et al. (2015).
Following da Cunha et al. (2015), upper limits are taken into account by setting the input flux densities to zero and uncertainties to upper limits. The best-fit SED is shown in Figure 9 and the resulting best-fit parameters are listed in Table 6.
Since in the best-fit model, the Herschel/PACS 160 measurement forces the dust peak to shorter wavelengths and worsens the fit at long wavelengths (similar to the MBB fit), we re-model the SED excluding this outlier. The resulting best-fit parameters are listed in Table 6. The dust peak in this fit is in good agreement with the (sub-)mm and radio photometry. The best-fit parameters determined with and without the PACS 160 photometry are consistent within the uncertainties. We thus adopt the parameters from the latter fit (i.e., excluding the 160 outlier) in the following sections.
4.2. Dynamical Modeling
We fit dynamical models to the 1-kpc resolution [CII] data obtained with ALMA to study the gas dynamics of HXMM05 (more specifically, X-Main). The monotonic velocity gradient observed in [CII] suggests that HXMM05 is a rotating disk galaxy, an interpretation further supported by the analysis of §4.2.1 below.
Assuming that the disk is circular and infinitesimally thin, we use the kinematic major and minor axes to estimate the inclination angle, which yields = 46 8. This is slightly different from the value estimated using the morphological axes, which yields = 35 5, but the two are consistent within the error bars. We initialize the inclination angle in the following analyses based on these estimates.
4.2.1 Harmonic Decomposition and Tilted-ring Model
To assess whether the velocity field observed towards HXMM05 is consistent with its gas being distributed in a disk rather than effects caused by e.g., merging clumps, tidal debris, or inflows, we apply harmonic decomposition analysis (Schoenmakers et al., 1997). Briefly, this method describes higher order moments, (e.g., LOS velocity) as a Fourier series:
where is the azimuthal angle measured from the major axis. The above can be recast into the following form:
| (2) |
where the amplitude and phase of the -th order term are defined as
| (3) |
Since the velocity field is expected to be dominated by the cosine term in the case of an ideal rotating disk; in this scenario, should dominate the harmonic terms, with higher order terms measuring deviations from the ideal case. Following Krajnović et al. (2006), we compare the fifth-order amplitude term to the first-order cosine term () to quantify deviations in the [CII] velocity map of HXMM05 from a rotating disk, and thus, differentiate between a rotation-dominated disk and a dispersion-dominated merger. As shown in Figure 10, the higher order term is insignificant compared to across the majority of the disk, especially towards the center, where the data have higher S/N. We thus interpret HXMM05 to be a rotating disk for the remainder of this paper.

Given the modest inclination of HXMM05, we fit tilted-ring models (Begeman, 1989) to the observed velocity field using the task rotcur provided in the gipsy software package to analyze the gas dynamics of HXMM05 due to bulk motions (i.e., driven by the gravitational potential). The tilted-ring model assumes that the gas is in a circular, rotating thin disk, and describes the disk using a series of concentric rings, where each ring can have an independent inclination angle (), major axis PA, rotation velocity (), and expansion velocity (). The rotation velocity is related to the projected LOS velocity via
| (4) |
Here, we assume that the observed LOS velocity is due entirely to disk rotation and ignore any radial motions (e.g., due to inflow/outflow) by setting the expansion velocity to 0 km s-1 (i.e., the higher order terms). We fit the model iteratively with different sets of parameters held fixed, while varying others freely. We adopted this approach because each ring would have six free parameters otherwise (, , , , PA, ), which our data do not allow us to fix simultaneously, especially because and are highly degenerate. Without doing so, models struggle to converge to a solution555We have tested this by allowing and PA also to vary across rings.. The fact that this approach is also adopted in modeling the kinematics of local galaxies, where the data obtained have much higher S/N and spatial resolution, shows that our data do not offer such constraining power (e.g., Swaters et al., 2009; van Eymeren et al., 2009; Elson, 2014; Hallenbeck et al., 2014; Di Teodoro & Fraternali, 2015; Jovanović, 2017). This approach is also adopted in fitting low-S/N and coarser spatial resolution data obtained at high redshift (see e.g., Shapiro et al. 2008). Here, we minimize the set of freely varying parameters via least-squares fitting. Except in the last iteration, the width of each ring is set to the beam size. In the first iteration, the dynamical center () and systemic velocity () vary freely, whereas the inclination angle is fixed to the average value found from the kinematic and morphological axes, and the PA is fixed to the photometric/morphological PA. We then constrain , PA, and while fixing , and to their weighted-average values found in the previous iteration. To better determine the inclination angle, we further fix the PA and fit for and only. In the final run, we fix all parameters to the weighted averages found in the previous iterations and only fit for , and the width of each ring is set to half the beam size to sample the rotation curve. From the model, we find a best-fit PA of 133.6 0.6 (east of north). and an inclination of = 41.3 3.9.
After this determination, the best-fit parameters are used to form the model velocity field using the velfi task. A residual image (Figure 11) is obtained by subtracting the model (after convolving with the beam) from the data. The residual is largely uniform across the entire disk, with velocities varying by less than 100 km s-1, consistent with the velocity dispersion map observed in Figure 5. The relatively low residuals indicate that the best-fit model is a reasonable description of the observed velocity field, and that non-circular motions (e.g., streaming motions along unseen spiral arms or bars, or large-scale tidal torquing from galaxy interactions) are unlikely to be detected in the kpc-scale resolution data. We note that beam smearing means that velocity information within the inner kpc region will be largely lost in the data.
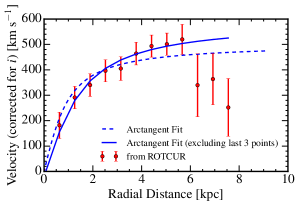
We fit an arctangent model (e.g., Courteau, 1997) to the rotcur rotation curve (RC). The model is parameterized as:
| (5) |
where is the rotation velocity found with rotcur, is the systemic velocity, is the asymptotic velocity, and is the “turnover” radius at which the rising part of the rotation curve begins to flatten. We perform non-linear least-squares fitting using the Levenberg-Marquardt algorithm to find the best-fit parameters. We limit the turnover radius to 0 25 kpc in order to keep this parameter within a physically meaningful range. Using this model, we find = 503 83 km s-1, = 0.8 0.3 kpc, and = 0 28 km s-1 (relative to the systemic redshift). We thus find an inclination-corrected rotation velocity of = 474 78 km s-1 at a spatial offset of 8.8 kpc (the extent of the ground state CO line emission; Table 3). We note that the model underestimates the velocities at kpc because of the outermost three data points at 6 kpc, which deviate from the trend of increasing velocity with radius. Such a trend — a declining rotation curve with increasing galactocentric radius — has been reported in some studies of high- galaxies (e.g., Genzel et al. 2017; Lang et al. 2017, cf. e.g., Tiley et al. 2018). In our data, this trend is likely an artifact due to the limited S/N at those PV-positions (i.e., low number of pixels fitted; see Figures 6 and 16 in Appendix §A). In other words, the decreasing velocities seen at increasing radius in our target could easily be mimicked by a lack of sensitivity to low surface brightness emission in the outer regions. If we instead fit the arctangent model excluding these three data points, we find an inclination-corrected rotation velocity of = 537 83 km s-1 at 8.8 kpc and an asymptotic velocity of = 617 97 km s-1. Both models are consistent within the uncertainties.
Rotation curves from both arctangent models do not reach the terminal velocity666Terminal velocity is not the same as asymptotic velocity, which the arctangent model does constrain. (i.e., the flat part of the rotation curve). Therefore, the rotation velocities inferred here may be lower limits only. On the other hand, part of the rotation curve that is flattening is clearly detected in the PV-diagram (Figure 6). This discrepancy is related to the fact that fitting models to velocity fields can underestimate true rotation velocities,777This underestimation occurs because velocity fields are intensity-weighted and the tilted-ring model assumes that all the gas in a ring is at a unique position along the LOS; however, gas emission from other velocities along the LOS is blended within the beam. Thus, the lower the resolution, the more likely the true velocities are underestimated by fitting models to the velocity fields. and that the decreasing velocities seen in the outermost three data points of the rotation curve are of limited S/N. This flattening part of the rotation curve detected in HXMM05 is likely to be mainly driven by the dynamics of the parent dark matter halo, as in nearby galaxies; we see no evidence indicating that HXMM05 is dominated by baryons from the data at hand. Adopting the inclination-corrected as the maximum rotation velocity, we find that HXMM05 is consistent with the gas Tully-Fisher relation found for nearby galaxies, given its gas mass (see Table 7; McGaugh & Schombert 2015).
4.2.2 Envelope-Tracing Method
As an alternative approach to estimate the rotation velocity of HXMM05, we also use the envelope-tracing (ET) method, where we fit models to the PV diagram extracted along the kinematic major axis (Figure 6; see review by Sofue & Rubin 2001). The ET method attempts to trace out the material that has the maximum tangential motion along each LOS (see Figure 5 of Chemin et al. 2009 for a schematic depiction of this geometric effect).
We fit a third order () Gauss-Hermite polynomial to a (Hanning-smoothed) spectrum extracted at each position along the PV cut (Figure 6) to account for any asymmetries in the spectra. The rotation curve (traced by the “envelope”) is derived from the terminal velocity () at which 8% of the total flux under the fitted curve is outside . In essence, this approach traces the isophotes at each position along the kinematic major axis.
The innermost 1.5 kpc region of the PV diagram is steeply rising (Figure 6), which is due in part to the facts that the velocity gradient in this region is changing rapidly from positive to negative, and that contributions from multiple radii overlap in the inner roughly 1 kpc (which remains unresolved at the 1.2 kpc resolution of the data). Structures within the “envelope” modulo inclination and beam smearing effects may result from the presence of spiral- or ring-like structures, or a clumpy gas distribution in HXMM05.
Based on the terminal velocity, we derive the rotation velocity of HXMM05 using the following equation:
| (6) |
where is the systemic velocity determined from fitting a double-Gaussian to the [CII] spectrum (Figure 1), is the inclination angle from rotcur, is the spectral resolution, and is the velocity dispersion of the gas (see e.g., Vollmer et al. 2016 and Sofue 2017). Here, we adopt the observed velocity dispersion of = 75 km s-1 as the subtracted term. We then re-sample the rotation profile every half beam (instead of every pixel) and show the output rotation curve in Figure 6. We find an inclination-corrected rotation velocity of = 616 100 km s-1 at the last measured radius of the rotation curve ( = 8.0 kpc), which is consistent with the rotation velocity of = 537 83 km s-1 derived from the arctangent model within the uncertainties.
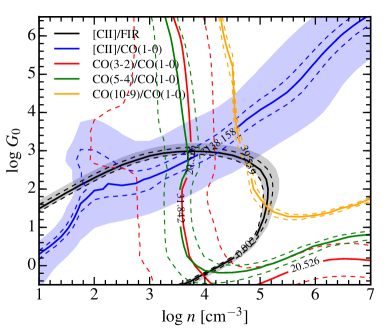
4.3. PDR modeling
Photo-dissociation regions (PDRs) are the warm and dense surfaces of molecular clouds exposed to FUV photons with energies 6 13.6 eV escaping from HII regions. In PDRs, gas temperatures and densities are typically = 100 500 K and = cm-3. Since the [CII] 158 line is the primary coolant in PDR conditions satisfying 103 cm-3 and K, [CII] and other ISM lines near or in PDRs are sensitive probes of the physical conditions of the PDR gas and the intensity of the ambient interstellar radiation field (; conventionally expressed in units of 1.6 erg cm-2 s-1, the Habing flux; e.g., Hollenbach & Tielens, 1999). Using the [CII] and CO line luminosities and the PDR model grids from Tielens & Hollenbach (1985) and Kaufman et al. (1999, 2006)999Available through the PDR Toolbox888http://dustem.astro.umd.edu described by Pound & Wolfire (2008) and Wolfire et al. (2010) , we constrain the globally-averaged , hydrogen density (), and surface temperature for the PDRs in HXMM05 101010While it is physically unrealistic to model an entire galaxy as a single PDR, we infer the and values of HXMM05 in a globally-averaged sense to facilitate comparison with other studies in the literature.. We adopt CO grids from an updated version of the code (Hollenbach et al. 2012; M. Wolfire 2017, private communication) that is merged with the Meudon code (Le Petit et al., 2006) for a more detailed treatment of H2 chemistry and thermal balance.
The observed line ratios are shown in Figure 12 as functions of and . Since a fraction of the [CII] emission in the ISM arises outside of PDRs, and we lack other diagnostic lines to determine this fraction in HXMM05, we adopt a canonical value of 30% to account for this non-PDR contribution (Carral et al. 1994; Colbert et al. 1999; Malhotra et al. 2001; Oberst et al. 2006; see also Pavesi et al. 2016, 2018; Zhang et al. 2018b). CO line emission is typically optically thick (especially the low- lines), and so we multiply their line intensities by a factor of to account for the emission on the other side of the surface. Corrections are incorporated into the line ratios as uncertainties (filled regions in Figure 12). The best-fit model is determined based on the global minimum , corresponding to = 4.5 cm-3 and = 2.25. Based on the surface, the uncertainties in both and are approximately an order of magnitude. As discussed by Röllig et al. (2007), physical parameters inferred from any PDR models should not be taken too literally, since they are subject to differences depending on the assumptions adopted and the implementation of microphysics in the code. Nevertheless, we use the best-fit parameters as simple approximations to compare HXMM05 with other galaxies.
The lower solution (1) implied by the mid- CO and [CII]-to-FIR (/) luminosity ratios disagrees with that implied by the CO (109)-to-(10) and [CII]-to-CO ( = 1 0) luminosity ratios. We reject this low solution since it would require a physically enormous emitting region to account for the observed high in HXMM05 (; Wolfire et al. 1990). Assuming the values for M82 ( 300 pc, 1000, 2.8 ), the solution with 0.2 would require an emitting region = 600 kpc in size, contrary to what is observed. On the other hand, the best-fit 200 corresponds to an emitting region of 20 kpc, which is more consistent with the sizes observed in [CII] and CO ( = 1 0) line emission (Table 3). The FUV radiation field intensity of HXMM05 is thus stronger than the local Galactic interstellar radiation field intensity by a factor of around 200, comparable to the values found in nearby normal star-forming galaxies and those found in some other DSFGs (e.g., Malhotra et al., 2001; Wardlow et al., 2017). The best-fit and together suggest a surface temperature of = 290 K for the PDR. We approximate the PDR pressure using , yielding = 9.0 cm-3 K. We note that an offset is found between the CO ( = 109)/CO( = 10) line and the other luminosity ratios in the plane. This offset likely results from the fact that CO ( = 10 9) emission preferentially traces a more highly-excited phase of the ISM than the other lines (e.g., due to mechanical heating or X-ray heating; see also §5.6). However, with the data at hand, the presence and properties of an X-ray dominated region (and/or a second PDR component, and/or shock excitation) are unconstrained and indistinguishable from a simple single PDR.
The PDR properties thus suggest that the high far-IR luminosity of HXMM05 (1013 ) may result from extended star formation, with only a modest FUV radiation field intensity. This is in stark contrast with the compact starbursts seen in the cores of many nearby ULIRGs (less than a few hundred parsecs), which are found to have stronger FUV radiation fields compared to HXMM05 (e.g., Stacey et al., 2010). The inferred PDR conditions also suggest that HXMM05 is unlikely to host an AGN or a powerful quasar, consistent with §5.1.
5. Discussion
| Parameter | Unit | Value |
|---|---|---|
| aaBrightness temperature ratio between two CO rotational transitions: . | 0.76 0.28 | |
| aaBrightness temperature ratio between two CO rotational transitions: . | 0.26 0.10 | |
| aaBrightness temperature ratio between two CO rotational transitions: . | 0.04 0.01 | |
| aaBrightness temperature ratio between two CO rotational transitions: . | 0.03 0.01 | |
| deg | 41.3 3.9 | |
| CO ( = 1 0) extent | kpc | 8.8 2.6 |
| Rotation curve radius | kpc | 8.0 |
| Maximum bbFrom PV fitting, see §4.2.2. | km s-1 | 616 100 |
| (8.0 kpc) bbFrom PV fitting, see §4.2.2. | 1011 | 7.7 3.1 |
| Observed | km s-1 | 100 25 |
| 1010 | 4.3 0.5 | |
| 107 | 1.3 0.4 | |
| 1011 | 2.1 0.7 | |
| 1011 | 1.7 0.4 | |
| 1010 | 6.5 1.6 | |
| ccFrom SED modeling excluding the photometry obtained with Herschel/PACS at 160 and Spitzer/MIPS 24 (see §4.1.2). Integrated over rest-frame 81000 luminosity. | 1013 | 3.9 |
| SFR ddAveraged over the last 100 Myr and assuming a Chabrier (2003) IMF. | yr-1 | 2900 |
| K | 44 | |
| eeDust masses derived from MBB and full SED modeling lie in the range of = (1.44 4.27) , which is within the uncertainties due to intrinsic uncertainties in (see §4.1). Here we quote the average dust mass as the centroid value and use the extreme values as the uncertainty. | 109 | 2.9 1.5 |
| 1012 | 1.2 | |
| GDR eeDust masses derived from MBB and full SED modeling lie in the range of = (1.44 4.27) , which is within the uncertainties due to intrinsic uncertainties in (see §4.1). Here we quote the average dust mass as the centroid value and use the extreme values as the uncertainty. | 50 145 | |
| ff determined from dynamical modeling (§5.4). | % | 33 15 |
| ggDetermined using = 2.8 = (3.89 1.09) to compare HXMM05 with other high- galaxies reported in the literature. | % | 5.3 2.4 |
| / | 0.2 | |
| /( ) | 0.2 0.2 | |
| Myr | 72 27 | |
| SFE hhSFE /, where = 2.39 . | Gyr-1 | 13 4 |
| iiObserved quantities. No corrections applied (see §4.3). | % | 0.20 0.03 |
| iiObserved quantities. No corrections applied (see §4.3). | 3300 1000 | |
| iiObserved quantities. No corrections applied (see §4.3). | 10-7 | 5.5 1.9 |
| 12log(O/H) jjBased on the FMR derived by Mannucci et al. (2010). On the PP04 scale, the metallicity of HXMM05 is 12log(O/H)PP04 = 8.74. | 9.1 | |
| kkBased on the -metallicity relation derived by Leroy et al. (2011) and Genzel et al. (2012) (see §5.2.2). | K km pc | 1.41.9 |
| kpc-2 yr-1 | 210 | |
| kpc-2 yr-1 | 120 | |
| kpc-2 yr-1 | 10 | |
| pc-2 | 590 410 |
Note. — Any quantities in this table relating to the gas mass (and throughout this paper) are derived from CO ( = 1 0) emission, assuming = 0.8 K km pc and using the total molecular gas mass (i.e., both X-Main and the NE component combined) unless otherwise specified.
Since X-Main and X-NE remain spatially unresolved from each other in the IR photometry and most of the spectral line data (except in CO = 10 and [CII] emission), we discuss the properties of HXMM05 as a combined system in the following sections.
5.1. No Evidence of an AGN in HXMM05
Given the upper limits imposed on the X-ray luminosity of HXMM05, we find no evidence for the presence of a powerful AGN, but we cannot rule out the possibility of a heavily dust-obscured AGN in HXMM05 or a Seyfert galaxy nucleus with modest X-ray emission. To assess the reliability of the stellar mass derived from SED fitting, we examine if the mid-IR spectral slope of HXMM05 () may be consistent with a low X-ray luminosity AGN (see e.g., Stern et al., 2005; Donley et al., 2007). We fit a power-law to the IRAC 5.8- and MIPS 24- photometry, which correspond to rest-frame 1.56.0 . We find a spectral index = 1.46 0.58, which is much flatter than those observed in AGN host galaxies111111 Spectral indices reported in the literature are based on photometry taken at 3.68.0 , which correspond to the closest wavelength range used here for HXMM05 in the rest-frame. (Stern et al., 2005; Donley et al., 2007, 2008), suggesting that the NIR emission in HXMM05 may be dominated by stellar emission. Thus, we assume in the following that all the NIR emission detected in the IRAC channels 3 and 4 bands arises solely from the starlight in HXMM05. That is, the accuracy of the stellar mass estimated is dominated by the uncertainty on the IMF adopted (see e.g., Zhang et al., 2018a). If HXMM05 were to host an AGN, however, its stellar mass and SFR would be overestimated.
5.2. ISM Properties
5.2.1 Stellar Mass and Specific Star Formation Rate
We find an unusually high stellar mass of 1012 for HXMM05 from SED modeling. The stellar mass estimate relies heavily on IRAC channels 3 and 4 (i.e., rest-frame 1.4 and 2.0 ) photometry. Previous studies have shown that rest-frame -band (2.2 ) photometry appears to be a reliable proxy121212Since the dust optical depth of HXMM05 at rest-frame 158 is 1, its -band emission could be highly attenuated, unless most of the starlight is less attenuated than the dust (e.g., if the latter is dominated by compact star-forming knots and the former is much more extended), which remains possible given its dust morphology, gas excitation, and . for the stellar mass of galaxies, since photometry in this band is relatively insensitive to the past star-formation histories of galaxies (e.g., Kauffmann & Charlot 1998; Lacey et al. 2008; cf. Kannappan & Gawiser 2007), and because NIR emission is less affected by dust extinction compared to optical light. In particular, the difference in the -band luminosity between initial burst and constant star formation models is less than a factor of 3 (e.g., Pérez-González et al. 2008). The main systematic uncertainties associated with are therefore the star-formation histories assumed, the IMF and stellar population synthesis model adopted, and the fact that differential dust extinction is not captured in simple energy balance models (e.g., magphys)131313Alternatively, hot dust emission due to a deeply buried AGN could contribute to the observed IR luminosity, and thus lead to an overestimate of (but see Michałowski et al. 2014, who find insignificant effects of AGN on the SED-derived ).. Nevertheless, the stellar masses inferred from magphys are found to match the true masses of mock galaxies in simulations fairly well (e.g., Michałowski et al., 2014; Hayward & Smith, 2015; Smith & Hayward, 2015), unless the dust attenuation in HXMM05 is underestimated by magphys. Taken at face value141414Note, however, that even assuming no AGN is present in HXMM05, the estimate is accurate to only 0.5 dex (see also Michałowski et al. 2014) on top of the large statistical error bars reported in Table 6., the high stellar mass suggests that a substantial fraction of stars may have already formed in some massive galaxies by = 3 (approximately 2 Gyr after the Big Bang).
The relatively tight “correlation” found between SFR and for star-forming galaxies at low- and high- suggests that the majority of galaxies are forming stars over a long duty cycle in a secular mode (e.g., Rodighiero et al., 2011; Lehnert et al., 2015). The specific SFR of sSFR = 2.37 Gyr-1 of HXMM05 is consistent with the star-forming “main-sequence” (SFMS) within the scatter of the MS relations derived by Tacconi et al. (2013), Lilly et al. (2013), Speagle et al. (2014), and Schreiber et al. (2015), if we extrapolate them to higher masses and include the uncertainties associated with the SFR and stellar mass inferred for HXMM05. One possible caveat is the applicability of the SFMS relation, and whether our current knowledge of the MS is meaningful at high stellar mass (1012 ). In this paper, we only consider HXMM05 as a MS galaxy for the sake of comparing its ISM properties with other high- MS and starburst systems.
5.2.2 Gas Mass, Gas-to-Dust Ratio, and Metallicity
Using the CO ( = 1 0) line intensities (Table 3) and assuming a CO luminosity-to-H2 mass conversion factor of = 0.8 K km pc (e.g., Downes & Solomon, 1998), we derive molecular gas masses of = (1.68 0.43) for X-Main, = (6.52 1.63) for X-NE, and = (2.48 0.65) for the entire system (Figure 2). Using the molecular gas mass of the system, we find a gas-to-dust mass ratio of GDR ( 0.8)-1 = 50145, which is consistent with those measured in the Milky Way, local spiral galaxies, ULIRGs, and DSFGs (Draine & Li, 2007; Wilson et al., 2008; Combes et al., 2013; Bothwell et al., 2013).
Based on the fundamental metallicity relation (FMR) determined by Mannucci et al. (2010), we infer a gas-phase metallicity of = 12log(O/H) = 9.07 for HXMM05 151515This assumes that the FMR relation holds up to = 3 and a stellar mass of 1012 (see e.g., Steidel et al. 2014)., which is comparable to the that of the = 4 SMG GN20 (Magdis et al., 2011). We express the metallicity on the Pettini & Pagel (2004; PP04) scale using the calibration proposed by Kewley & Dopita (2002) and Kewley & Ellison (2008), yielding = 8.74. The range of GDR derived for HXMM05 is consistent with the best-fit GDR relation presented by Magdis et al. (2011), which was determined for a sample of local galaxies studied by Leroy et al. (2011). If the CO-to-H2 conversion factor were 0.8 K km pc, then HXMM05 would lie above this relation. By applying the relations found by Leroy et al. (2011) and Genzel et al. (2012), we find a range of of 1.41.9 K km pc, which would increase the molecular gas mass by a factor of 1.72.4 compared to the value assumed here.
5.2.3 Dust, Gas, and Stellar Mass Ratios
The dust-to-stellar mass ratio (DSR) measures the amount of dust per unit stellar mass that survives all dust destruction processes in a galaxy (e.g., type II SN explosions). The DSR of HXMM05 is 2.3, which is within the range measured in local star-forming galaxies and ULIRGs, but is among the lowest measured in intermediate- ULIRGs and quasars (e.g., Dunne et al., 2011; Combes et al., 2013; Leung et al., 2017). This ratio is also lower than those measured in DSFGs at similar redshifts (e.g., Magdis et al., 2011; Calura et al., 2017).
The molecular gas-to-stellar mass ratio of HXMM05 is / = 0.2, which is higher than those observed in local SFGs and early-type galaxies (e.g., Leroy et al., 2008; Saintonge et al., 2011; Young et al., 2014). Previous studies report a positive evolution in this ratio with redshift (e.g., Tacconi et al., 2010; Davé et al., 2012). The / ratio of HXMM05 is lower than those typically measured in other high- SFGs and DSFGs at 1.2, and is the lowest161616The / ratio is susceptible to uncertainties in the conversion factor and in stellar mass. If we were to adopt a conversion factor of 4.6 K km pc, the gas-to-stellar mass ratio of HXMM05 would be consistent with the expected redshift evolution of the molecular gas mass content in galaxies (Geach et al., 2011). found among massive galaxies at 3 to date (Leroy et al., 2008; Tacconi et al., 2010; Daddi et al., 2010; Geach et al., 2011; Decarli et al., 2016).
The low DSR and gas-to-stellar ratio of HXMM05 may indicate that it is a relatively evolved system, in which a large fraction of its gas has been converted into stars and a large fraction of dust has been locked up in stars. That said, as discussed in §5.1 and §5.2.1, it is possible that the stellar mass maybe overestimated.
5.3. Star Formation Efficiency and Gas Depletion Timescale
To first order, the star formation efficiency (SFE) measures the star formation rate per unit mass of molecular gas available in a galaxy. The SFE of HXMM05 is / = 91 25 (K km s-1 pc2)-1 (or 13 4 Gyr-1), which is slightly higher than but consistent with the range found in nearby active star-forming spiral galaxies ( 0.1; Gao & Solomon, 2004; Solomon & Vanden Bout, 2005; Stevens et al., 2005; Leroy et al., 2008; Wilson et al., 2009; Leroy et al., 2013) and high- massive disk-like galaxies (Daddi et al., 2008, 2010; Aravena et al., 2014). Assuming that the star formation in HXMM05 continues at its current rate without gas replenishment, the gas will be depleted in = 72 27 Myr171717However, the gas reservoir would last 6 times longer if we had instead adopted = 4.6 K km pc in deriving ., comparable to the depletion times in starburst systems. HXMM05 thus lies between SFMS and starburst galaxies in the so-called “transition region” on the integrated version of the “star-formation law” (i.e., relation; Daddi et al. 2010; Magdis et al. 2012; Sargent et al. 2014). We conclude that the gas depletion timescale in HXMM05 is short compared to those of SFMS galaxies at high redshift.
5.4. Dynamical Mass
The rotation curve of a galaxy reflects its dynamics due to the total (i.e., baryonic and dark matter) enclosed mass. We estimate the total dynamical mass enclosed within 8 kpc using . We find an inclination-corrected dynamical mass of = (7.7 3.1) . Taken at face value181818The dominant systematic uncertainties in are the uncertainties in the rotation velocity due to the potential presence of inflows or outflows, in the velocity dispersion, and in our assumption that HXMM05 is a thin disk with negligible scale height., we find a molecular gas mass fraction of = / = 18 8% using the gas mass of the main component of HXMM05 only () and 33 15% using the total molecular gas mass of the system (). The dynamical mass is consistent with the stellar mass within the considerable uncertainties.
Since the dynamical masses derived for most other high- galaxies in the literature are based on marginally resolved or unresolved observations, we also estimate the dynamical mass of HXMM05 using the isotropic estimator = 2.8 (e.g., Engel et al., 2010), where is the CO ( = 1 0) line FWHM measured by fitting a single-Gaussian to the line profile in units of km s-1, and is the FWHM extent of the galaxy measured from CO ( = 1 0) line emission in units of kpc. Here, we adopt the linewidth of HXMM05 excluding X-NE as and the average between the major and minor axes as the extent ( = 7.6 kpc). We thus find an inclination-corrected dynamical mass of = (3.89 1.09) , yielding a molecular gas mass fraction of = 4.3 2.9% using for X-Main only and 5.3 2.4% for the HXMM05 system. However, given the evidence of disk-like rotation for HXMM05, we consider the first dynamical mass estimate (i.e., ) to be more reliable.
5.5. Star Formation Rate and Gas Surface Densities and the Spatially-resolved Star-formation Law
The Schmidt-Kennicutt relation (i.e., the star-formation law) is an empirical relation relating SFR and gas surface densities as , where 1.4 is established from measurements of different nearby galaxy populations (e.g., Schmidt, 1959; Kennicutt, 1998a, 2008). Based on the SFR of 2900 yr-1 and the sizes and flux ratio of XD1 and XD2 at 635 , we find star formation rates of SFR = 1500 and 860 yr-1 and SFR surface densities of = 210 yr-1 kpc-2 and = 120 yr-1 kpc-2 for XD1 and XD2, respectively. These SFR surface densities are elevated compared to those measured in the circumnuclear starburst regions of nearby galaxies (Kennicutt, 1998b), consistent with the overall somewhat shorter gas depletion timescale but are much lower than those observed in high- “maximal starburst”-like galaxies, such as the = 5.3 SMG AzTEC-3, the = 5.7 HyLIRG ADFS 27, and the = 6.3 HFLS3 (Riechers et al., 2013, 2014b, 2017; Oteo et al., 2017b).
For the low surface brightness diffuse dust component, which is almost as extended as the [CII] line emission (Figure 8), we find a source-averaged SFR surface density of 10 yr-1 kpc-2 (or 60 yr -1 kpc-2 including the pair of nuclei). Based on the CO( = 10) line-emitting source size of (8.8 2.9) (6.4 3.5) kpc and the total molecular gas mass measured in the HXMM05 system, the molecular gas surface density is (590 410) (/0.8) pc-2. We thus find that HXMM05 lies along the “starburst sequence” of the Schmidt-Kennicutt relation reported by Bouché et al. (2007). Accounting for uncertainties in SFR and gas surface densities, we find that HXMM05 lies in the same region of parameter space as the sub-regions of GN20 and the = 2.6 SMG SMM J140110252 (Sharon et al., 2013; Hodge et al., 2015).
5.6. CO Gas Excitation
Due to the different physical conditions required to excite the various rotational transitions of CO, flux ratios between the low- and high- CO lines are sensitive to the molecular gas volume densities and kinetic temperatures. With the data at hand (i.e., only four CO lines spanning the CO “ladder” up to = 109), we do not attempt to fit radiative transfer models to the observed line fluxes. Instead, we compare the line ratios measured in HXMM05 (Table 7) with those of other galaxy populations to study the connection between the SFR surface density and the gas excitation in HXMM05 (since SFR surface density is tightly linked to gas density, temperature, and line optical depths).
The global SFR of the HXMM05 system is comparable to those of the most luminous DSFGs known, but their different CO spectral line energy distribution (SLED) shapes indicate that the underlying physical conditions in their ISM may be different. As shown in Figure 13, the gas excitation of the HXMM05 system probed by transitions up to = 5 is lower than those typically observed in nuclear starbursts, SMGs, and quasars, but is comparable to those observed in the outer disk of the Milky Way (despite HXMM05’s much higher SFR), and those observed in high- BzK disks. Such a relatively modest gas excitation is in accord with the modest source-averaged SFR surface density of HXMM05 and its PDR gas conditions (§4.3) — i.e., its total SFR of 2900 yr-1 is spread across the entire disk (as seen in the co-spatial gas and FIR dust distribution), and its extended star formation is embedded within a medium with only moderate radiation flux and pressure.
Including the highest- line probed with the data at hand ( = 109), we find that the overall SLED shape (and thus gas excitation) of HXMM05 resembles that of the local merger-driven ULIRG Arp 220. This may suggest that the molecular ISM of the HXMM05 system is composed of (at least) two gas-phase components — a diffuse extended cold component and a dense warm component.
If we exclude X-NE, we find that the molecular gas in X-Main (i.e., grey symbols in Figure 13) is more highly excited than the system overall, which is comparable to other high- DSFGs (e.g., Riechers, 2011; Sharon et al., 2016). As noted in §3.1, the true CO ( = 5 4) flux may be a factor of two higher. In this case, the excitation conditions of HXMM05 and X-Main would be consistent with (and possibly more excited than) those of other DSFGs. However, higher fidelity data are needed to confirm this scenario.
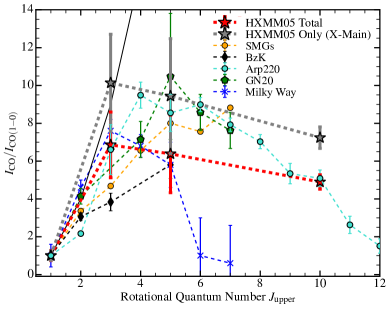
5.7. Morphology and Kinematics of the [CII] and CO Emission
The cold molecular gas reservoir of HXMM05 is approximately 9 kpc 6 kpc in diameter, which is comparable to the mean size of nearby disk-like U/LIRGs (Ueda et al., 2014), and of ULIRGs in general (Gao & Solomon 1999). Similarly extended gas reservoirs have also been observed in some other high- galaxies (Daddi et al., 2010; Ivison et al., 2010a; Riechers et al., 2011a; Ivison et al., 2011; Hodge et al., 2012).
The CO ( = 1 0) FWHM linewidth of HXMM05 is much broader than those typically observed in “normal” star-forming galaxies at low- and high-redshifts, ULIRGs, and high- gas-rich galaxies (Solomon et al., 1997; Solomon & Vanden Bout, 2005; Daddi et al., 2010; Danielson et al., 2011; Ivison et al., 2011; Riechers et al., 2011a, b; Carilli & Walter, 2013; Combes et al., 2013; Sharon et al., 2016), although galaxies with similarly broad line do exist (e.g., J131204242; Hainline et al., 2006; Riechers et al., 2011a). Similarly, the [CII] line of HXMM05 ( = 667 46 km s-1) is also broader than those seen in many other high- galaxies apart from major mergers (e.g., Ivison et al., 2010b; Walter et al., 2012; Ivison et al., 2013; Riechers et al., 2013, 2014a; Neri et al., 2014; Rhoads et al., 2014).
The velocity dispersion traced by the [CII] line emission in HXMM05 is the highest in the central 02 region, as seen in Figure 5. The higher dispersion at the center may indicate gas dynamics affected by late-stage merger activity, intense cold gas accretion/inflows, or enhanced turbulence caused by an undetected AGN, or the fact that systemic motions/radial velocities change abruptly in this region, where the velocity curve is also the steepest. We therefore estimate the gas dispersion in the extended part of HXMM05 based on the velocity dispersion observed in its outskirts, yielding 75 km s-1.
We estimate the stability parameter for HXMM05 using the maximum rotation velocity and the observed velocity dispersion of = 75 km s-1 (see §3.2), yielding = 7 3. This ratio is closer to those measured in nearby disk galaxies (10) than in other high- galaxies (e.g., Genzel et al. 2006; Förster Schreiber et al. 2006; Cresci et al. 2009; Gnerucci et al. 2011; Schreiber et al. 2017). This distinction may suggest that the ISM of HXMM05 is not as turbulent as other high- galaxies studied to date (e.g., Law et al., 2009; Jones et al., 2010; Swinbank et al., 2011) — perhaps a result of its lower gas mass fraction191919Compared based on . compared to other high- galaxies. However, in most high- studies with reliable estimates (requiring spatially resolved information), the ratio is typically derived from stellar kinematics (examples based on CO line emission are still limited in number; e.g., Swinbank et al. 2011). Determining the gas stability of galaxies by imaging their molecular gas reservoirs is more meaningful for characterizing their prospects for star formation, since molecular gas is the raw fuel for star formation. In other words, the stability of gas against gravitational collapse is more closely linked to star formation than the velocity structure of the existing stellar component, which may (re-)settle on a different timescale from the gas after perturbations.
5.8. Dust
5.8.1 Morphology and Optical Depth
HXMM05 remains undetected in deep UV and optical images, indicating that it is highly dust obscured, consistent with its rest-frame 158 optical depth of 1 (determined from SED modeling; §4.1). This optical depth exceeds those of most “normal” star-forming galaxies and nearby disk galaxies, but is similar to that seen in Arp 220 and high- starburst galaxies — e.g., HFLS3, AzTEC-3, and ADFS 27 (Riechers et al., 2013, 2014b, 2017).
The dust emission morphologies at 635 and 870 appear different (Figure 8). While two compact dust components are found to be embedded within an extended component at 635 , only one compact component coincides with XD1 at 870 . The second 635 dust peak, XD2, is 1.8 times fainter than XD1 at its peak flux (see Table 4). If XD1 and XD2 were to have the same peak flux ratio at 635 and 870 , we would expect a peak flux density of 6.2 mJy beam-1 for XD2 at 870 , which we would have detected at 20 significance. Hence, the non-detection of XD2 at 870 may be a result of the lower dust column density at 870 , where the emission is optically thin on average based on202020The optical depth derived from a galaxy-averaged SED model is luminosity-weighted, and thus, biased toward compact dust components. The true optical depth is likely to be even lower in the outskirts of a galaxy. the best-fit dust SED model ( = 0.54).
5.8.2 Interpretation of the compact dust components
The compact dust components, XD1 and XD2, detected at 635 could be two regions of intense star formation, or the remnant cores from a previous merger (e.g., Johansson et al., 2009). At the positions of the double nuclei, the velocity field of HXMM05 is the steepest (see markers in Figure 5), but we find no obvious signs of a misaligned velocity gradient at their positions, which would be expected for the latter scenario. However, the velocity field is only a first-order representation of the kinematics of a galaxy, since it is calculated based on intensity-weighted LOS velocities and is affected by the limited spatial resolution of the data (similarly for the velocity dispersion map). Thus, it will not capture the full kinematics in the system. As such, we cannot rule out the possibility that the double nuclei may be the cores of a pair of progenitor galaxies, where the gas disk may have reconfigured itself into rotation already (e.g., Springel & Hernquist, 2005; Robertson et al., 2006; Narayanan et al., 2008; Robertson & Bullock, 2008; Hopkins et al., 2009). Such a scenario would be reminiscent of the nearby ULIRG Arp 220 (e.g., Sakamoto et al., 2008; Scoville et al., 2017), but with a greater separation between the pair in HXMM05.
Alternatively, if the dust peaks were truly giant star-forming “clumps” that are virialized, we would expect their velocity dispersions to be 40 km s-1 or 400 km s-1 based on the size-linewidth relations found for local GMCs in a quiescent environment or the Galactic center, respectively (Larson, 1981). As shown in Figure 5, the observed velocity dispersion in the nuclei of HXMM05 is 160200 km s-1. Thus, the dust peaks are unlikely to be virialized clumps.
Similarly, a scenario in which XD1 and XD2 correspond to the “twin peaks” produced in response to an (i.e., bar or oval) perturbation (see e.g., Kenney et al., 1992) is disfavored for two main reasons: the lack of obvious non-circular motions (§4.2.1), and the pronounced asymmetry in the 635/870 flux ratio of XD1 and XD2 (i.e., implying differences in their optical depths and dust column densities).
5.9. [CII] and FIR Luminosity Ratio
The / ratio measures the fraction of far-UV photons that is heating up the gas versus that deposited onto dust grains. We find a / ratio of 0.20 0.03% for HXMM05. Thus, HXMM05 lies in the same region of parameter space as nearby star-forming galaxies and LIRGs, despite its two orders of magnitude higher (e.g., Stacey et al., 2010). This ratio is consistent with those measured in other high- star formation-dominated galaxies with similar far-IR luminosities in the / plane (cf. nearby ULIRGs and high- quasars; Malhotra et al., 2001; Hailey-Dunsheath et al., 2010; Stacey et al., 2010; Wang et al., 2013; Díaz-Santos et al., 2013; Zhang et al., 2018b), suggesting that HXMM05 is dominated by extended star formation rather than a compact starbursts or AGN (see also §2.6.9). This evidence is consistent with the extent observed in its gas and dust emission.
5.10. Spatially Resolved / Map and Star Formation
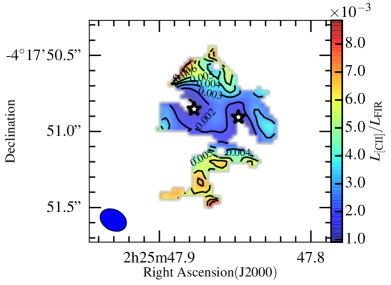
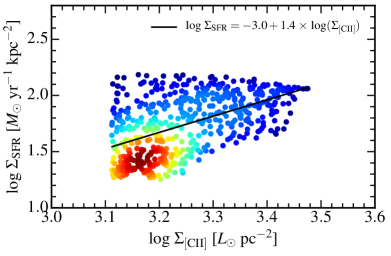
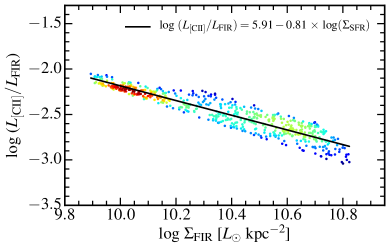
We investigate the spatially resolved [CII]-to-FIR luminosity ratio in HXMM05 on 1-kpc scale to examine the connection between SFR and [CII] surface densities. To create the surface density plots in Figures 14 and 15, we clipped both the [CII] and the 635 continuum maps at 3212121 We also test our results with less clipping (at 1) to confirm that the trends and relationships found are not artificial or biased because of “excessive” clipping.. Essentially, the notion of using the [CII] luminosity as a proxy for SFR relies on the assumption that [CII] dominates the cooling budget of the neutral ISM, in which heating is dominated by the photoelectric effect of UV photons from young and massive stars. We show the relation for HXMM05 in the left panel of Figure 15. The large scatter suggests that [CII] emission traces both star-forming regions and “diffuse” gas reservoirs. The trend of decreasing / at high suggests that the former is suppressed in compact, high-SFR surface density regions (Figure 14). On the other hand, we find a tighter relation between and , as shown in the right panel of Figure 15.
We fit power-laws of the forms = A and = A to our data for HXMM05, and find the following best-fit relations:
| (7) |
and
| (8) |
The slope of the former relation coincidentally resembles the slope of the Schmidt-Kennicutt relation for the CO ( = 1 0) line on kpc scales, albeit with a large scatter (Kennicutt, 1998b). The slope of the latter relation is steeper than those reported by Díaz-Santos et al. (2013, 2017) for nearby ULIRGs, perhaps due to the different tracers used. The latter authors use and source size measured at 24 to derive the FIR surface density, whereas we use and FIR size (or pixels) measured at rest-frame 158 for HXMM05. The steeper relation found in HXMM05 can also be understood if we were to assume that its outer region, where the / ratio is the highest, has a lower metallicity (and thus, a higher photoelectric heating efficiency). In any case, the tight relationship is consistent with the notion that the two quantities are connected through the the local FUV radiation field intensity.
We find that the / ratio of HXMM05 decreases toward the center, as shown in the spatially resolved map in Figure 14. Such a negative gradient has been observed in nearby star-forming galaxies (e.g., Kramer et al., 2013; Smith et al., 2017) and U/LIRGs (Díaz-Santos et al. 2014). The deficit at the center may be explained by a higher dust temperature (see §3.4) and a more intense radiation field at the center (given that ). In addition, the gas density at the center is likely to exceed the critical density of [CII], where collisional de-excitation dominates and saturates the [CII] emission (Luhman et al. 1998; Malhotra et al. 1997; Goldsmith et al. 2012). This effect also explains the decreasing ratio found with increasing FIR surface densities in the relation (Figure 15).
5.11. HXMM05 in the Context of High- Galaxy Populations
HXMM05 is one of the most IR-luminous galaxies known at high redshift. Given its IR luminosity of = 4 , it can be classified as a HyLIRG. However, we find that its ISM properties differ from those observed in some other unlensed HyLIRGs studied to date. For instance, both the gas and SFR surface densities of HXMM05 are much lower than those observed in GN20 and the = 5.7 binary HyLIRG ADFS 27 (Hodge et al., 2012; Riechers et al., 2017), but are comparable to those of the = 2.4 HyLIRG merger HATLAS J084933 and the sub-regions of GN20 (Ivison et al., 2013; Hodge et al., 2015), suggesting that the star formation in HXMM05 is relatively modest compared to “maximum”-starburst-like HyLIRGs.
Given the dynamical mass, stellar mass, and sSFR of HXMM05, it is among the most massive galaxies known at = 3. However, as discussed in §3.4, HXMM05 was discovered with Herschel/SPIRE observations at submillimeter wavelengths and remains undetected in deep UV and optical observations. It therefore differs from other high- massive disk galaxy populations, such as those typically selected in the UV, optical, and NIR wavebands by applying the -, -, -, -, -, -band color-selection and the Lyman Break “dropout” technique (i.e., BzK, BM/BX, and LBG; Steidel et al. 1996; Adelberger et al. 2004; Steidel et al. 2004; Daddi et al. 2004), in that it has a larger dust content, which may suggest different evolutionary histories for these high- populations.
The molecular gas extent, kinematics, gas excitation, SFR, dust mass, SFE, SFR surface density, and metallicity of HXMM05 are similar to those of GN20. This agreement suggests that HXMM05 and GN20 may belong to the same class of DSFG. The finding of such rare massive disk galaxies at 3 could be consistent with model predictions that disk-wide star formation plays an important role for some of the most massive DSFGs at early epochs, whether as a phase in a merger event or (Hayward et al., 2013) independent of a major merger altogether222222This statement does not explicitly address the relevance of merger activity in the overall evolution of massive disks..
6. Implications on the Formation Scenarios of HXMM05 — Major Merger and Cold Mode Accretion
With a SFR of 2900 yr-1 and a stellar mass of , distributed across a rotating disk 9 kpc in diameter, HXMM05 is a massive rotation-dominated star-forming galaxy. One of the main goals in studying high- star-forming galaxies is to examine and understand what drives their high SFRs. A critical question concerns whether an interaction is required to drive the high SFRs observed in high- starbursting DSFGs — which would put them in a transient phase — or whether DSFGs are just a massive galaxy population undergoing “quiescent” star formation, but at higher rates due simply to their higher masses and/or gas mass fractions compared to nearby and low-mass galaxies. Previous theoretical and observational studies have suggested that star formation in the most massive starburst-dominated DSFGs is likely triggered by major mergers, whereas less massive systems could be triggered by gravitational instability as a result of their high gas mass fractions (e.g., Chapman et al., 2003; Engel et al., 2010; Narayanan et al., 2010; Hayward et al., 2011, 2013; Riechers et al., 2017).
In cosmological N-body zoom-in and hydrodynamic simulations, massive galaxies with stellar masses similar to that of HXMM05, albeit rare, can be formed quickly by = 6 via multiple gas-rich major mergers (Li et al., 2007; Davé et al., 2010, see also Ruszkowski & Springel 2009). From a theoretical point of view, it is thus conceivable that HXMM05 may have recently experienced a major merger that would explain its broad CO lines, high SFR, large molecular gas mass, and its 3 kpc size double nuclei observed at 635 . In this scenario, the double nuclei may correspond to two compact obscured starburst regions triggered by massive gas inflows, or to the remnant cores of two similar mass progenitor galaxies (Johansson et al., 2009). On the other hand, the observed spatial extent, velocity gradient, , and gas surface density observed in HXMM05 are more consistent with a rotation-dominated “normal” star-forming galaxy, suggesting that additional mechanisms may be at work to form a system like HXMM05.
In the standard model of dissipational disk formation, infant disk galaxies form from the gas that is infalling into hierarchically growing dark matter halos. However, since a substantial fraction of the angular momentum of gas is lost to the surrounding halo through dynamical friction (up to 90%) while it configures itself into a rotationally supported disk in the inner portion of the dark matter halo, disks are an order of magnitude smaller than those observed (also known as the angular momentum “catastrophe”; e.g., Steinmetz & Navarro, 1999). In this formation paradigm, a massive extended disk like HXMM05 is quite unexpected at = 3 (only about 2 Gyr after the Big Bang). While feedback and the continuation of tidal torquing and accretion of satellite galaxies/minor mergers have been proposed to resolve the disagreement between models and observations, as they can prevent the gas from over-cooling and losing its angular momentum (e.g., Sommer-Larsen & Dolgov, 2001; Robertson et al., 2004; Scannapieco et al., 2008; Zavala et al., 2008), it remains unclear whether minor mergers232323Major mergers would take a few Gyr to form an extended disk again from two progenitor disks, if ever (e.g., Governato et al., 2009). alone could increase the angular momentum sufficiently to explain the properties and number density of disk galaxies observed (e.g., Vitvitska et al. 2002).
In recent years, the cold mode accretion formation model has been put forward as an alternative mechanism capable of driving the high SFRs seen in high- gas-rich star-forming galaxies, which may also explain the discrepancy with major mergers (i.e., there are not enough major mergers in models to explain all DSFGs as merger-driven starbursts; Kereš et al. 2005; Dekel et al. 2009a, b; Davé et al. 2010; see also Narayanan et al. 2015 and Lacey et al. 2016). Since cold streams can provide additional angular momentum, extended gas-rich disk galaxies with kpc-scale star formation can be explained naturally (Kereš et al., 2005; Dekel et al., 2009a).
Given that some properties of HXMM05 are consistent with the major merger scenario and others are consistent with the cold mode accretion scenario, it is conceivable that both mechanisms together are important to give rise to a galaxy like HXMM05, which perhaps is similar to the case of GN20 (see Carilli et al. 2010).
7. Summary and Conclusions
We determine the redshift and gas excitation of the Herschel-selected DSFG HXMM05 at = 2.9850 0.0009 by observing its CO( = 10; 32; 54; 109) line emission. We image its gas reservoir and dust-obscured star formation on 1.2 kpc scales using [CII] line and dust continuum emission.
We detect a companion galaxy (hereafter X-NE) about 20 kpc NE of the main component of HXMM05 (hereafter X-Main) in CO ( = 1 0) and [CII] line emission at a redshift close to X-Main ( = 535 55 km s-1). X-NE is also detected in the UV, optical, and NIR continuum emission. Based on the CO ( = 1 0) line flux, we infer a total molecular gas mass of = (2.12 0.71) (/0.8) residing in the HXMM05 system (composed of X-NE and X-Main), yielding a gas mass fraction of = 33 15%.
Based on the CO ( = 1 0) and [CII] line data, the velocity structure of X-Main is consistent with a rotating disk, with a diameter of 9 kpc. Thus, the gas reservoir of HXMM05 is more extended than those typically observed in high- DSFGs and quasars, but comparable to those observed in high- “main-sequence” galaxies and the = 4 starburst galaxy GN20 (Carilli et al., 2010; Hodge et al., 2015). We find that the widths of its CO( = 10; 109) and [CII] lines are broader than those typically observed in “normal” star-forming galaxies, ULIRGs, and high- SMGs, but comparable to those observed in the more extreme systems (e.g., J131204242 and G09v124; Riechers et al. 2011a; Ivison et al. 2013). We find that the overall gas excitation of HXMM05 resembles that of the nearby galaxy merger Arp 220. The shape of the CO excitation ladder (i.e., SLED) suggests that the molecular ISM of HXMM05 may consist of (at least) two gas phases — a diffuse extended cold component and a dense compact warm component.
The X-Main component of the HXMM05 system remains undetected in deep UV and optical observations, indicating that it is highly dust obscured. We find a pair of compact dust components (XD1 and XD2) in the dust continuum emission at 635 , which are about 3 kpc across each and are separated by 2 kpc. The pair is embedded within an extended dust component, which also appears to be as extended as the CO ( = 1 0) and [CII] line emission. The brightness temperatures of the nuclei suggest that they may be warmer, more optically thick, and/or with higher beam filling factors than the extended dust component. We find that the source-averaged FUV radiation field intensity of HXMM05 is around 200 times stronger than that of the local Galactic interstellar medium, but is comparable to those observed in nearby star-forming galaxies and other DSFGs. The PDR properties of HXMM05 together with its gas properties and excitation are indicative of galaxy-wide star formation, consistent with its extended gas and dust emission observed (as opposed to those typically observed in compact starburst galaxies).
We find a stellar mass of 1012 and an SFR of 2900 yr-1 for HXMM05 from SED modeling, consistent with it being one of the most massive star-forming galaxies at = 3. We also find source-averaged SFR and molecular gas surface densities of = 10 60 yr-1 kpc-2 and = 590 pc-2. Thus, HXMM05 lies along the “starburst sequence” of the Schmidt-Kennicutt relation (e.g., Bouché et al., 2007), similar to the sub-regions of GN20 and the 2.6 SMG SMM J140110252 (Sharon et al. 2013; Hodge et al. 2015). This locus corresponds to an elevated SFE compared to other SFMS galaxies. The SFR surface densities for the double nuclei are elevated compared to those observed in the circumnuclear starburst regions of nearby galaxies (Kennicutt, 1998b), but are much lower than those observed in other (not strongly lensed) high- HyLIRGs (“maximum starbursts”; e.g., Riechers et al., 2013, 2014b, 2017; Oteo et al., 2017b).
A large scatter seen in the relation for HXMM05 on 1 kpc scale suggests that its [CII] emission traces both star-forming regions and “diffuse” gas reservoirs. We find a tighter relation between / and across HXMM05, which is consistent with our understanding that the two quantities are connected through the local FUV radiation field intensity (e.g., Tielens & Hollenbach, 1985, and references therein). We find that the / ratio is “suppressed” at high SFR surface densities (e.g., near the center of HXMM05), which is suggestive of a stronger UV radiation field and warmer dust emission there. On the other hand, the source-averaged / ratio of HXMM05 is comparable to those of nearby star-forming galaxies and LIRGs rather than nearby ULIRGs and quasars, despite its two orders of magnitude higher .
The scatter observed in the spatially resolved and galaxy-integrated [CII] and FIR luminosity relations for HXMM05 are consistent with our understanding that and SFR are not related linearly. The spatially resolved data presented in this paper thus confirm the speculation put forward by Stacey et al. (2010) based on unresolved observations: that high- DSFGs are not simple scaled-up ULIRGs and that starburst-dominated DSFGs can be much more extended than ULIRGs, which is also consistent with previous findings of spatially extended CO emission (e.g., Riechers et al., 2011a; Ivison et al., 2011).
While rotationally-supported clumps may yield velocity gradients (§5.8.2), we find no evidence of such with the data at hand, in spite of the pair of dust peaks identified. Even in the merging clump scenario (e.g., in late stage merger), it is unlikely for the clumps to have a huge impact on the global scale across the entire galaxy as to cause a monotonic velocity gradient over 9 kpc across, especially given the observed centrally peaked velocity dispersion observed in the [CII] data, which is relatively uniform outside the central 1.2 kpc242424 Approximately the beam size.. Another piece of evidence disfavoring HXMM05 from being strictly a dispersion-dominated merger system comes from the fact that the potential merger candidates (the pair of dust peaks) are oriented almost-perpendicular to the velocity gradient. We further quantified the disk-like kinematics of HXMM05 based on the higher order Fourier coefficients of the harmonic decomposition (§4.2.1), which are found to be insignificant compared to the = 0 term. We thus interpret HXMM05 to be a rotating disk252525Note that this does not rule out the possibility that the disk is part of a merger..
The disk-like kinematics, extended star formation, high SFR and , and gas and SFR surface densities of HXMM05 are quite similar to those of GN20 (Hodge et al., 2012, 2015), suggesting that the two may correspond to the same class of DSFG — massive extended rotating disks with highly dust-obscured star formation.
HXMM05 can be classified as a HyLIRG, making it one of the most IR-luminous galaxies known. In a sample of the brightest high- DSFGs discovered in the 95 deg2 surveyed by HerMES, only around 10% appear to be intrinsically comparably luminous, corresponding to a surface density of only 0.03 deg-2 (Bussmann et al., 2015). In fact, the stellar mass function also suggests that massive galaxies like HXMM05 are very rare at = 3 (Davé et al. 2010; Schreiber et al. 2015). In the framework of the hierarchical formation model, one would expect a massive galaxy like HXMM05 to form via major mergers, given its high SFR and . The two compact dust nuclei and enhanced central velocity dispersion as well as the detection of a companion galaxy at only 20 kpc away may be consistent with such a scenario. However, its extended massive gas disk, monotonic velocity gradient, , and gas and SFR surface densities at = 3 suggest additional mechanisms such as proposed in the cold mode accretion model may also play an important role in shaping the existence and subsequent evolution of massive DSFGs. HXMM05 could thus be a rare example of such system showing both mechanisms at play.
References
- Adelberger et al. (2004) Adelberger, K. L., Steidel, C. C., Shapley, A. E., et al. 2004, ApJ, 607, 226
- Aravena et al. (2014) Aravena, M., Hodge, J. A., Wagg, J., et al. 2014, MNRAS, 442, 558
- Astropy Collaboration et al. (2013) Astropy Collaboration, Robitaille, T. P., Tollerud, E. J., et al. 2013, A&A, 558, A33
- Begeman (1989) Begeman, K. G. 1989, A&A, 223, 47
- Bothwell et al. (2013) Bothwell, M. S., Smail, I., Chapman, S. C., et al. 2013, MNRAS, 429, 3047
- Bouché et al. (2007) Bouché, N., Cresci, G., Davies, R., et al. 2007, ApJ, 671, 303
- Braine et al. (2012) Braine, J., Gratier, P., Kramer, C., et al. 2012, A&A, 544, A55
- Bussmann et al. (2015) Bussmann, R. S., Riechers, D., Fialkov, A., et al. 2015, ApJ, 812, 43
- Calanog et al. (2014) Calanog, J. A., Fu, H., Cooray, A., et al. 2014, ApJ, 797, 138
- Calura et al. (2017) Calura, F., Pozzi, F., Cresci, G., et al. 2017, MNRAS, 465, 54
- Carilli & Walter (2013) Carilli, C. L., & Walter, F. 2013, ARA&A, 51, 105
- Carilli et al. (2010) Carilli, C. L., Daddi, E., Riechers, D., et al. 2010, ApJ, 714, 1407
- Carral et al. (1994) Carral, P., Hollenbach, D. J., Lord, S. D., et al. 1994, ApJ, 423, 223
- Casey et al. (2014) Casey, C. M., Narayanan, D., & Cooray, A. 2014, Phys. Rep., 541, 45
- Chabrier (2003) Chabrier, G. 2003, PASP, 115, 763
- Chapman et al. (2003) Chapman, S. C., Windhorst, R., Odewahn, S., Yan, H., & Conselice, C. 2003, ApJ, 599, 92
- Chemin et al. (2009) Chemin, L., Carignan, C., & Foster, T. 2009, ApJ, 705, 1395
- Chiappetti et al. (2005) Chiappetti, L., Tajer, M., Trinchieri, G., et al. 2005, A&A, 439, 413
- Colbert et al. (1999) Colbert, J. W., Malkan, M. A., Clegg, P. E., et al. 1999, ApJ, 511, 721
- Combes et al. (2013) Combes, F., García-Burillo, S., Braine, J., et al. 2013, A&A, 550, A41
- Courteau (1997) Courteau, S. 1997, AJ, 114, 2402
- Cresci et al. (2009) Cresci, G., Hicks, E. K. S., Genzel, R., et al. 2009, ApJ, 697, 115
- da Cunha et al. (2008) da Cunha, E., Charlot, S., & Elbaz, D. 2008, MNRAS, 388, 1595
- da Cunha et al. (2015) da Cunha, E., Walter, F., Smail, I. R., et al. 2015, ApJ, 806, 110
- Daddi et al. (2008) Daddi, E., Dannerbauer, H., Elbaz, D., et al. 2008, ApJ, 673, L21
- Daddi et al. (2004) Daddi, E., Cimatti, A., Renzini, A., et al. 2004, ApJ, 600, L127
- Daddi et al. (2010) Daddi, E., Bournaud, F., Walter, F., et al. 2010, ApJ, 713, 686
- Daddi et al. (2015) Daddi, E., Dannerbauer, H., Liu, D., et al. 2015, A&A, 577, A46
- Danielson et al. (2011) Danielson, A. L. R., Swinbank, A. M., Smail, I., et al. 2011, MNRAS, 410, 1687
- Davé et al. (2012) Davé, R., Finlator, K., & Oppenheimer, B. D. 2012, MNRAS, 421, 98
- Davé et al. (2010) Davé, R., Finlator, K., Oppenheimer, B. D., et al. 2010, MNRAS, 404, 1355
- Decarli et al. (2016) Decarli, R., Walter, F., Aravena, M., et al. 2016, ApJ, 833, 70
- Dekel et al. (2009a) Dekel, A., Sari, R., & Ceverino, D. 2009a, ApJ, 703, 785
- Dekel et al. (2009b) Dekel, A., Birnboim, Y., Engel, G., et al. 2009b, Nature, 457, 451
- Di Teodoro & Fraternali (2015) Di Teodoro, E. M., & Fraternali, F. 2015, MNRAS, 451, 3021
- Díaz-Santos et al. (2013) Díaz-Santos, T., Armus, L., Charmandaris, V., et al. 2013, ApJ, 774, 68
- Díaz-Santos et al. (2014) —. 2014, ApJ, 788, L17
- Díaz-Santos et al. (2017) —. 2017, ApJ, 846, 32
- Diolaiti et al. (2000) Diolaiti, E., Bendinelli, O., Bonaccini, D., et al. 2000, A&AS, 147, 335
- Donley et al. (2008) Donley, J. L., Rieke, G. H., Pérez-González, P. G., & Barro, G. 2008, ApJ, 687, 111
- Donley et al. (2007) Donley, J. L., Rieke, G. H., Pérez-González, P. G., Rigby, J. R., & Alonso-Herrero, A. 2007, ApJ, 660, 167
- Dowell et al. (2014) Dowell, C. D., Conley, A., Glenn, J., et al. 2014, ApJ, 780, 75
- Downes & Solomon (1998) Downes, D., & Solomon, P. M. 1998, ApJ, 507, 615
- Draine & Li (2007) Draine, B. T., & Li, A. 2007, ApJ, 657, 810
- Dunne et al. (2003) Dunne, L., Eales, S. A., & Edmunds, M. G. 2003, MNRAS, 341, 589
- Dunne et al. (2011) Dunne, L., Gomez, H. L., da Cunha, E., et al. 2011, MNRAS, 417, 1510
- Elson (2014) Elson, E. C. 2014, MNRAS, 437, 3736
- Elvis et al. (1978) Elvis, M., Maccacaro, T., Wilson, A. S., et al. 1978, MNRAS, 183, 129
- Engel et al. (2010) Engel, H., Tacconi, L. J., Davies, R. I., et al. 2010, ApJ, 724, 233
- Fall & Efstathiou (1980) Fall, S. M., & Efstathiou, G. 1980, MNRAS, 193, 189
- Fixsen et al. (1999) Fixsen, D. J., Bennett, C. L., & Mather, J. C. 1999, ApJ, 526, 207
- Förster Schreiber et al. (2006) Förster Schreiber, N. M., Genzel, R., Lehnert, M. D., et al. 2006, ApJ, 645, 1062
- Fu et al. (2013) Fu, H., Cooray, A., Feruglio, C., et al. 2013, Nature, 498, 338
- Gao & Solomon (1999) Gao, Y., & Solomon, P. M. 1999, ApJ, 512, L99
- Gao & Solomon (2004) —. 2004, ApJ, 606, 271
- Geach et al. (2011) Geach, J. E., Smail, I., Moran, S. M., et al. 2011, ApJ, 730, L19
- Genzel et al. (2006) Genzel, R., Tacconi, L. J., Eisenhauer, F., et al. 2006, Nature, 442, 786
- Genzel et al. (2012) Genzel, R., Tacconi, L. J., Combes, F., et al. 2012, ApJ, 746, 69
- Genzel et al. (2017) Genzel, R., Schreiber, N. M. F., Übler, H., et al. 2017, Nature, 543, 397
- Gnerucci et al. (2011) Gnerucci, A., Marconi, A., Cresci, G., et al. 2011, A&A, 528, A88
- Goldsmith et al. (2012) Goldsmith, P. F., Langer, W. D., Pineda, J. L., & Velusamy, T. 2012, ApJS, 203, 13
- Governato et al. (2009) Governato, F., Brook, C. B., Brooks, A. M., et al. 2009, MNRAS, 398, 312
- Greve et al. (2009) Greve, T. R., Papadopoulos, P. P., Gao, Y., & Radford, S. J. E. 2009, ApJ, 692, 1432
- Hailey-Dunsheath et al. (2010) Hailey-Dunsheath, S., Nikola, T., Stacey, G. J., et al. 2010, ApJ, 714, L162
- Hainline et al. (2006) Hainline, L. J., Blain, A. W., Greve, T. R., et al. 2006, ApJ, 650, 614
- Hallenbeck et al. (2014) Hallenbeck, G., Huang, S., Spekkens, K., et al. 2014, AJ, 148, 69
- Hayward et al. (2011) Hayward, C. C., Kereš, D., Jonsson, P., et al. 2011, ApJ, 743, 159
- Hayward et al. (2013) Hayward, C. C., Narayanan, D., Kereš, D., et al. 2013, MNRAS, 428, 2529
- Hayward & Smith (2015) Hayward, C. C., & Smith, D. J. B. 2015, MNRAS, 446, 1512
- Hinshaw et al. (2013) Hinshaw, G., Larson, D., Komatsu, E., et al. 2013, ApJS, 208, 19
- Hodge et al. (2012) Hodge, J. A., Carilli, C. L., Walter, F., et al. 2012, ApJ, 760, 11
- Hodge et al. (2015) Hodge, J. A., Riechers, D., Decarli, R., et al. 2015, ApJ, 798, L18
- Hollenbach et al. (2012) Hollenbach, D., Kaufman, M. J., Neufeld, D., Wolfire, M., & Goicoechea, J. R. 2012, ApJ, 754, 105
- Hollenbach & Tielens (1999) Hollenbach, D. J., & Tielens, A. G. G. M. 1999, Reviews of Modern Physics, 71, 173
- Hopkins et al. (2009) Hopkins, P. F., Cox, T. J., Younger, J. D., & Hernquist, L. 2009, ApJ, 691, 1168
- Hudelot et al. (2012) Hudelot, P., Cuillandre, J.-C., Withington, K., et al. 2012, VizieR Online Data Catalog, 2317
- Ivison et al. (2011) Ivison, R. J., Papadopoulos, P. P., Smail, I., et al. 2011, MNRAS, 412, 1913
- Ivison et al. (2010a) Ivison, R. J., Smail, I., Papadopoulos, P. P., et al. 2010a, MNRAS, 404, 198
- Ivison et al. (2010b) Ivison, R. J., Swinbank, A. M., Swinyard, B., et al. 2010b, A&A, 518, L35
- Ivison et al. (2013) Ivison, R. J., Swinbank, A. M., Smail, I., et al. 2013, ApJ, 772, 137
- Jarvis et al. (2013) Jarvis, M. J., Bonfield, D. G., Bruce, V. A., et al. 2013, MNRAS, 428, 1281
- Johansson et al. (2009) Johansson, P. H., Naab, T., & Burkert, A. 2009, ApJ, 690, 802
- Jones et al. (2010) Jones, T., Ellis, R., Jullo, E., & Richard, J. 2010, ApJ, 725, L176
- Jovanović (2017) Jovanović, M. 2017, MNRAS, 469, 3564
- Kamenetzky et al. (2014) Kamenetzky, J., Rangwala, N., Glenn, J., Maloney, P. R., & Conley, A. 2014, ApJ, 795, 174
- Kannappan & Gawiser (2007) Kannappan, S. J., & Gawiser, E. 2007, ApJ, 657, L5
- Kauffmann & Charlot (1998) Kauffmann, G., & Charlot, S. 1998, MNRAS, 297, L23
- Kaufman et al. (2006) Kaufman, M. J., Wolfire, M. G., & Hollenbach, D. J. 2006, ApJ, 644, 283
- Kaufman et al. (1999) Kaufman, M. J., Wolfire, M. G., Hollenbach, D. J., & Luhman, M. L. 1999, ApJ, 527, 795
- Kenney et al. (1992) Kenney, J. D. P., Wilson, C. D., Scoville, N. Z., Devereux, N. A., & Young, J. S. 1992, ApJ, 395, L79
- Kennicutt (1998a) Kennicutt, Jr., R. C. 1998a, ARA&A, 36, 189
- Kennicutt (1998b) —. 1998b, ApJ, 498, 541
- Kennicutt (2008) Kennicutt, Jr., R. C. 2008, in Astronomical Society of the Pacific Conference Series, Vol. 390, Pathways Through an Eclectic Universe, ed. J. H. Knapen, T. J. Mahoney, & A. Vazdekis, 149
- Kereš et al. (2005) Kereš, D., Katz, N., Weinberg, D. H., & Davé, R. 2005, MNRAS, 363, 2
- Kewley & Dopita (2002) Kewley, L. J., & Dopita, M. A. 2002, ApJS, 142, 35
- Kewley & Ellison (2008) Kewley, L. J., & Ellison, S. L. 2008, ApJ, 681, 1183
- Krajnović et al. (2006) Krajnović, D., Cappellari, M., de Zeeuw, P. T., & Copin, Y. 2006, MNRAS, 366, 787
- Kramer et al. (2013) Kramer, C., Abreu-Vicente, J., García-Burillo, S., et al. 2013, A&A, 553, A114
- Lacey et al. (2008) Lacey, C. G., Baugh, C. M., Frenk, C. S., et al. 2008, MNRAS, 385, 1155
- Lacey et al. (2016) —. 2016, MNRAS, 462, 3854
- Lang et al. (2017) Lang, P., Förster Schreiber, N. M., Genzel, R., et al. 2017, ApJ, 840, 92
- Larson (1981) Larson, R. B. 1981, MNRAS, 194, 809
- Law et al. (2009) Law, D. R., Steidel, C. C., Erb, D. K., et al. 2009, ApJ, 697, 2057
- Le Petit et al. (2006) Le Petit, F., Nehmé, C., Le Bourlot, J., & Roueff, E. 2006, ApJS, 164, 506
- Lehnert et al. (2015) Lehnert, M. D., van Driel, W., Le Tiran, L., Di Matteo, P., & Haywood, M. 2015, A&A, 577, A112
- Leroy et al. (2008) Leroy, A. K., Walter, F., Brinks, E., et al. 2008, AJ, 136, 2782
- Leroy et al. (2011) Leroy, A. K., Bolatto, A., Gordon, K., et al. 2011, ApJ, 737, 12
- Leroy et al. (2013) Leroy, A. K., Walter, F., Sandstrom, K., et al. 2013, AJ, 146, 19
- Leung et al. (2017) Leung, T. K. D., Riechers, D. A., & Pavesi, R. 2017, ApJ, 836, 180
- Li et al. (2007) Li, Y., Hernquist, L., Robertson, B., et al. 2007, ApJ, 665, 187
- Lilly et al. (2013) Lilly, S. J., Carollo, C. M., Pipino, A., Renzini, A., & Peng, Y. 2013, ApJ, 772, 119
- Lonsdale et al. (2003) Lonsdale, C. J., Smith, H. E., Rowan-Robinson, M., et al. 2003, PASP, 115, 897
- Luhman et al. (1998) Luhman, M. L., Satyapal, S., Fischer, J., et al. 1998, ApJ, 504, L11
- Madau & Dickinson (2014) Madau, P., & Dickinson, M. 2014, ARA&A, 52, 415
- Magdis et al. (2011) Magdis, G. E., Elbaz, D., Dickinson, M., et al. 2011, A&A, 534, A15
- Magdis et al. (2012) Magdis, G. E., Daddi, E., Sargent, M., et al. 2012, ApJ, 758, L9
- Malhotra et al. (1997) Malhotra, S., Helou, G., Stacey, G., et al. 1997, ApJ, 491, L27
- Malhotra et al. (2001) Malhotra, S., Kaufman, M. J., Hollenbach, D., et al. 2001, ApJ, 561, 766
- Mannucci et al. (2010) Mannucci, F., Cresci, G., Maiolino, R., Marconi, A., & Gnerucci, A. 2010, MNRAS, 408, 2115
- Martin et al. (2005) Martin, D. C., Fanson, J., Schiminovich, D., et al. 2005, ApJ, 619, L1
- Mauduit et al. (2012) Mauduit, J.-C., Lacy, M., Farrah, D., et al. 2012, PASP, 124, 714
- McGaugh & Schombert (2015) McGaugh, S. S., & Schombert, J. M. 2015, ApJ, 802, 18
- Michałowski et al. (2014) Michałowski, M. J., Hayward, C. C., Dunlop, J. S., et al. 2014, A&A, 571, A75
- Mittal et al. (2011) Mittal, R., O’Dea, C. P., Ferland, G., et al. 2011, MNRAS, 418, 2386
- Mo et al. (1998) Mo, H. J., Mao, S., & White, S. D. M. 1998, MNRAS, 295, 319
- Narayanan et al. (2010) Narayanan, D., Hayward, C. C., Cox, T. J., et al. 2010, MNRAS, 401, 1613
- Narayanan et al. (2008) Narayanan, D., Li, Y., Cox, T. J., et al. 2008, ApJS, 174, 13
- Narayanan et al. (2015) Narayanan, D., Turk, M., Feldmann, R., et al. 2015, Nature, 525, 496
- Neri et al. (2014) Neri, R., Downes, D., Cox, P., & Walter, F. 2014, A&A, 562, A35
- Nikola et al. (1998) Nikola, T., Genzel, R., Herrmann, F., et al. 1998, ApJ, 504, 749
- Nyland et al. (2017) Nyland, K., Lacy, M., Sajina, A., et al. 2017, ApJS, 230, 9
- Oberst et al. (2006) Oberst, T. E., Parshley, S. C., Stacey, G. J., et al. 2006, ApJ, 652, L125
- Oliver et al. (2012) Oliver, S. J., Bock, J., Altieri, B., et al. 2012, MNRAS, 424, 1614
- Oteo et al. (2016a) Oteo, I., Ivison, R. J., Dunne, L., et al. 2016a, ApJ, 827, 34
- Oteo et al. (2016b) —. 2016b, ApJ, 827, 34
- Oteo et al. (2017a) Oteo, I., Zhang, Z.-Y., Yang, C., et al. 2017a, ApJ, 850, 170
- Oteo et al. (2017b) Oteo, I., Ivison, R. J., Negrello, M., et al. 2017b, ArXiv e-prints, arXiv:1709.04191
- Oteo et al. (2018) Oteo, I., Ivison, R. J., Dunne, L., et al. 2018, ApJ, 856, 72
- Pavesi et al. (2016) Pavesi, R., Riechers, D. A., Capak, P. L., et al. 2016, ApJ, 832, 151
- Pavesi et al. (2018) Pavesi, R., Riechers, D. A., Sharon, C. E., et al. 2018, ArXiv e-prints, arXiv:1803.08048
- Peng et al. (2002) Peng, C. Y., Ho, L. C., Impey, C. D., & Rix, H.-W. 2002, AJ, 124, 266
- Pérez-González et al. (2008) Pérez-González, P. G., Rieke, G. H., Villar, V., et al. 2008, ApJ, 675, 234
- Pettini & Pagel (2004) Pettini, M., & Pagel, B. E. J. 2004, MNRAS, 348, L59
- Pierre et al. (2004) Pierre, M., Valtchanov, I., Altieri, B., et al. 2004, J. Cosmology Astropart. Phys, 9, 011
- Pineda et al. (2013) Pineda, J. L., Langer, W. D., Velusamy, T., & Goldsmith, P. F. 2013, A&A, 554, A103
- Pound & Wolfire (2008) Pound, M. W., & Wolfire, M. G. 2008, in Astronomical Society of the Pacific Conference Series, Vol. 394, Astronomical Data Analysis Software and Systems XVII, ed. R. W. Argyle, P. S. Bunclark, & J. R. Lewis, 654
- Rangwala et al. (2011) Rangwala, N., Maloney, P. R., Glenn, J., et al. 2011, ApJ, 743, 94
- Rhoads et al. (2014) Rhoads, J. E., Malhotra, S., Allam, S., et al. 2014, ApJ, 787, 8
- Riechers (2011) Riechers, D. A. 2011, ApJ, 730, 108
- Riechers et al. (2011a) Riechers, D. A., Hodge, J., Walter, F., Carilli, C. L., & Bertoldi, F. 2011a, ApJ, 739, L31
- Riechers et al. (2010) Riechers, D. A., Capak, P. L., Carilli, C. L., et al. 2010, ApJ, 720, L131
- Riechers et al. (2011b) Riechers, D. A., Carilli, C. L., Maddalena, R. J., et al. 2011b, ApJ, 739, L32
- Riechers et al. (2011c) Riechers, D. A., Cooray, A., Omont, A., et al. 2011c, ApJ, 733, L12
- Riechers et al. (2013) Riechers, D. A., Bradford, C. M., Clements, D. L., et al. 2013, Nature, 496, 329
- Riechers et al. (2014a) Riechers, D. A., Carilli, C. L., Capak, P. L., et al. 2014a, ApJ, 796, 84
- Riechers et al. (2014b) Riechers, D. A., Pope, A., Daddi, E., et al. 2014b, ApJ, 786, 31
- Riechers et al. (2017) Riechers, D. A., Leung, T. K. D., Ivison, R. J., et al. 2017, ArXiv e-prints, arXiv:1705.09660
- Robertson et al. (2006) Robertson, B., Bullock, J. S., Cox, T. J., et al. 2006, ApJ, 645, 986
- Robertson et al. (2004) Robertson, B., Yoshida, N., Springel, V., & Hernquist, L. 2004, ApJ, 606, 32
- Robertson & Bullock (2008) Robertson, B. E., & Bullock, J. S. 2008, ApJ, 685, L27
- Rodighiero et al. (2011) Rodighiero, G., Daddi, E., Baronchelli, I., et al. 2011, ApJ, 739, L40
- Röllig et al. (2007) Röllig, M., Abel, N. P., Bell, T., et al. 2007, A&A, 467, 187
- Rujopakarn et al. (2011) Rujopakarn, W., Rieke, G. H., Eisenstein, D. J., & Juneau, S. 2011, ApJ, 726, 93
- Rujopakarn et al. (2013) Rujopakarn, W., Rieke, G. H., Weiner, B. J., et al. 2013, ApJ, 767, 73
- Ruszkowski & Springel (2009) Ruszkowski, M., & Springel, V. 2009, ApJ, 696, 1094
- Saintonge et al. (2011) Saintonge, A., Kauffmann, G., Kramer, C., et al. 2011, MNRAS, 415, 32
- Sakamoto et al. (2008) Sakamoto, K., Wang, J., Wiedner, M. C., et al. 2008, ApJ, 684, 957
- Sargent et al. (2014) Sargent, M. T., Daddi, E., Béthermin, M., et al. 2014, ApJ, 793, 19
- Savage & Oliver (2007) Savage, R. S., & Oliver, S. 2007, ApJ, 661, 1339
- Scannapieco et al. (2008) Scannapieco, C., Tissera, P. B., White, S. D. M., & Springel, V. 2008, MNRAS, 389, 1137
- Schmidt (1959) Schmidt, M. 1959, ApJ, 129, 243
- Schoenmakers et al. (1997) Schoenmakers, R. H. M., Franx, M., & de Zeeuw, P. T. 1997, MNRAS, 292, 349
- Schreiber et al. (2017) Schreiber, C., Pannella, M., Leiton, R., et al. 2017, A&A, 599, A134
- Schreiber et al. (2015) Schreiber, C., Pannella, M., Elbaz, D., et al. 2015, A&A, 575, A74
- Scoville et al. (2017) Scoville, N., Murchikova, L., Walter, F., et al. 2017, ApJ, 836, 66
- Shapiro et al. (2008) Shapiro, K. L., Genzel, R., Förster Schreiber, N. M., et al. 2008, ApJ, 682, 231
- Sharon et al. (2013) Sharon, C. E., Baker, A. J., Harris, A. I., & Thomson, A. P. 2013, ApJ, 765, 6
- Sharon et al. (2016) Sharon, C. E., Riechers, D. A., Hodge, J., et al. 2016, ApJ, 827, 18
- Smith & Hayward (2015) Smith, D. J. B., & Hayward, C. C. 2015, MNRAS, 453, 1597
- Smith et al. (2017) Smith, J. D. T., Croxall, K., Draine, B., et al. 2017, ApJ, 834, 5
- Sofue (2017) Sofue, Y. 2017, PASJ, 69, R1
- Sofue & Rubin (2001) Sofue, Y., & Rubin, V. 2001, ARA&A, 39, 137
- Solomon et al. (1997) Solomon, P. M., Downes, D., Radford, S. J. E., & Barrett, J. W. 1997, ApJ, 478, 144
- Solomon & Vanden Bout (2005) Solomon, P. M., & Vanden Bout, P. A. 2005, ARA&A, 43, 677
- Sommer-Larsen & Dolgov (2001) Sommer-Larsen, J., & Dolgov, A. 2001, ApJ, 551, 608
- Speagle et al. (2014) Speagle, J. S., Steinhardt, C. L., Capak, P. L., & Silverman, J. D. 2014, ApJS, 214, 15
- Springel & Hernquist (2005) Springel, V., & Hernquist, L. 2005, ApJ, 622, L9
- Stacey et al. (2010) Stacey, G. J., Hailey-Dunsheath, S., Ferkinhoff, C., et al. 2010, ApJ, 724, 957
- Steidel et al. (1996) Steidel, C. C., Giavalisco, M., Pettini, M., Dickinson, M., & Adelberger, K. L. 1996, ApJ, 462, L17
- Steidel et al. (2004) Steidel, C. C., Shapley, A. E., Pettini, M., et al. 2004, ApJ, 604, 534
- Steidel et al. (2014) Steidel, C. C., Rudie, G. C., Strom, A. L., et al. 2014, ApJ, 795, 165
- Steinmetz & Navarro (1999) Steinmetz, M., & Navarro, J. F. 1999, ApJ, 513, 555
- Stern et al. (2005) Stern, D., Eisenhardt, P., Gorjian, V., et al. 2005, ApJ, 631, 163
- Stevens et al. (2005) Stevens, J. A., Amure, M., & Gear, W. K. 2005, MNRAS, 357, 361
- Swaters et al. (2009) Swaters, R. A., Sancisi, R., van Albada, T. S., & van der Hulst, J. M. 2009, A&A, 493, 871
- Swinbank et al. (2011) Swinbank, A. M., Papadopoulos, P. P., Cox, P., et al. 2011, ApJ, 742, 11
- Tacconi et al. (2006) Tacconi, L. J., Neri, R., Chapman, S. C., et al. 2006, ApJ, 640, 228
- Tacconi et al. (2008) Tacconi, L. J., Genzel, R., Smail, I., et al. 2008, ApJ, 680, 246
- Tacconi et al. (2010) Tacconi, L. J., Genzel, R., Neri, R., et al. 2010, Nature, 463, 781
- Tacconi et al. (2013) Tacconi, L. J., Neri, R., Genzel, R., et al. 2013, ApJ, 768, 74
- Tielens & Hollenbach (1985) Tielens, A. G. G. M., & Hollenbach, D. 1985, ApJ, 291, 722
- Tiley et al. (2018) Tiley, A. L., Swinbank, A. M., Harrison, C. M., et al. 2018, arXiv e-prints, arXiv:1811.05982
- Tully & Fisher (1977) Tully, R. B., & Fisher, J. R. 1977, A&A, 54, 661
- Ueda et al. (2014) Ueda, J., Iono, D., Yun, M. S., et al. 2014, ApJS, 214, 1
- van Eymeren et al. (2009) van Eymeren, J., Trachternach, C., Koribalski, B. S., & Dettmar, R.-J. 2009, A&A, 505, 1
- Vitvitska et al. (2002) Vitvitska, M., Klypin, A. A., Kravtsov, A. V., et al. 2002, ApJ, 581, 799
- Vollmer et al. (2016) Vollmer, B., Nehlig, F., & Ibata, R. 2016, A&A, 586, A98
- Walter et al. (2012) Walter, F., Decarli, R., Carilli, C., et al. 2012, Nature, 486, 233
- Wang et al. (2013) Wang, R., Wagg, J., Carilli, C. L., et al. 2013, ApJ, 773, 44
- Wardlow et al. (2013) Wardlow, J. L., Cooray, A., De Bernardis, F., et al. 2013, ApJ, 762, 59
- Wardlow et al. (2017) Wardlow, J. L., Cooray, A., Osage, W., et al. 2017, ApJ, 837, 12
- Wilson et al. (2008) Wilson, C. D., Petitpas, G. R., Iono, D., et al. 2008, ApJS, 178, 189
- Wilson et al. (2009) Wilson, C. D., Warren, B. E., Israel, F. P., et al. 2009, ApJ, 693, 1736
- Wolfire et al. (2010) Wolfire, M. G., Hollenbach, D., & McKee, C. F. 2010, ApJ, 716, 1191
- Wolfire et al. (1990) Wolfire, M. G., Tielens, A. G. G. M., & Hollenbach, D. 1990, ApJ, 358, 116
- Young et al. (2014) Young, L. M., Scott, N., Serra, P., et al. 2014, MNRAS, 444, 3408
- Younger et al. (2010) Younger, J. D., Fazio, G. G., Ashby, M. L. N., et al. 2010, MNRAS, 407, 1268
- Zavala et al. (2008) Zavala, J., Okamoto, T., & Frenk, C. S. 2008, MNRAS, 387, 364
- Zhang et al. (2018a) Zhang, Z.-Y., Romano, D., Ivison, R. J., Papadopoulos, P. P., & Matteucci, F. 2018a, Nature, 558, 260
- Zhang et al. (2018b) Zhang, Z.-Y., Ivison, R. J., George, R. D., et al. 2018b, MNRAS, 481, 59
Appendix A CO and [CII] Channel Maps
Since we are investigating the gas kinematics, it is essential to show and acknowledge the limited significance of the detected signal per velocity bin. We show the channel maps for the CO ( = 1 0) and [CII] lines in Figures 16 and 17. In the [CII] maps, structures on the scale of the angular resolution ( kpc) are seen, but at low S/N significance. We therefore do not discuss the properties of potential star-forming “clumps”/structures in this paper. Exploring such direction with higher resolution and better sensitivity data would be useful to better understand the physics behind the high SFR of HXMM05.
As noted in §4.2.1, a drop off is seen in the rotation velocity beyond a radius of = 6 kpc (in Figure 11). This is most likely a result of the limited S/N in the reddest velocity channels, as illustrated in Figure 16.
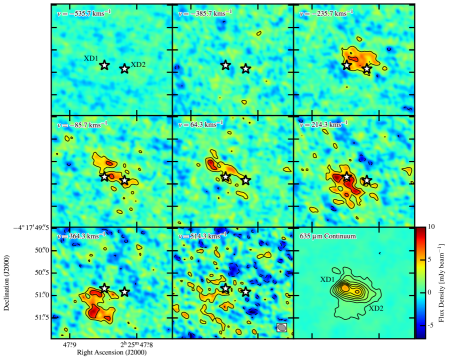
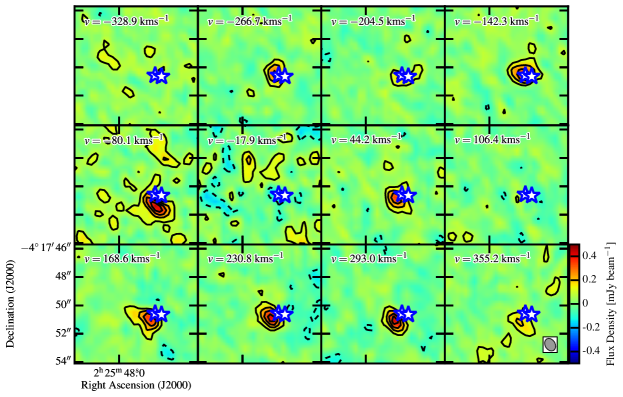
Appendix B Non-detection of X-Main at UV/optical Wavebands
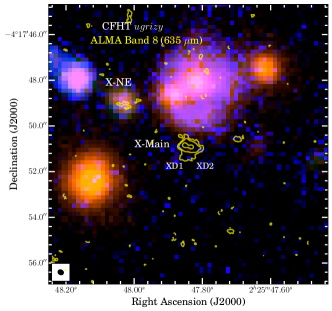
As shown in the RGB image created from Spitzer/IRAC 4.5 (blue), 5.8 (green), and 8 (red) data (Figure 8), emission detected at 4.5 is dominated by foreground sources (see also Figure 19), but emission at 5.8 and 8 is dominated by HXMM05. We therefore model the surface brightness profiles of the sources near HXMM05 based on their morphologies seen in the CFHT and VISTA images in order to de-blend the emission observed at 3.6 and 4.5 (see Appendix §C).
On the other hand, X-NE is detected in the UV, optical, and NIR wavebands (as shown in Figures 8 and 18). As discussed in §3, this component is also detected in CO ( = 1 0) and [CII] line emission (see Figures 3 and 4). With the available data, we cannot discriminate and obtain reliable constraints on the stellar masses and SFRs for X-NE and X-Main separately. We thus infer the properties of the system as a whole in §5 and subsequent sections. That said, optically-selected high- sources (e.g, BzKs, LBGs) appear to be different populations from these highly dusty starburst galaxies (possibly due to different evolutionary stages), and surveys done at only one wavelength are likely to miss other high-z candidates in the field. Given that X-NE is optically visible, and thus may have less dust than X-Main, it may be a young nearby galaxy soon to be engulfed by X-Main. We report the pair’s gas mass ratios in Table 7. More observations will be useful to better understand the physical properties of X-NE, and thus, its nature in relation to X-Main in the HXMM05 system.
Appendix C De-blending Spitzer/IRAC Emission
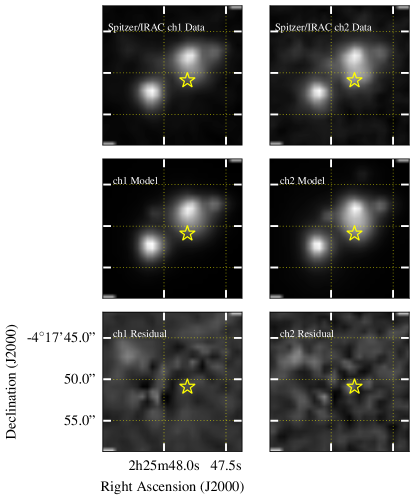
Multiple sources are detected near HXMM05 at 3.6 and 4.5 (channels 1 and 2; Figures 18 and 19). We examine whether part of the emission detected at 3.6 and 4.5 may arise from HXMM05 by using the publicly available software galfit (Peng et al., 2002) to de-blend the emission. We initialize the fitting parameters based on the positions, brightnesses, and morphologies of the sources near HXMM05 as observed in the higher resolution NIR images (HST/WFC3 F110W, VISTA, and CFHT; see e.g., Figure 18). We use a total of six components and a sky background to account for all the emission detected in the high resolution NIR images. We model the surface brightness distributions of the two brightest components using Sersic profiles, each with seven free parameters: , , , , , , and PA, where and describe the position of the component, is the integrated flux, is the effective radius, is the Sersic index, is the axial ratio, and PA is the position angle. We model the remaining four components as point sources, for which we adopt the point response functions (PRF), described by three free parameters , , and per source. We allow all parameters to vary without imposing any priors in order to avoid biasing the best-fit parameters. The PRFs are adopted from the IRAC calibration routines262626http://irsa.ipac.caltech.edu/data/SPITZER/docs/irac/calibrationfiles/psfprf/. We do not detect any statistically significant emission at the position of HXMM05 in the residual maps (Figure 19). We thus adopt the SWIRE survey depths at the two IRAC wavebands as 3 upper limits (Table 2.6).