Inequality in Death from Social Conflicts: A Gini & Kolkata indices-based Study
Abstract
Human deaths caused by individual man-made conflicts (e.g., wars, armed-conflicts, terrorist-attacks etc.) occur unequally across the events (conflicts) and such inequality (in deaths) have been studied here using Lorenz curve and values of the inequality indices Gini () and Kolkata () have been estimated from it. The data are taken from various well-known databases maintained by some Universities and Peace Research Institutes. The inequality measures for man-made conflicts are found to have very high values ( = 0.02, = 0.02), which is rarely seen in economic (income or wealth) inequality measures across the world (, ; presumably because of various welfare measures). We also investigated the inequalities in human deaths from natural disasters (like earthquakes, floods, etc.). Interestingly, we observe that the social inequality measures ( and values) from man-made conflicts compare well with those of academic centers (inequality in citations; found in earlier studies) of different institutions of the world, while those for natural disasters can be even higher. We discuss about the ‘similarity classes’ of social inequality (similar higher values of and indices) for man-made competitive societies like academic institutions and man-made social conflicts, and connect our observations with that of the growing recent trend of economic inequality across the world (with rapid disappearance of welfare strategies).
I Introduction
While studying social systems, we come across various stabilized inequalities, as results of inherent social dynamics. Sociophysics Sen and Chakrabarti ((2014); Castellano et al. ((2009); Galam ((2012) attempts to study such inequalities and capture them in various models of social dynamics. Though not inevitable, death to mortal life in natural or man-made disasters seems to be a significant possibility in our life. Since ancient times, both of man-made conflicts as well as natural disasters have played their role in shaping the structure of human society. Sometimes of course the distinction between man-made disasters and natural disasters are not very clear: Malthus suggested Malthus ((1888) that (in absence of any birth control) the population grows with time in geometric progression (exponentially), while food-grain supply (cultivable land, the basic ingredient for food-grain production) grows in algebraic progression (linear in time), suggesting that famines or wars will occur almost periodically. This and similar arguments suggest that even the events like wars, armed-conflicts or in some cases the famines, may be natural and not directly man-made. We will, however, not consider such arguments and distinguish them using commonly used criteria (as given in various datasets studied here).
We study here the inequality measures (from the corresponding human death distributions) for all kinds of social conflicts (wars, violent crimes, etc.) and also the same for natural disasters (earthquakes, floods, etc.). The detailed nature of the death count distributions (fat tails in particular) in such conflicts and disasters have already been studied earlier Chatterjee and Chakrabarti ((2017). We utilized the data publicly available from various established data-sources maintained by various universities and Peace Research centers. We find, the extent of inequality (using the specific measures defined later) is much higher in social conflicts when compared with those observed for the economic inequalities (for income, wealth) in earlier decades. We find that the ‘similarity classes’ of social inequality (similar values of and indices, defined in the next section) for man-made competitive societies like academic institutions and for social conflicts are the same. We connect our observations about extreme inequalities in various social institutions and in social conflicts with that of the growing recent trend of economic inequality across the world (with rapid disappearance of welfare strategies).
II Inequality indices
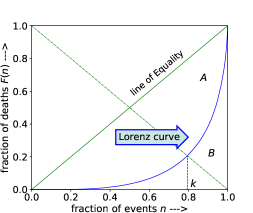
Generally for measuring (income or wealth) inequality, Gini index () Gini ((1921) is used by the economists who constructs first the Lorenz curve (see Fig. 1), which gives the cumulative fraction of the wealth against the fraction of population (possessing that wealth), when they are arranged in increasing order of income or wealth. The equality line corresponds to the case when the people have equal income or wealth each. We have used the equivalent Lorenz curve (see, Fig. 1), where cumulative number of deaths (instead of wealth) are plotted against the fraction of events/conflicts (instead of population), when arranged in increasing order of size of the events or conflicts. The area between the equality line and Lorenz curve (when normalised) gives the Gini index (). We will also consider the Kolkata index Ghosh et al. ((2014); Chatterjee et al. ((2015, (2017) here, which is given by the value of the -coordinate of the crossing point of the diagonal perpendicular to the equality line and the Lorenz curve (see Fig. 1). It may be noted that takes values within the range 0 (representing complete equality) and 1 (representing complete inequality), while the corresponding values range from 0.5 to 1, and the values of ranges from 0 to 1. In view of the fact that () fraction of people, papers or wars do posses, capture or cause exactly fraction of wealth, citations or deaths respectively, we give the index values in various cases considered here. Also, index corresponds to a non-trivial fixed point of the complementary (non-linear) Lorenz function (see Fig. 1): . It may be mentioned in this context that in Sreenivasan ((2010), a decomposition of in terms of a quantity equal in magnitude of was attempted. There are several other social inequality measuring indices Eliazar and Sokolov ((2010); Eliazar and Cohen ((2012, (2014); Eliazar ((2015, (2016), based on the Lorenz curve properties, which we will not consider here.
III DATASET DESCRIPTION
We have studied here the statistics of human death in various man-made events or conflicts and natural disasters like earthquake etc. using the extensive and publicly available death count datasets from various universities and public research organisations for a long period of collections. Few data are found missing, and obviously get ignored in this study. The details of the used datasets are given below in Table I:
| Disaster type | Data source | Data coverage | Time period | Dataset length | human death count | |||
| Min. | Max. | Avg. | Total | |||||
| war CoW data (v.4.0) Sarkees and Weyman ((2016) | worldwide | 1816-2007 | 538 | 0 | 1250000 | 28553 | 15361249 | |
| battle UCDP data (v.18.1) encyclopedia Data Program version 18.1 ((2014) | worldwide | 1989-2017 | 4695 | 25 | 500000 | 783 | 3674068 | |
| man-made | armed-conflict PRIO data(v.3.1) Lacina ((2009) | worldwide | 1946-2008 | 1186 | 13 | 497500 | 7175 | 8510077 |
| murder (violent-crime) NCRB data Bureau | India | 1967-2016 | 1583 | 0 | 10776 | 902 | 1427276 | |
| terrorism GTD data Database ((2018) | worldwide | 1970-2017 | 172109 | 0 | 1570 | 2-3 | 414537 | |
| earthquake NCEI-NOAA data Database (a) | worldwide | 1000-2018(July) | 1321 | 1 | 830000 | 3312 | 4375172 | |
| natural | flood EMDAT dataDatabase (b) | worldwide | 1900-2018(July) | 3540 | 1 | 3700000 | 1965 | 6957472 |
| tsunami NCEI-NOAA data Database (c) | worldwide | 1000-2018(July) | 372 | 1 | 167540 | 1038 | 386275 | |
IV ANALYSIS AND ESTIMATES OF , VALUES
IV.1 For man-made conflicts
We used the human death data in various kinds of social conflicts, as recorded in various datasets e.g., CoWSarkees and Weyman ((2016), UCDPencyclopedia Data Program version 18.1 ((2014), PRIOLacina ((2009), NCRBBureau and GTDDatabase ((2018). The estimated Lorenz curves (shown in Figs. 2a, 2b, 2c) give the values of the Gini () and Kolkata () indices. These indices have quite high values (see Table II).
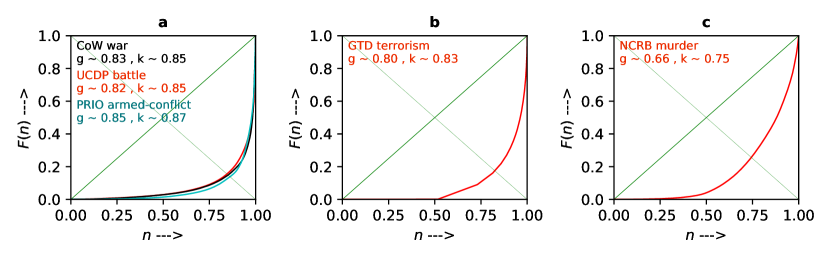
| Type of conflicts | -index | -index |
| war | 0.02 | 0.02 |
| battle | 0.02 | 0.02 |
| armed-conflict | 0.02 | 0.02 |
| terrorism | 0.03 | 0.02 |
| murder | 0.02 | 0.02 |
IV.2 For natural disasters
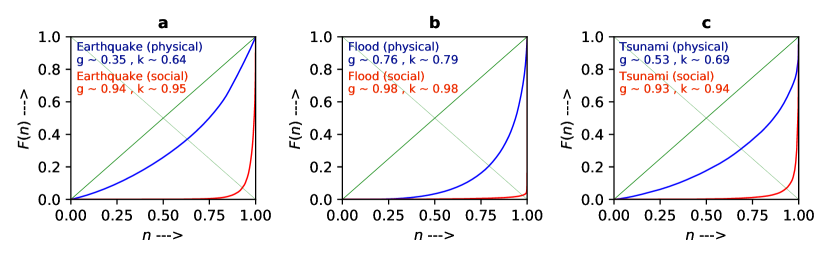
Analyzing the data for human death distribution in various natural disasters, as obtained from the datasets mentioned in Table I, we find the Lorenz curves (see, Fig. 3) to be even more steeply curved and the corresponding values are even higher (see, Table III).
| Type of disasters | -index | -index |
| earthquake | 0.02 | 0.02 |
| flood | 0.02 | 0.02 |
| tsunami | 0.02 | 0.02 |
| Data source | Data coverage | Time period | Dataset length | Damage measures | Measured in | -index value | -index value | |||
| Min. | Max. | Avg. | Total | |||||||
| earthquake USGS data Program | worldwide | 2013-2018(July) | 519959 | 0.5 | 8.3 | 1.96 | 1022601 | Richter magnitude | 0.35 | 0.64 |
| flood EMDAT dataDatabase (b) | worldwide | 1900-2018(July) | 1719 | 0 | 2857000 | 87868.28 | 151045575 | areas affected (sq-km) | 0.76 | 0.79 |
| tsunami NCEI-NOAA data Database (c) | worldwide | 1000-2018(July) | 374 | 1 | 524.26 | 10.16 | 3803 | maximum water height (m) | 0.53 | 0.69 |
However, when the damages are measured in physical quantities (in Richter magnitude for earthquakes, areas affected in floods and water level heights in case of tsunamis) both of the Gini and Kolkata indices assume much lower values (see Fig. 3 and Table IV).
V Discussion & Summary
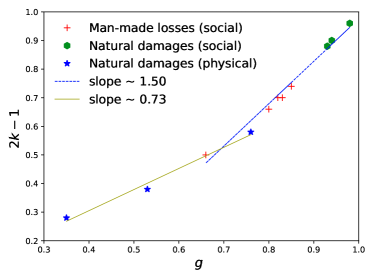
Assuming the Lorenz curve to be given by for a positive real number , passing through (0,0) and (1,1) points, we get = and self-consistent equation (in Fig. 1, and ). This gives and for the equality line () and for extreme inequality (). In the social conflict cases studied here, such high values of inequality-index values suggest , giving and (when both and are high and close enough in magnitude, as observed). Indeed, even for the so called Pareto 80/20 law (80% wealth possessed by 20% of the population Lipovetsky ((2009)) suggesting , one gets (, giving ) and hence = , which also compares well with our earlier observation Ghosh et al. ((2014) for citation distribution in academic institutions ( and ). As mentioned before, such high values of and are not usually seen for income or wealth distributions in societies (economic inequalities; see e.g., Ghosh et al. ((2014)) though, of late, these values are rapidly increasing Piketty ((2013). Human death inequality index values for natural disasters () are even higher. Of course we found that when the social counts (of deaths) are replaced by physical quantities measuring damages in natural disasters (e.g., Richter magnitude in case of earthquakes, amount of areas affected in case of floods or maximum water level heights in case of tsunamis etc.) the inequality index values ( and ; see Table IV) become somewhat lower. Fig. 4 shows the variations of the quantity and for all the cases analysed use (see Table II-IV). Both and have identical ranges [0,1]. These seems to be two distinct slopes of the vs curves: about 0.73 (for lower range) and about 1.50 (for higher range). It may be mentioned that the mapping of Lorenz curve as the quadrant of an unit circle, gives Chatterjee et al. ((2017) , which compares well with the observed initial slope value in Fig. 4. It may be interesting to note that a recent data analysis study on the relationship between Gini index () and Kolkata index () has been reported Il’inskii and Mierzwa ((2019) in the context of economic inequality in the bitcoin market.
In summary, we find deaths from social conflicts are quite inequally distributed. From Table II, we find death inequality measures ( and ) for man-made social conflicts, while from Table III those for natural disasters are and . As already mentioned earlier, the citations of the papers produced by various universities or institutes of the world, can be viewed as the wealth created by the respective institutions and these wealths are also found to be quite unequally distributed across the contributions or papers. Our earlier study in Ghosh et al. ((2014) (see Table V in the Appendix) suggested high level of inequality across the institutions: , . As the institutions encourage competitiveness (and do not always take care for those who may fall behind or become unsuccessful), the social inequality is very high. Such high values of inequality indices had however not been seen in socio-economic systems earlier (, Ghosh et al. ((2014)). These may be due the various welfare measures usually taken by various governments. Also, some entropic considerations suggest Venkatasubramanian ((2017) that some amount of inequality may not be unfair in capitalistic societies. Recently the economic inequality has started growing rapidly (since 1950’s; see e.g., Piketty ((2013)of Family Income Gini Index ) and index values for both and are increasing. This may be because of the fast disappearance of social welfare measures across the world. Our study here indicates a ‘natural’ tendency towards extreme inequality () in our societies, unless some appropriate welfare measures are taken.
Acknowledgement: We are thankful to Arnab Chatterjee, Asim Ghosh, Manipushpak Mitra, Sudip Mukherjee for many useful inputs and discussions. AS acknowledges kind hospitality at Saha Institute of Nuclear Physics, Kolkata and BKC acknowledges JC Bose Fellowship (DST) for support.
References
- Sen and Chakrabarti ((2014) P Sen and B K Chakrabarti, Sociophysics: An Introduction, Oxford University Press, (2014).
- Castellano et al. ((2009) C Castellano, S Fortunato, and V Loreto, Statistical physics of social dynamics, Reviews of modern physics, 81:591, (2009).
- Galam ((2012) S Galam, Sociophysics: a physicist’s modeling of psycho-political phenomena, Springer Science & Business Media, (2012).
- Malthus ((1888) T R Malthus, An essay on the principle of population: or, A view of its past and present effects on human happiness, Reeves & Turner, (1888).
- Chatterjee and Chakrabarti ((2017) A Chatterjee and B K Chakrabarti, Fat tailed distributions for deaths in conflicts and disasters, Reports in Advances of Physical Sciences, 1:1740007, (2017).
- Gini ((1921) C Gini, Measurement of inequality of incomes, The Economic Journal, 31(121):124–126, (1921).
- Ghosh et al. ((2014) A Ghosh, N Chattopadhyay, and B K Chakrabarti, Inequality in societies, academic institutions and science journals: Gini and k-indices, Physica A: Statistical Mechanics and its Applications, 410:30–34, (2014).
- Chatterjee et al. ((2015) A Chatterjee, A Ghosh, J-i Inoue, and B K Chakrabarti, Social inequality: from data to statistical physics modeling, In Journal of Physics: Conference Series, volume 638, page 012014. IOP Publishing, (2015).
- Chatterjee et al. ((2017) A Chatterjee, A Ghosh, and B K Chakrabarti, Socio-economic inequality: Relationship between gini and kolkata indices. Physica A, 466:583, (2017).
- Sreenivasan ((2010) S Sreenivasan, Tricks with the lorenz curve, Economics Bulletin, 30(2):1594, (2010).
- Eliazar and Sokolov ((2010) I I Eliazar and I M Sokolov, Measuring statistical heterogeneity: The pietra index, Physica A, 389:117, (2010).
- Eliazar and Cohen ((2012) I Eliazar and M H Cohen, Power-law connections: From zipf to heaps and beyond, Annals of Physics, 332:56, (2012).
- Eliazar and Cohen ((2014) I Eliazar and M H Cohen, On social inequality: Analyzing the rich–poor disparity, Physica A, 401:148, (2014).
- Eliazar ((2015) I Eliazar, The sociogeometry of inequality: Part i, Physica A: Statistical Mechanics and its Applications, 426:93, (2015).
- Eliazar ((2016) I Eliazar, Harnessing inequality, Physics Reports, 649:1, (2016).
- Sarkees and Weyman ((2016) M Sarkees and F Weyman, CoW data, 1816-2007 version 4.0. correlates of war, uc davis, http://www.correlatesofwar.org/data-sets/COW-war, (2016).
- encyclopedia Data Program version 18.1 ((2014) Uppsala Conflict encyclopedia Data Program version 18.1, Yearly datasets covering 1989 - 2017, http://ucdp.uu.se/downloads/, (2014).
- Lacina ((2009) B Lacina, Battle deaths dataset 1946–2008: Codebook for version 3.0, https://www.prio.org/Data/Armed-Conflict/Battle-Deaths/The-Battle-Deaths-Dataset-version-30/, (2009).
- (19) National Crime Records Bureau, Ministry of home affairs, india (retrieved for 1967-2016), http://ncrb.gov.in/StatPublications/CII/PrevPublications.htm.
- Database ((2018) Global Terrorism Database, National consortium for the study of terrorism and responses to terrorism (start), https://www.start.umd.edu/gtd, (2018).
- Database (a) NOAA National Centers For Environmental Information Natural Hazards Database, retrived for 1000-2018(july), https://ngdc.noaa.gov/nndc/struts/form?t=101650&s=1&d=1, a.
- Database (b) EM-DAT The International Disaster Database, (retrived for 1900-2018(july)), https://www.emdat.be/emdat_db/, b.
- Database (c) NOAA National Centers For Environmental Information Natural Hazards Database, retrived for 1000-2018(july), https://ngdc.noaa.gov/nndc/struts/form?t=101650&s=167&d=166, c.
- (24) The USGS Earthquake Hazards Program, (retrived for 2013-2018(july)), https://earthquake.usgs.gov/earthquakes/search/.
- Lipovetsky ((2009) S Lipovetsky, Pareto 80/20 law: derivation via random partitioning, International Journal of Mathematical Education in Science and Technology, 40(2):271–277, (2009).
- Piketty ((2013) T Piketty, Capital in the Twenty-First Century, Harvard University Press, (2013).
- Il’inskii and Mierzwa ((2019) A I Il’inskii and Z Mierzwa, Wealth distribution in the bitcoin ecosystem, Finance: Theory and Practice, 23(2):6, (2019).
- Venkatasubramanian ((2017) V Venkatasubramanian, How Much Inequality Is Fair?: Mathematical Principles of a Moral, Optimal, and Stable Capitalist Society, Columbia University Press, (2017).
- (29) Distribution of Family Income Gini Index, The World Fact Book, Central Intelligence Agency US, https://www.cia.gov/library/publications/the-world-factbook/rankorder/2172rank.html.
APPENDIX
| Inst./Univ. | Year | Index values for | Inst./Univ. | Year | Index values for | ||
| Gini () | Kolkata () | Gini () | Kolkata () | ||||
| Cambridge | 1980 | 0.74 | 0.78 | BHU | 1980 | 0.68 | 0.76 |
| 1990 | 0.74 | 0.78 | 1990 | 0.71 | 0.77 | ||
| 2000 | 0.71 | 0.77 | 2000 | 0.64 | 0.74 | ||
| 2010 | 0.70 | 0.76 | 2010 | 0.63 | 0.73 | ||
| Harvard | 1980 | 0.73 | 0.78 | Calcutta | 1980 | 0.74 | 0.78 |
| 1990 | 0.73 | 0.78 | 1990 | 0.64 | 0.74 | ||
| 2000 | 0.71 | 0.77 | 2000 | 0.68 | 0.74 | ||
| 2010 | 0.69 | 0.76 | 2010 | 0.61 | 0.73 | ||
| MIT | 1980 | 0.76 | 0.79 | Delhi | 1980 | 0.67 | 0.75 |
| 1990 | 0.73 | 0.78 | 1990 | 0.68 | 0.76 | ||
| 2000 | 0.74 | 0.78 | 2000 | 0.68 | 0.76 | ||
| 2010 | 0.69 | 0.76 | 2010 | 0.66 | 0.74 | ||
| Oxford | 1980 | 0.70 | 0.77 | IISC | 1980 | 0.73 | 0.78 |
| 1990 | 0.73 | 0.78 | 1990 | 0.70 | 0.76 | ||
| 2000 | 0.72 | 0.77 | 2000 | 0.67 | 0.75 | ||
| 2010 | 0.71 | 0.76 | 2010 | 0.62 | 0.73 | ||
| Stanford | 1980 | 0.74 | 0.78 | Madras | 1980 | 0.69 | 0.76 |
| 1990 | 0.70 | 0.76 | 1990 | 0.68 | 0.76 | ||
| 2000 | 0.73 | 0.80 | 2000 | 0.64 | 0.73 | ||
| 2010 | 0.70 | 0.76 | 2010 | 0.78 | 0.79 | ||
| Stockholm | 1980 | 0.70 | 0.76 | SINP | 1980 | 0.72 | 0.74 |
| 1990 | 0.66 | 0.75 | 1990 | 0.66 | 0.73 | ||
| 2000 | 0.69 | 0.76 | 2000 | 0.77 | 0.79 | ||
| 2010 | 0.70 | 0.76 | 2010 | 0.71 | 0.76 | ||
| Tokyo | 1980 | 0.69 | 0.76 | TIFR | 1980 | 0.70 | 0.76 |
| 1990 | 0.68 | 0.76 | 1990 | 0.73 | 0.77 | ||
| 2000 | 0.70 | 0.76 | 2000 | 0.74 | 0.77 | ||
| 2010 | 0.70 | 0.76 | 2010 | 0.78 | 0.79 | ||