A universal 21 cm signature of growing massive black holes in the early Universe
Abstract
There is a hope that looking into the early Universe with next-generation telescopes, one will be able to observe the early accretion growth of supermassive black holes (BHs) when their masses were –. According to the standard accretion theory, the bulk of the gravitational potential energy released by radiatively efficient accretion of matter onto a BH in this mass range is expected to be emitted in the extreme UV–ultrasoft X-ray bands. We demonstrate that such a ’miniquasar’ at should leave a specific, localized imprint on the 21 cm cosmological signal. Namely, its position on the sky will be surrounded by a region with a fairly sharp boundary of several arcmin radius, within which the 21 cm brightness temperature quickly grows inwards from the background value of mK to mK. The size of this region is only weakly sensitive to the BH mass, so that the flux density of the excess 21 cm signal is expected to be –0.2 mJy at and should be detectable by the Square Kilometer Array. We argue that an optimal strategy would be to search for such signals from high- miniquasar candidates that can be found and localized with a next-generation X-ray mission such as Lynx. A detection of the predicted 21 cm signal would provide a measurement of the growing BH’s redshift to within .
keywords:
stars: black holes – accretion, accretion discs – galaxies: high-redshift – dark ages, reionization, first stars – quasars: supermassive black holes1 Introduction
The discovery of powerful quasars at (Bañados et al., 2018) implies that fully fledged supermassive black holes (BHs) as heavy as already existed when the Universe was just 700 million years old. If a significant fraction of this mass has been accumulated by accretion at a nearly critical rate, then the growth of such objects must have started very early on (at ) from seeds that already had masses or more. What kind of object these seeds were is one the most interesting open questions in astrophysics (see Volonteri 2010; Latif & Ferrara 2016; Woods et al. 2018 for reviews). There is a hope that looking into the –10 epochs with next-generation telescopes, one will be able to observe the early accretion growth of supermassive BHs when their masses were –. Hereafter, we will refer to such accretors as ’miniquasars’.
One of the most promising ways to find such miniquasars is in X-rays, since we know that both stellar-mass and supermassive black holes emit copious amounts of X-rays during accretion (X-ray binaries, XRBs, and active galactic nuclei, AGN, respectively). Unfortunately, even the sensitivity of the Chandra X-ray Observatory is not sufficient for detecting miniquasars at . The situation will change dramatically if a mission such as the proposed Lynx is implemented in the future. Lynx is planned to achieve a sensitivity as high as erg cm-2 s-1 (0.5–2 keV) in combination with Chandra-like (arcsecond) angular resolution and substantial sky coverage ( arcmin2) in its deep extragalactic surveys (The Lynx Team, 2018; Ben-Ami, Vikhlinin, & Loeb, 2018). This implies that X-ray sources with luminosities as low as a few erg s-1 (rest-frame 2–10 keV) will be detectable without confusion at . Assuming that hard X-ray emission carries a significant (%) fraction of the near-Eddington bolometric luminosity of a miniquasar, Lynx will be able to detect accreting BHs with masses as low as a few in the early Universe.
The bulk of the gravitational potential energy released during radiatively efficient accretion onto a BH emerges in the form of quasi-thermal radiation from the accretion disk (Shakura & Sunyaev, 1973), with the effective waveband shifting from the optical–UV for supermassive BHs to soft X-rays for stellar-mass BHs, as observed in AGN and XRBs (in so-called soft/high states for the latter, e.g. Gilfanov & Merloni 2014). For intermediate-mass BHs, the bulk of the disk’s emission is expected to fall into the far UV–ultrasoft X-ray band. Therefore, due to cosmological redshift, Lynx will not be able to detect this primary emission component, but, as already mentioned above, it should be able to observe additional, harder radiation that can arise due to Comptonization of thermal emission from the disk in its hot corona. In principle, the redshifted thermal emission from miniquasars could be observed directly in the optical–infrared band, but since the Eddington luminosity for a BH of mass at corresponds to an AB magnitude of more than 30, the detection of such miniquasars will be extremely challenging even with the next-generation IR observatories such as the James Web Space Telescope and Wide-field Infrared Survey Telescope (see Mason, Trenti, & Treu 2015 for the expected sensitivities of future surveys with these telescopes).
There is, however, another, indirect way to reveal the primary thermal radiation from the first miniquasars, which is to observe its impact on the ambient intergalactic medium (IGM) in the early Universe using the 21 cm spin-flip transition of neutral hydrogen. As has been actively discussed over the past two decades, the first generations of X-ray sources could significantly heat the primordial IGM prior to cosmic reionization and strongly modify the global 21 cm signal from the –10 epochs (see Pritchard & Loeb 2012 for a review). A lot of recent literature on this subject is devoted to discussing the potentially observable effect of the first generations of stellar-type X-ray sources and in particular high-mass X-ray binaries (HMXBs, e.g. Mirabel et al. 2011; Cohen et al. 2017; Madau & Fragos 2017; Sazonov & Khabibullin 2017a), which likely were present in significant numbers since the beginning of active star formation in the Universe (Fragos et al., 2013). The bulk of the emission produced by HMXBs is at energies above 0.5 keV and since such photons can travel large distances before being photoabsorbed in the IGM, the main effect of HMXBs is expected to be a global enhancement of the IGM temperature together with large-scale fluctuations reflecting the large-scale structure of the early Universe (e.g. Pritchard & Furlanetto 2007; Ross et al. 2017).
In contrast, miniquasars, which presumably have much softer energy spectra compared to HMXBs, should mainly heat the IGM in their relatively close vicinity. One may thus expect such sources to be surrounded by compact regions of specific 21 cm signal. Although finding such 21 cm features in a blind search might be difficult even for the most ambitious upcoming radio interferometers such as the Square Kilometer Array (SKA, Mellema et al. 2013), such a search could be greatly faciliated if carried out around miniquasar candidates found via their coronal X-ray emission with a mission like Lynx. We elaborate on this idea below. Before proceeding, we note that there have been plenty of studies addressing the impact of quasars and miniquasars on the IGM and the associated 21 cm signal (e.g. Madau et al. 2004; Ricotti & Ostriker 2004; Chuzhoy, Alvarez, & Shapiro 2006; Thomas & Zaroubi 2008; Yajima & Li 2014; Fialkov et al. 2017; Ghara et al. 2017; Bolgar et al. 2018; Vasiliev, Sethi, & Shchekinov 2018), but the novelty of our study is its focus on the miniquasar’s primary, thermal emission component and the synergy of 21 cm and X-ray observations.
The following values of cosmological parameters are used throughout the paper: , , , km s-1 Mpc-1 and (helium mass fraction) (Planck Collaboration et al., 2016).
2 Model
Suppose a BH has an initial mass at redshift and accretes matter until epoch , reaching a final mass . If the accretion proceeded at a critical (Eddington limited) rate , the BH mass would be increasing exponentially,
| (1) |
on the Salpeter time scale , where is the Eddington luminosity and is the radiation efficiency. Adopting for simplicity (as is approximately true for standard accretion disks), yr. Therefore, the average rate expressed in units of the critical rate (usually referred to as the Eddington ratio), at which the BH accretes mass between epochs and is
| (2) |
where is the cosmic time between and .
It is unlikely though that the BH will accrete matter at a constant rate over a cosmologically long period of time. In reality, accretion onto the BH will be determined by evolving external and internal (with respect to the host galaxy) conditions and is likely to be an intermittent process. Therefore, in our simulations, described below, we assumed that there are periods of active accretion when the Eddington ratio takes a fixed value and passive periods when . We further assume that these two types of intervals alternate in a random fashion111We took the duration of these intervals to be or yr, with the results being insensitive to this choice as long as ., so that the duty cycle of BH activity is
| (3) |
By definition, , and we also assume that , i.e. we do not consider supercritical accretion in this study.
2.1 Emission spectrum
One of the key aspects for this study is the spectrum of the radiation emitted by the accreting BH. According to the standard accretion theory (Shakura & Sunyaev, 1973), a geometrically thin, optically thick accretion disk around a BH is characterized by a temperature profile (except in the very narrow innermost region, where only a small fraction of the total luminosity is emitted) and generates multicolor, nearly blackbody radiation with a spectrum (specific luminosity as a function of energy)
| (4) |
where and are the disk’s inner and outer radii and is the Planck function.
The maximum temperature of the disk is
| (5) |
where is the growing BH mass expressed in solar masses. According to the standard theory, this temperature is achieved at , where is the radius of the innermost stable circular orbit, but a fairly good approximation is that the disk temperature reaches this value at and then decreases as at . For the purposes of this study it can also be safely assumed that . The spectrum given by equation (4) can then be approximated by the power law at and by the blackbody spectrum with a temperature of at (Makishima et al., 1986), with its maximum (when plotted in units of ) being at . The normalization constant in equation (4) is determined by the condition
| (6) |
The model described above is widely known as a multicolor disk blackbody model (diskbb in XSPEC, Arnaud 1996), and we have chosen it as our baseline spectral model. This choice is primarily motivated by the fact that the standard accretion disk theory provides a satisfactory description of the observed spectral energy distributions (SED) of (i) XRBs in their soft/high states (when ); namely, their dominant emission component is well described by diskbb with keV, as expected from equation (5) for the stellar masses () of the BHs in XRBs (see Done, Gierliński, & Kubota 2007 for a review) and (ii) AGN – supermassive BHs accreting at –1, for which the peak of the SED is observed in the optical-UV (the so-called big blue bump, e.g. Elvis et al. 1994; Telfer et al. 2002; Sazonov, Ostriker, & Sunyaev 2004), again as expected from equation (5) for the high (–) BH masses of AGN.
In reality, observations reveal significant deviations of XRB and AGN spectra from the simple multicolor disk blackbody model described above, and these deviations can be generally accounted for by the conditions at the inner boundary of the accretion disk, radiative transfer effects in the disk’s atmosphere and relativistic corrections (e.g. Koratkar & Blaes 1999; Merloni, Fabian, & Ross 2000; Davis et al. 2005; Done et al. 2012). However, in view of other, larger uncertainties related to the problem in hand (in particular in the BH mass and accretion rate), we do not take these subtleties into account.
Arguing further from analogy with XRBs and AGNs, it is likely that a miniquasar’s emission spectrum has an additional, harder component due to the Comptonization of part of the thermal radiation from the disk in its hot corona. We simulate this plausible situation by modifying our baseline diskbb model by the simpl (Steiner et al., 2009) model [specifically we use simpl(dikbb) in XSPEC], which provides a simplified description of Comptonization by converting a given fraction, , of soft thermal photons into high-energy ones. Another free parameter of this model is the photon index, , of the power-law component. We use and as fiducial values. The assumed spectral slope is close to those of observed hard X-ray tails in XRBs and AGN and is convenient in use since no -correction is then needed in converting luminosities to fluxes. The adopted value implies that the power-law component, if it continues up to keV, contains % (with a very weak dependence on the disk temperature, i.e. on and ) of the miniquasar’s bolometric luminosity, in overall agreement with observations of XRBs in their high state (e.g. Done, Gierliński, & Kubota 2007) and AGN (e.g. Sazonov, Ostriker, & Sunyaev 2004). Note that for the adopted values of the parameters, may be considered the slope of the high-energy part of the spectrum at , where is given by equation (5).
As already mentioned, our current treatment is resticted to the case of subcritical accretion (). In reality, in some miniquasars and/or at some stage of their evolution accretion may proceed at a supercritical rate. Consideration of such a case would require adopting a substantially different spectral model, as suggested by the measured spectra of individual ultraluminous X-ray sources in nearby galaxies (e.g. Sazonov, Lutovinov, & Krivonos 2014; Kaaret, Feng & Roberts 2017), the collective X-ray spectrum of such sources in the local Universe (Sazonov & Khabibullin, 2017b) and theoretical considerations (e.g. Narayan, Sa̧dowski & Soria 2017; Takeo et al. 2019).
2.2 Intragalactic absorption
Before reaching the ambient IGM, the extreme UV-soft X-ray radiation from the miniquasar may be partially photoabsorbed within its host galaxy. This may happen (i) in the vicinity of the BH if something like the AGN obscuring torus is present in miniquasars (in that case, absorption will take place within a certain solid angle only), and/or (ii) in the more distant regions of the galaxy. Given our scarce knowledge about the first galaxies and in particular about the parsec-scale environment of intermediate-mass BHs they may host, and also taking into account that the miniquasar’s radiation can significantly ionize the interstellar medium in front of it and thereby strongly diminish the net absorption effect (see, e.g., Sazonov & Khabibullin 2018), it is hardly possible to reliably predict the typical line-of-sight absorption column, , for the miniquasars in the early Universe. We therefore consider it a free parameter. Similarly, we allow the metallicity of the absorbing gas to vary from (pure H–He gas) to (normal chemical composition): although the first galaxies (at –10) were likely metal poor, the immediate surroundings of miniquasars might have been significantly metal enriched because they were probably the sites of strong star formation activity.
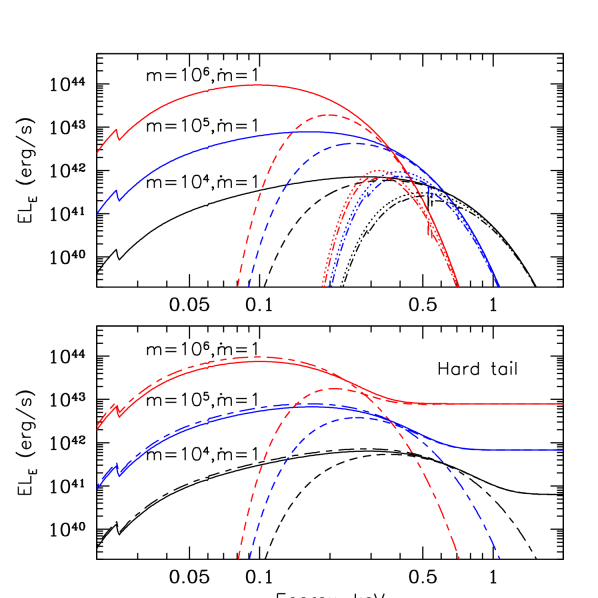
Figure 1 (top panel) shows examples of (rest-frame) spectra of miniquasars for various values of model parameters, namely (assuming ), and (absorption was modeled by means of the tbvarabs model in XSPEC). We see that for the range of BH masses and accretion rates expected for miniquasars and in the absence of absorption, the bulk of the accretion disk’s emission is in the extreme UV–very soft X-ray band, at energies –1000 eV. Even a moderate absorption ( cm-2) will cause a strong reduction of the flux below eV. An addition of metals to the absorbing medium (the case) will further reduce the flux, but mostly above the oxygen absorption edge at eV (note also that the helium absorption edge at eV is clearly seen in the spectra).
The bottom panel of Fig. 1 shows examples of thermal spectra modified by Comptonization, as described above. For the adopted value, , of the fraction of Comptonized photons, the hard tail starts to dominate over thermal emission at keV for the lowest mass BH () and already at eV for the highest mass BH ().
3 A crude estimate of the expected heating
To a first approximation, the thermal disk emission from miniquasars (with –) in the presence of moderate absorption ( cm-2) may be characterized by a narrow spectrum around an energy eV (see Fig. 1). This allows us to derive order-of-magnitude estimates for the impact of a miniquasar on the IGM before proceeding to detailed computations.
The mean free path of soft X-ray photons of energy in the primordial (i.e. nearly neutral H–He gas) IGM of the early Universe can be approximated as follows (Sazonov & Sunyaev, 2015):
| (7) |
Within this (proper) distance from the source, % of photons of energy will be photoabsorbed (whereas 95% of photons will be absorbed within ). The distance corresponds to an angular size
| (8) |
on the sky, which is a reasonably good approximation for –10 and –1000 eV.
The thermal disk emission from a miniquasar can heat the IGM efficiently only within a few , since only an exponentially decreasing fraction of the miniquasar’s luminosity reaches larger distances. This allows us to readily estimate the expected IGM temperature increment. The total energy released by the BH during its growth to mass is , and we may assume that most of this energy is radiated away over a time of order the Salpeter time () just before the epoch when the miniquasar and the associated 21 cm signal are observed, so that, to a first approximation, we can ignore any effects associated with the expansion of the Universe. We may further assume that all of this energy has been absorbed within a volume of radius (the corresponding light travel time proves to be shorter than ). Assuming that the miniquasar ionizes the surrounding medium only moderately (i.e. the ionization degree of hydrogen is less than a few per cent, which is a good approximation for the bulk of the affected volume), we may roughly estimate the mean fraction of the energy of soft X-ray photons that goes into heating the IGM as (Furlanetto & Stoever, 2010). Taking into account that the hydrogen space density changes with redshift as cm-3, we can write
| (9) |
where is the Boltzmann constant, and finally determine the expected IGM temperature increment assuming eV:
| (10) |
Comparing this with the cosmic microwave background (CMB) temperature, , we come to the conclusion that BHs with accreting at a nearly critical rate in the early Universe will be surrounded by well-defined zones with a radius of a few arcmin within which , and these regions are thus expected to be 21 cm emitters, in contrast to the surrounding sky, which is likely to exhibit 21 cm absorption at . Importantly, for , the size of the heating region is determined simply by the mean free path of soft X-ray photons, rather than by the radiative power of the miniquasar. Following the same argument, we may expect that for BHs of smaller mass, , the region of strong heating [] will be smaller than and its actual size will be determined by the total energy released by accretion onto the BH.
4 Simulations
Based on the assumptions outlined in §2, we performed a series of numerical calculations of IGM heating and associated 21 cm emission/absorption in the vicinity of miniquasars in the early Universe. We limited simulations to a redshift range of –10 and neglected any global heating (i.e. outside the region affected by the miniquasar) of the IGM by X-ray sources and/or other mechanisms222In particular, by low-energy cosmic rays from the first supernovae (Sazonov & Sunyaev, 2015; Leite et al., 2017).. We adopted the following initial parameters of the IGM: (hydrogen ionization fraction), , (helium ionization fractions) and either K (for ) or K (for ). These were found using RECFAST (Seager, Sasselov, & Scott, 1999) and correspond to the conditions after cosmic recombination and adiabatic cooling of the primordial gas. Our assumption about the absence of significant global heating might be a good approximation at least at , as suggested by the recent detection of a strong, sky-averaged 21 cm absorption signal in the Experiment to Detect the Global Epoch of Reionization Signature (EDGES, Bowman et al. 2018).
X-ray ionization and heating of the IGM was calculated in logarithmically binned spherical shells around the miniquasar, out to a comoving distance of 500 Mpc. Although this maximal distance is fairly large, we ignored photon travel time effects (i.e. the response of the IGM to radiation emitted by the central source was considered instantaneous), since X-ray heating proves to be noticeable only within cMpc of the miniquasar and the corresponding light travel time at is much shorter than the Salpeter timescale on which BH growth occurs.
The evolution of the ionization state of hydrogen and helium with time in a given shell was calculated as follows [equations (LABEL:eq:dxh)–(15) below are adopted from Madau & Fragos 2017; Sazonov & Khabibullin 2017a]:
where is the number density of free electrons, , and are the recombination coefficients (adopted from Theuns et al. 1998), and , and are the photoionization coefficients, which were calculated as follows:
| (12) |
where eV, eV and eV are the ionization thresholds for HI, HeI and HeII, and are the mean numbers of secondary ionizations of HI and HeI (secondary ionization of HeII is practically unimportant) caused by the fast photoelectron, with the notation meaning that is a function of the photoelectron energy, (the corresponding dependencies for HI and HeI are adopted from Furlanetto & Stoever 2010), and
| (13) |
is the IGM photoionization optical depth within radius from the source, with the cross-sections , and adopted from Verner et al. (1996).
The evolution of the gas temperature with time in a given shell is given by
| (14) |
where the photoionization heating rate is given by
| (15) |
with being the Hubble constant, the average baryonic density of the Universe, the mean molecular weight and the fraction of the photoelectron energy that goes into gas heating, which depends on the photoelectron energy as given by Furlanetto & Stoever (2010).
The term proportional to in equation (14) accounts for the radiative losses arising from collisional and recombinations processes (the corresponding rates were adopted from Theuns et al. 1998), as well as for Compton cooling caused by scattering of the CMB on free electrons333Inverse Compton heating due to the X-ray radiation is negligible except very close to the miniquasar.), which proceeds on the time scale
| (16) | |||||
where is the total particle number density, is the Thomson scattering cross-section and is the Stefan–Boltzmann constant, cooling due to collisional processes (including bremsstrahlung) and CMB scattering proves to be important in the vicinity of the miniquasar where the gas becomes strongly ionized and its temperature rises to K. However, the cooling processes typically have a negligible effect on the average parameters of the IGM heating zone produced by the miniquasar.
We further assume that the spin temperature, , characterizing the 21 cm transition is everywhere equal to the gas kinetic temperature, . The EDGES measurement (Bowman et al., 2018) suggests that it is indeed the case at , implying that by that time the first stars had already created a significant UV (10.2–13.6 eV) background for decoupling the spin temperature from that of the CMB and bringing it close to the gas kinetic temperature via the Wouthuysen–Field effect (Wouthuysen, 1952; Field, 1958). Furthemore, the photoionization of the IGM by soft X-rays from a miniquasar will be accompanied by the creation of Ly photons that will further strengthen the Wouthuysen–Field effect wherever the gas temperature increases by K on the BH growth timescale (Chuzhoy, Alvarez, & Shapiro, 2006; Chen & Miralda-Escudé, 2008). Under these assumptions and for the adopted cosmological parameters, the brightness temperature of the 21 cm line is expected to be
| (17) |
5 Results
Our model has the following parameters: the initial and final redshifts ( and ), the initial and final masses of the BH ( and , in solar masses), the Eddington ratio during active accretion phases (), and the intragalactic absorption column density and metallicity ( and , respectively). We now present a summary of results obtained for various sets of the parameter values. Most of the results presented below have been obtained for the case of purely thermal accretion disk emission, with the spectral shape as shown in the top panel of Fig. 1. We specify explicitly whenever we also take the possible contribution of a high-energy Comptonization component into account.
5.1 Gas temperature and 21 cm brightness temperature radial profiles


Figure 2 shows the IGM temperature and hydrogen ionization fraction as functions of comoving distance from the miniquasar and the brightness temperature of the resulting 21 cm signal as a function of the angular distance in the plane of the sky for , , , , (the corresponding accretion duty cycle %) and various absorption characteristics: , , , , cm-2 and , . We see that the absorption of soft X-rays within the host galaxy leads to less efficient IGM heating if cm-2 and that the presence of heavy elements ( vs. ) proves to be of minor importance. Therefore, we hereafter focus on the metal-free case, unless specifically noted otherwise.
Figure 3 is analogous to Fig. 2, but the BH mass has been increased by an order of magnitude from , to , . We see that the influence of intragalactic absorption is similar to the previous case and that the IGM heating zone has somewhat spread outwards.
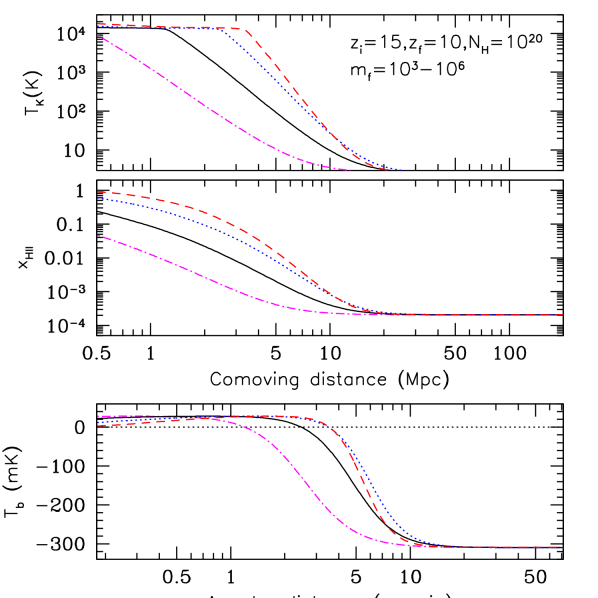
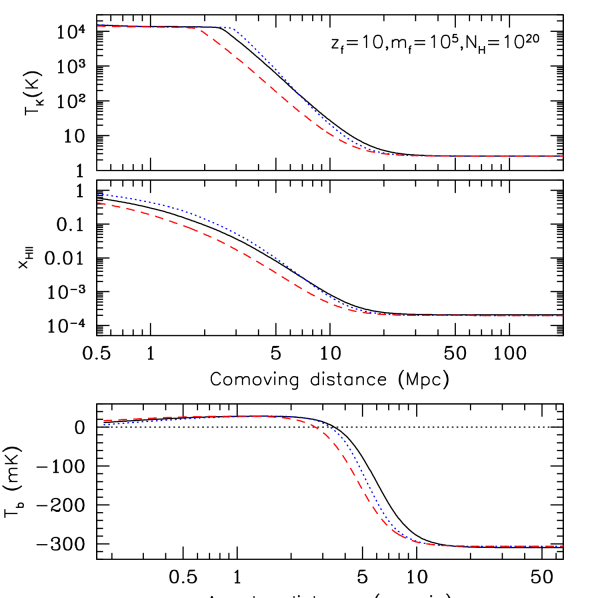
Figure 4 demonstrates the dependence of the results on the BH mass. Here, we adopted , , and and sampled BH masses (, ) from (, ) to (, ). We see that although more massive BHs produce much stronger ionization very close to the source, this has a fairly small effect on the resulting 21 cm signal, because the innermost region of strong heating is characterized by a nearly saturated, positive 21 cm brightness temperature [because , see eq. (17)]. More important from an observational point of view is what happens at larger distances where the 21 cm signal changes from emission to absorption, and we see that the effective size of this region first noticeably increases on going from to and then remains nearly the same for and (in fact, this region is somewhat smaller for than for because of the smaller number of soft X-ray photons with eV, capable of propagating to large distances, in the former case – see Fig. 1). This behavior is broadly consistent with the prediction made in §3 that the 21 cm zones around miniquasars should be largely determined by the total accretion energy for BHs with and by the characteristic mean free path of accretion disk photons for more massive BHs.
Figure 5 demonstrates the influence of a particular history of BH growth on the results. Here, we fixed the final redshift at , the initial and final BH masses at and , respectively, and the absorption column at , and considered three scenarions: (i) , (the duty cycle %), (ii) , (%) and (iii) , (%). We see that the differences in the corresponding and profiles are small.
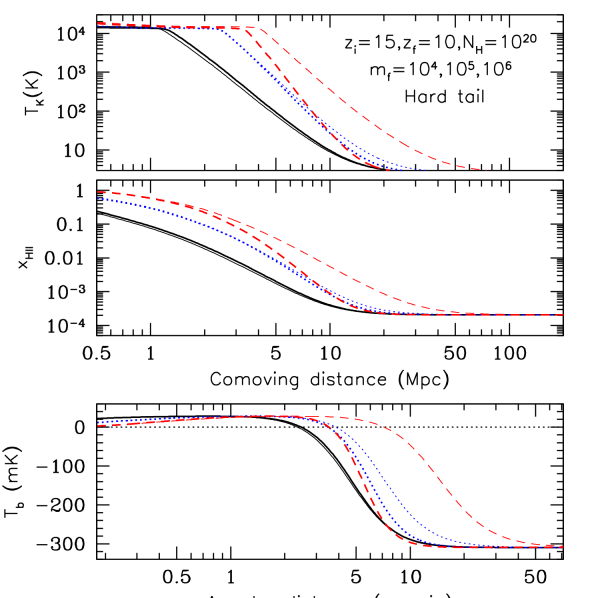
So far we have assumed that the incident radiation spectrum is that of a multicolor accretion disk modified by line-of-sight absorption, as shown in the top panel of Fig. 1. We now wish to investigate the possible effect of an additional hard, power-law spectral component that may arise due to the Comptonization of soft photons from the BH accretion disk in its hot corona. To this end, we carried out calculations for our simpl*diskbb spectral models for , and and cm-2, shown in the bottom panel of Fig. 1. The resulting , and radial profiles are compared in Fig. 6 with those computed without the hard X-ray component. We see that the 21 cm zone is almost unaffected by the hard spectral component for the least massive BH (), somewhat broadens in the intermediate mass case (), and becomes substantially (by a factor of ) larger for the heaviest BH (). The last result is unsurprising, because the corresponding X-ray spectrum (see Fig. 1) is dominated by the power-law component already at eV (partially because of the adopted substantial line-of-sight absorption of cm-2).
5.2 Characteristic size of the 21 cm zone
From the above comparison of the computed radial profiles a preliminary conclusion may be drawn that the spatial extent of the 21 cm signal associated with a high-redshift miniquasar will only weakly depend on the properties of the latter. For more quantitative assessment, we define two characteristic angular sizes: – the projected distance from the miniquasar at which the 21 cm signal changes from emission to absorption, i.e. , and – the radius at which the brightness temperature of the absorption signal is half the ’background’ value (the 21 cm brightness temperature outside of the miniquasar heating zone), i.e. . Under our assumptions that there is no global IGM heating and that the 21 cm spin temperature is coupled to the IGM kinetic temperature, mK and mK at and , respectively.
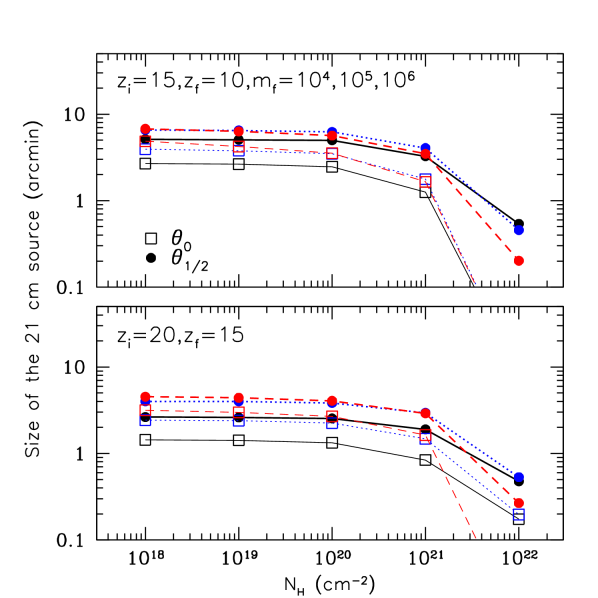
Figure 7 (top panel) shows and as functions of the absorption column for , , and three different BH masses, , and . We see that if the intragalactic absorption is not strong ( cm-2), and especially depend only weakly on the BH mass and absorption column density. Specifically, –5 arcmin, and –7 arcmin. If cm-2, most of the microquasar’s soft X-ray emission is absorbed within its host galaxy, which naturally leads to a dramatic weakening of IGM heating and shrinkage of the 21 cm zone. The bottom panel of Fig. 7 shows a similar set of curves for the case of miniquasars operating at higher redshifts, namely and . In this case, there is a more noticeable, albeit still weak dependence on the BH mass, namely (for cm-2) changes from to arcmin as increases from to , whereas changes from to arcmin in the same BH mass range. Overall, the computed size of the heating zone is in remarkably good agreement (within a factor of ) with our rough prediction given by equation (8).
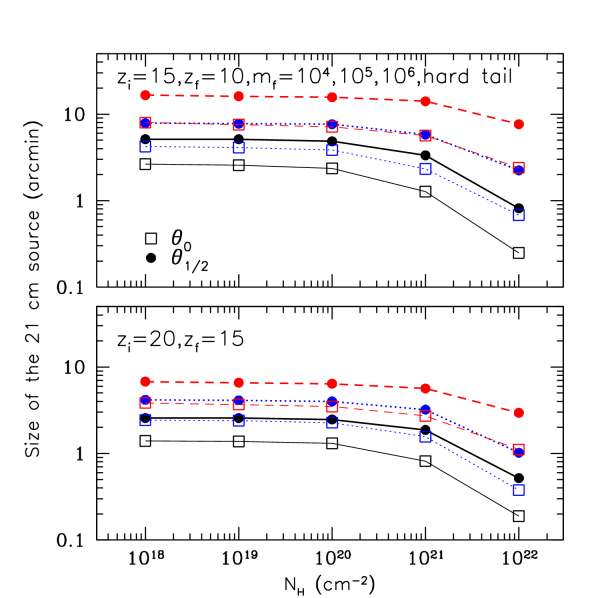
Figure 8 demonstrates the impact of an additional hard (Comptonization) spectral component on the extent of the miniquasar 21 cm zone. By comparing these plots with those pertaining to the case of pure multicolor disk emission (Fig. 7), we see that while and have remained nearly unchanged for , these characteristic radii have increased by a factor of –2 for . Therefore, the hard tail considerably changes the overall picture for the most massive of the considered BHs (). This again reflects the fact that, within the adopted model, the Comptonized radiation starts to dominate over the thermal emission already at photon energies eV.
5.3 Spectrum and flux of the 21 cm signal
We now proceed to discussing the spectral properties of the 21 cm signal associated with high-redshift miniquasars. Based on the above results we can expect such objects to be surrounded on the sky by fairly well defined regions with an apparent size of several arcmin within which mK, and it will be interesting to search for such specific zones of 21 cm excess emission with future radio interferometers.
In reality, the effective angular size of the 21 cm signal extraction region around a candidate miniquasar will be determined by the characteristics of a particular radio interferometer and by the related noise and background levels (see the discussion in §7 below), but ideally it should be of the order of the radius defined above. We have therefore integrated the surface brightness of the expected 21 cm excess emission (i.e the difference ) over the circle of radius around the miniquasar.
Figure 9 (top panel) shows the resulting spectra for , , , , and various absorption columns. We see that the 21 cm flux density is almost unaffected by intragalactic absorption if cm-2, the signal weakens by a factor of for cm-2 and nearly vanishes if cm-2, as essentially no soft X-rays from the miniquasar leak from the host galaxy into the IGM.
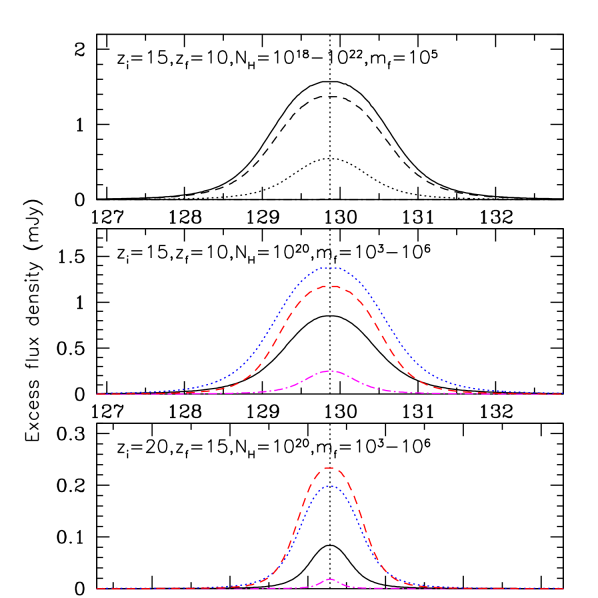
The middle panel of Fig. 9 demonstrates the dependence of the 21 cm spectum on the BH mass (for , , and cm-2). We see that the signal increases by a factor of on going from to and then remains nearly the same (within a factor of ) for –. The bottom panel of Fig. 9 shows the corresponding spectra for similar miniquasars at higher redshifts: , . The picture is qualitatively similar to the previous case, but the 21 cm excess flux density is more sensitive to the BH mass at the higher redshift. We also note that the signal is somewhat stronger for than for in the case, while the opposite is true for . The reason is that this signal is accumulated from the region whose dependence on the BH mass (see Fig. 7) is slightly different between and due to a non-trivial interplay between the BH soft X-ray spectral properties and redshift-dependent density of the IGM. Most importantly, however, Fig. 9 demonstrates that the expected 21 cm signal depends fairly weakly (within a factor of 3) on the BH mass over the – range.
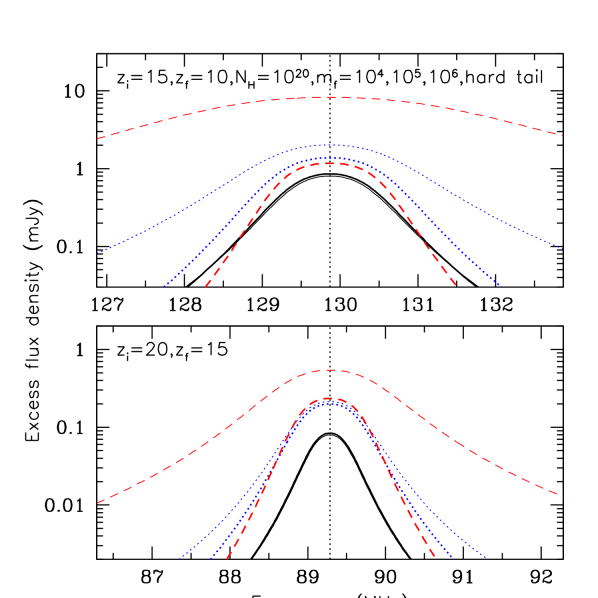
Figure 10 demonstrates the impact of an additional hard spectral component on the discussed 21 cm spectra. We see that the hard tail leads to a dramatic increase of the expected 21 cm signal for our most massive () BH, with this difference being more pronounced at the lower redshift ( vs. ). These tendencies are expected, since the reported spectra were obtained by integration of within the characteristic radius , which increases in the presence of a hard spectral component, as was shown in §5.2.
As regards the absolute value of the expected 21 cm flux density, it is useful to approximate it as follows:
| (18) |
where we assumed that the average excess brightness temperature of the 21 cm signal within is , which is approximately the case (see the radial profiles in §5.1). Substituting the typical values derived from our simulations for ( mK, ) and ( mK, ) into the above expression, we find and mJy, respectively, in fairly good agreement with the 21 cm spectra shown above.
We finally note that the simulated 21 cm spectra for the case of purely thermal disk emission are characterized by FWHM of in terms of .
6 Relation to X-ray observations
As was discussed in §1, there is a hope that future X-ray observatories such as Lynx will be able to find a significant number of high-redshift miniquasar candidates. Provided that the planned next-generation radio facilities such as SKA are also available by that time, it should be possible to search for the specific 21 cm signatures of X-ray selected miniquasars discussed in this paper.
The first practical question then is: what are the limiting BH mass and redshift for X-ray detection of miniquasars? In this study, we have assumed that a miniquasar’s spectrum is a combination of (i) multicolor disk emission with the temperature expected from the standard accretion disk theory and, plausibly, (ii) a hard, power-law () tail associated with Comptonization of disk emission in a hot corona, which extends to high energies (at least to a few tens of keV). It is this additional hard component that an X-ray telescope might be able to detect from a high-redshift miniquasar. In the particular spectral model, simpl(diskbb), used in this study, the observed X-ray flux in the 0.5–2 keV band (corresponding to emission in a rest-frame band of – keV), , is proportional to the fraction of scattered photons. It turns out that, virtually independently of the BH mass and accretion rate,
| (19) |
where is the total luminosity of the miniquasar and is its luminosity distance.
Assuming that (which is a reasonable value as discussed in §2.2) and that the X-ray tesecope catches the miniquasar when it is accreting at a critical rate (), when , we find from equation (19) that for , and erg cm-2 s-1 at and , respectively, whereas for , and erg cm-2 s-1 for the same redshifts. These fluxes are well below the detection threshold of Chandra, the most sensitive X-ray telescope so far. However, the proposed Lynx mission is expected to reach a sensitivity of erg cm-2 s-1 in its deep extragalatic surveys and should thus be able to detect actively growing BHs of mass at and at . These mass limits are of course inversely proportional to and .
7 Discussion and summary
We have shown that an intermediate mass BH growing by radiatively efficient accretion in the early Universe should leave a specific, localized imprint on the 21 cm cosmological signal. Namely, a miniquasar with the BH mass between and at –10 will be surrounded by a region with a fairly well defined boundary of several arcmin radius, within which the 21 cm temperature quickly grows inwards from the background value mK to (reaching the saturation value of mK in the innermost region). The size of this region and the flux density of the enclosed 21 cm signal are only weakly sensitive to the BH mass in the range quoted above.
7.1 Sensitivity to assumptions
The above result was obtained under certain assumptions and it is important to discuss how realistic they are. Perhaps, the most important constituent of our model is the miniquasar’s spectral energy distribution, which we assumed to be that of multicolor disk blackbody emission. As was discussed in §2.1, the actual spectrum of the accretion disk emission is likely to deviate significantly from this simplistic model, but given the weak sensitivity of the size of the 21 cm zone to the BH mass, such deviations are unlikely to have a significant effect on our predictions. More important is the likely presence of an additional, hard component in the miniquasar spectrum. As we have demonstrated, its effect is small for relatively low-mass BHs (–) but becomes substantial (the heating zone widens by a factor of –2) for a BH.
The next important issue is possible photoabsorption of the miniquasar’s soft X-ray emission within its host galaxy. It turns out that the properties of the 21 cm zone remain nearly unchanged as long as cm-2 (regardless of the presence of metals in the absorbing medium), but at cm-2 this zone starts to shrink dramatically. One may argue that a powerful miniquasar should be able to quickly photoionize the interstellar medium within a substantial distance of itself and thus effectively reduce (e.g. Sazonov & Khabibullin 2018), but this clearly needs further investigation. Furthermore, if miniquasars are less powerful analogs of AGN, they may have a small-scale obscuring torus of cold gas and dust. In that case there will be two opposite cones of specific 21 cm signal around the miniquasar, i.e. the average signal within the radius will decrease by a factor of , where is the solid angle of the unobscured sky as seen from the BH.
Finally, we assumed that the Universe had not yet been globally heated at the redshifts of interest (–10) and that the 21 cm spin temperature was coupled to the gas temperature at these epochs. It is only in this case that a large contrast in the 21 cm brightness temperature will arise between the vicinity of the miniquasar, where , and the background, where – mK (at ). These assumed conditions are in good agreement with the recent EDGES result (Bowman et al., 2018) for –15444Actually, EDGES measured an even lower sky-averaged mK. but appear to fail at , when the global 21 cm temperature has been measured to be around zero. Of course, the EDGES measurements must be verified with future observations but a lot of authors (see §1) have suggested that XRBs, miniquasars and other types of X-ray sources can indeed significantly heat the Universe by . In such a case, it will be extremely difficult to discern the 21 cm imprint of an individual miniquasar against the background at but that should still be possible at .
7.2 Comparison with previous studies
The present study is not the first one addressing the potential impact of high-redshift X-ray sources on the cosmological 21 cm signal. In particular, a number of authors have focused on the expected 21 cm signatures of individual quasars and miniquasars in the early Universe (Chuzhoy, Alvarez, & Shapiro, 2006; Thomas & Zaroubi, 2008; Yajima & Li, 2014; Ghara et al., 2017; Bolgar et al., 2018; Vasiliev, Sethi, & Shchekinov, 2018). The crucial novel aspect of our study is its focus on the (relatively soft) thermal emission of the accretion disk around an intermediate-mass black hole, which is expected (based on the rich observational material on high Eddington ratio X-ray binaries and AGN) to carry the bulk of the bolometric luminosity of the miniquasar but has been usually ignored before. This leads to an important difference for the predicted 21 cm signature, namely that it should be concentrated within arcmin of the miniquasar due to the relatively short mean free path of the extreme UV/soft X-ray photons in the ambient IGM.
Furthemore, in contrast to some of the previous studies we have assumed the 21 cm spin temperature at the considered epochs (–10) to be coupled (by the UV background from the first stars) to the gas temperature throughout the IGM and that the latter had not yet been heated significantly on average, so that the mean – mK, rather than as it would be in the absence of Wouthuysen–Field coupling or in the presence of significant global heating. This key assumption, as noted above (in §7.1), is partially motivated by the recent detection of a strong 21 cm global absorption feature by EDGES. It is the combination of the relative compactness of the heating zone and the large negative global 21 cm brightness temperature that has led to our conclusion that high-redshift miniquasars might be associated with fairly strong ( mJy) 21 cm signatures.
7.3 Observational strategy
A blind sky search for weak 21 cm signals from individual high-redshift miniquasars might not be feasible in the near future. Therefore, we propose to look for such signals specifically from miniquasar candidates that can be found with the proposed Lynx X-ray mission. As discussed in §6, the planned Lynx sensitivity of erg cm-2 s-1 should allow it to detect rapidly growing BHs with masses as low as a few out to , provided that a signficant fraction of the energy released by accretion goes into Comptonized, hard X-ray radiation.
However, selection of such candidates is unlikely to be an easy task. Indeed, Lynx will provide only crude X-ray hardness information for them, not sufficient for distinguishing from other types of sources. Moreover, high-redshift miniquasars will probably be just a small minority among the tens of thousands of sources to be detected in the proposed Lynx (400 arcmin2) ultradeep survey (The Lynx Team, 2018). Specifically, Ben-Ami, Vikhlinin, & Loeb (2018) predict that between several dozen and a few thousand growing massive BHs (roughly in the – range of interest to us) could be found at –12, with this large uncertainty reflecting our poor understanding of how BHs form and grow in the early Universe. In the present study, we have focused on somewhat earlier epochs, –10, and just between a few and a few hundred (i.e. less or much less than 1 object per arcmin2) such high-redshift miniquasars are expected to be found by Lynx (Ben-Ami, Vikhlinin, & Loeb, 2018).
Fortunately, there are bright prospects for the synergy between the proposed Lynx survey and the optical/IR ultradeep surveys by next-generation telescopes such as JWST (The Lynx Team, 2018), so that the majority of the Lynx sources (such as AGN and galaxies) will probably have reliable optical/IR counterparts. High-redshift miniquasars, because of their expected optical/IR faintness (see §1), will thus be hidden among the relatively small sample of very faint ( erg cm-2 s-1) X-ray sources without an optical counterpart. A reasonable approach would then be to regard all such sources as candidate high-redshift miniquasars and search for specific 21-cm signatures around their positions provided by Lynx.
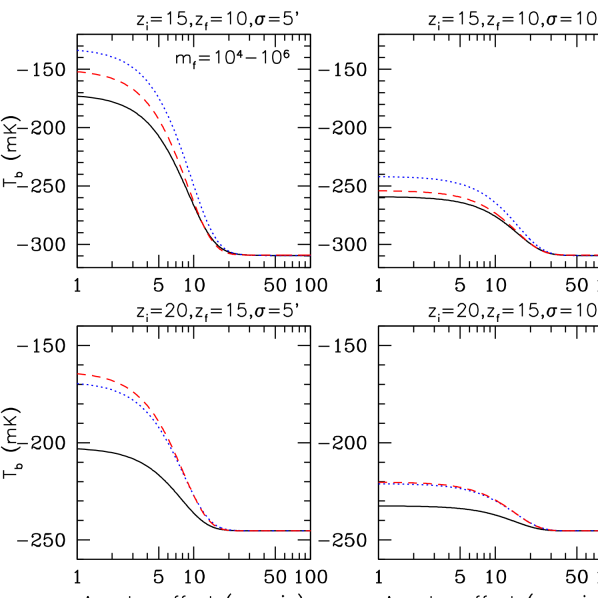
According to our estimates, high-redshift miniquasars are expected to produce 21 cm signals with an amplitude mK on few-arcmin scales, with the characteristic spectral width corresponding to MHz at MHz for –15. How do these numbers compare with the expected characteristics of future cosmological 21 cm surveys with their specific noise levels and angular resolution? Figure 11 shows the result of convolution of our predicted 21 cm images of miniquasars (for - and and 15) with two-dimensional Gaussians with and 10′. We see that miniquasars are expected to produce –180 mK and –80 mK positive peaks (with respect to the large-scale background) on images with 5-arcmin angular resolution for and , respectively.
The low-frequency component of the SKA experiment, SKA-low, is planned to cover a broad frequency range extending down to MHz (allowing one to probe the early Universe out to ) with high spectral resolution ( kHz) and a very large collecting area km2 (Mellema et al., 2013). For the first phase of the experiment (the so-called SKA1-Low), the noise level is expected to be mK ( mK) for () images with angular resolution (with the frequency bandwidth matched to the angular resolution) accumulated over an integration time of hours (see fig. 2 in Mellema et al. 2015). Therefore, the mK signal from a high-redshift miniquasar (see Fig. 11) should be reliably detectable with such long (but feasible) observations by SKA1-low (and even more so by the fully constructed SKA-low).
In reality, the biggest problem will likely be separating the 21 cm signal associated with high-redshift miniquasars from astrophysical foregrounds of much higher amplitude, such as Galactic synchrotron radiation and cumulative emission from unresolved extragalactic sources; furthermore, the large-scale structure of the early Universe will cause additional fluctuations of the 21 cm brightness temperature on the arcmin scales relevant to the problem in hand (see Mellema et al. 2013 for a review). Finally, as with any radio interferometer, SKA will not be capable of measuring absolute source fluxes due to the zero-spacing problem. A thorough consideration of these non-trivial observational issues is beyond the scope of this proof-of-concept study, but a number of recent studies (Wyithe, Geil & Kim, 2015; Ghara et al., 2017) address these problems in the context of SKA and suggest that there are efficient methods of evaluation and subtraction of foregrounds that might enable detection of the mK peaks associated with high-redshift miniquasars on the SKA images.
We finally emphasize again that such a search will be greatly faciliated by the availability of accurate celestial coordinates of candidate miniquasars from Lynx, even though the X-ray data will not provide their redshifts. In practice, the search might consist of browsing SKA-low images constructed with angular resolution (and cleaned as carefully as possible from the foregrounds), one redshift slice after another over a range of –20. The detection of a positive mK peak (see Fig. 11) centered on the Lynx position will strongly indicate that the object is indeed an intermediate-mass BH growing to become a supermassive BH. Moreover, its redshift can thus be measured to within .
Acknowledgments
The authors thank the referee for useful suggestions. The research was supported by the Russian Science Foundation (grant 14-12-01315).
References
- Arnaud (1996) Arnaud K. A., 1996, ASPC, 101, 17
- Bañados et al. (2018) Bañados E., et al., 2018, Natur, 553, 473
- Ben-Ami, Vikhlinin, & Loeb (2018) Ben-Ami S., Vikhlinin A., Loeb A., 2018, ApJ, 854, 4
- Bolgar et al. (2018) Bolgar F., Eames E., Hottier C., Semelin B., 2018, MNRAS, 478, 5564
- Bowman et al. (2018) Bowman J. D., Rogers A. E. E., Monsalve R. A., Mozdzen T. J., Mahesh N., 2018, Natur, 555, 67
- Chen & Miralda-Escudé (2008) Chen X., Miralda-Escudé J., 2008, ApJ, 684, 18
- Chuzhoy, Alvarez, & Shapiro (2006) Chuzhoy L., Alvarez M. A., Shapiro P. R., 2006, ApJ, 648, L1
- Cohen et al. (2017) Cohen A., Fialkov A., Barkana R., Lotem M., 2017, MNRAS, 472, 1915
- Davis et al. (2005) Davis S. W., Blaes O. M., Hubeny I., Turner N. J., 2005, ApJ, 621, 372
- Done, Gierliński, & Kubota (2007) Done C., Gierliński M., Kubota A., 2007, A&ARv, 15, 1
- Done et al. (2012) Done C., Davis S. W., Jin C., Blaes O., Ward M., 2012, MNRAS, 420, 1848
- Elvis et al. (1994) Elvis M., et al., 1994, ApJS, 95, 1
- Ferrara & Loeb (2013) Ferrara A., Loeb A., 2013, MNRAS, 431, 2826
- Fialkov et al. (2017) Fialkov A., Cohen A., Barkana R., Silk J., 2017, MNRAS, 464, 3498
- Field (1958) Field G. B., 1958, PIRE, 46, 240
- Fragos et al. (2013) Fragos T., et al., 2013, ApJ, 764, 41
- Furlanetto & Stoever (2010) Furlanetto S. R., Stoever S. J., 2010, MNRAS, 404, 1869
- Ghara et al. (2017) Ghara R., Choudhury T. R., Datta K. K., Choudhuri S., 2017, MNRAS, 464, 2234
- Gilfanov & Merloni (2014) Gilfanov M., Merloni A., 2014, SSRv, 183, 121
- Kaaret, Feng & Roberts (2017) Kaaret P., Feng H., Roberts T. P., 2017, ARA&A, 55, 303
- Koratkar & Blaes (1999) Koratkar A., Blaes O., 1999, PASP, 111, 1
- Latif & Ferrara (2016) Latif M. A., Ferrara A., 2016, PASA, 33, e051
- Leite et al. (2017) Leite N., Evoli C., D’Angelo M., Ciardi B., Sigl G., Ferrara A., 2017, MNRAS, 469, 416
- The Lynx Team (2018) The Lynx Team, 2018, arXiv, arXiv:1809.09642
- Madau et al. (2004) Madau P., Rees M. J., Volonteri M., Haardt F., Oh S. P., 2004, ApJ, 604, 484
- Madau & Fragos (2017) Madau P., Fragos T., 2017, ApJ, 840, 39
- Makishima et al. (1986) Makishima K., Maejima Y., Mitsuda K., Bradt H. V., Remillard R. A., Tuohy I. R., Hoshi R., Nakagawa M., 1986, ApJ, 308, 635
- Mason, Trenti, & Treu (2015) Mason C. A., Trenti M., Treu T., 2015, ApJ, 813, 21
- Mellema et al. (2013) Mellema G., et al., 2013, ExA, 36, 235
- Mellema et al. (2015) Mellema G., Koopmans L., Shukla H., Datta K. K., Mesinger A., Majumdar S., 2015, aska.conf, 10, aska.conf
- Merloni, Fabian, & Ross (2000) Merloni A., Fabian A. C., Ross R. R., 2000, MNRAS, 313, 193
- Mirabel et al. (2011) Mirabel I. F., Dijkstra M., Laurent P., Loeb A., Pritchard J. R., 2011, A&A, 528, A149
- Narayan, Sa̧dowski & Soria (2017) Narayan R., Sa̧dowski A., Soria R., 2017, MNRAS, 469, 2997
- Planck Collaboration et al. (2016) Planck Collaboration, et al., 2016, A&A, 594, A13
- Pritchard & Furlanetto (2007) Pritchard J. R., Furlanetto S. R., 2007, MNRAS, 376, 1680
- Pritchard & Loeb (2012) Pritchard J. R., Loeb A., 2012, RPPh, 75, 086901
- Ricotti & Ostriker (2004) Ricotti M., Ostriker J. P., 2004, MNRAS, 352, 547
- Ross et al. (2017) Ross H. E., Dixon K. L., Iliev I. T., Mellema G., 2017, MNRAS, 468, 3785
- Sazonov, Ostriker, & Sunyaev (2004) Sazonov S. Y., Ostriker J. P., Sunyaev R. A., 2004, MNRAS, 347, 144
- Sazonov & Sunyaev (2015) Sazonov S., Sunyaev R., 2015, MNRAS, 454, 3464
- Sazonov & Khabibullin (2017a) Sazonov S., Khabibullin I., 2017, Astron. Lett., 43, 243
- Sazonov & Khabibullin (2017b) Sazonov S., Khabibullin I., 2017, MNRAS, 468, 2249
- Sazonov & Khabibullin (2018) Sazonov S., Khabibullin I., 2018, MNRAS, 476, 2530
- Sazonov, Lutovinov, & Krivonos (2014) Sazonov S. Y., Lutovinov A. A., Krivonos R. A., 2014, AstL, 40, 65
- Seager, Sasselov, & Scott (1999) Seager S., Sasselov D. D., Scott D., 1999, ApJ, 523, L1
- Shakura & Sunyaev (1973) Shakura N. I., Sunyaev R. A., 1973, A&A, 24, 337
- Steiner et al. (2009) Steiner J. F., Narayan R., McClintock J. E., Ebisawa K., 2009, PASP, 121, 1279
- Takeo et al. (2019) Takeo E., Inayoshi K., Ohsuga K., Takahashi H. R., Mineshige S., 2019, arXiv, arXiv:1901.04514
- Telfer et al. (2002) Telfer R. C., Zheng W., Kriss G. A., Davidsen A. F., 2002, ApJ, 565, 773
- Theuns et al. (1998) Theuns T., Leonard A., Efstathiou G., Pearce F. R., Thomas P. A., 1998, MNRAS, 301, 478
- Thomas & Zaroubi (2008) Thomas R. M., Zaroubi S., 2008, MNRAS, 384, 1080
- Vasiliev, Sethi, & Shchekinov (2018) Vasiliev E. O., Sethi S. K., Shchekinov Y. A., 2018, ApJ, 865, 130
- Verner et al. (1996) Verner D. A., Ferland G. J., Korista K. T., Yakovlev D. G., 1996, ApJ, 465, 487
- Volonteri (2010) Volonteri M., 2010, A&ARv, 18, 279
- Woods et al. (2018) Woods T. E., et al., 2018, arXiv, arXiv:1810.12310
- Wouthuysen (1952) Wouthuysen S. A., 1952, AJ, 57, 31
- Wyithe, Geil & Kim (2015) Wyithe S., Geil P., Kim H., 2015, aska.conf, 15, aska.conf
- Yajima & Li (2014) Yajima H., Li Y., 2014, MNRAS, 445, 3674