Measured Channel Hardening
in an Indoor Multiband Scenario
Abstract
A study of channel hardening in a large-scale antenna system has been carried out by means of indoor channel measurements over four frequency bands, namely , , and . NTNU’s Reconfigurable Radio Network Platform has been used to record the channel estimates for 40 single user non-line of sight radio links to a 64 element wide-band antenna array. By examining the rms delay spread and the ratio of the normalized subcarrier to average SISO link power of the radio channel received by a single user after combination, the hardening of this equivalent channel is analyzed for various numbers of nodes. The channel hardening merits show consistent behaviour throughout the frequency bands. By combining 16 antennas the rms delay spread of the equivalent channel is reduced from above to below with significantly reduced variation in the channel power.
I Introduction
In the view of the realization of time division duplex (TDD) massive multiple input multiple output (MIMO) testbeds at Lund University and University of Bristol [1], the capabilities of such systems have been subject to investigative work, so as to do a real-life evaluation of the expected properties described by theoretical work such as [2, 3, 4, 5]. Most of the reported work has been focused on investigating measures of properties suitable for multi-user scenarios such as spectral efficiency, capacity and sum-rates [6, 7] as well as user separation and channel orthogonality through evaluation of singular value spread [8, 9]. The reported experimental results have been carried out at a single frequency band using antenna arrays composed of close and uniformly spaced antennas. Throughout the above-mentioned work, the concept of massive MIMO has been defined as a multi-user system with TDD operation.
In the topic of examining the channel properties over various frequency bands, the authors of [10] have characterized the measured channels for two indoor scenarios at three frequency bands in terms of path loss, delay spread and coherence bandwidth. The impact of the frequency on those parameters in single input single output (SISO) channels formed between transmitter (TX) and receiver (RX) nodes have been discussed.
As an alternative approach to multi-user massive MIMO, the work in [11] formulates the concept of an equivalent received channel at a single user equipment (UE) by using time-reversal filters along with the combination applied to measured channels between the UE and the base station (BS). The delay spread has been used as a measure for temporal focusing and the distribution of power around the strongest tap has been shown as the channel hardening measure.
Using the measured channels between a 128 antenna BS and 36 UEs, the authors in [12] have evaluated the root mean square (rms) delay spread of the equivalent combined channel for three linear pre-coding schemes.
In this paper, what we refer to the perceived channel at a single user in the downlink (DL) as an equivalent channel. This is the channel constructed by pre-filtering of the signal followed by the combination at the antenna array in order to compensate for the channel, provided that reciprocity holds for the transmitter and receiver chains.
We consider channel hardening as a property that causes the equivalent channel transfer function (CTF) between the UE and the BS to become more deterministic with an increasing number of BS antennas. Harding of the channel can be exploited in wireless sensor networks (WSNs) in order to ensure reliable communication between the BS and the a number of low-complexity radios at the sensors. To achieve the reliability, it is required that the signal to each sensor propagates through a quasi-deterministic equivalent channel. At the same time, it is desirable to deploy radios at the sensor links with no need for complex equalization and estimation. In other words, it is advantageous to have simple RXs by ensuring single tap realizations of the equivalent channel with a delay dispersion below the tap delay resolution, hence, eliminating the need for an equalizer at the sensor while exploiting channel hardening to reduce the variability of the signal strength of the equivalent channel and to ensure a strong signal at the sensor.
We examine the channel hardening in the equivalent channel received at single UEs from the BS after matched-filter-weighted combination. We characterize the delay spread and the ratio of normalized subcarrier to average SISO power for different node combinations, namely 1, 4, 16 and 64 nodes, in order to determine the measure of flatness of the equivalent channel at the UE. Knowing how many antennas are sufficient to achieve a certain level of channel hardening allows us to consider the remaining BS antennas as contributors to achieve a multi-user system by using the remaining degrees of freedom to orthogonalize the equivalent channels.
First, we report on a channel measurement campaign which was carried out in an indoor area with industrial profile in a quasi-static scenario in 40 spatial sample points in order to characterize non-line of sight (NLOS) uplink (UL) channels to a 64 node array in 4 frequency bands: , , and . Second, the acquired UL channel estimates are analyzed to formulate the equivalent channel perceived at single UEs, that is, the measured SISO channels are matched filtered and combined in order to construct the observed channel at the UE. Third, we examine the rms delay spread and the ratio of the normalized subcarrier to average SISO power of the equivalent channel as our measures of channel hardening for 4 frequency bands while combining different number of nodes.
This manuscript is organized as follows: in section II, the channel measurement campaign is documented. A description of the measured scenario is presented in section III. The analysis of the measured data and formulation of channel hardening are described in section IV with results of the comparison presented in section V. Lastly, the conclusions are presented in Section VI.
II Measurement Description
The investigation reported in this paper is based on a measurement campaign carried out at Norwegian University of Technology and Science (NTNU) in December 2017 using the Reconfigurable Radio Network Platform (ReRaNP). The details of the UEs and the BS along with channel estimate acquisition in our settings are described in the following subsections:
II-A Massive MIMO Prototype Hardware
The massive MIMO testbed housed at NTNU is composed of 4 units which each contain 32 radio chains by employing 16 National Instruments (NI) USRP-2943R devices. These units controlled through a CPU which is running NI LabVIEW Communications MIMO Application Framework implement a TDD system with a Long Term Evolution (LTE)-like physical layer with bandwidth of operation[13]. The key parameters of the system are summarized in Table I. In this setting, 64 RF chains placed in 2 units (out of 4) were used.
| Parameter | Value |
|---|---|
| # of BS antennas | up to 128 (64 used) |
| # of UEs | 8 |
| Center Frequency | |
| Bandwidth of Operation | |
| Baseband Sampling Rate | |
| Subcarrier Spacing | |
| # of Subcarriers | 1200 |
| FFT size | 2048 |
| Frame Duration | |
| Subframe Duration | |
| Slot Duration | |
| TDD periodicity |
II-B Antennas
The BS antenna array consists of wide-band Log-Periodic Dipole Arrays (LPDAs) covering the frequency band between . The linearly polarized LPDA element has been designed to provide a half power beamwidth of approximately in the H-plane and in the E-plane giving a directive gain of when used as a single element. The UEs are equipped with one antenna element each, whilst the BS is equipped with 4 subarrays each containing 32 elements in an equally spaced 4x8 rectangular configuration as illustrated in Fig. 1. The LPDAs are mounted with an element spacing of on a common ground plane. As shown in Fig. 1 the antenna elements have interleaved polarization such that each element has a neighbor with orthogonal polarization. This reduces the mutual coupling effects between the elements to a minimum, hence the effect on the input impedance and radiation pattern for the elements are minimized. However, the introduction of the ground plane behind the LPDAs will give some variations in the directive gain during the measurements. 64 vertically polarized elements were terminated at the BS whilst the other 64 horizontally polarized elements were left open. The configuration is shown in detail in Fig. 1.

II-C User Equipment Terminals
The two radio chains of each NI USRP-2953R unit [14] along with NI LabVIEW Communications MIMO Application Framework set up in Mobile configuration enable operation of two UEs. In our test we used 4 units resulting in a total of 8 UEs. The USRPs were arranged on a wheeled cart in a semi-circle configuration as shown in Fig. 3(a) to facilitate only NLOS links in the scenario.
II-D Channel Estimate Acquisition
The system has antennas on the BS side, UEs and uses orthogonal frequency division multiplexing (OFDM) with 1200 usable subcarriers distributed over a band. Each user transmits pilot symbols on a different subcarrier subset (covering 100 subcarriers) during the channel estimate acquisition to ensure orthogonality between them. Collecting channel estimates from different physical locations in the same area allows to increase the number of measured realizations.
The complex CTF coefficient , with , and as user index, subcarrier index (of the user subcarrier subset with size ) and BS antenna index, respectively, is calculated by a least-squares estimate of the received signal with known pilot symbols. To differentiate the true CTF coefficient from the estimated CTF coefficient a tilde is added on top of the variable: .
III Measurement Scenario
The measurement campaign was carried out in NLOS configuration in an indoor space with industrial profile. As depicted in Fig. 2 the BS was set up at the balcony at the end of the long hall while the cart containing the 8 UEs was placed at around 15 meter distance from the BS. The antennas of the UEs are positioned in a half-circle, directed away from the BS to ensure NLOS. The approximate distance between the UE cart and the main reflectors at the end of the hall is around . As shown in the campaign photos in Fig. 3, there exist many reflecting surfaces. Among others, concrete walls, window glasses, metal lamp posts and metal bars (at the end of the hallway) which form a rich scattering environment. For each frequency band, the UE cart was positioned along 5 pre-marked locations within diameter to gain more sampling points of the environment.


IV Channel Hardening Metrics
On one hand, channel hardening can be seen as broadband flat fading of the equivalent CTF in the frequency domain. On the other hand, the equivalent channel impulse response (CIR) reveals UE design requirements in the delay domain, since the rms delay spread indicates the necessity of an equalizer. The RX could be simplified, if strong contributions of the perceived CIR are confined in a single delay tap. Additionally, channel hardening would ensure that this tap power is stable and close to deterministic for most realizations.
Weighted sums of SISO CTF coefficients with freely chosen weights are used to calculate equivalent CTF coefficients (hat highlighting an equivalent channel variable)
| (1) |
where , , represent the user, subcarrier and BS antenna in the subset , respectively. The latter allows the consideration of several equivalent channels to determine how the rms delay spread behaves for an increasing number of BS antennas. We chose the maximal ratio combining (MRC) approach (being optimal in a single user signal to noise ratio (SNR) sense) and used the complex conjugate of the estimated CTF coefficients () as weights. Finally, the CIR coefficients are calculated with an inverse discrete Fourier transform (IDFT)
| (2) |
where denotes the delay bin, to represent an equivalent tapped delay line.
Moving the summation in Eqn. (1) outside of the IDFT in Eqn. (2) reveals that the equivalent CIR is the sum over Fourier transformed weighted SISO CTFs. Further, the equivalent CIR can be seen as sum over convolutions between the Fourier transformed weights and the SISO CIRs. As a consequence, the Fourier transformed weights act as filtering in the delay domain. The choice of MRC weights forces this filter to be the time reversed and conjugated CIR of the estimated SISO channel. Hence, the equivalent CIR becomes a sum over the auto-correlations of those channels.
Lastly, the rms delay spread of an equivalent CIR is calculated by means of the normalized second-order central moment of for different subset choices of the available BS antennas and form our first metric.
The second metric investigates the power variations between different subcarriers in the observed bandwidth. We are normalizing the subcarrier power for a specific user with the number of receive antennas of a subset to exclude the array gain. Additionally, the resulting power is set in relationship to the average received SISO power of the specific user to have a normalized ratio and thus highlighting the variations only:
| (3) |
Statistics of allow to characterize the differences a narrow band RX will see in the frequency range in terms of power levels with respect to the average received power. Hence, it allows us to draw conclusions about the link budget in a direct way.
V Measurement Results
Measurements of were done for the aforementioned frequency bands in 5 physical locations with 8 UEs probing the SISO channels. The data of two receiver chains where the SNR indicated faulty equipment and failing links for UEs with synchronization issues were excluded.
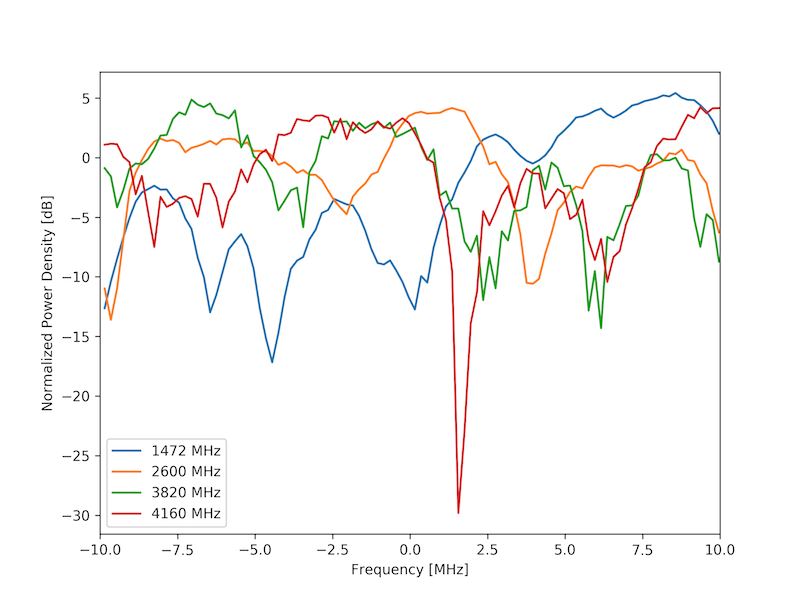
To get an overview over the measured radio environment, a single CTF per frequency band is shown in Fig. 4. They were normalized to their average power level to highlight the fluctuations over the frequency range. Significant fading below can be found, as expected for a rich scattering environment, in each of them.

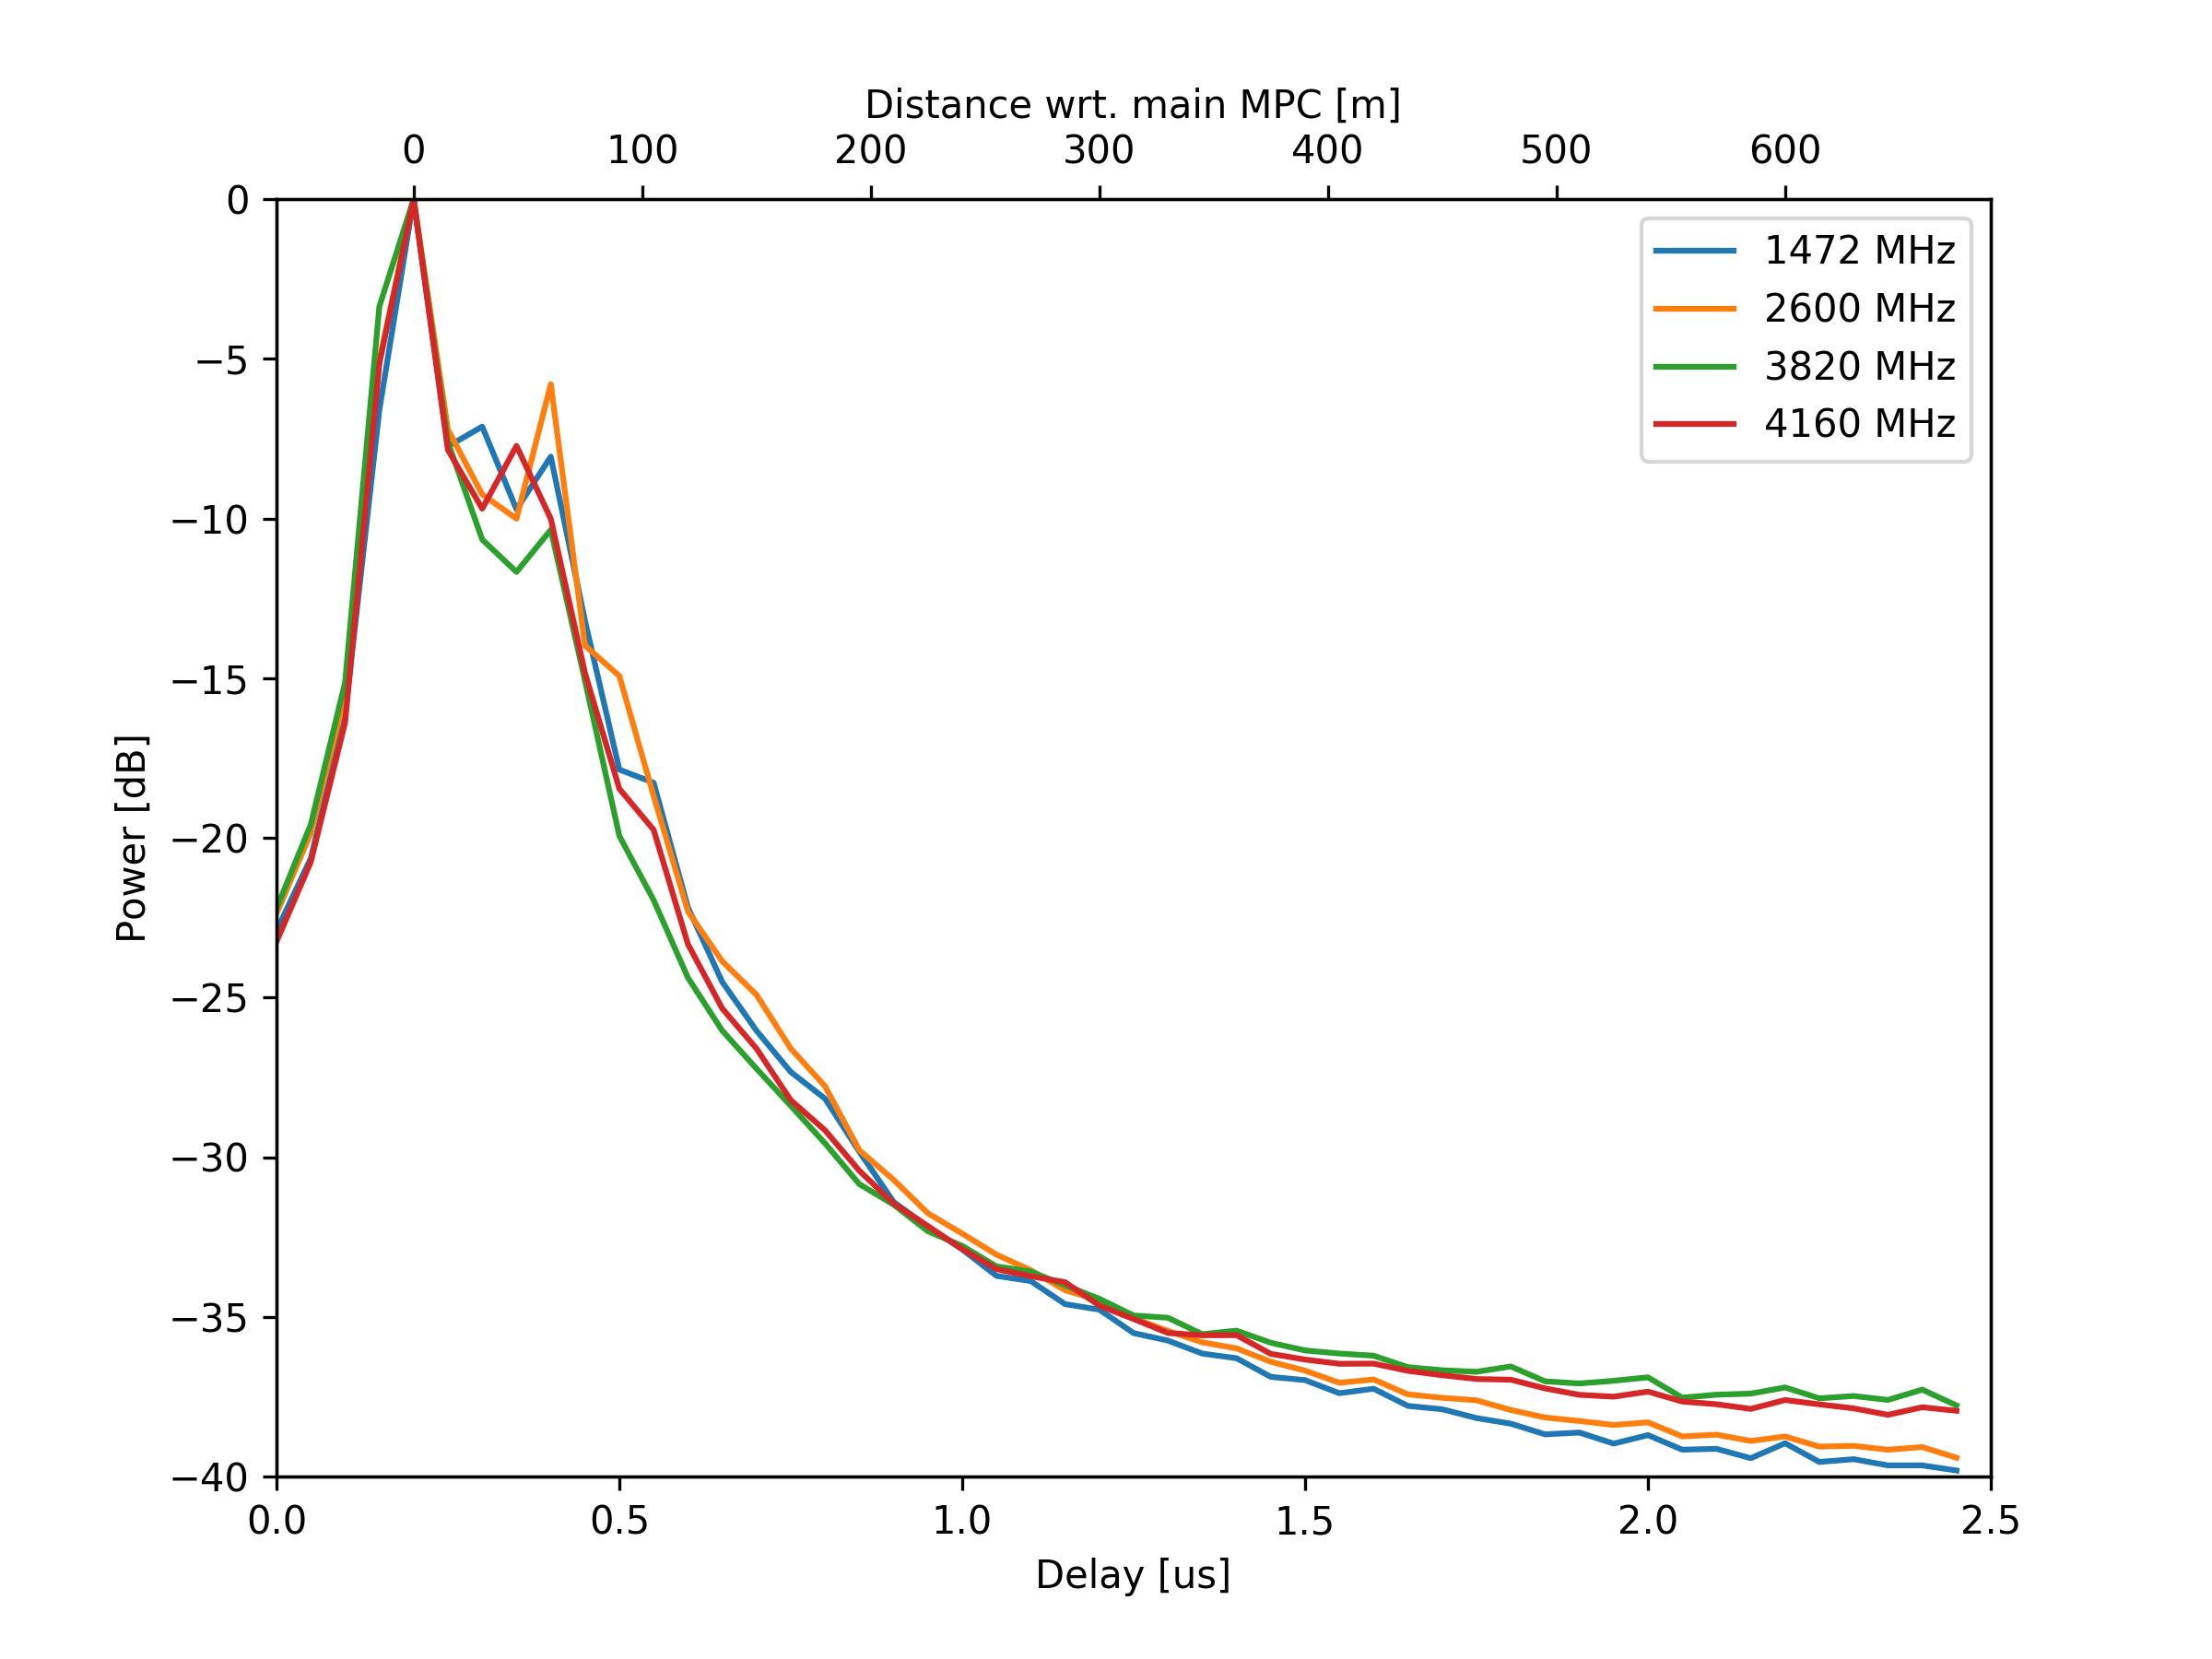
Fig. 5 represents normalized power delay profiles for all measured SISO channels by averaging over the realizations for all UEs and BS antennas. At least two multi path components (MPCs) are clearly resolved for the observation bandwidth of the user. Nonetheless, most power is confined in a delay window of . Considering that minimal power is captured outside of that window gives rise to suppress everything outside of a window for the equivalent channel. Artifacts of the IDFT at the delay border and noise contributions are therefore reduced.

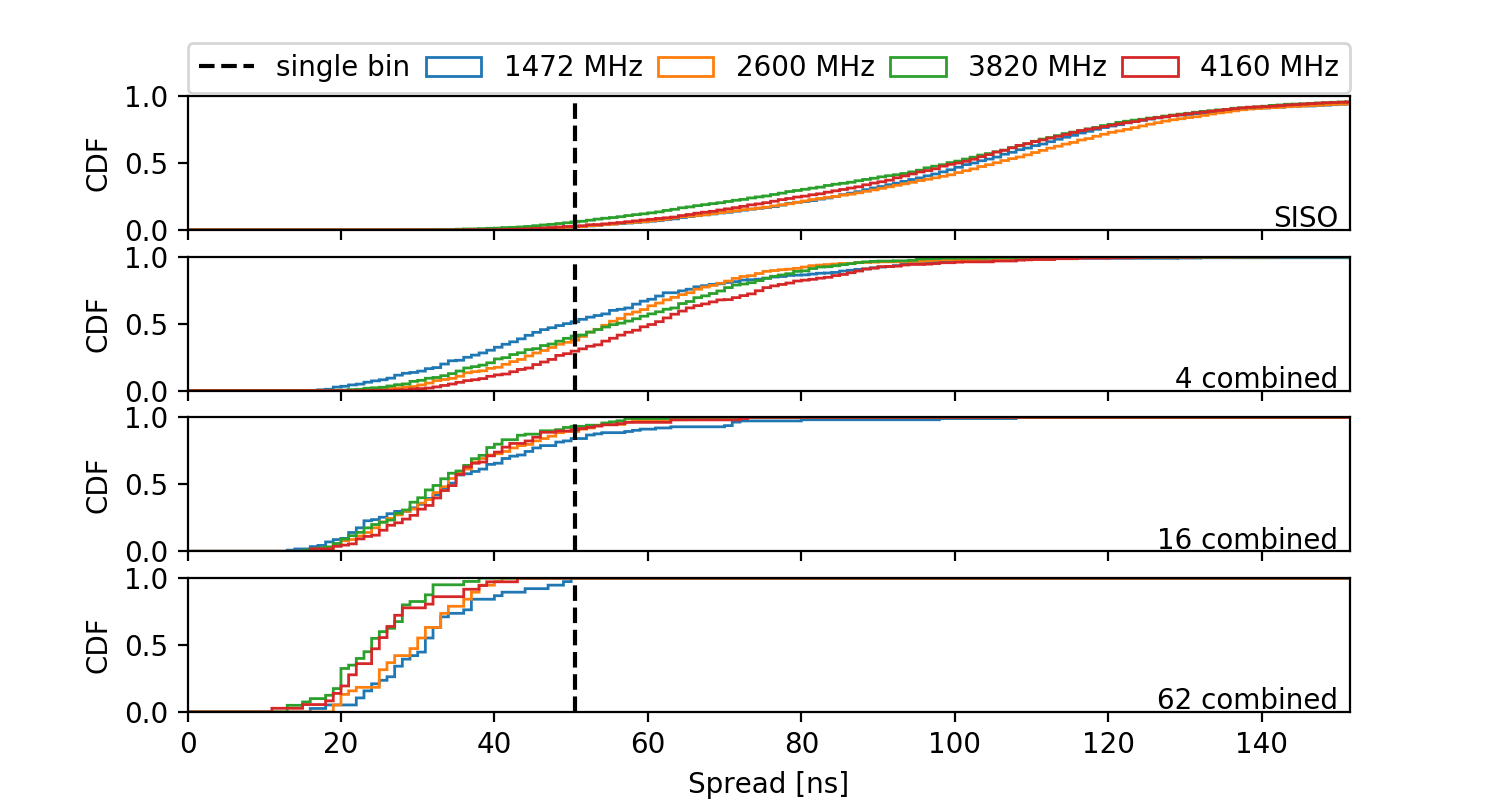
Fig. 6 shows the histogram approximated cumulative distribution function (CDF) of the rms delay spread. All considered bands for the SISO case as well as combinations of 4, 16 and 62 antennas are shown. The combinations for the smaller numbers were drawn from similar subsets of consecutive close antenna elements in the subarrays. The two excluded RX reduce the number of realizations slightly but the overall behaviour for an increasing number of combined antennas is still captured.

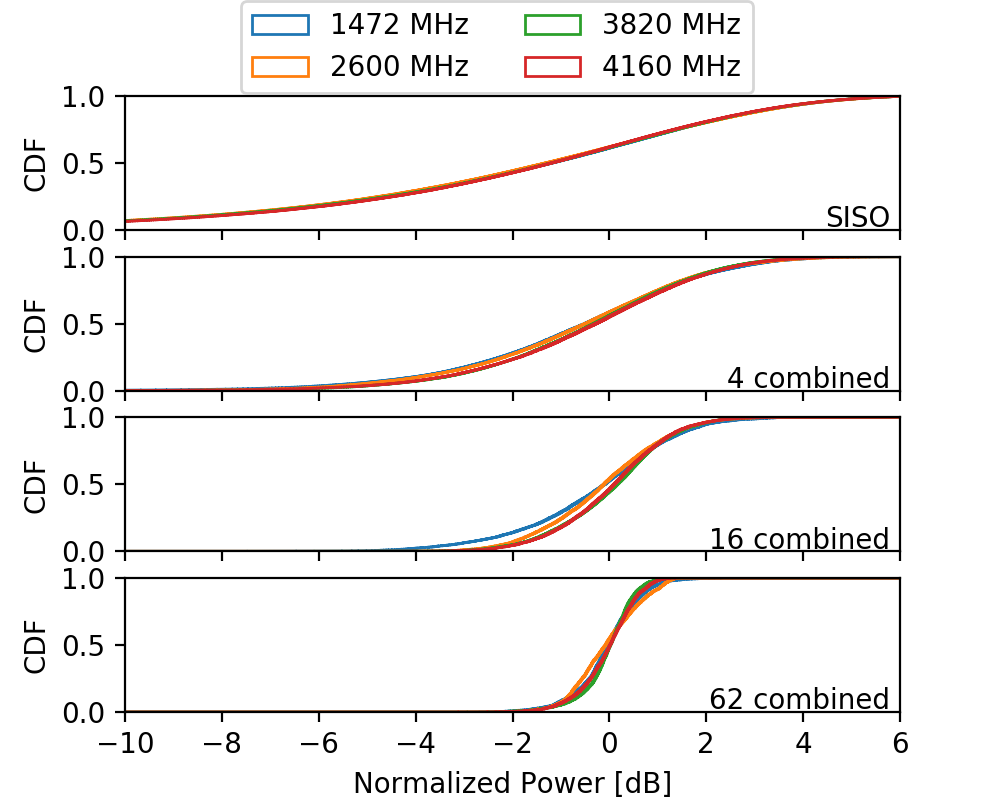
Similarly, Fig. 7 shows the behaviour of the ratio of the normalized subcarrier to average SISO power for the respective UE. This allows us to use all observations as realizations for the histogram approximated CDF of all . The drawn combinations are the same as in the rms delay spread analysis.

VI Conclusion
We have investigated a quasi-static indoor radio environment over four frequency bands in the range from . The measurements contain 40 single user realizations against a 64 element antenna array BS to elucidate channel hardening in both the delay and the frequency domain. The rms delay spread and the normalized subcarrier to average SISO power ratio of the equivalent radio channel were described as physically motivated figures of merit for the WSN case.
Both merits are showing similar behaviour over all measured frequency bands. Considering the inter-element spacing of the antenna arrays (about between used LPDAs) being already larger then half the wavelength at the lowest frequency band, gives rise to the assumption that the correlation between the elements at the BS is sufficiently small for all measured cases. Hence, the spatial sampling of the incoming waves is de-correlated enough to show similar properties in the equivalent channel for all bands.
Analysis of the equivalent channel delay spread shows that 16 antennas configured in a single subarray are a good compromise to allow for a single tap RX on the UE side for the considered bandwidth whilst the remainder of the large BS array can be considered advantageous for a multi-user massive MIMO system. Similar conclusions can be drawn for the reliability of links over the equivalent channel since their observed fading dips approach a lower bound of about for 16 antennas. The latter allows to relax the fading margin of a link budget for a WSN and can be used to reduce power requirements at the sensor side without sacrificing reliability constraints.
To summarize, channel hardening has been found to be a substantial property of single input multiple output (SIMO)/multiple input single output (MISO) equivalent channels showing a remarkable impact by combining only 16 antennas. Further, there was no significant frequency dependency observed over the considered bands with the ReRaNP testbed. Future work will investigate the multi-user capabilities for the reported scenario.
References
- [1] S. Malkowsky, J. Vieira, L. Liu, P. Harris, K. Nieman, N. Kundargi, I. C. Wong, F. Tufvesson, V. Owall, and O. Edfors, “The World’s First Real-Time Testbed for Massive MIMO: Design, Implementation, and Validation,” IEEE Access, vol. 5, pp. 9073–9088, 2017.
- [2] F. Rusek, D. Persson, Buon Kiong Lau, E. G. Larsson, T. L. Marzetta, and F. Tufvesson, “Scaling Up MIMO: Opportunities and Challenges with Very Large Arrays,” IEEE Signal Process. Mag., vol. 30, no. 1, pp. 40–60, Jan. 2013.
- [3] H. Q. Ngo and E. G. Larsson, “No Downlink Pilots Are Needed in TDD Massive MIMO,” IEEE Trans. Wireless Commun., vol. 16, no. 5, pp. 2921–2935, May 2017.
- [4] E. Björnson, E. G. Larsson, and T. L. Marzetta, “Massive MIMO: ten myths and one critical question,” IEEE Commun. Mag., vol. 54, no. 2, pp. 114–123, Feb. 2016.
- [5] H. Q. Ngo, E. G. Larsson, and T. L. Marzetta, “Aspects of favorable propagation in Massive MIMO,” in Proceedings of the 22nd European Signal Processing Conference (EUSIPCO), 2014, Lisbon, Portugal, Sep. 2014.
- [6] P. Harris, S. Zhang, M. Beach, E. Mellios, A. Nix, S. Armour, A. Doufexi, K. Nieman, and N. Kundargi, “LOS Throughput Measurements in Real-Time with a 128-Antenna Massive MIMO Testbed,” in 2016 IEEE Global Communications Conference (GLOBECOM). IEEE, Dec. 2016, pp. 1–7.
- [7] X. Gao, O. Edfors, F. Rusek, and F. Tufvesson, “Massive MIMO Performance Evaluation Based on Measured Propagation Data,” IEEE Trans. Wireless Commun., vol. 14, no. 7, pp. 3899–3911, Jul. 2015.
- [8] P. Harris, S. Malkowsky, J. Vieira, E. Bengtsson, F. Tufvesson, W. B. Hasan, L. Liu, M. Beach, S. Armour, and O. Edfors, “Performance Characterization of a Real-Time Massive MIMO System With LOS Mobile Channels,” IEEE J. Sel. Areas Commun., vol. 35, no. 6, pp. 1244–1253, Jun. 2017.
- [9] J. Flordelis, X. Gao, G. Dahman, F. Rusek, O. Edfors, and F. Tufvesson, “Spatial separation of closely-spaced users in measured massive multi-user MIMO channels,” in 2015 IEEE International Conference on Communications (ICC). IEEE, Jun. 2015, pp. 1441–1446.
- [10] J. Li, B. Ai, R. He, K. Guan, Q. Wang, D. Fei, Z. Zhong, Z. Zhao, D. Miao, and H. Guan, “Measurement-Based Characterizations of Indoor Massive MIMO Channels at 2 GHz, 4 GHz, and 6 GHz Frequency Bands,” in 2016 IEEE 83rd Vehicular Technology Conference (VTC Spring). IEEE, May 2016, pp. 1–5.
- [11] H. El-Sallabi, P. Kyritsi, A. Paulraj, and G. Papanicolaou, “Experimental Investigation on Time Reversal Precoding for Space–Time Focusing in Wireless Communications,” IEEE Trans. Instrum. Meas., vol. 59, no. 6, pp. 1537–1543, Jun. 2010.
- [12] S. Payami and F. Tufvesson, “Delay spread properties in a measured massive MIMO system at 2.6 GHz,” in 2013 IEEE 24th Annual International Symposium on Personal, Indoor, and Mobile Radio Communications (PIMRC). IEEE, Sep. 2013, pp. 53–57.
- [13] “Introduction to the NI MIMO Prototyping System Hardware,” Dec. 2017. [Online]. Available: http://www.ni.com/white-paper/53197/en/
- [14] “USRP-2953 Specifications.” [Online]. Available: http://www.ni.com/pdf/manuals/374197d.pdf