Extreme wave events for a nonlinear Schrödinger equation with linear damping and Gaussian driving
Abstract
We perform a numerical study of the initial-boundary value problem, with vanishing boundary conditions, of a driven nonlinear Schrödinger equation (NLS) with linear damping and a Gaussian driver. We identify Peregrine-like rogue waveforms, excited by two different types of vanishing initial data decaying at an algebraic or exponential rate. The observed extreme events emerge on top of a decaying support. Depending on the spatial/temporal scales of the driver, the transient dynamics – prior to the eventual decay of the solutions – may resemble the one in the semiclassical limit of the integrable NLS, or may, e.g., lead to large-amplitude breather-like patterns. The effects of the damping strength and driving amplitude in suppressing or enhancing respectively the relevant features, as well as of the phase of the driver in the construction of a diverse array of spatiotemporal patterns, are numerically analyzed.
I Introduction
The nonlinear Schrödinger (NLS) equation
| (1) |
is one of the universal evolution equations with a multitude of applications relevant to nonlinear wave propagation (from nonlinear optics and Bose-Einstein condensates, to plasma physics and deep water waves) Ablo ; ablo2 . Its counterparts which may incorporate damping, external driving or nonlinear gain /loss effects, define a fundamental class of infinite dimensional dynamical systems which may exhibit complex spatiotemporal behaviour. In particular, the linearly damped and driven NLS equation, expressed in dimensionless form:
| (2) |
is one of the prototypical partial differential equations which may demonstrate rich and complex dynamics NB86 ; CLM . Here, stands for the driving (or forcing) of the system, while accounts for linear damping of strength ; thus, Eq. (2) defines a non-autonomous perturbation of the integrable NLS (1) (, ), nobe1 ; nobe2 ; Li ; Wig1 ; kai ; eli . Generically, the complex dynamics of the system is captured by its global attractor, Ghid88 ; XW95 ; Goubet1 ; Goubet2 ; Goubet3 ; Goubet2a ; Lauren95 .
In the present study on Eq. (2), we continue our explorations All2 ; ZNA2019 on the robustness of extreme wave events and rogue waves k2a ; k2b ; k2c ; k2d , in the presence of non-integrable perturbations of the integrable NLS (1). We recall that in this limit, the manifestation of such events is described by the class of rational solutions such as the Peregrine rogue wave (PRW) and the Akhmediev and Kuznetsov–Ma (KMb) breathers H_Peregrine ; kuz ; ma ; akh ; dt . The study of this class of solutions, and accordingly, the question of their persistence under the influence of additional physically realistic mechanisms is of substantial interest, as such extreme waveforms have been identified experimentally in numerous physical contexts hydro ; opt2 ; laser ; He ; plasma , beyond their (often disastrous) appearance in the oceans. These effects may be described by correction terms ranging from those incorporating higher-order derivatives, to time-dependent coefficients associated to dispersion and nonlinearity management. The same persistence question has been investigated also for coupled systems. For results in the above directions, we refer to devine ; NR4Anki ; NR5Wang ; NRbor6 ; NRbor5a ; calinibook ; BorPT ; BorCD ; BorMAN ; BorDPJ and references therein. However, to the best of our knowledge, very little seems to be known for the damped and forced model (2), particularly in the case of a spatiotemporally localized external forcing that we will consider herein.
We will touch upon this significant problem by numerically simulating the initial-boundary value problem of Eq. (2), for vanishing boundary conditions: , . More precisely, we consider two types of vanishing initial data: The first are decaying algebraically (at a quadratic decay rate), and the second exponentially (possessing a -profile). The aim is to examine the effect of the rate of decay of the initial condition in the dynamics. Regarding the form of the driving, we will consider the case of a Gaussian profile. This is a second, physically relevant example of a driver we consider in our studies on Eq. (2), since, in our recent work ZNA2019 , we examined the case of time-periodic forcing. Concerning the magnitudes of the damping and forcing, we will use , and forcing amplitude ; such a choice may describe a simplified effect of wave amplification against small fluid viscosity Kharif1 ; Kharif2 .
Our main findings can be summarized as follows. First, we find that PRW-solitonic structures, with profiles remarkably close to the analytical PRW of the integrable limit, emerge on top of a spatially extended and decaying support, formed at the initial stages of the evolution. Second, we find that the subsequent dynamics remains proximal to that of the semi-classical limit of the NLS
| (3) |
for BM1 ; BM2 , when supplemented with vanishing boundary conditions. Spatiotemporal regions of distinct asymptotic regimes, separated by curves in the -plane (known as nonlinear caustics), are identified; these curves bound the region where the space-time oscillations occur. Remarkably, this semi-classical type dynamics is found to be persistent. This is so for certain spatiotemporal scales where the spatial width of the driver dominates over its temporal width – even far from the integrable limit. This phenomenology differs nontrivially from the one observed in ZNA2019 in the presence of a time-periodic forcing. Therein, PRW-type waveforms emerge on the top of a finite background as explained in terms of the modulation instability of continuous wave (cw) solutions of the model. Nevertheless, in both cases of driving, it is justified that the emergence of PRWs, excited by decaying initial conditions BM1 ; BM2 ; Rev1_b ; BS , is a universal outcome, being robust in the dynamics of the 1D-damped and forced NLS. Third, we examine the dependencies of various characteristics of the emerging PRW-type extreme events, on the type of decay of the initial condition, its width, as well as, the damping strength and forcing amplitude. One of the most interesting findings concerns the effect of the phase of the driver on the formation of the emergent spatiotemporal patterns. Fourth, as the temporal localization width of the forcing is increasing, the transient dynamics prior to decay, is manifested by the formation of almost time-periodic breathing modes of (extremely, in some cases) large amplitude. We also establish a strong connection between the spatial width of the driving and form/width of the emerging spatiotemporal patterns.
The paper is structured as follows. In Section II we report the results of our numerical simulations. First we provide some information about the initial conditions and the type of forcing we are going to consider in this investigation. After that, in Section II.1 we present our results on the emergence of extreme events, while in Section II.2 we examine the spatiotemporal patterns that appear in the dynamics of the system. Finally, in Section III, we summarize and discuss the implications of our results with an eye towards future work currently in progress.
II Numerical investigations
In this section, we present the results of our direct numerical simulations for Eq. (2), with the vanishing boundary conditions discussed above, and initial data distinguished by the rate of their decay. For instance, we shall consider a quadratically decaying initial condition
| (4) |
and an exponentially decaying initial condition of the form
| (5) |
The parameter , configures the width of the above “bright-soliton” initial profile. For the driving force, we assume the form of a Gaussian function, centered at , having spreads , with respect to the space and time variable, respectively:
| (6) |
The function , serves as a simple phenomenological example, of a spatiotemporal, exponentially localized driver, of amplitude . The role of the phase parameter will be further elucidated below.
The smallest value of the half-length of the spatial computational interval considered in the simulations is , so that effects that may be produced at the boundaries are negligible. The system is integrated by using both Runge–Kutta and pseudo-spectral schemes (see also ZNA2019 ), for both Dirichlet and periodic boundary conditions on . Note that, there were no noticeable differences between the dynamics produced by the two numerical methods.
II.1 Emergence of extreme wave events
Quadratically decaying initial condition.
We begin our numerical investigations by considering first the quadratically decaying initial condition (4). In order to characterize the observed spatiotemporally localized waveforms as extreme, we compare in certain time intervals, the numerical solution against the rescaled analytical PRW solution of the NLS (1) BS :
| (7) |
where stands for the power of the continuous wave background.
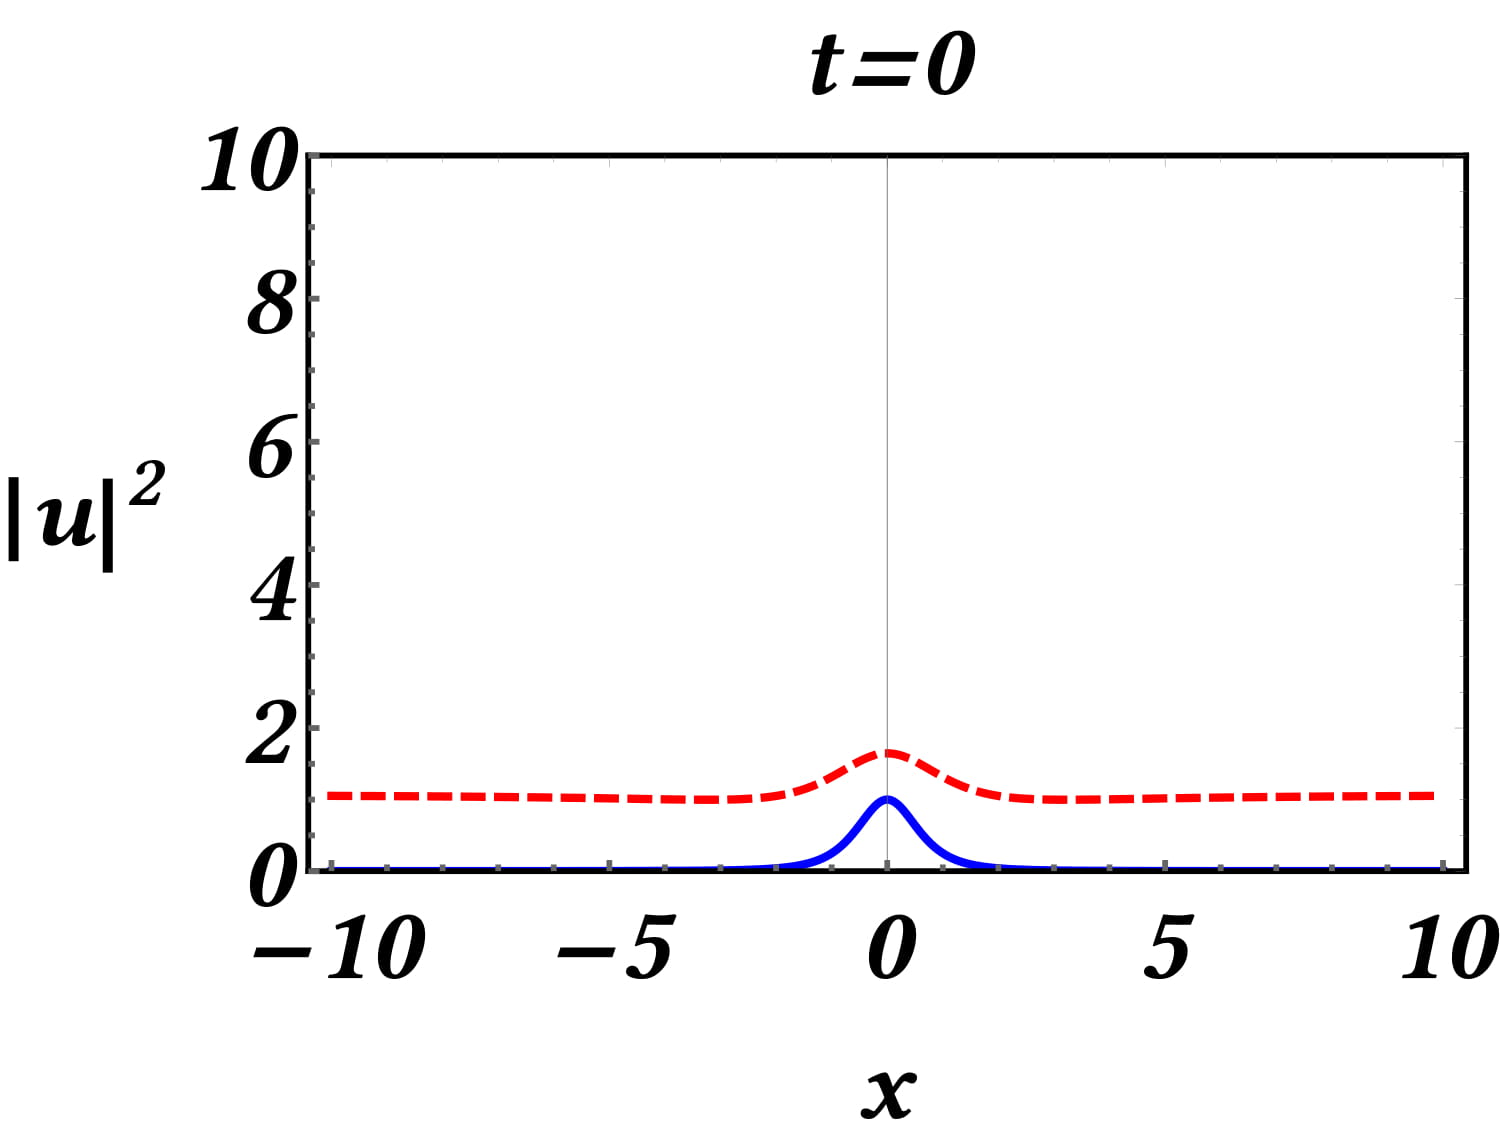
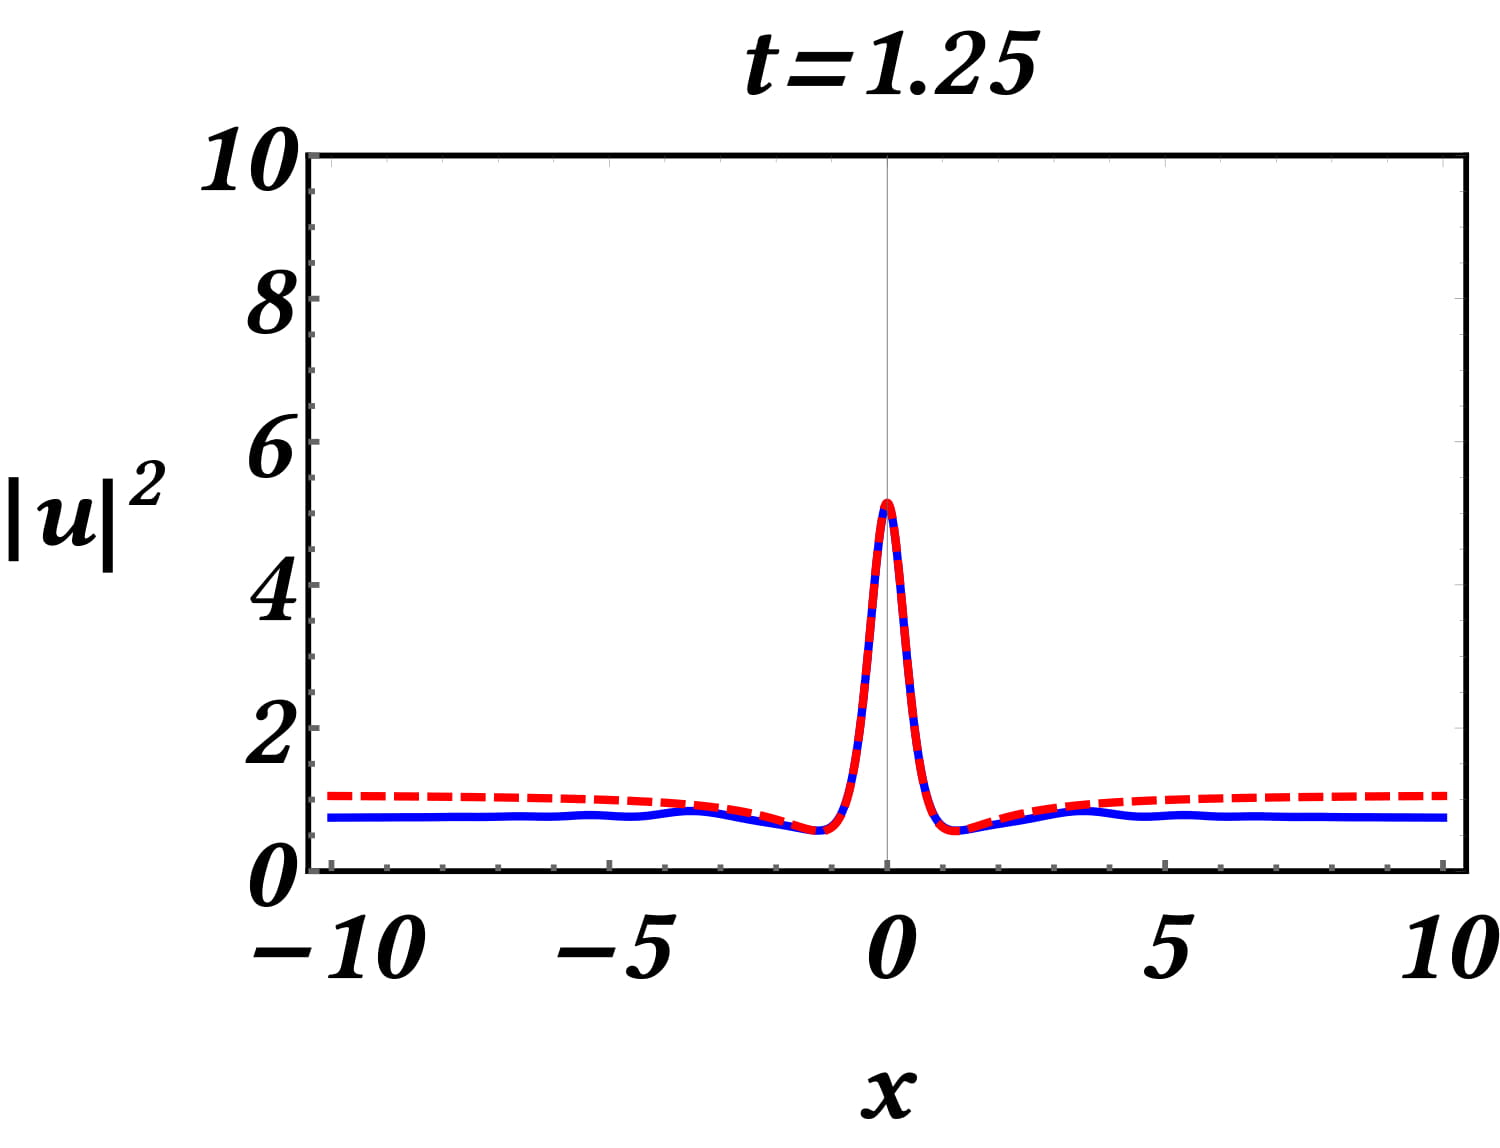
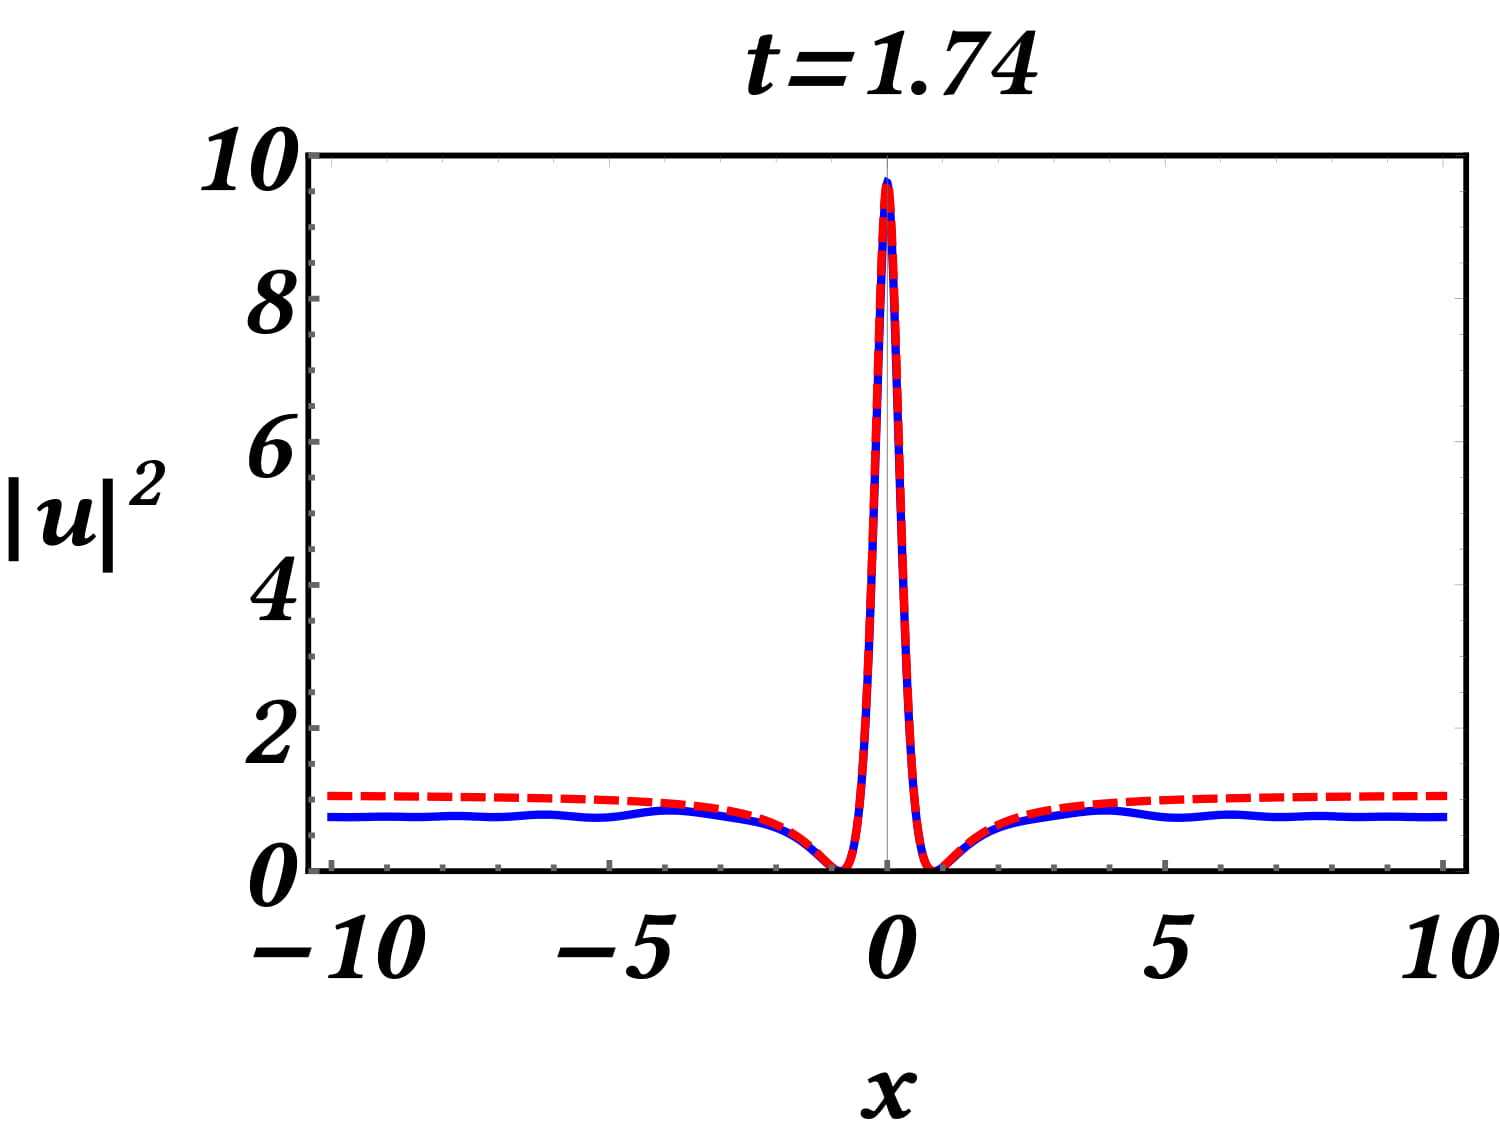
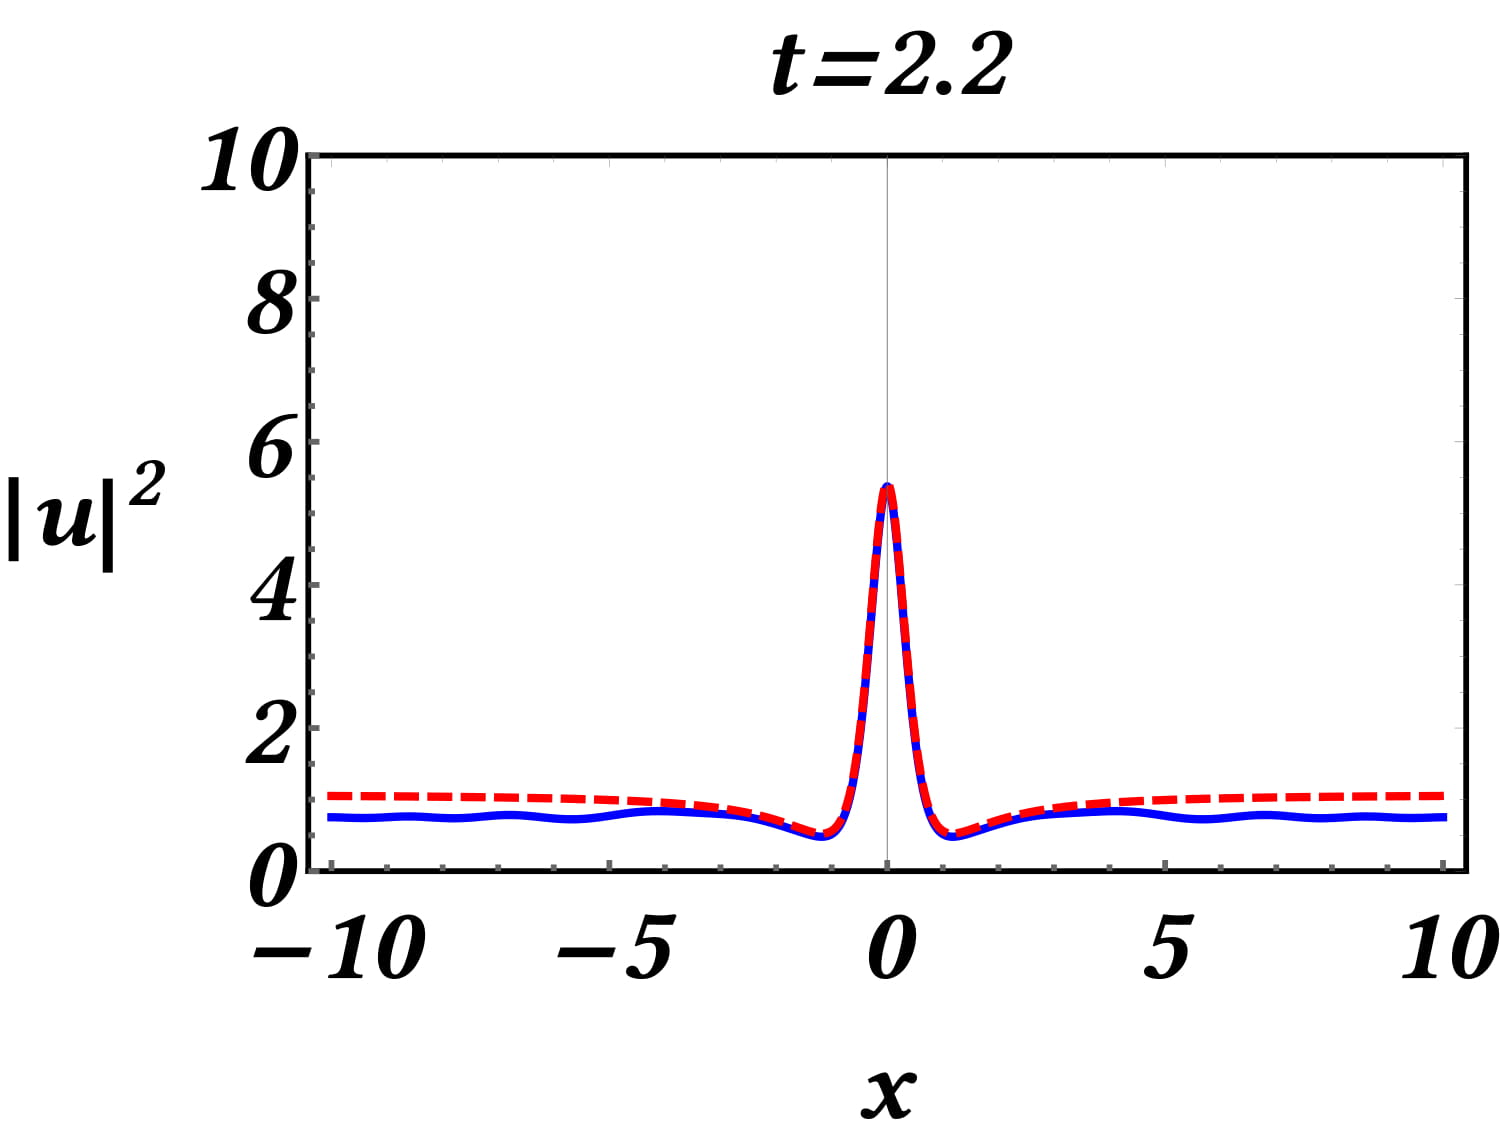
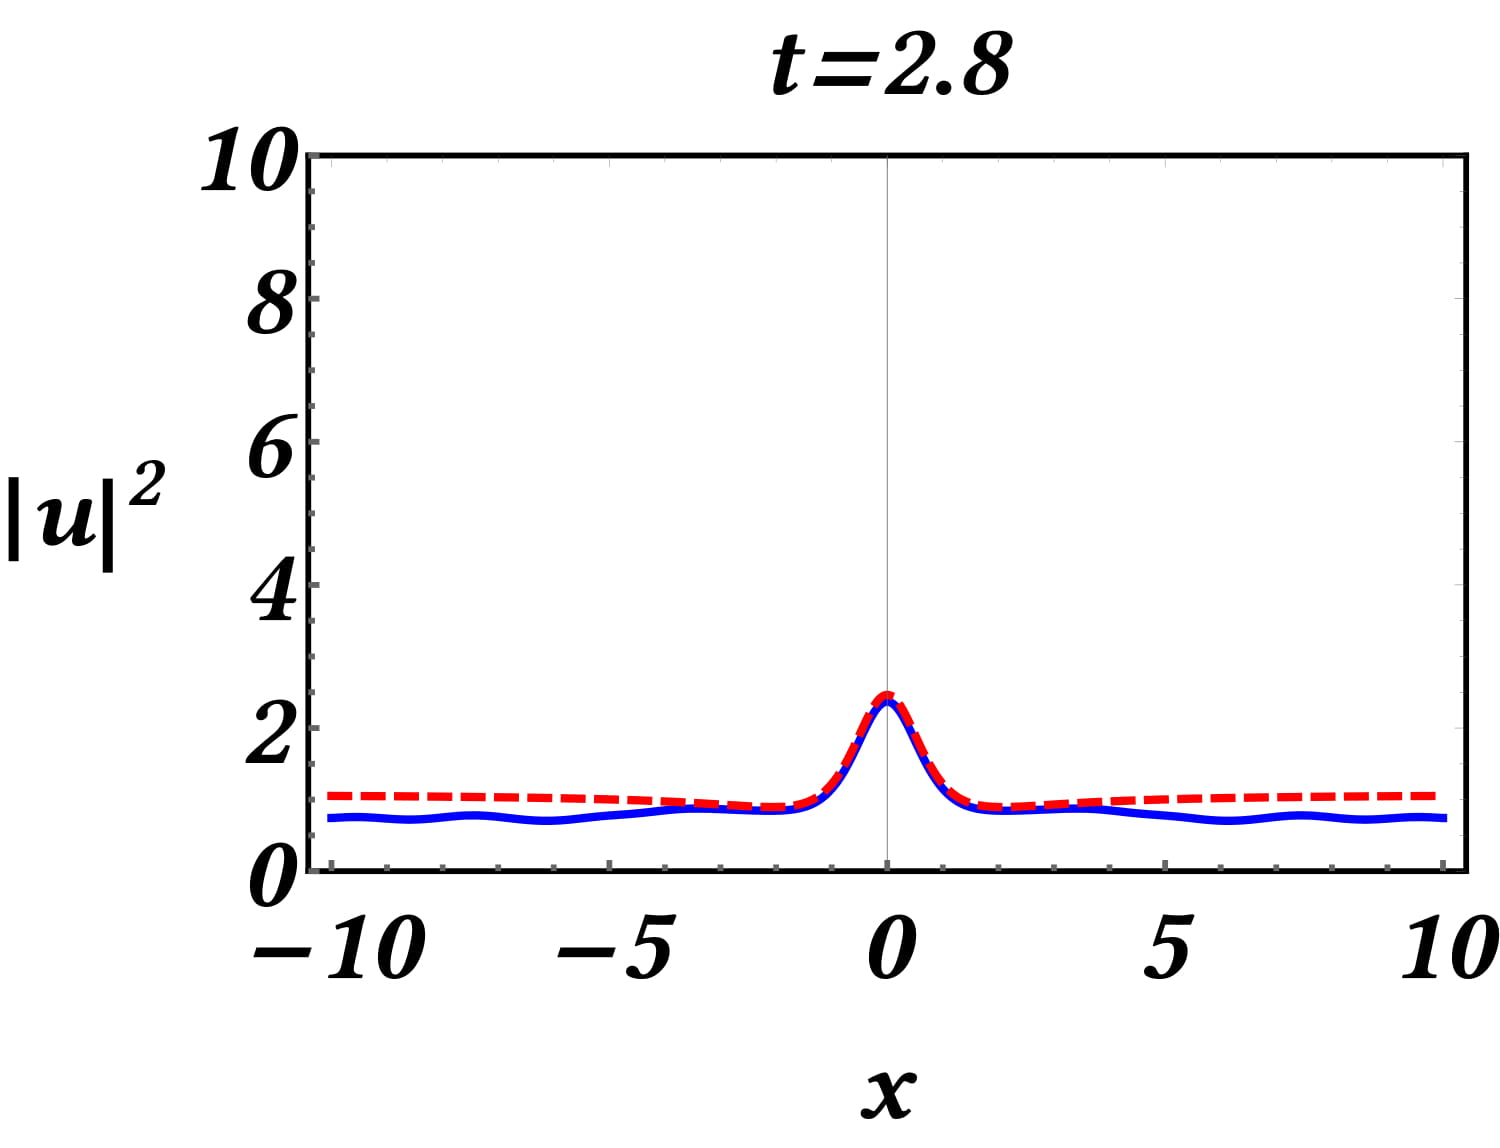
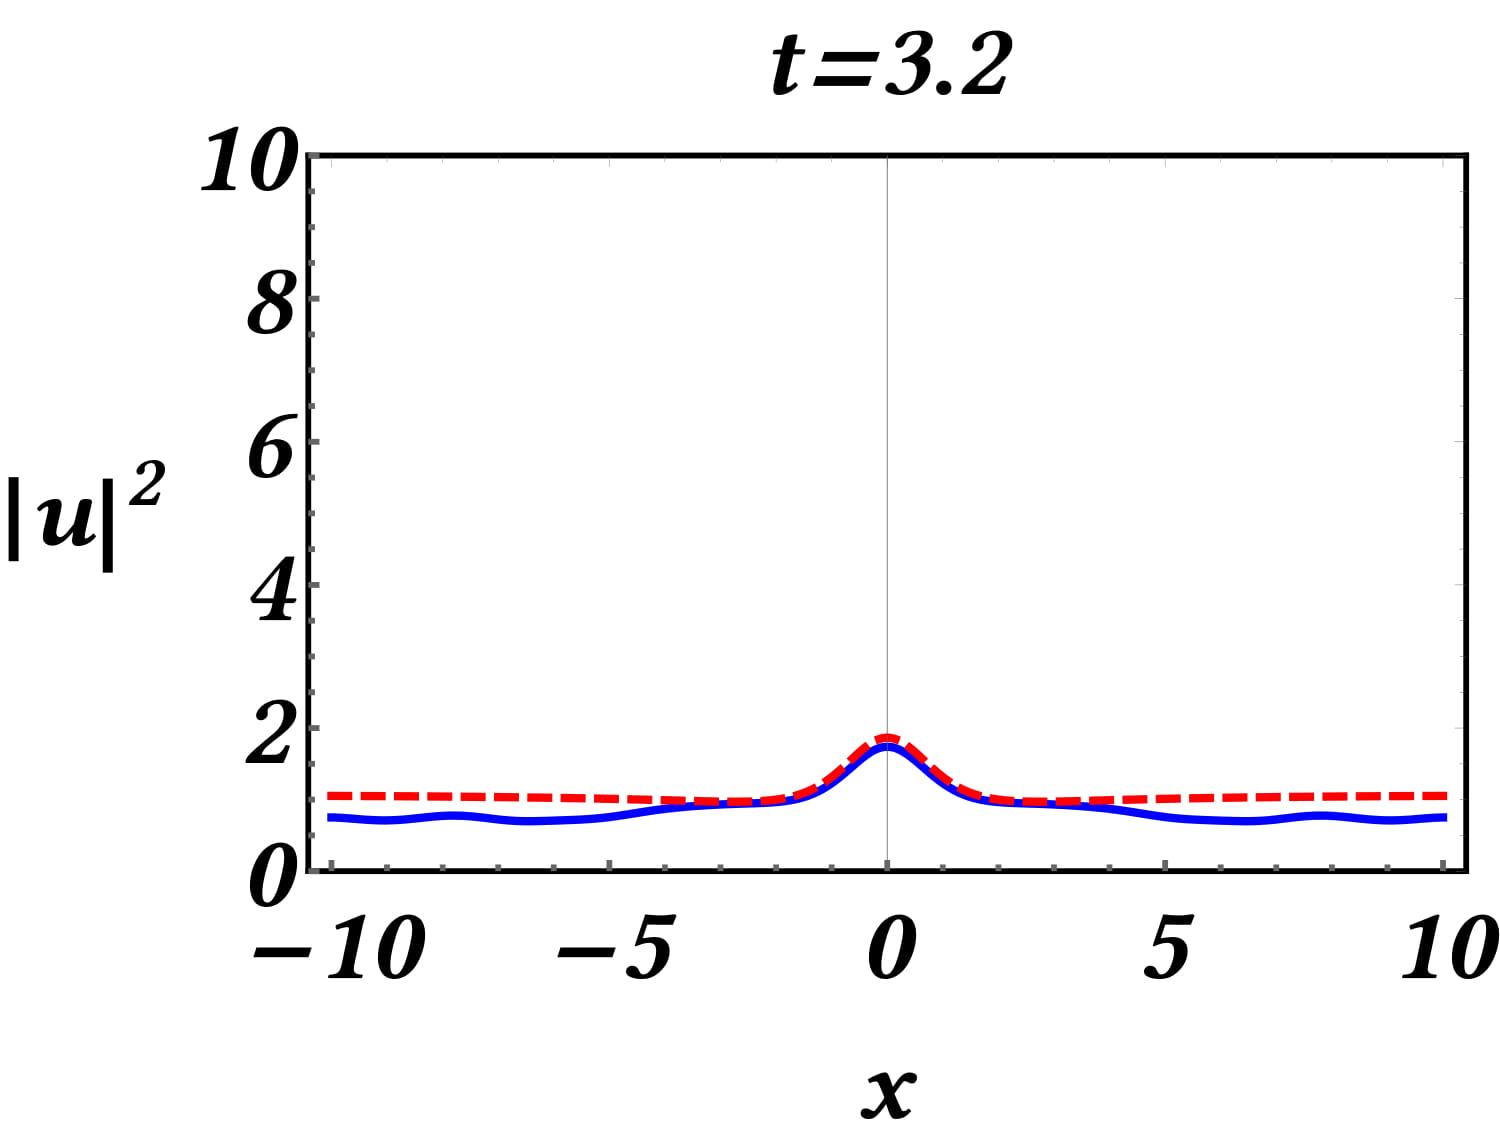
Figure 1, shows snapshots of the evolution of the density for damping strength , forcing amplitude and spreads , . We observe the emergence of a PRW solitonic waveform. The numerical solution is plotted by the continuous (blue) curve, against the dashed (red) curve depicting the evolution of the PRW-profile (7), . The maximum amplitude of the event is attained at . The snapshots, illustrate the time-growth and time decay of the solution and justify that its evolving profile is remarkably close to the analytical PRW of the integrable NLS (except for the region far from the core).
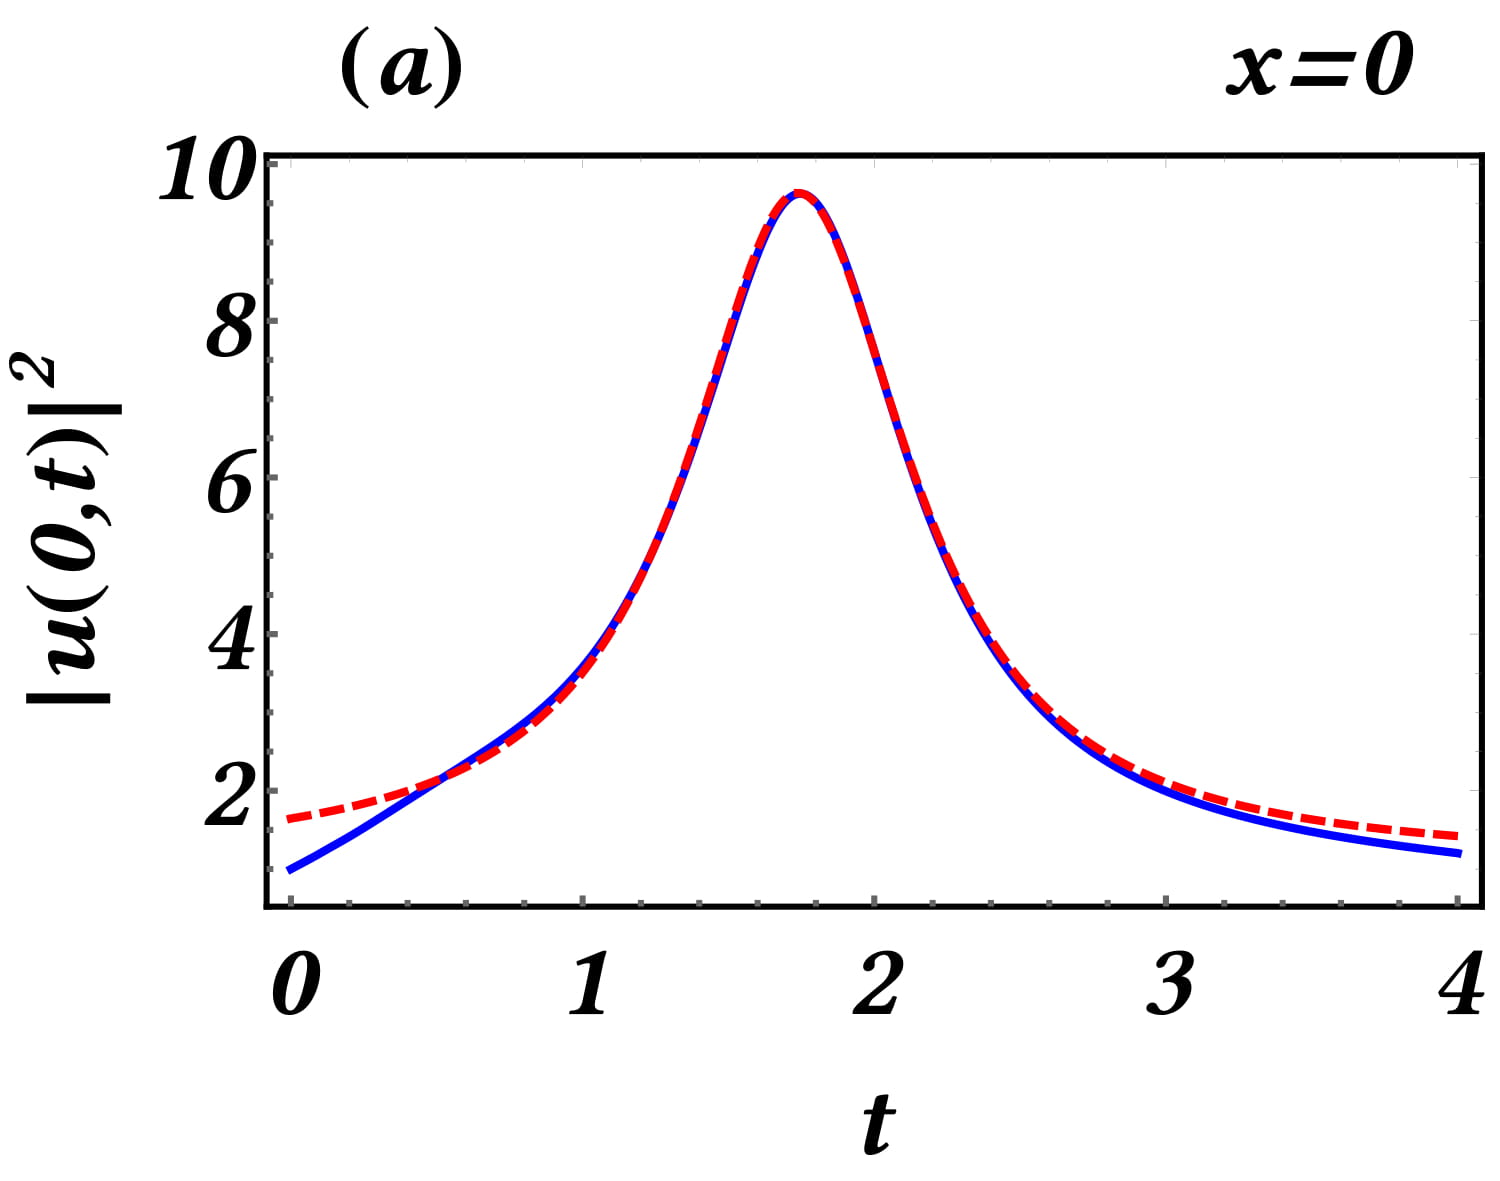
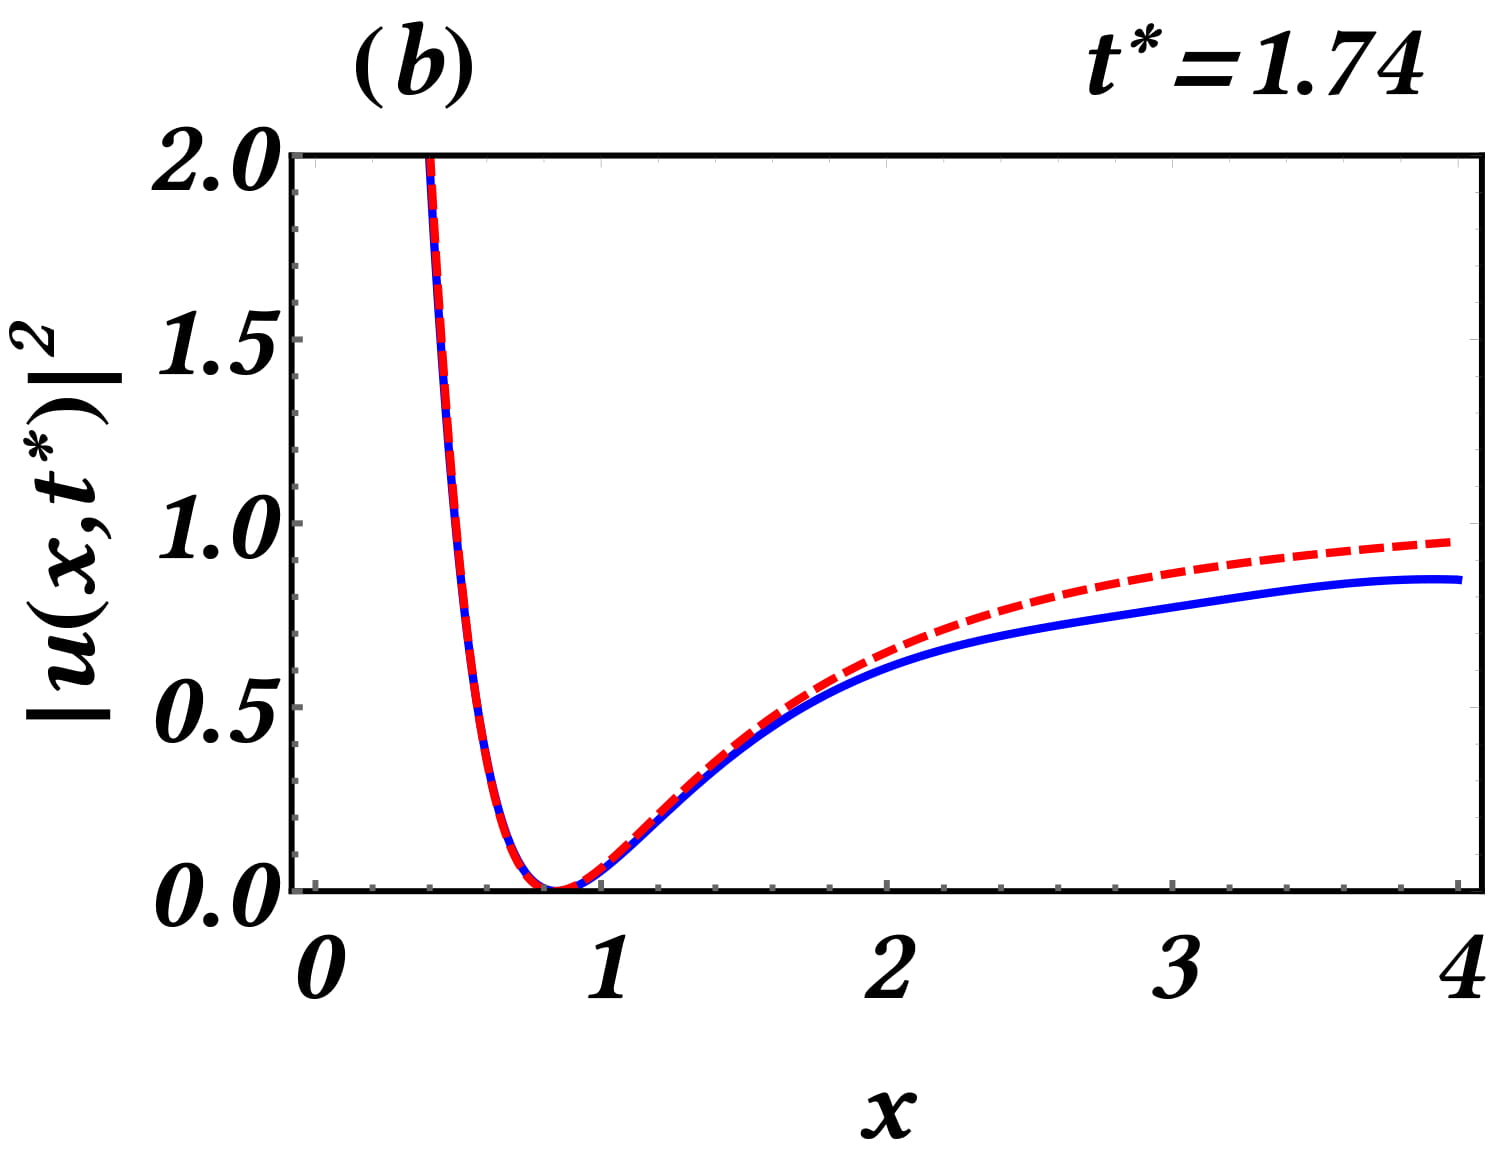
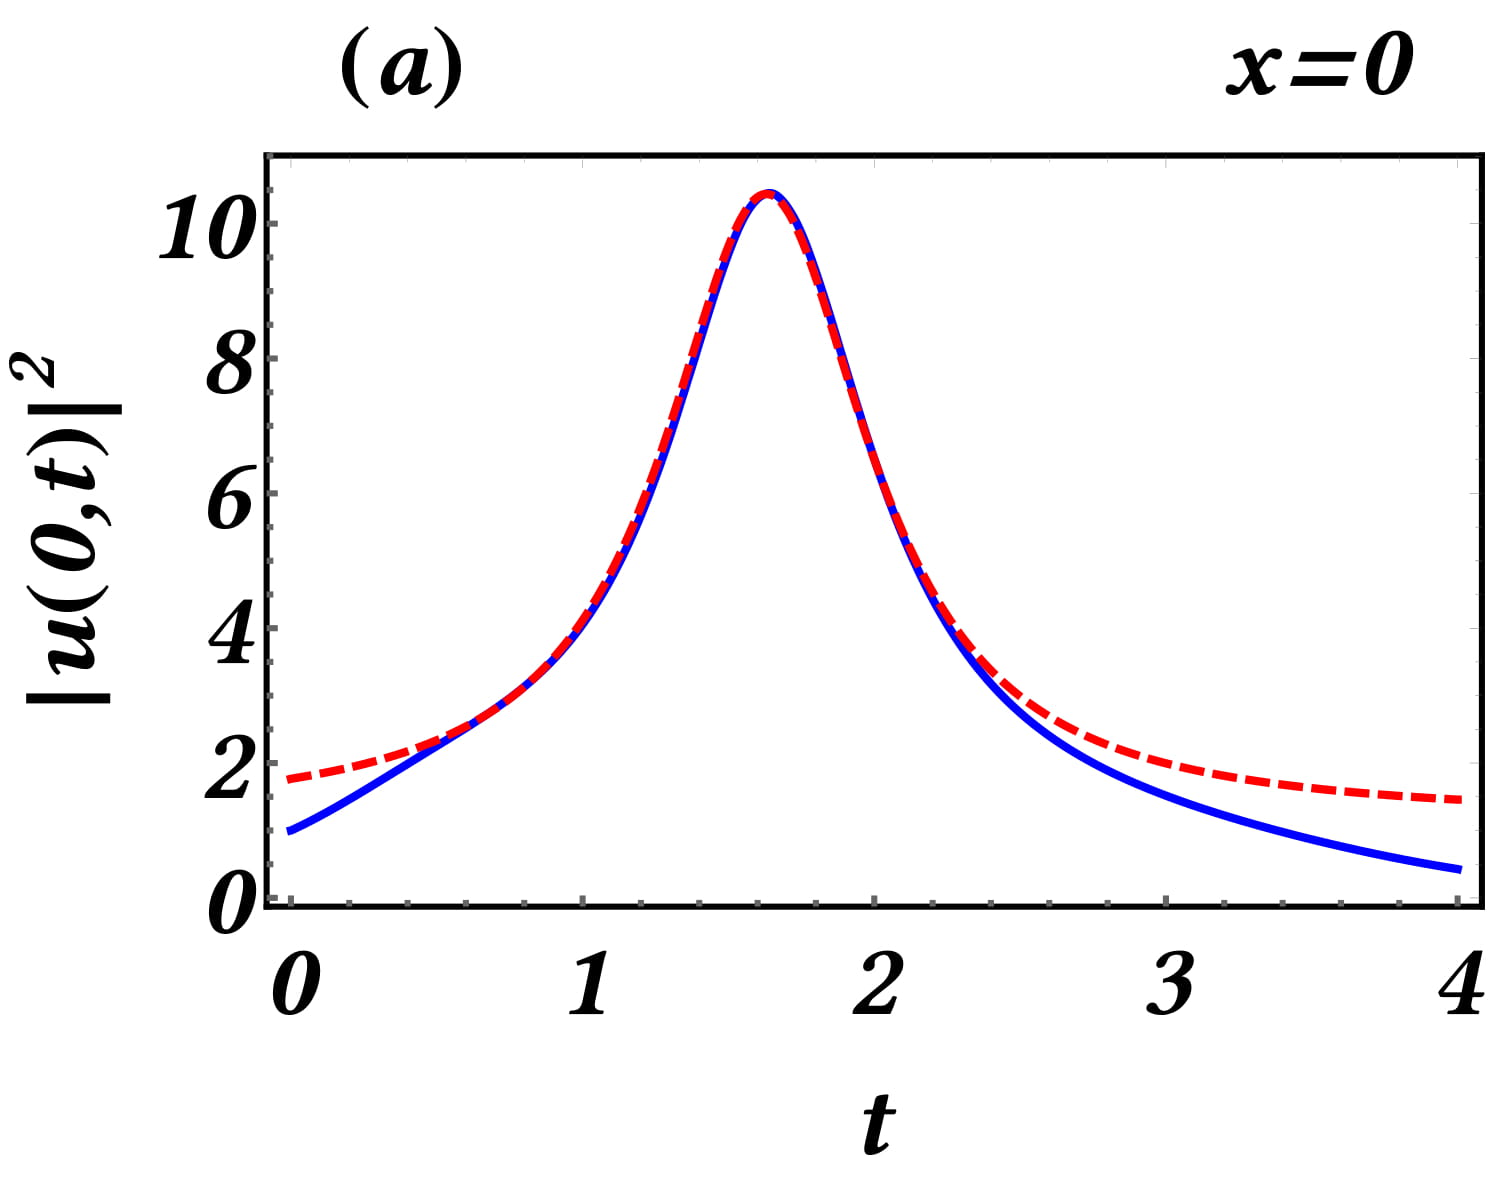
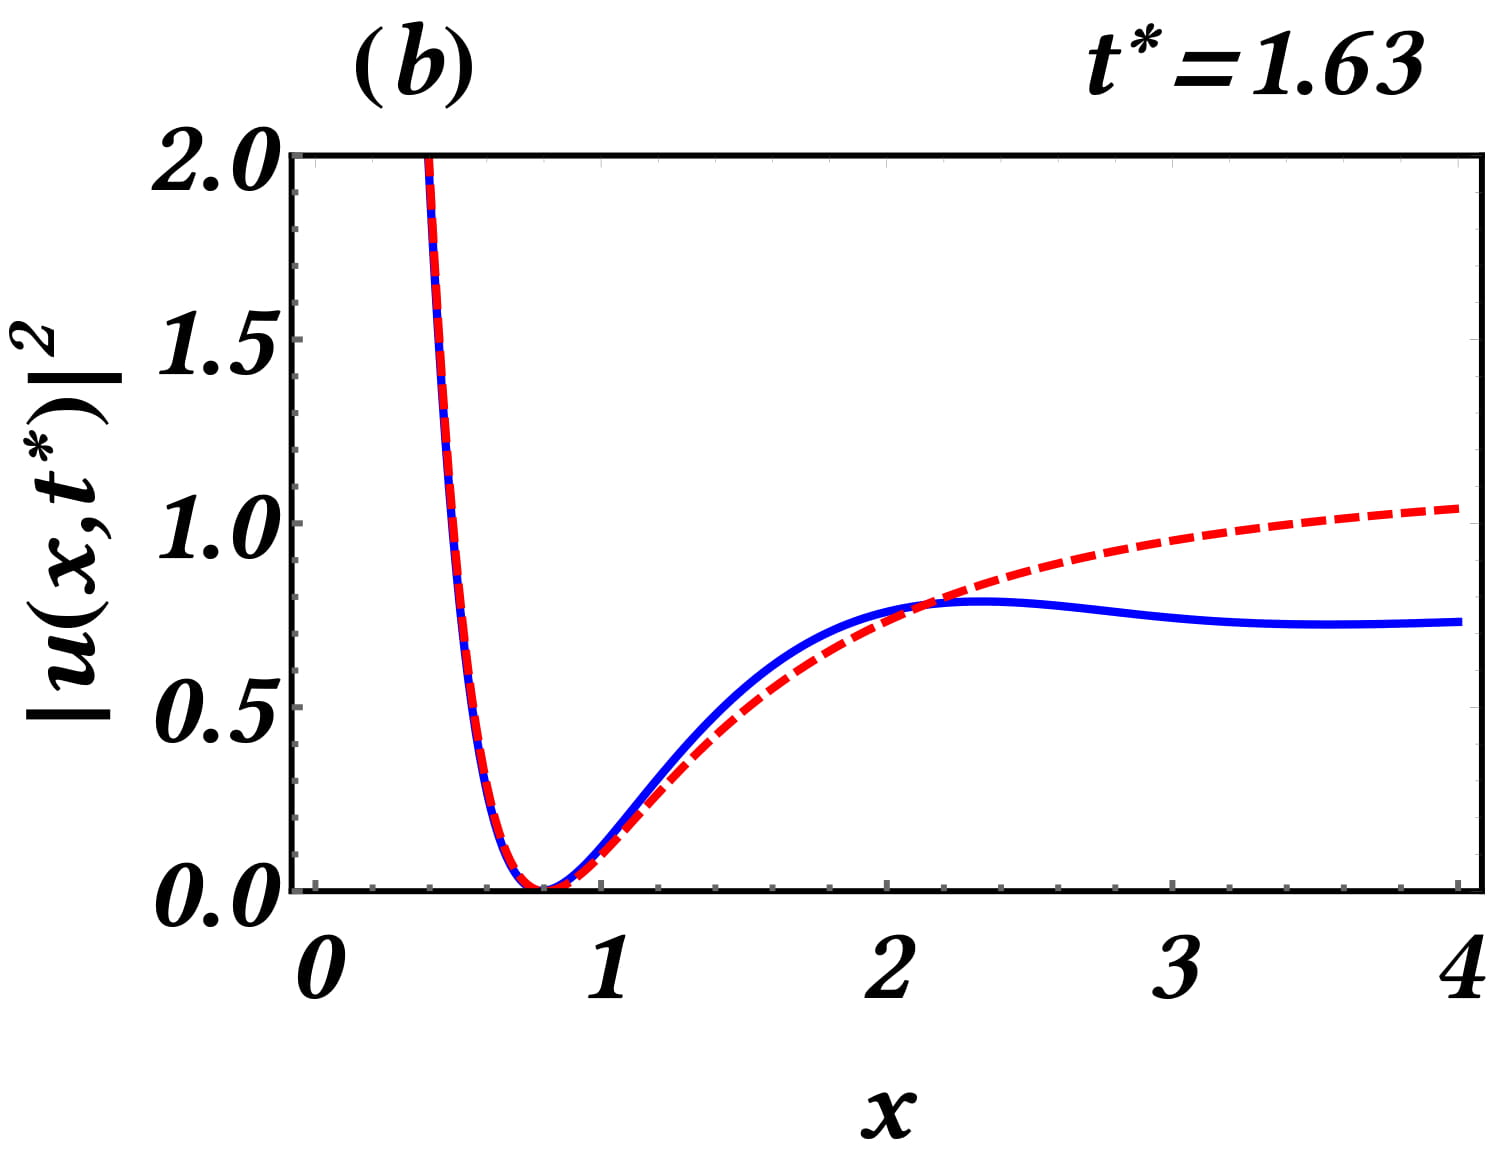
In particular, as shown in panel (a) of Fig. 2, for , the peak amplitude evolution is nearly indistinguishable from that of the corresponding member of the PRW family. Panel (b) of Fig. 2, shows a detail of the spatial profile of the maximum event at , close to the right of the two symmetric minima of the exact PRW . This detail illustrates that the emerged extreme event possesses an algebraic spatial decay rate close to that of the analytical PRW, at least near the minima.
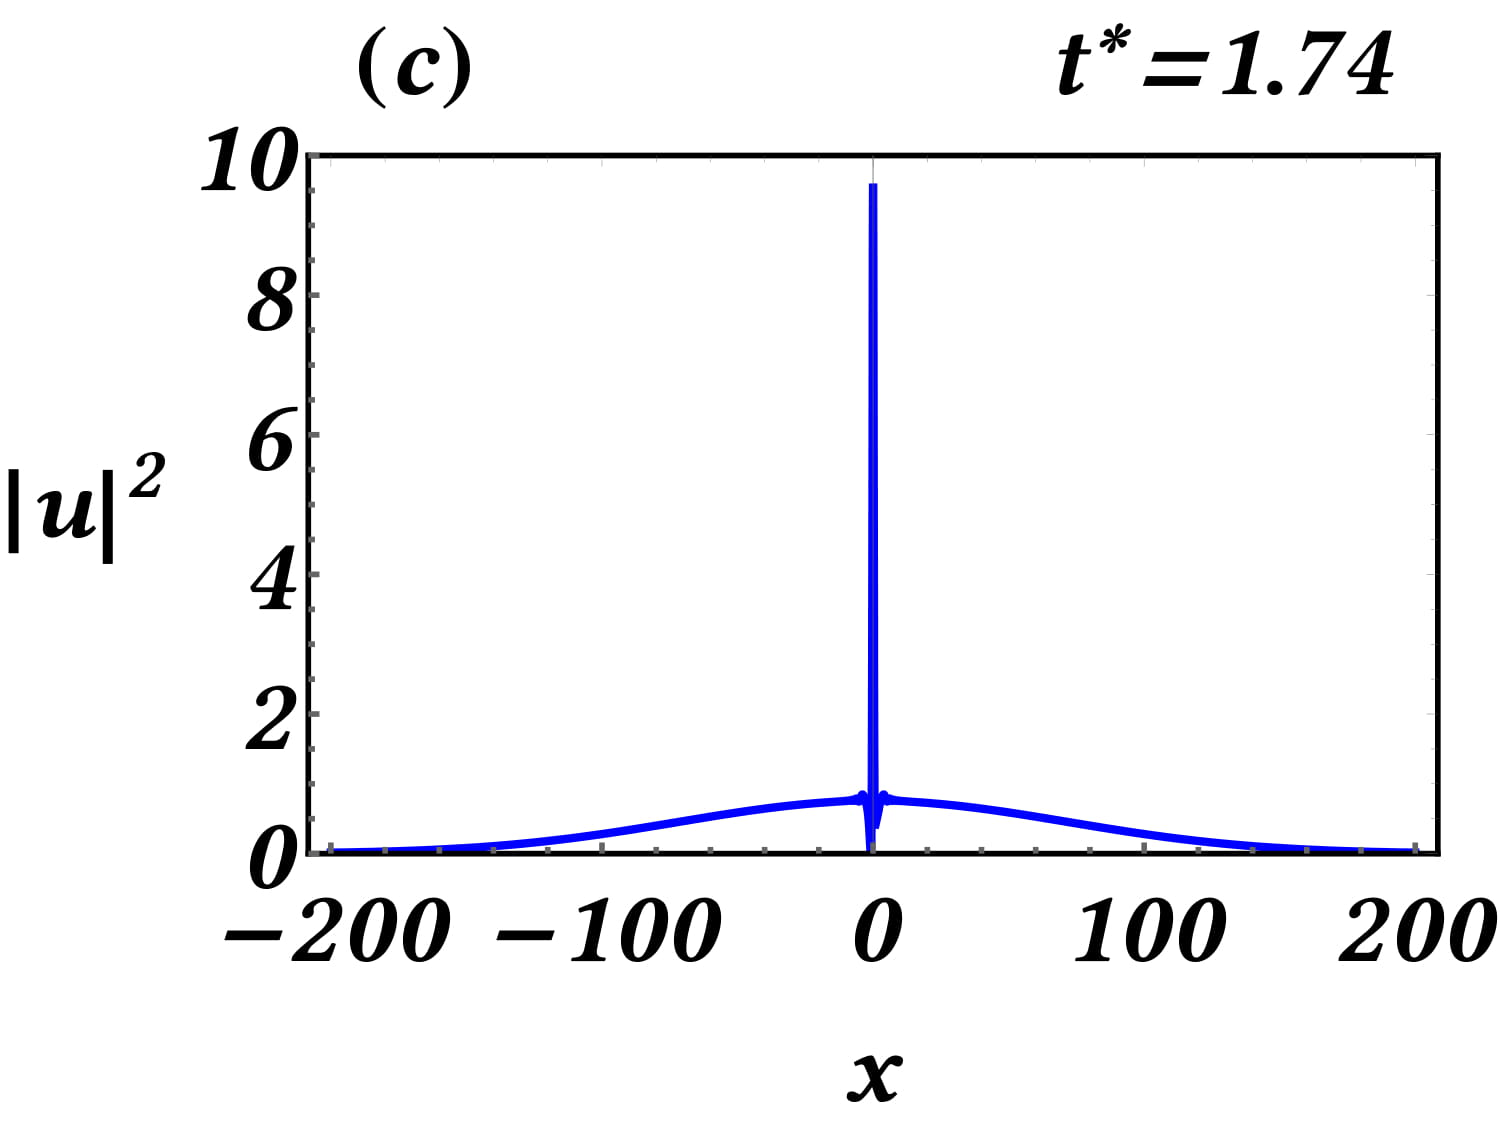
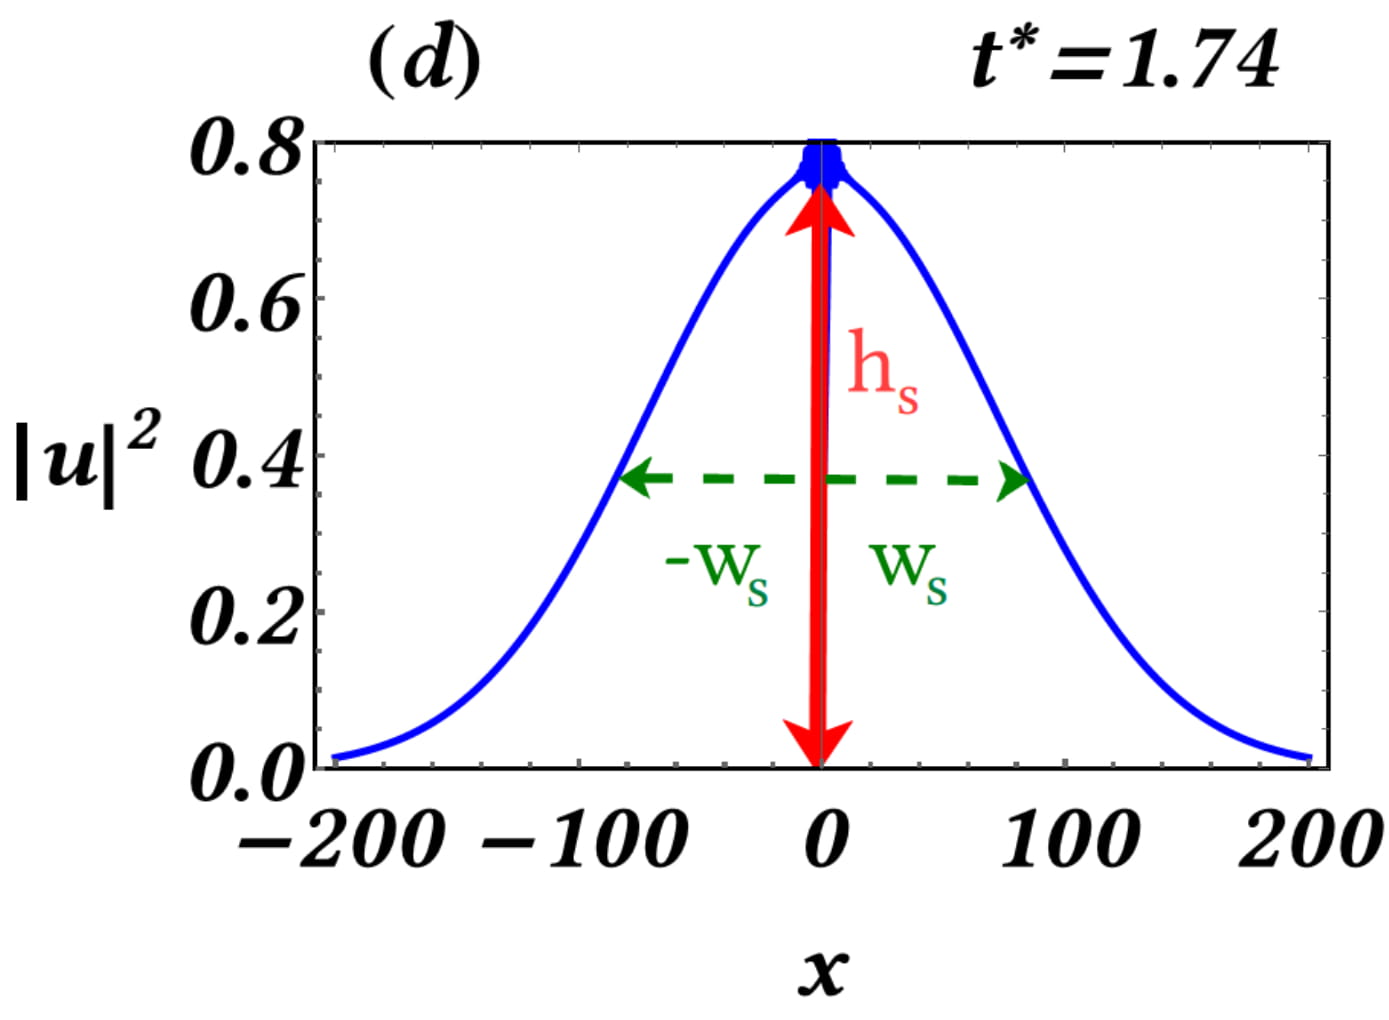
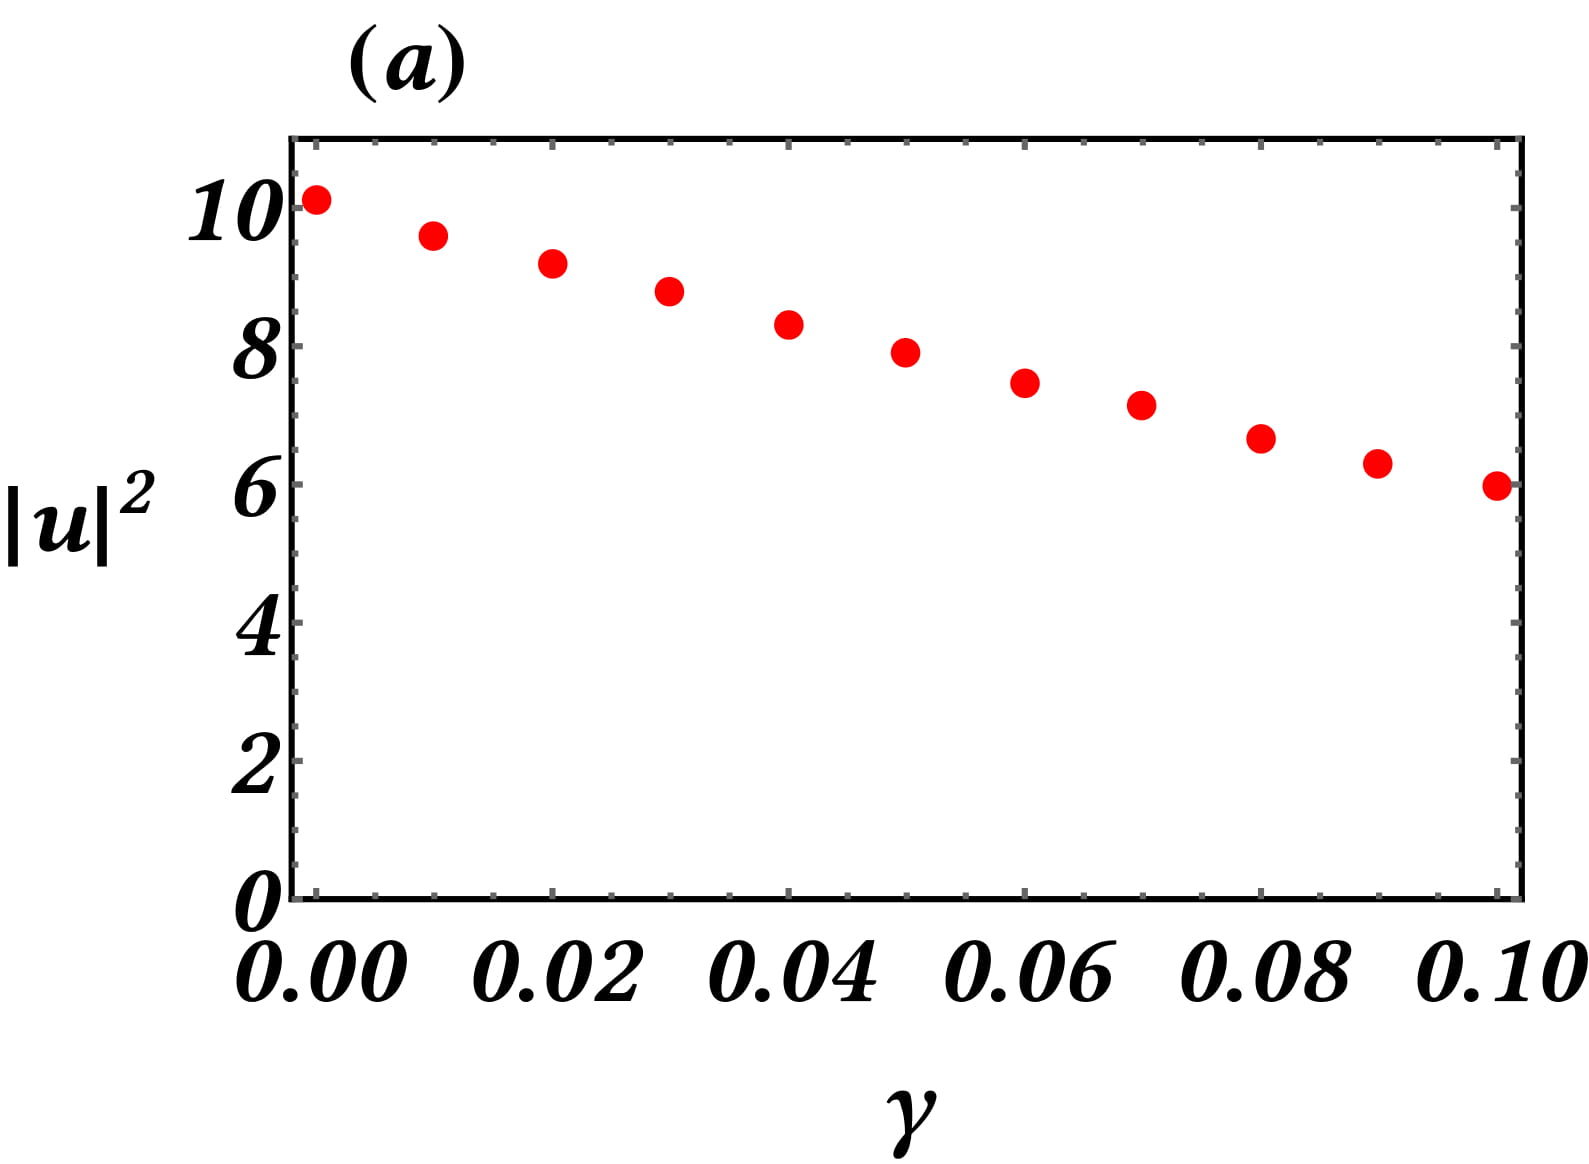
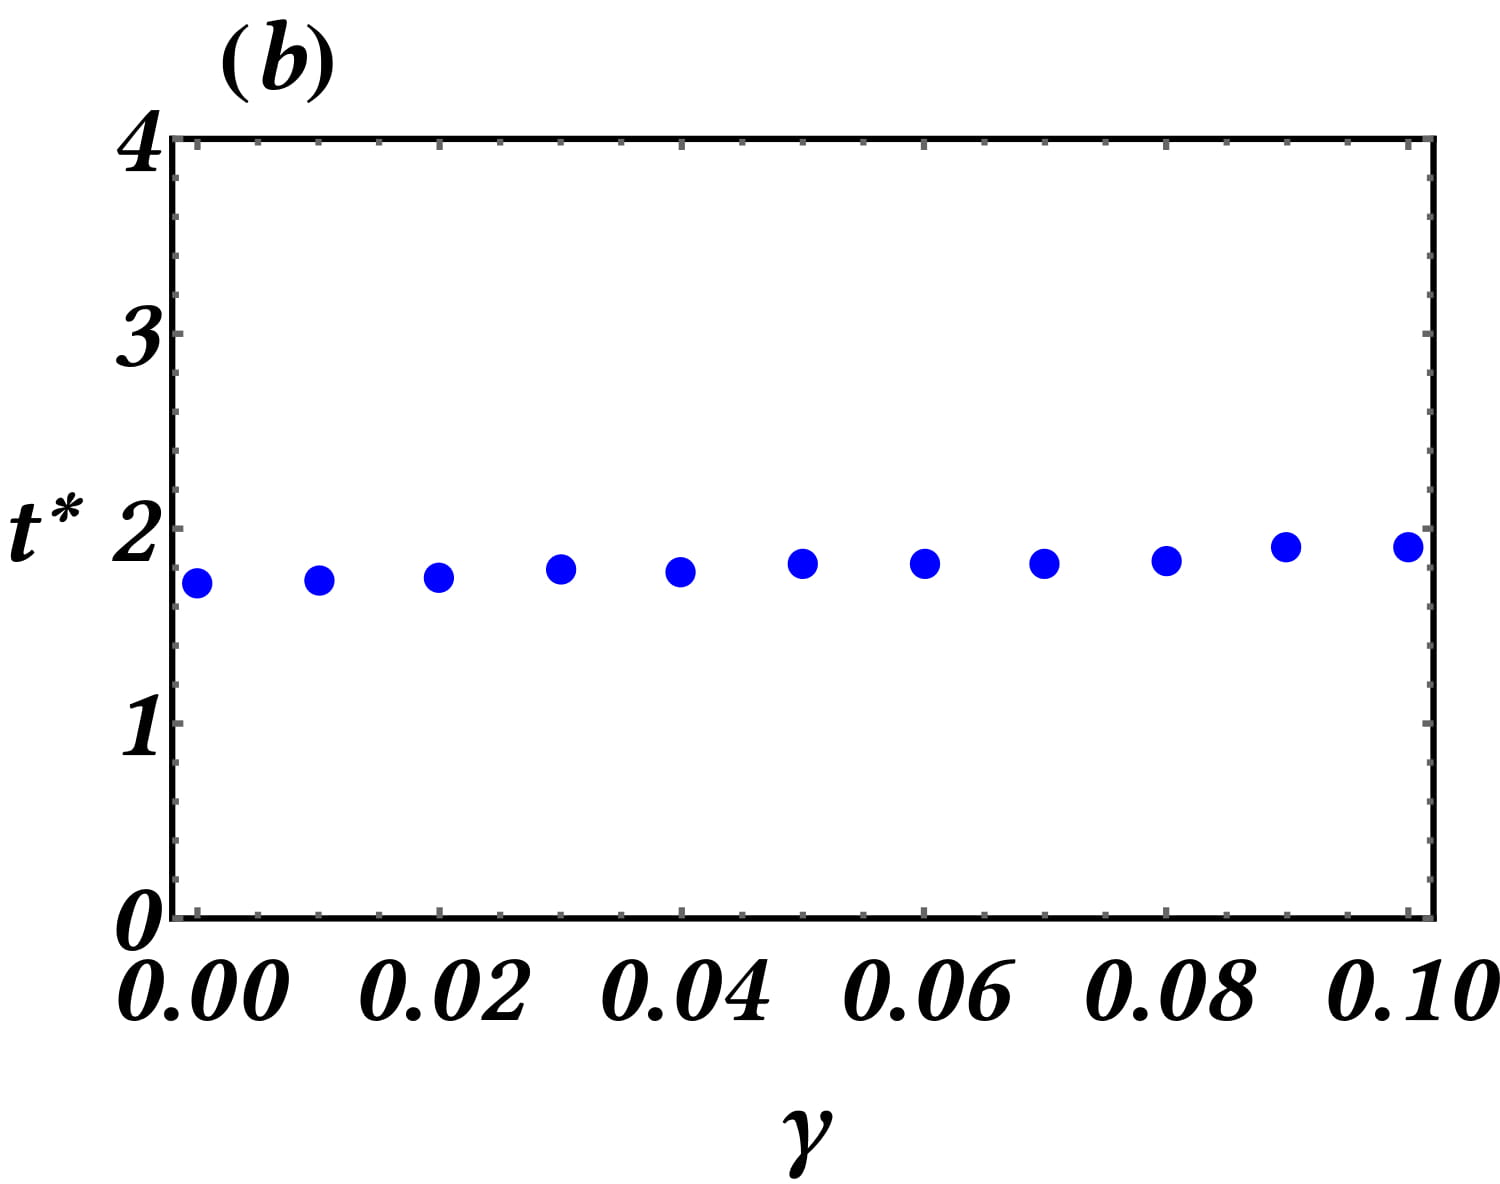
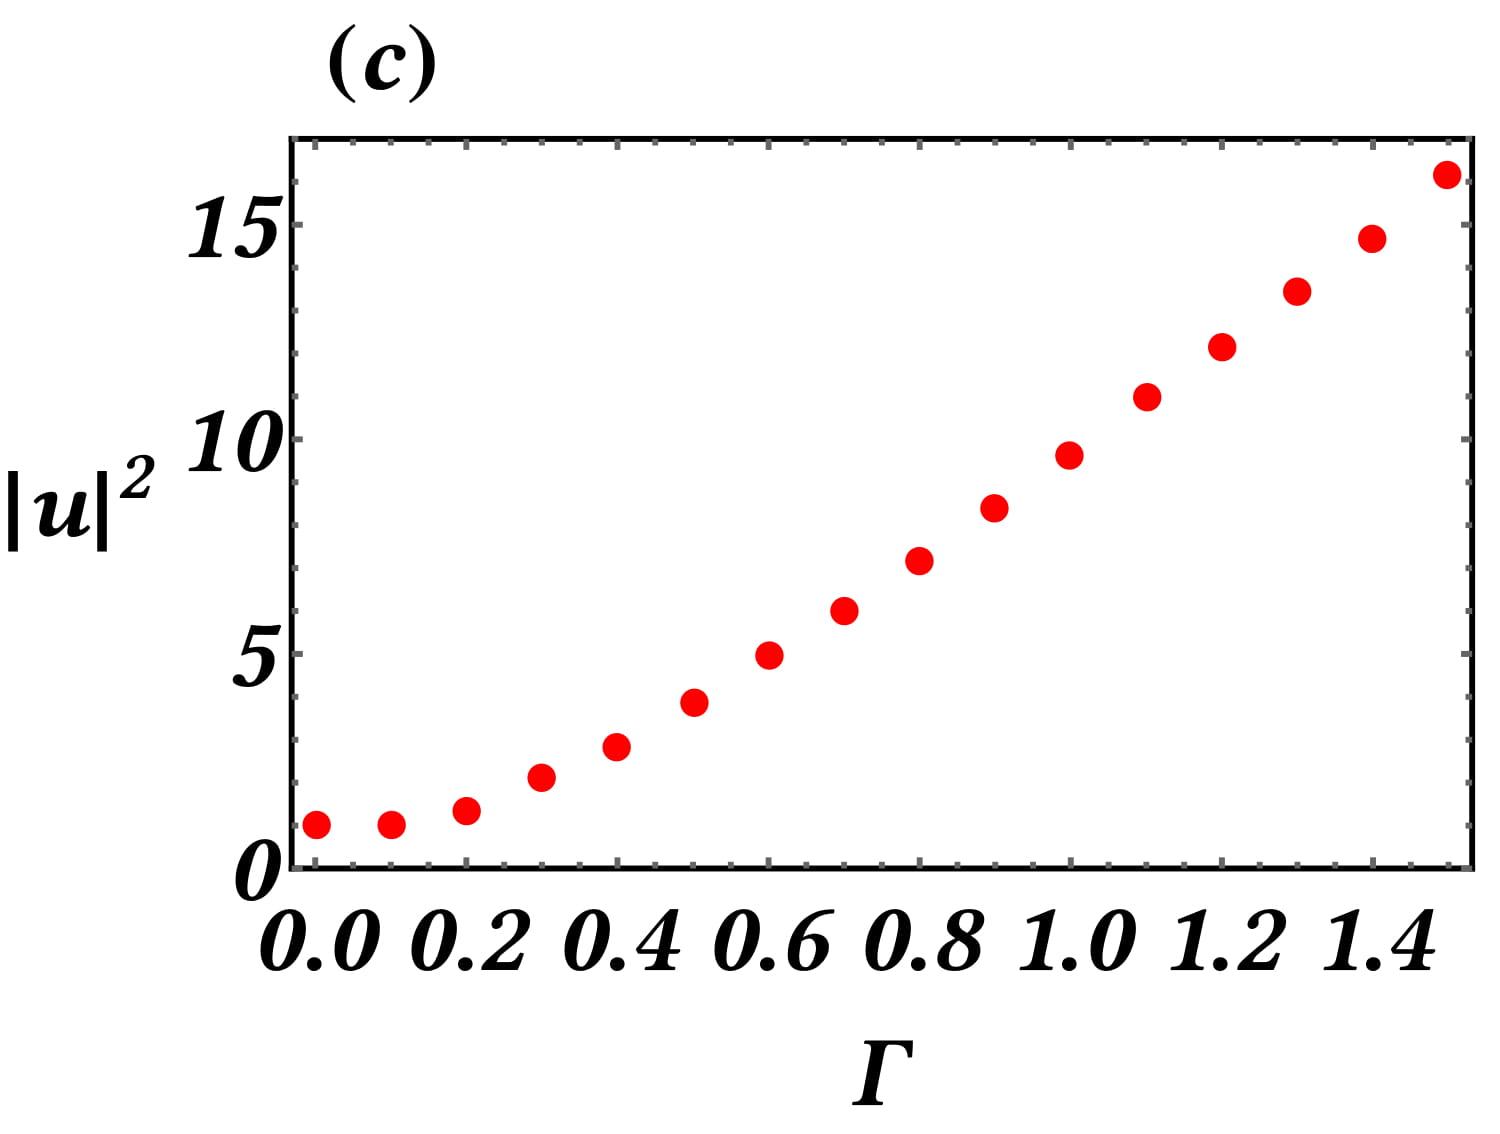
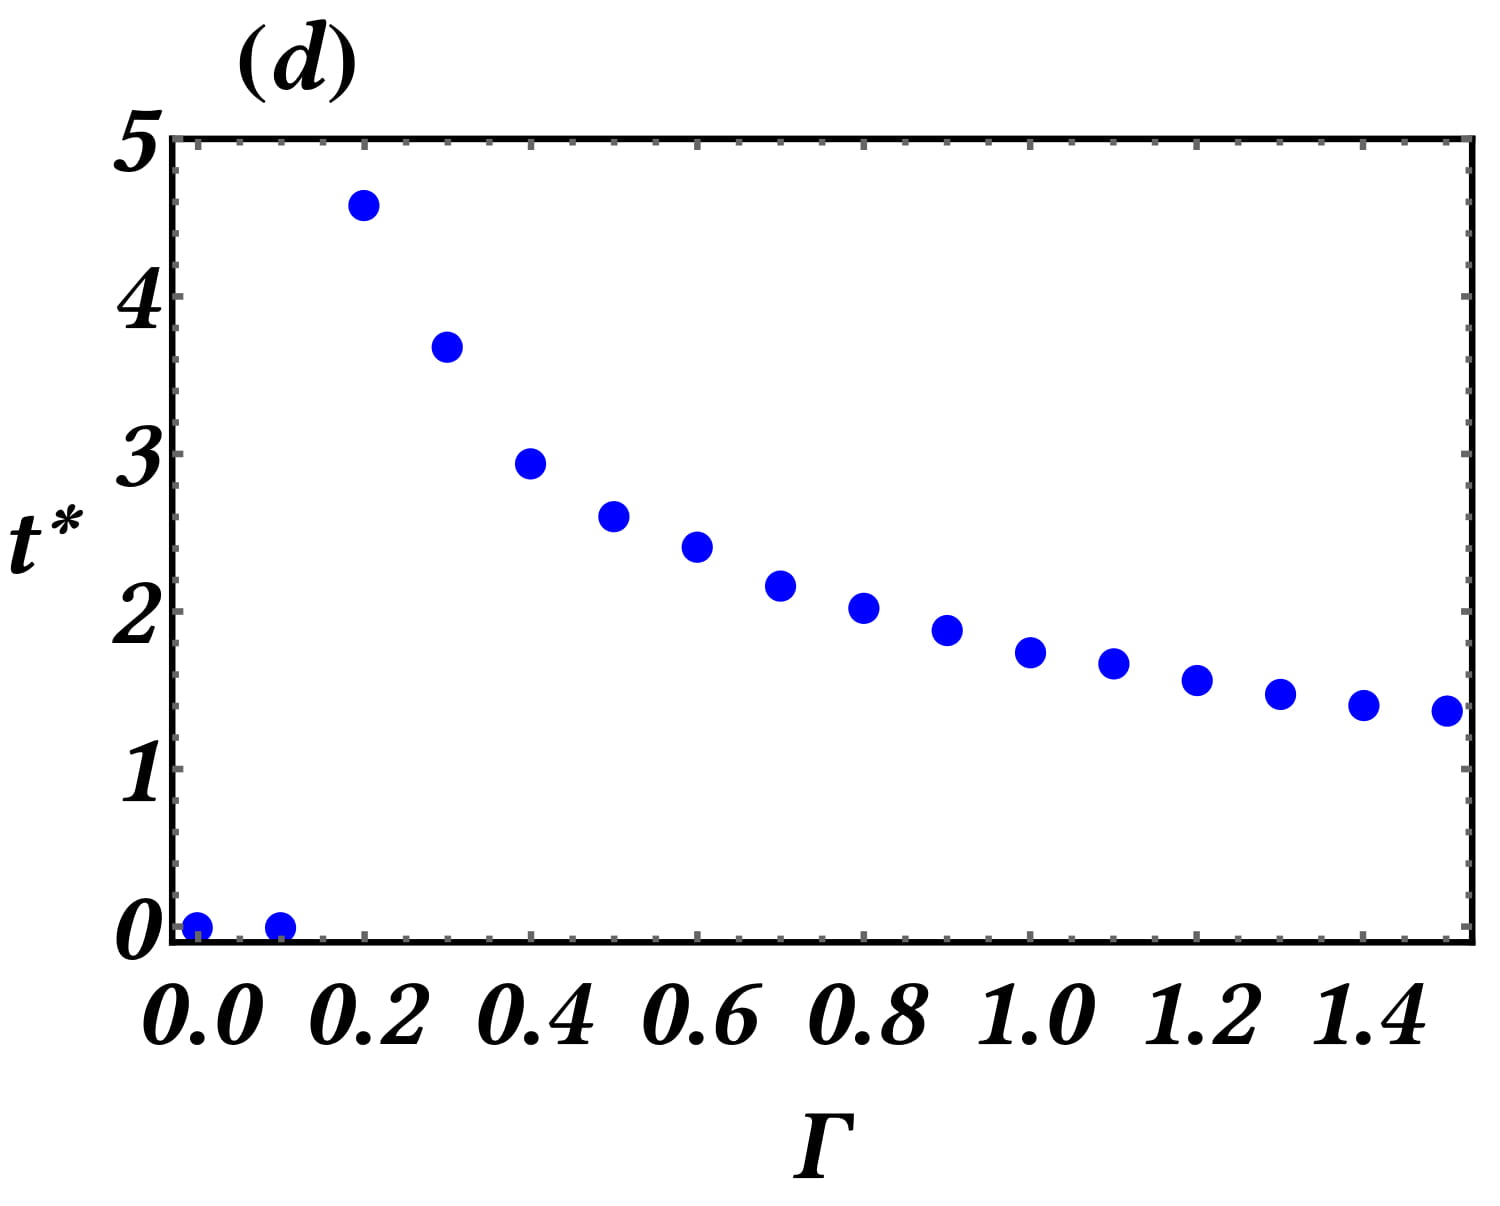
Panel (c) of Fig. 2 offers another view of the extreme event occurring at , highlighting a novel feature which totally differs from what was observed before: the extreme event occurs on the top of an emergent decaying support of the solution, as opposed to the uniform background of the exact PRW waveforms, or even of the PRW-waveforms observed in the presence of gain/loss, time-periodic driver, or higher-order effects All2 ; ZNA2019 ; Yang1 ; Yang2 . This support appears due to the existence of the specific type of driving – see discussion below. Panel (d) of Fig. 2 depicts a magnification of this support. For demonstration purposes of the results that follow, we denote by the maximum (squared amplitude) of the support, marked by the vertical (red) line. By , we denote the half-width of the support measured at . The localization interval of the support is marked in the Figure by the horizontal (green, dashed-dotted) line. Our next investigations concern the dependence of various characteristics of the emergent extreme event on the system’s parameters. Regarding the variation of the loss strength (for fixed driving amplitude ) or (for fixed ), we find the following. First, the increase of results – as may be expected – in the decrease of the maximum amplitude of the first event , attained at , and vice versa, see panel (a) of Fig. 3. On the other hand, in panel (b) of Fig. 3, we notice that the increase of (for fixed ) results in the increase of , and vice versa. For the occurrence time of the extreme events, we see in panel (c) of Fig. 3, that although the increase of affects significantly the maximum of the events, it has a small influence on the time of their occurrence. On the other hand, the increase of leads to a significant decrease in the occurrence time, as we can see in panel (d) of Fig. 3.
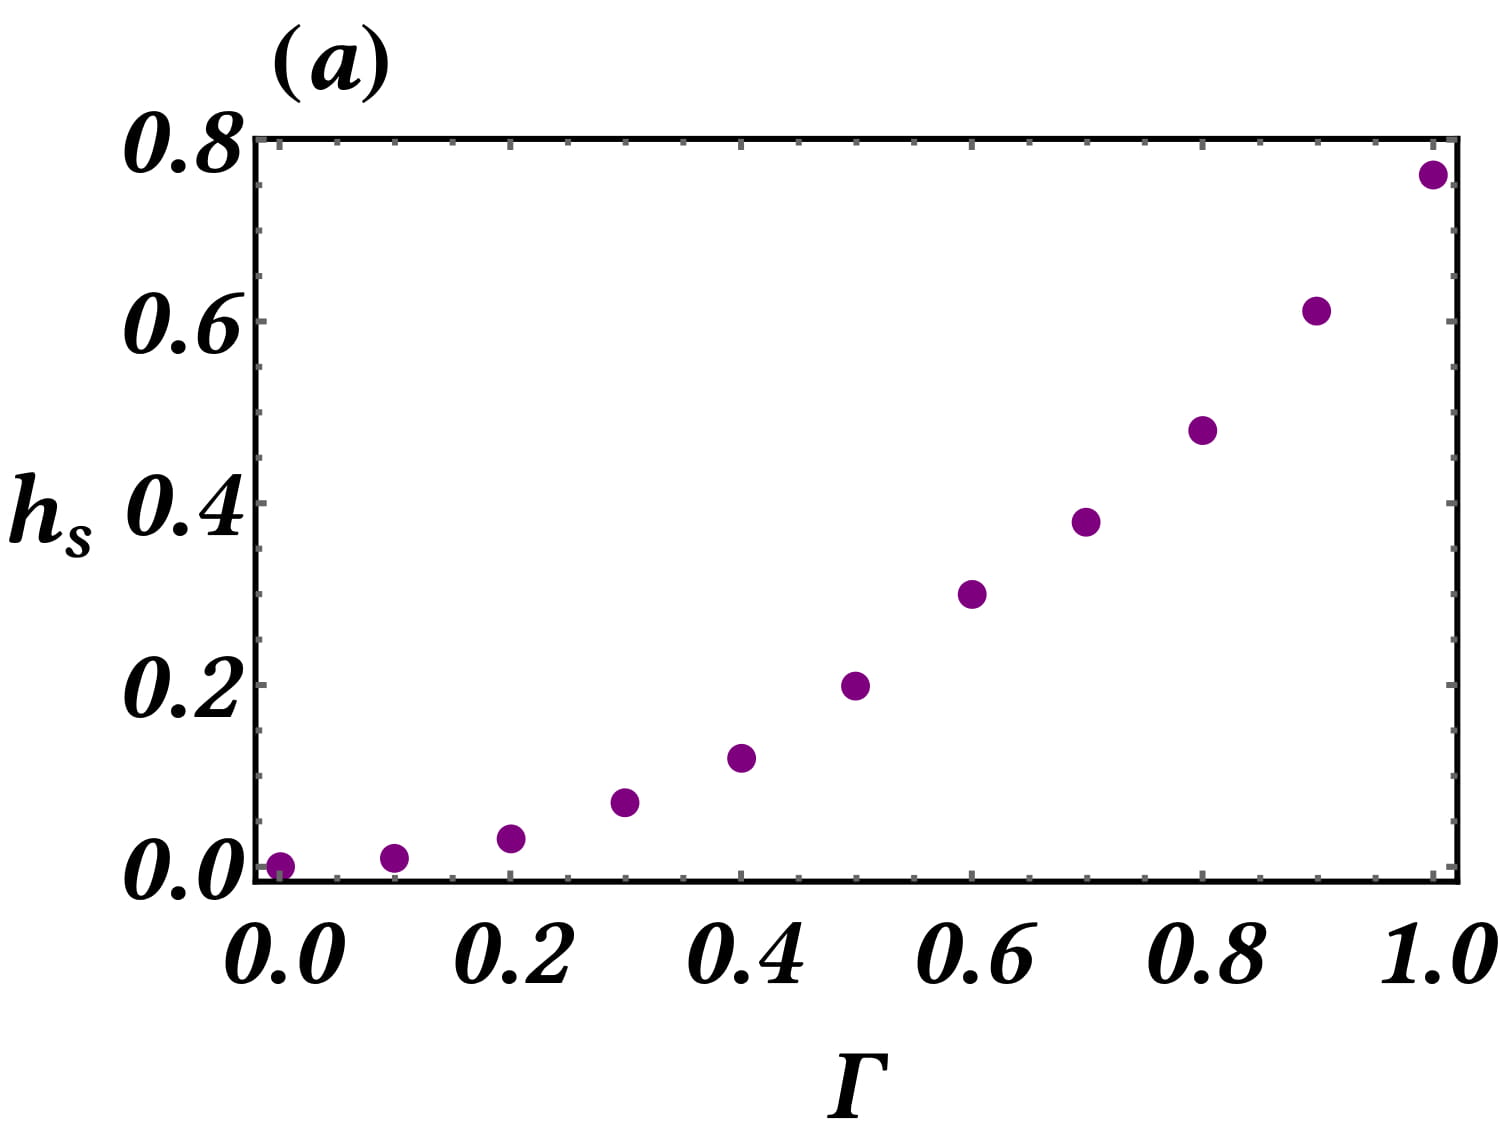
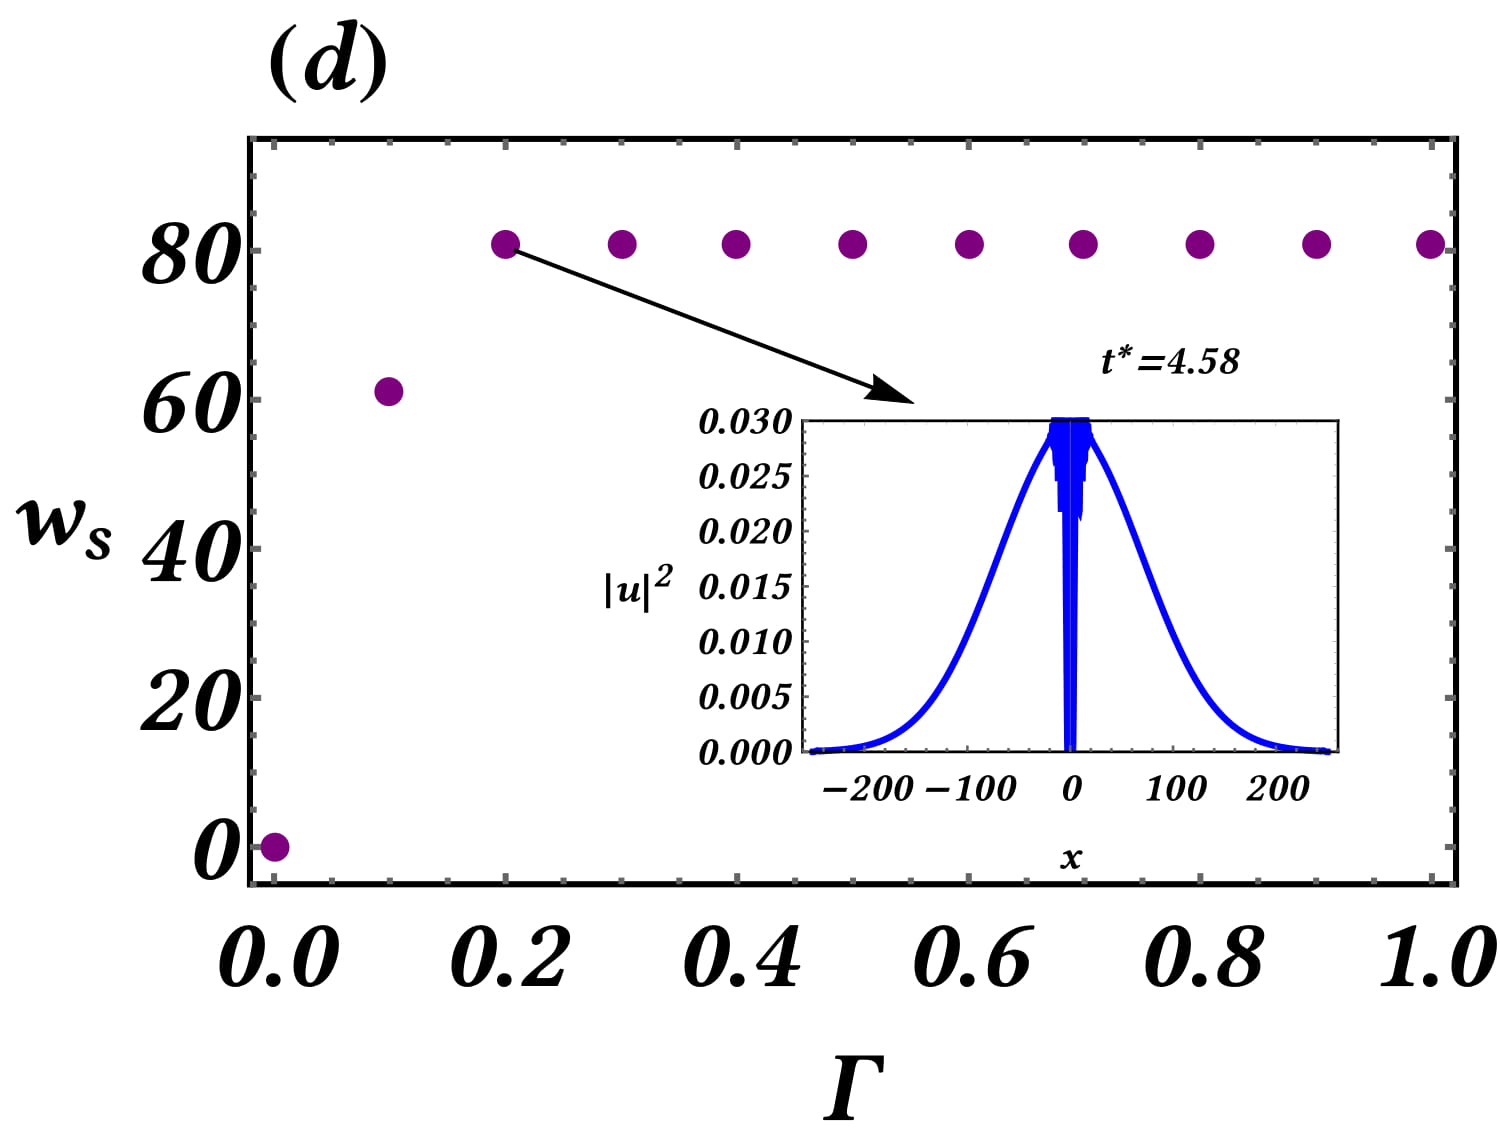
We continue our study in figure 4, which illustrates the dependence of the height and of the width of the emerging support (shown in panels (c) and (d) of Fig. 2), on the amplitude of the driving, for fixed damping strength . Panel (a) of figure 4 shows the dependence of with respect to . The computations reveal the existence of a threshold value , beyond which, the emergence of the decaying support becomes noticeable (i.e., its amplitude is ). Secondly, is an increasing function of . Panel (b) of the same Figure shows the dependence of the half-width on , which also becomes comparable to the half-width of the initial condition, when . Another interesting observation is that approaches a constant value for . The inset portrays a magnification of the support at , for . We observe that although we have considered a much larger spatial interval ] (as we have increased its half length to ), the width of the support doesn’t change significantly compared to the one of Fig. 2(d).
 |
 |
Exponentially decaying initial condition.
We conclude our study on the emergence of extreme events, with a short presentation of the relevant dynamics emerging from an exponentially decaying initial condition (5).
Figure 5 illustrates the results of a similar study to the one presented in panels (a)-(b) of Fig. 2. Panel (a) depicts the evolution of the density of the center of the solution, during the emergence of the first extreme event, as compared to the evolution of the density of the center of the PRW (7) . We see that although for the agreement of the two curves is almost exact, afterwards, they diverge with a faster time-decay rate than in the case of the algebraic initial condition (4). In addition, in panel (b), we compare the profiles of the two solutions, close to the right one among the symmetric minima. We observe again that at the core of the event the two curves coincide and that a greater divergence between them is exhibited at the beginning of their tails. Summarizing the above results, we find that the PRW-solitonic structures emerging from the algebraic initial data (4) are more proximal to the PRW rational solution, than those emerged from the exponentially decaying initial condition (5). The greater proximity in the first case can be explained by the fact that the algebraic initial condition is functionally closer to the analytical PRW at , as it can be measured by a suitable-weighted norm All2 . Henceforth, the emerged PRW-solitonic profile is expected accordingly, to be closer to the analytical PRW, as a result of the continuous dependence of solutions from the initial data.
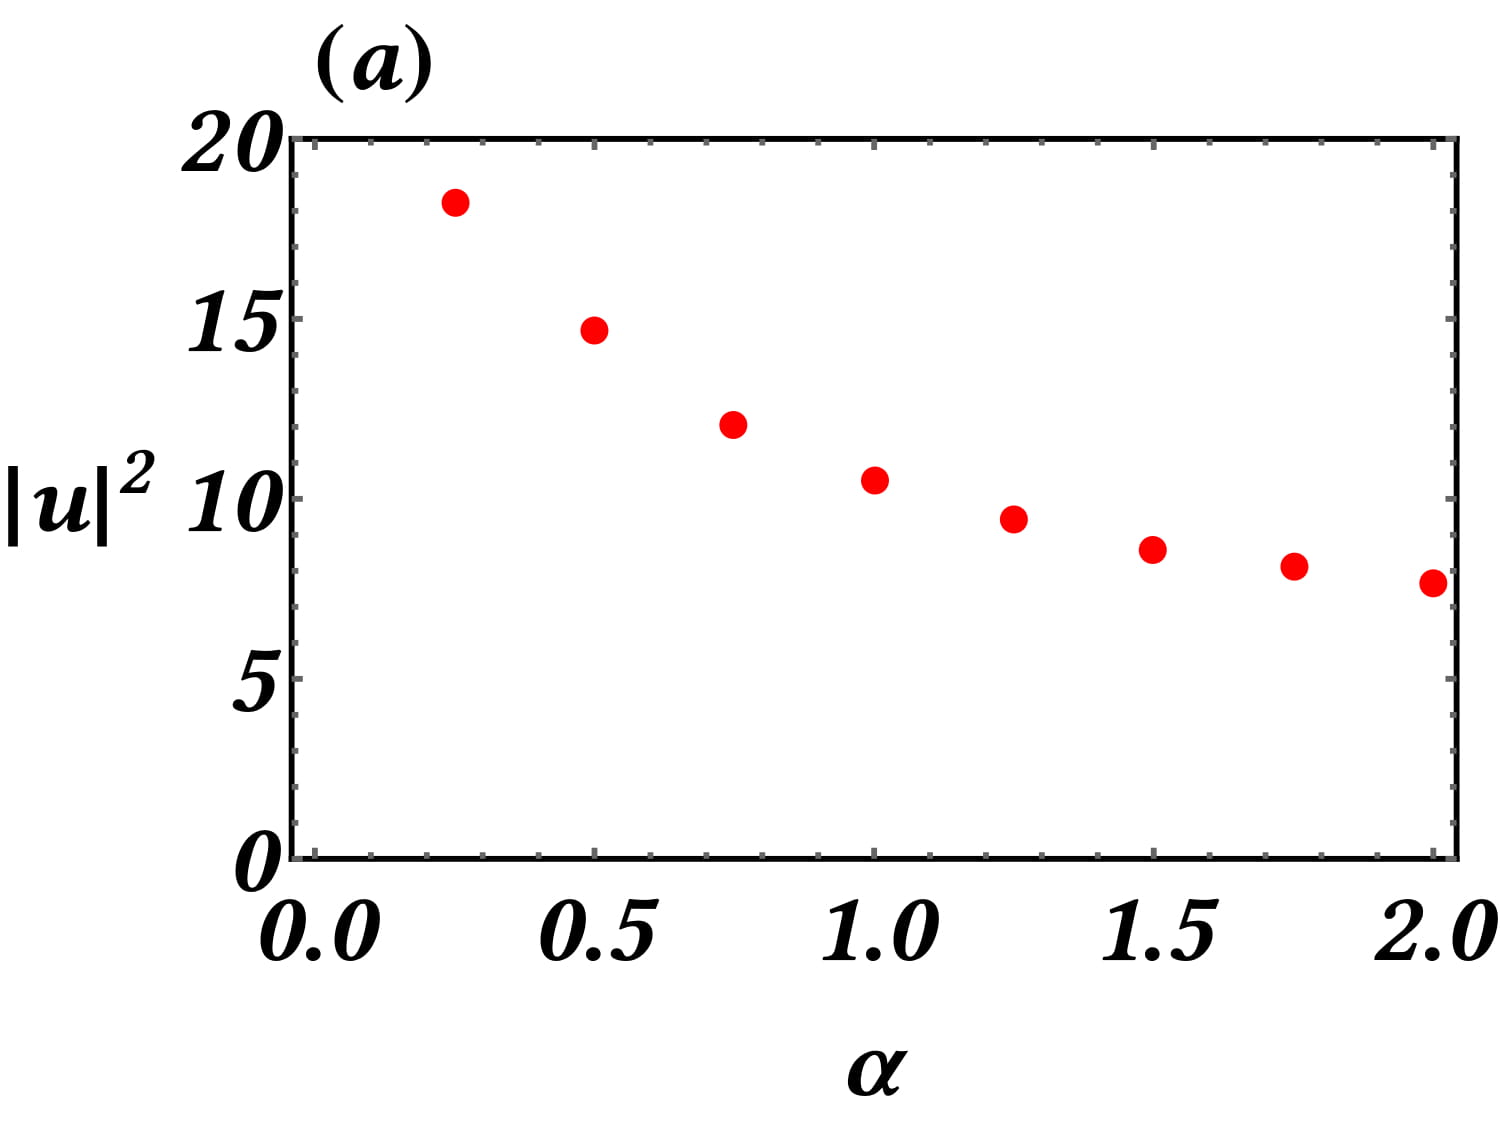
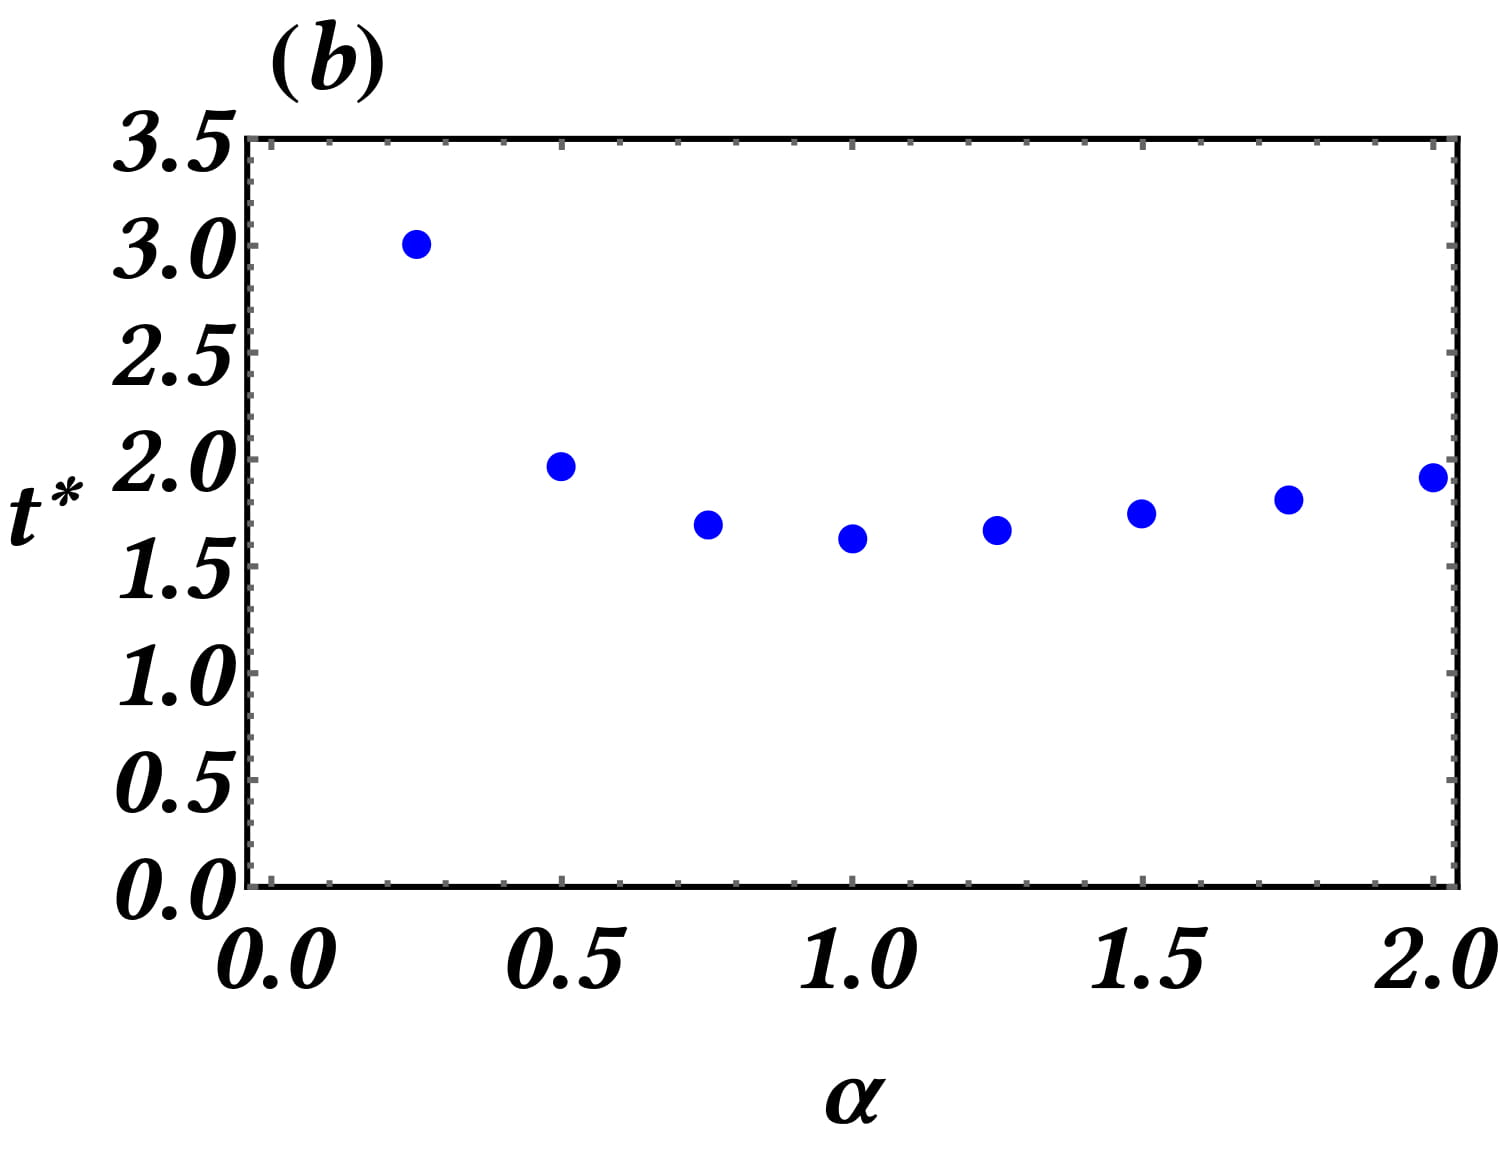
For the -profiled initial condition (5), we find similar dependencies for the maximum amplitude and the moment of occurrence of the extreme event as functions of and to those presented in Fig. 3, and are not shown here. Instead, we present in Figure 6 the results of a numerical study varying the width of the initial condition (5). Panel (a) shows that the maximum amplitude of the extreme event is a decreasing function of . This fact is connected with the value of the initial power (squared norm) of the initial condition which also is a decreasing function of . As a consequence, the localization mechanism acting on larger initial powers (associated to smaller values of ) results in higher amplitudes of the extreme events. Panel (b) shows that the time of occurrence is initially decreasing as a function of . For instance, more time is needed for events of increasing amplitude to be formed in the case of smaller values of , which are also associated to larger values of the initial power. Then, the relevant time attains a minimum at , and afterwards, is slightly increasing. To analyse this interesting phenomenon further, we depict in Figure 7, profiles of the PRW events for selected values of below and above ; recall that the maximum event for is analysed in Fig. 5. For and it appears that the profile of the PRW-event gradually deviates from the one of the PRW of the integrable limit (7). It becomes less proximal for increasing values of than for decreasing values . It appears that is the optimal width to define a most proximal (to the original PRW (7)) PRW-type event, thus needing the minimum time to be formed.
II.2 Emergence of Spatiotemporal Patterns
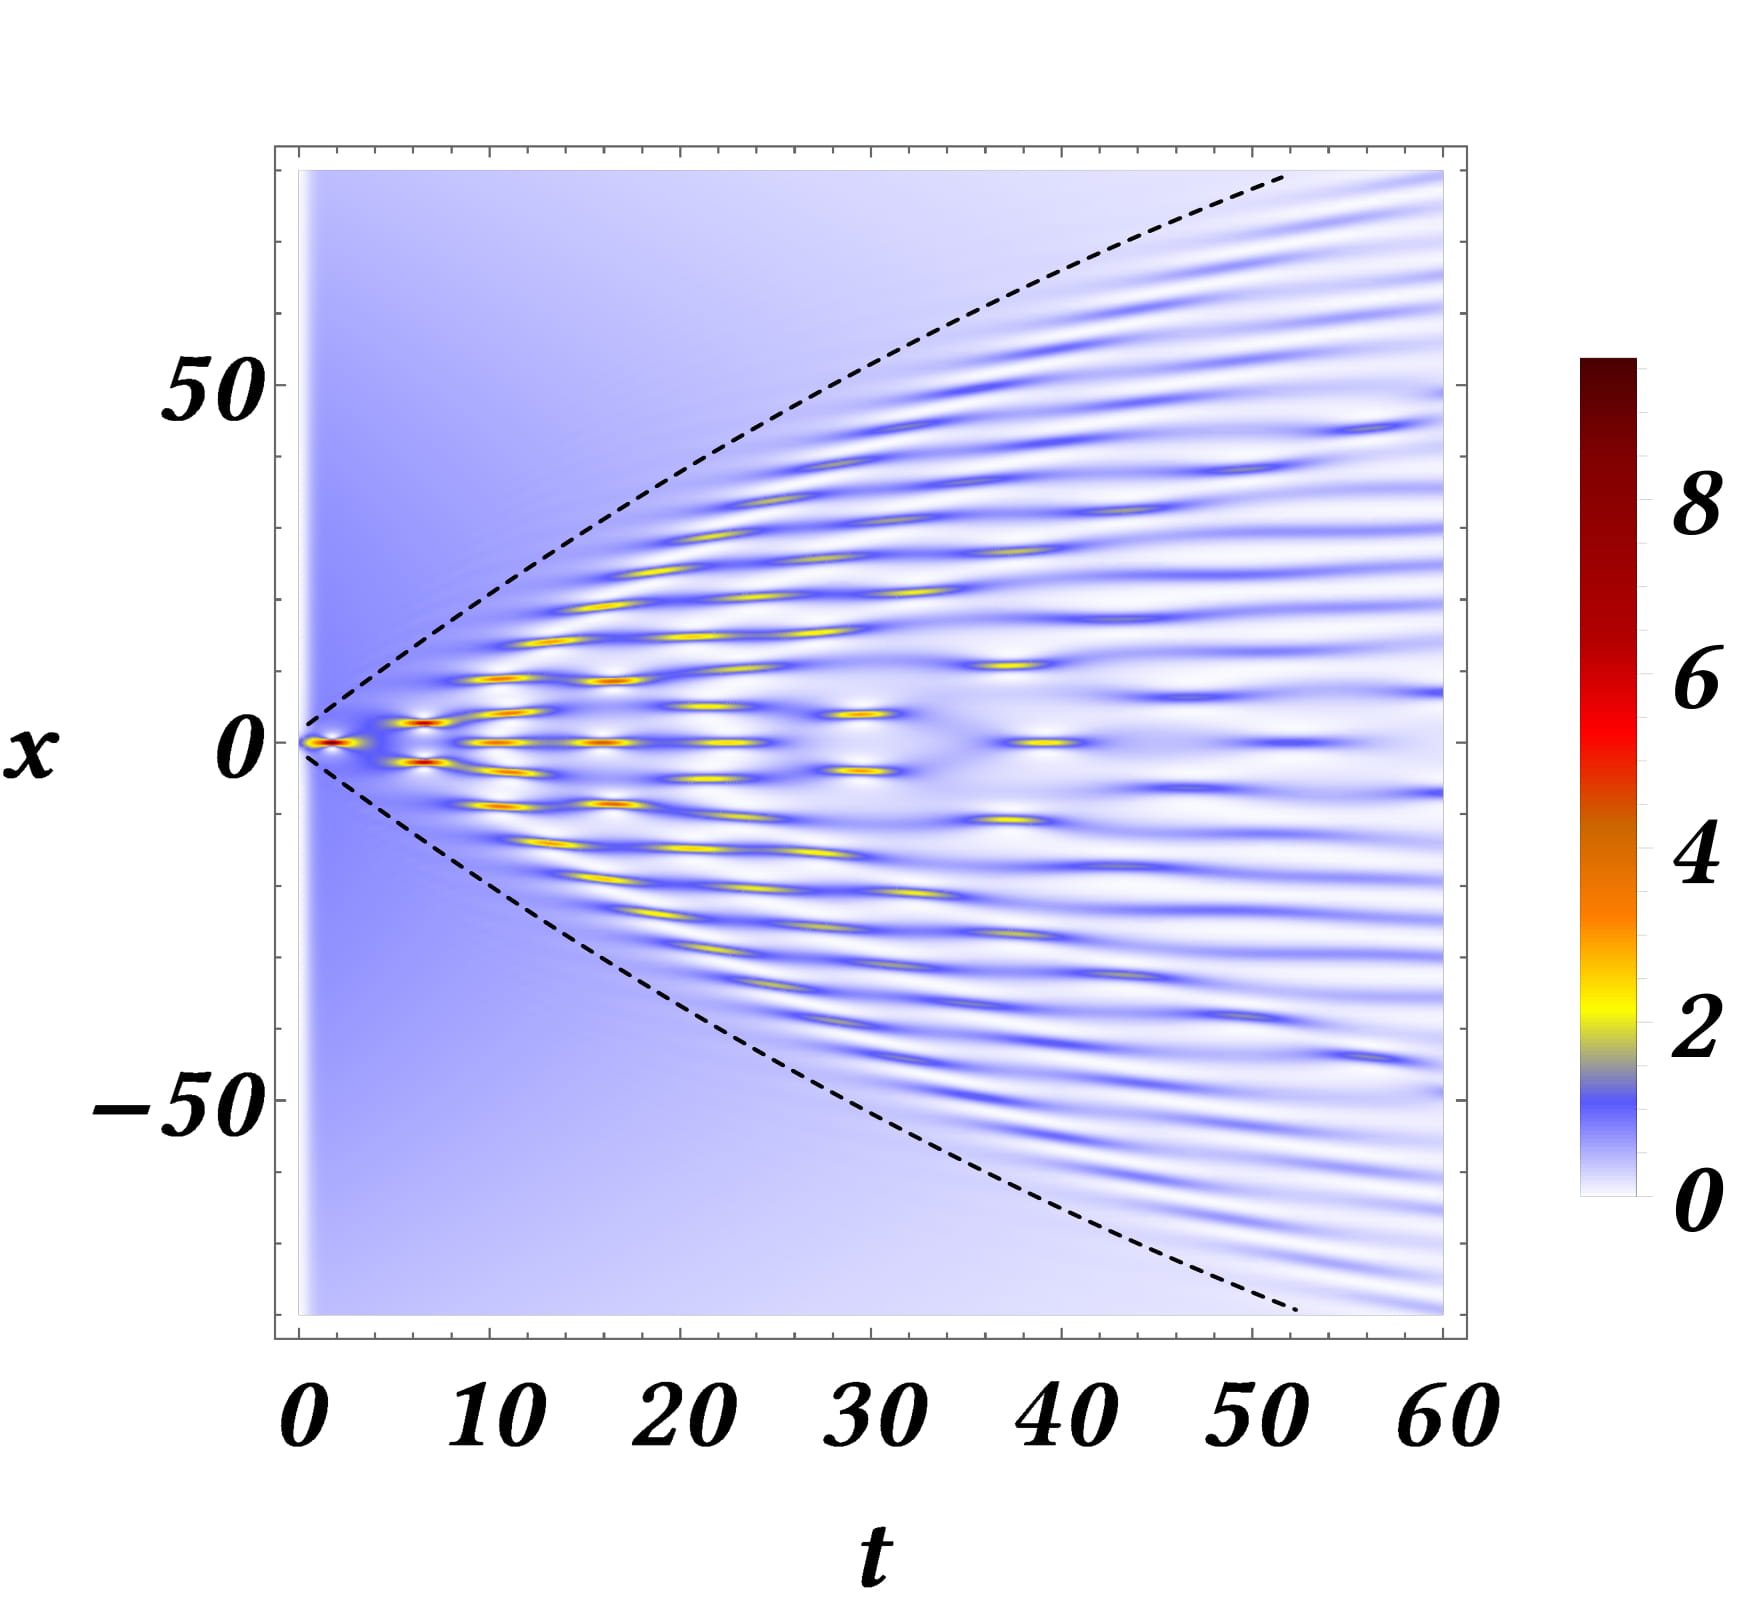
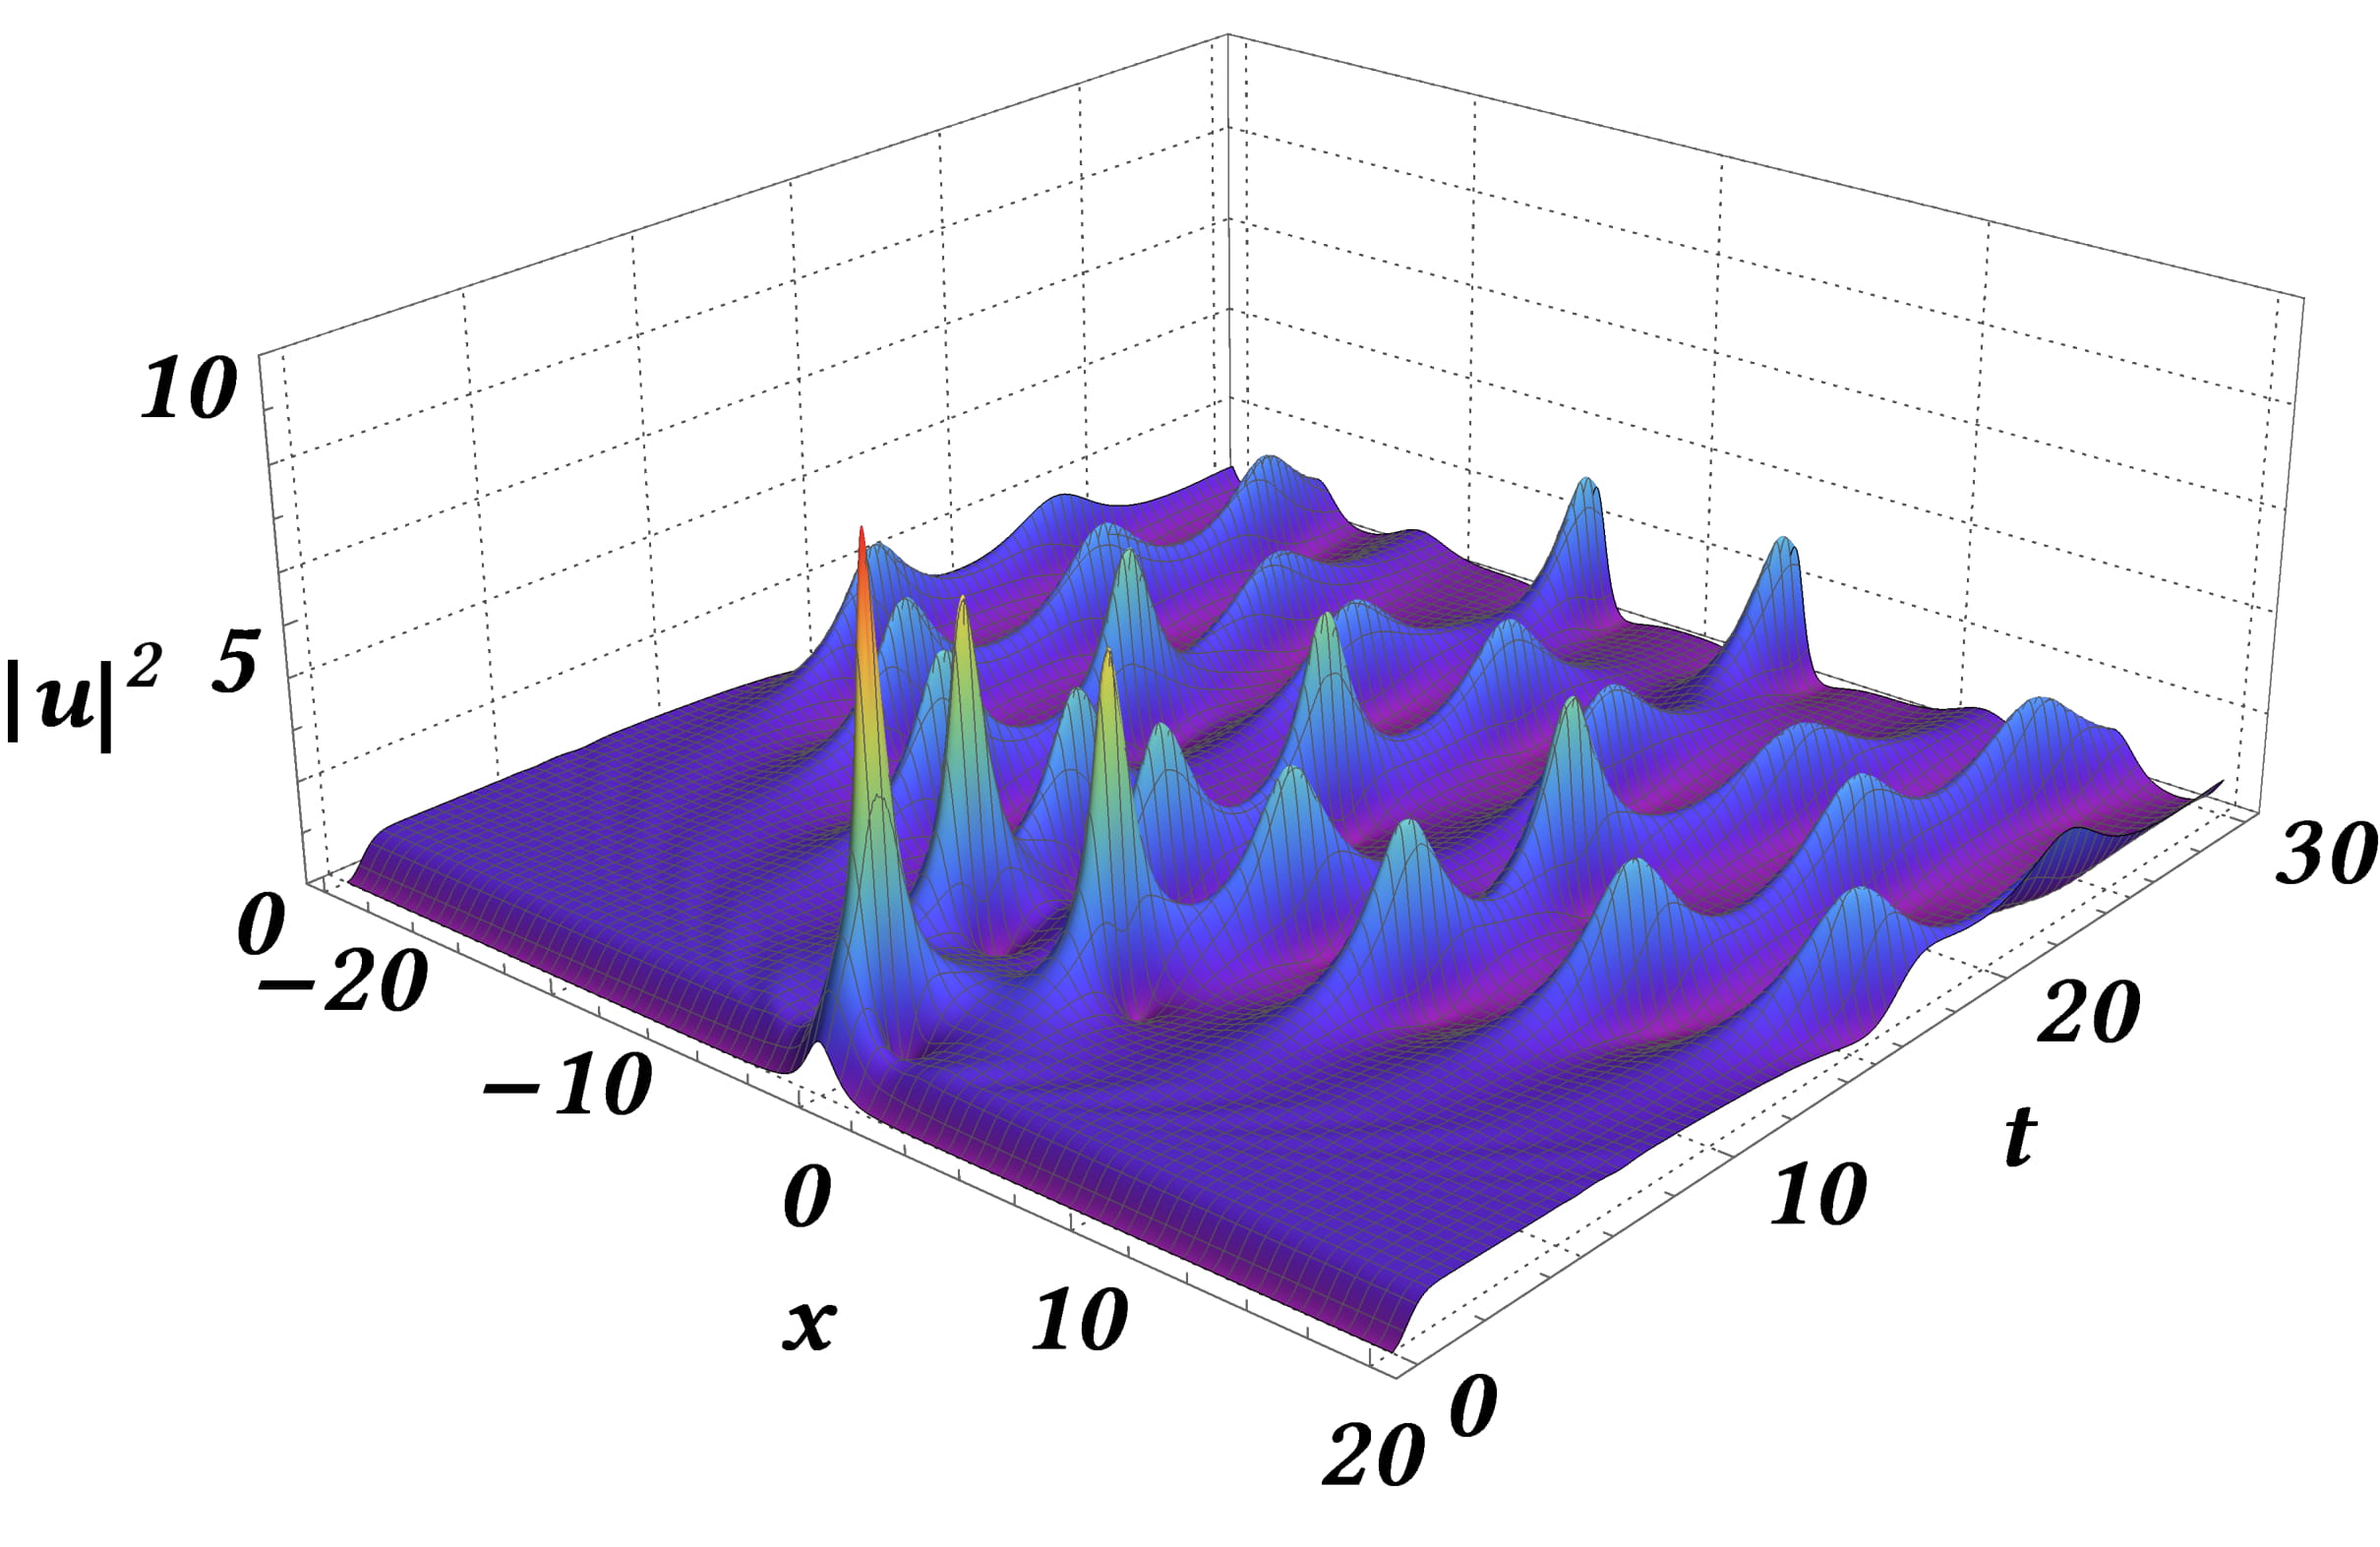
Beyond the formation of the PRW-extreme event, further interesting dynamical features arise at later times. This can be seen in the left panel of Fig. 8, depicting a contour plot of the spatiotemporal evolution of the density, for , and for the same parameters as in Figs. 1 and 2; a 3D-plot of this evolution is illustrated in the right panel of Fig. 8.
Here, it should be pointed out that the observed dynamics, prior to the ultimate decay of the solution, is found to be partially reminiscent of that of the semi-classical NLS (3): this is due to the fact that the change of dimensionless space and time variables, respectively, and (for , i.e., ) in Eq. (2) renders its left-hand side identical to that of Eq. (3). Indeed, as shown in Fig. 8, and similarly to Refs. BM1 ; BM2 where the semi-classical NLS was studied, distinct spatiotemporal regions are formed; these are separated by nonlinear caustics (dashed curves), which bound the pattern of the transient decaying spatiotemporal oscillations. In particular, in these works, a “lattice” of extreme events – in the form of PRW structures – was found to occupy the region in between the caustics, at points corresponding to the poles of the tritronquée solution of the Painlevé-I equation. In our case, in the region bounded by the caustics we observe the formation of PRW events as discussed above. Yet, the pattern formed appears to be closer to the PRW lattice of BM1 ; BM2 in the early stage of the evolution, while, at its final stages, the dynamics is weakened due to the effect of the damping.
 |
|
 |
|
We remark that if the initial condition had the form of an exponentially localized pulse on top of a finite background (see also Refs. All2 ; Yang1 ; Yang2 ) then the numerical solution would follow more closely the dynamics in Ref. BM , albeit with some of the gain/loss-induced differences discussed above.
Dependence of the dynamics on the phase of the driver.
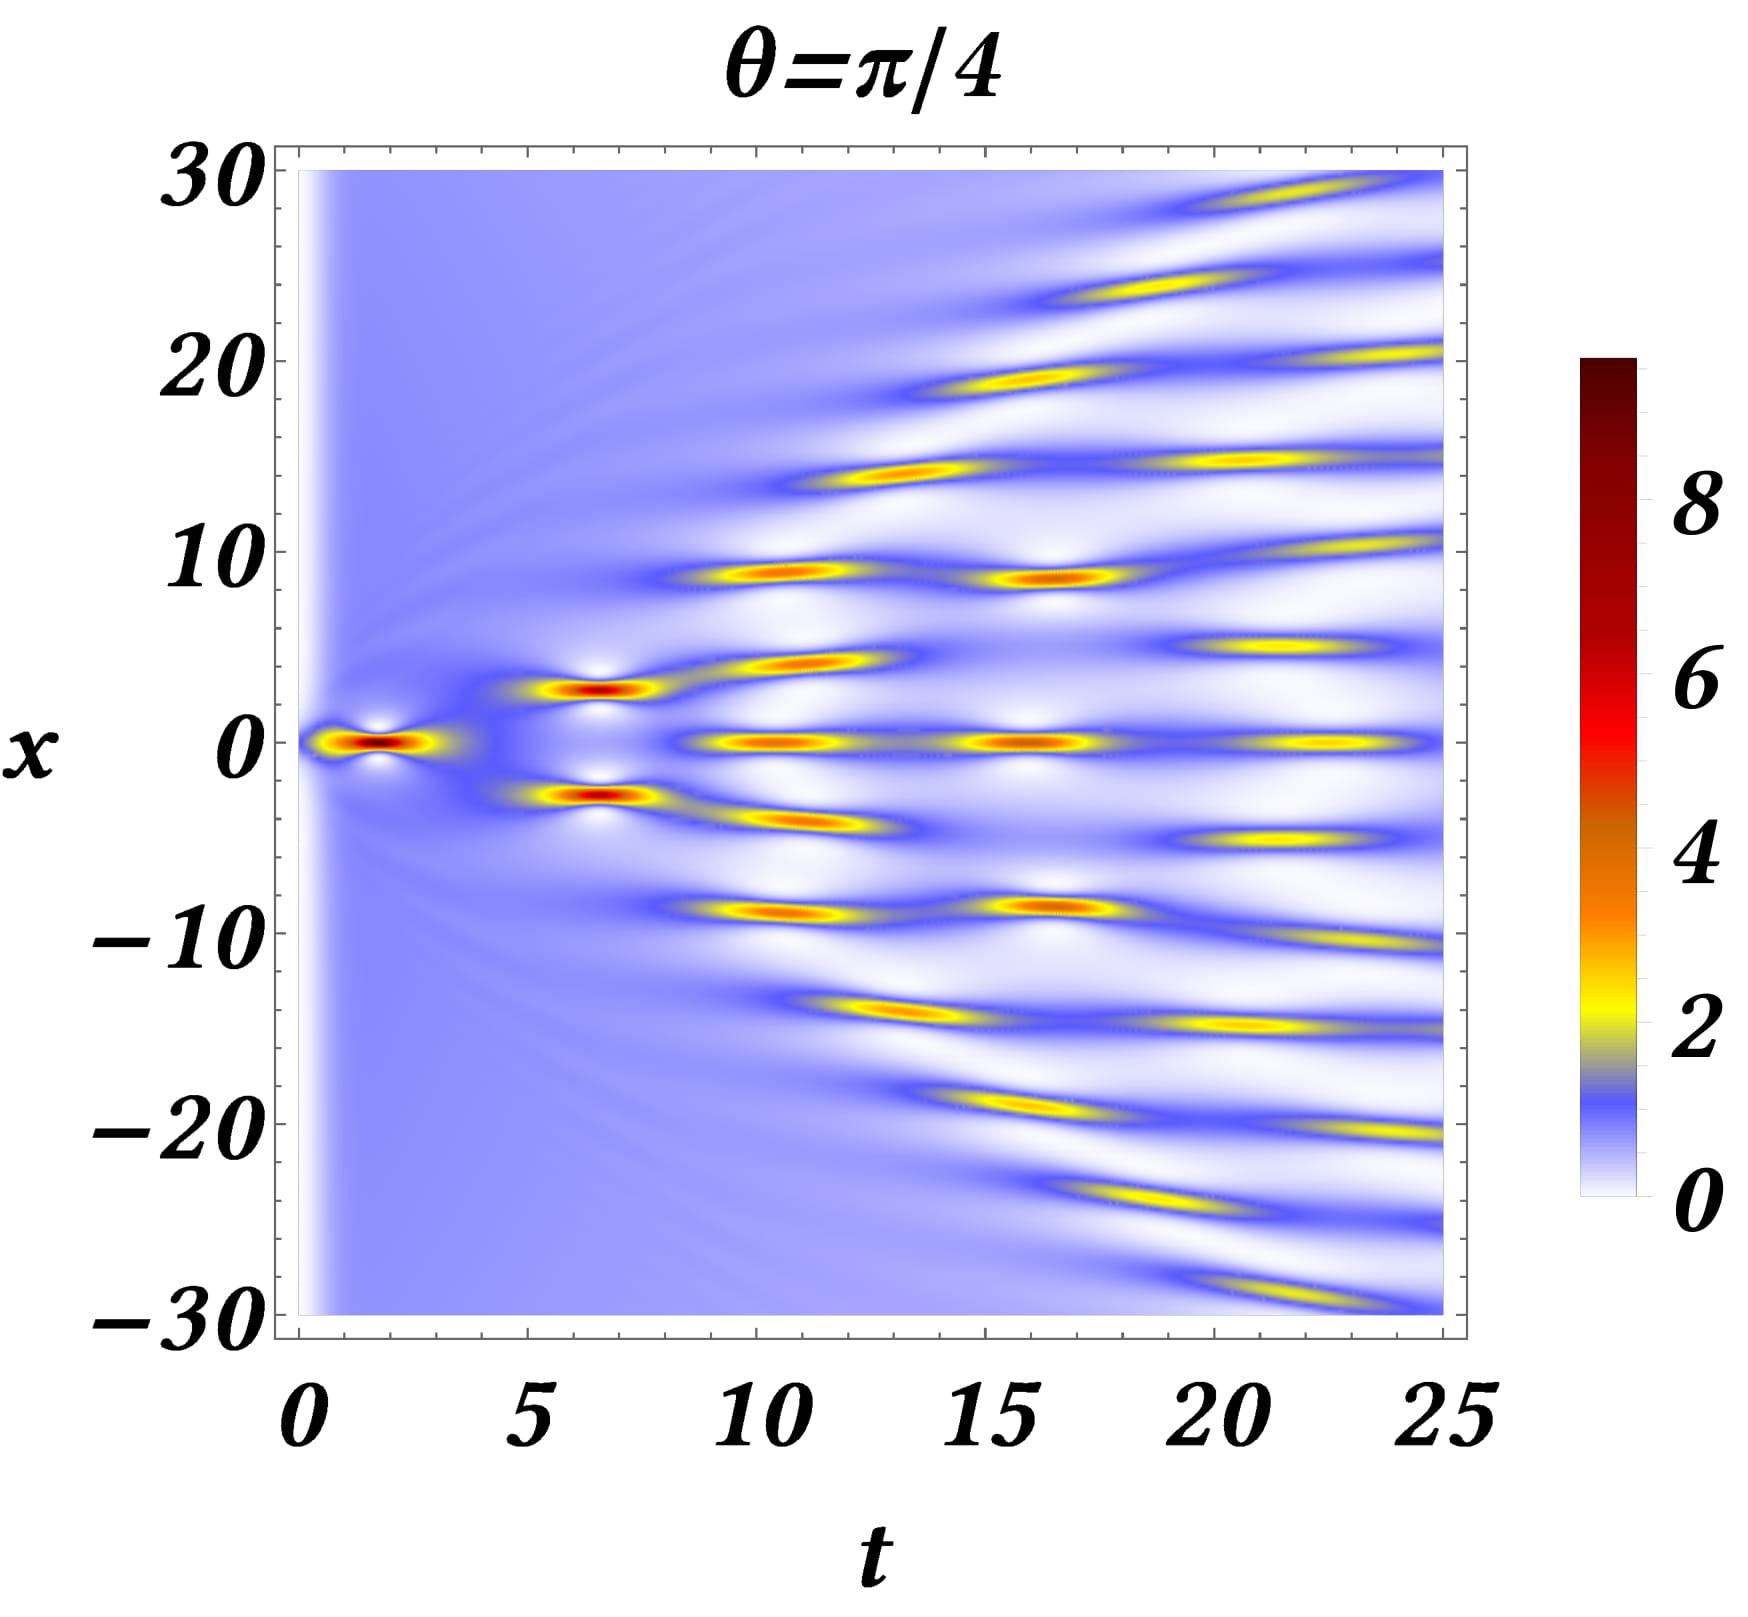
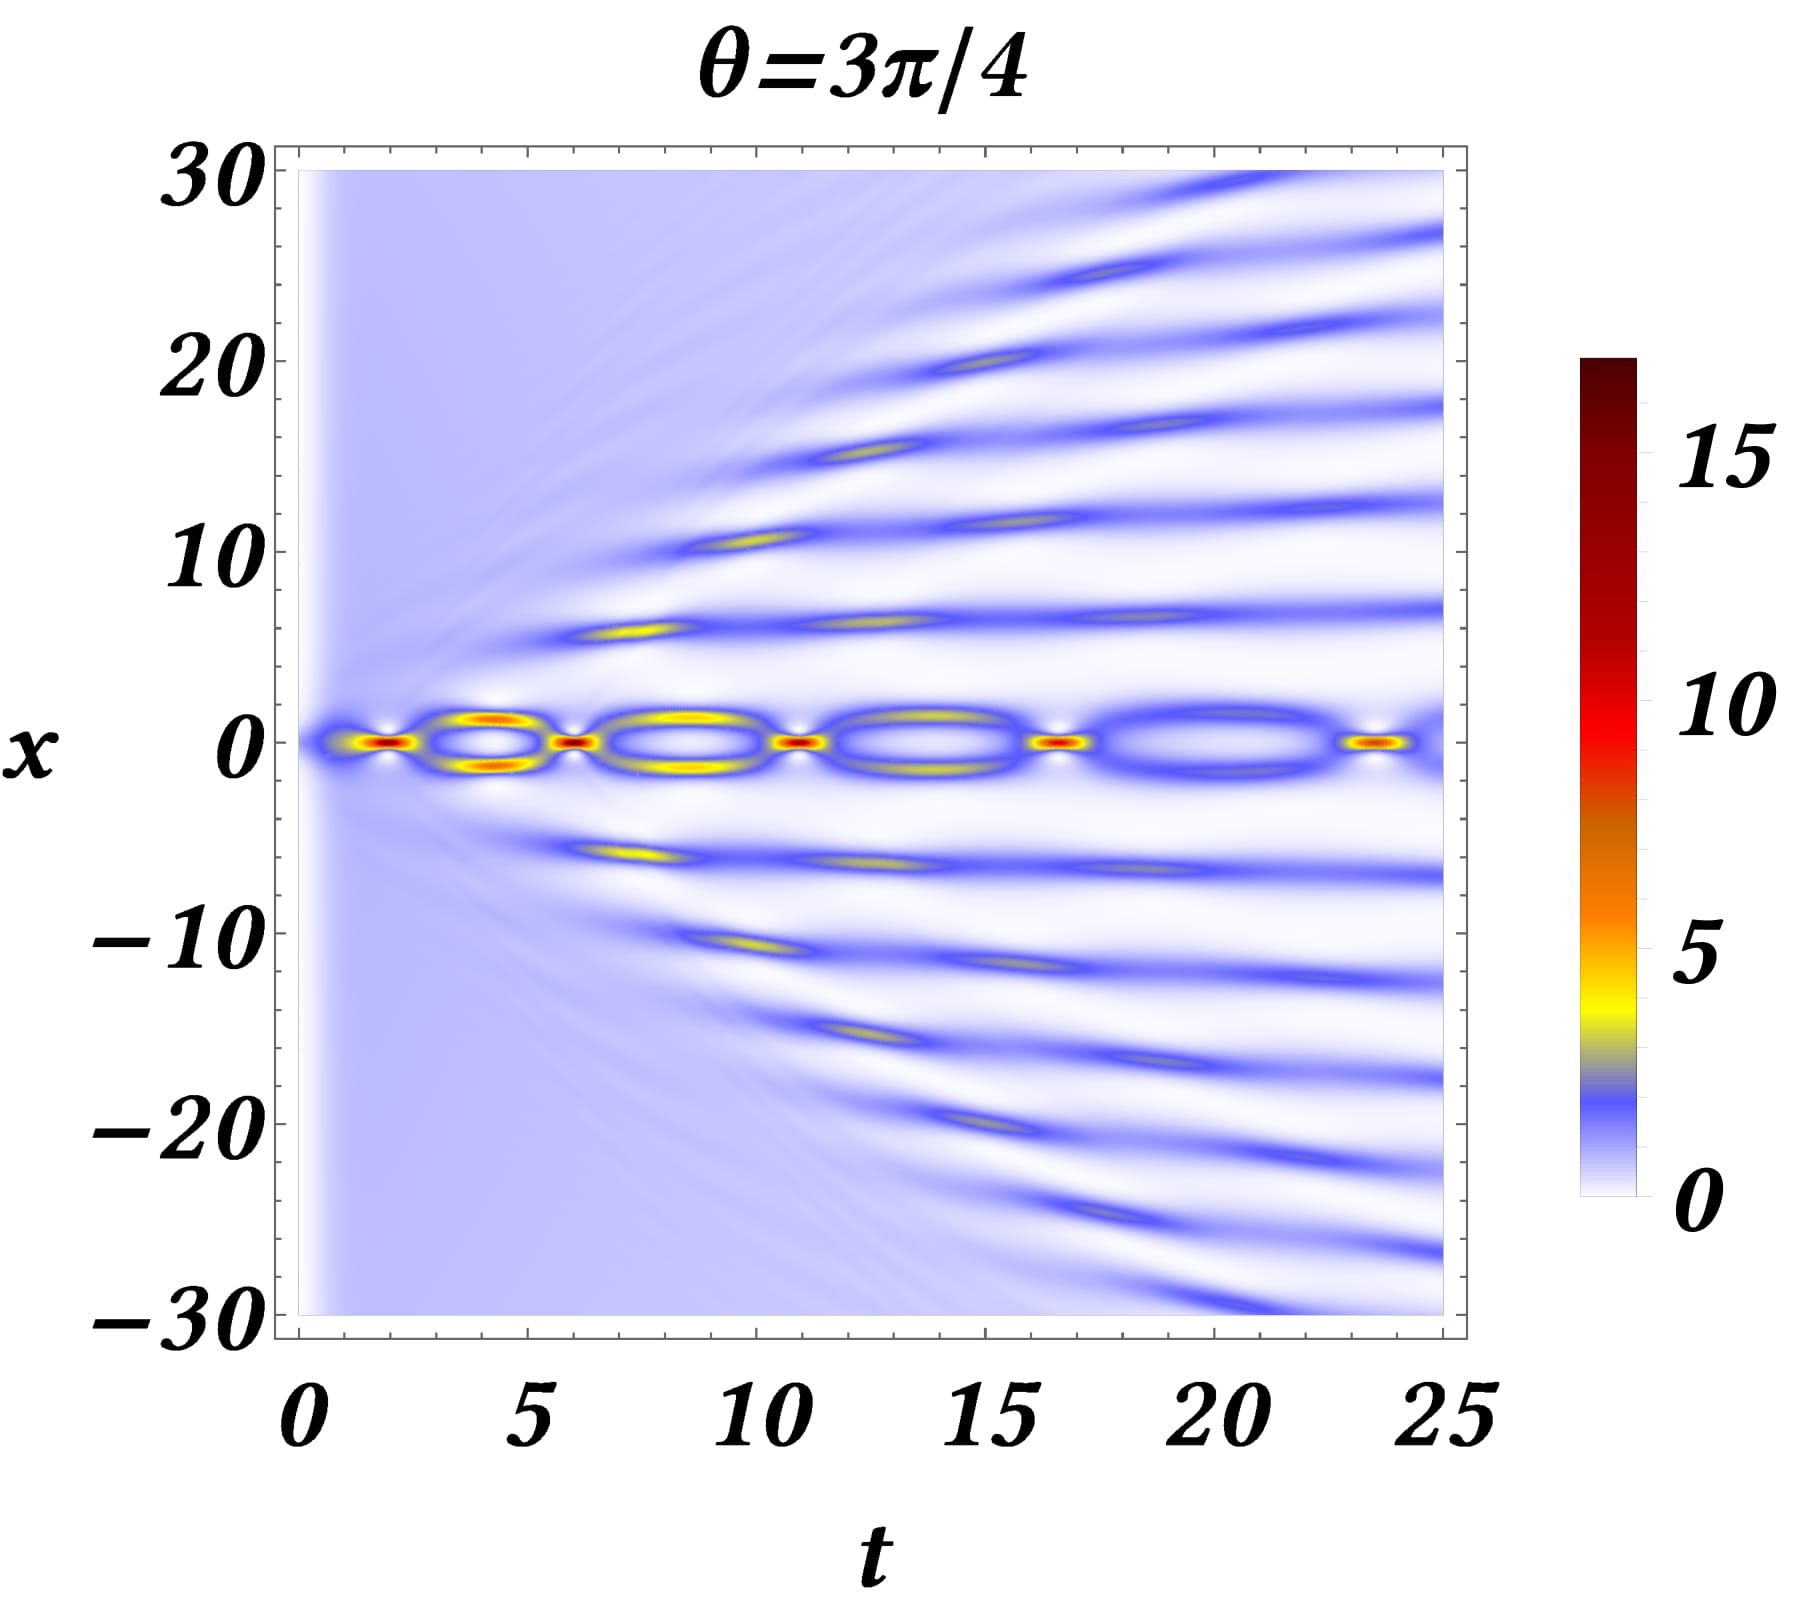
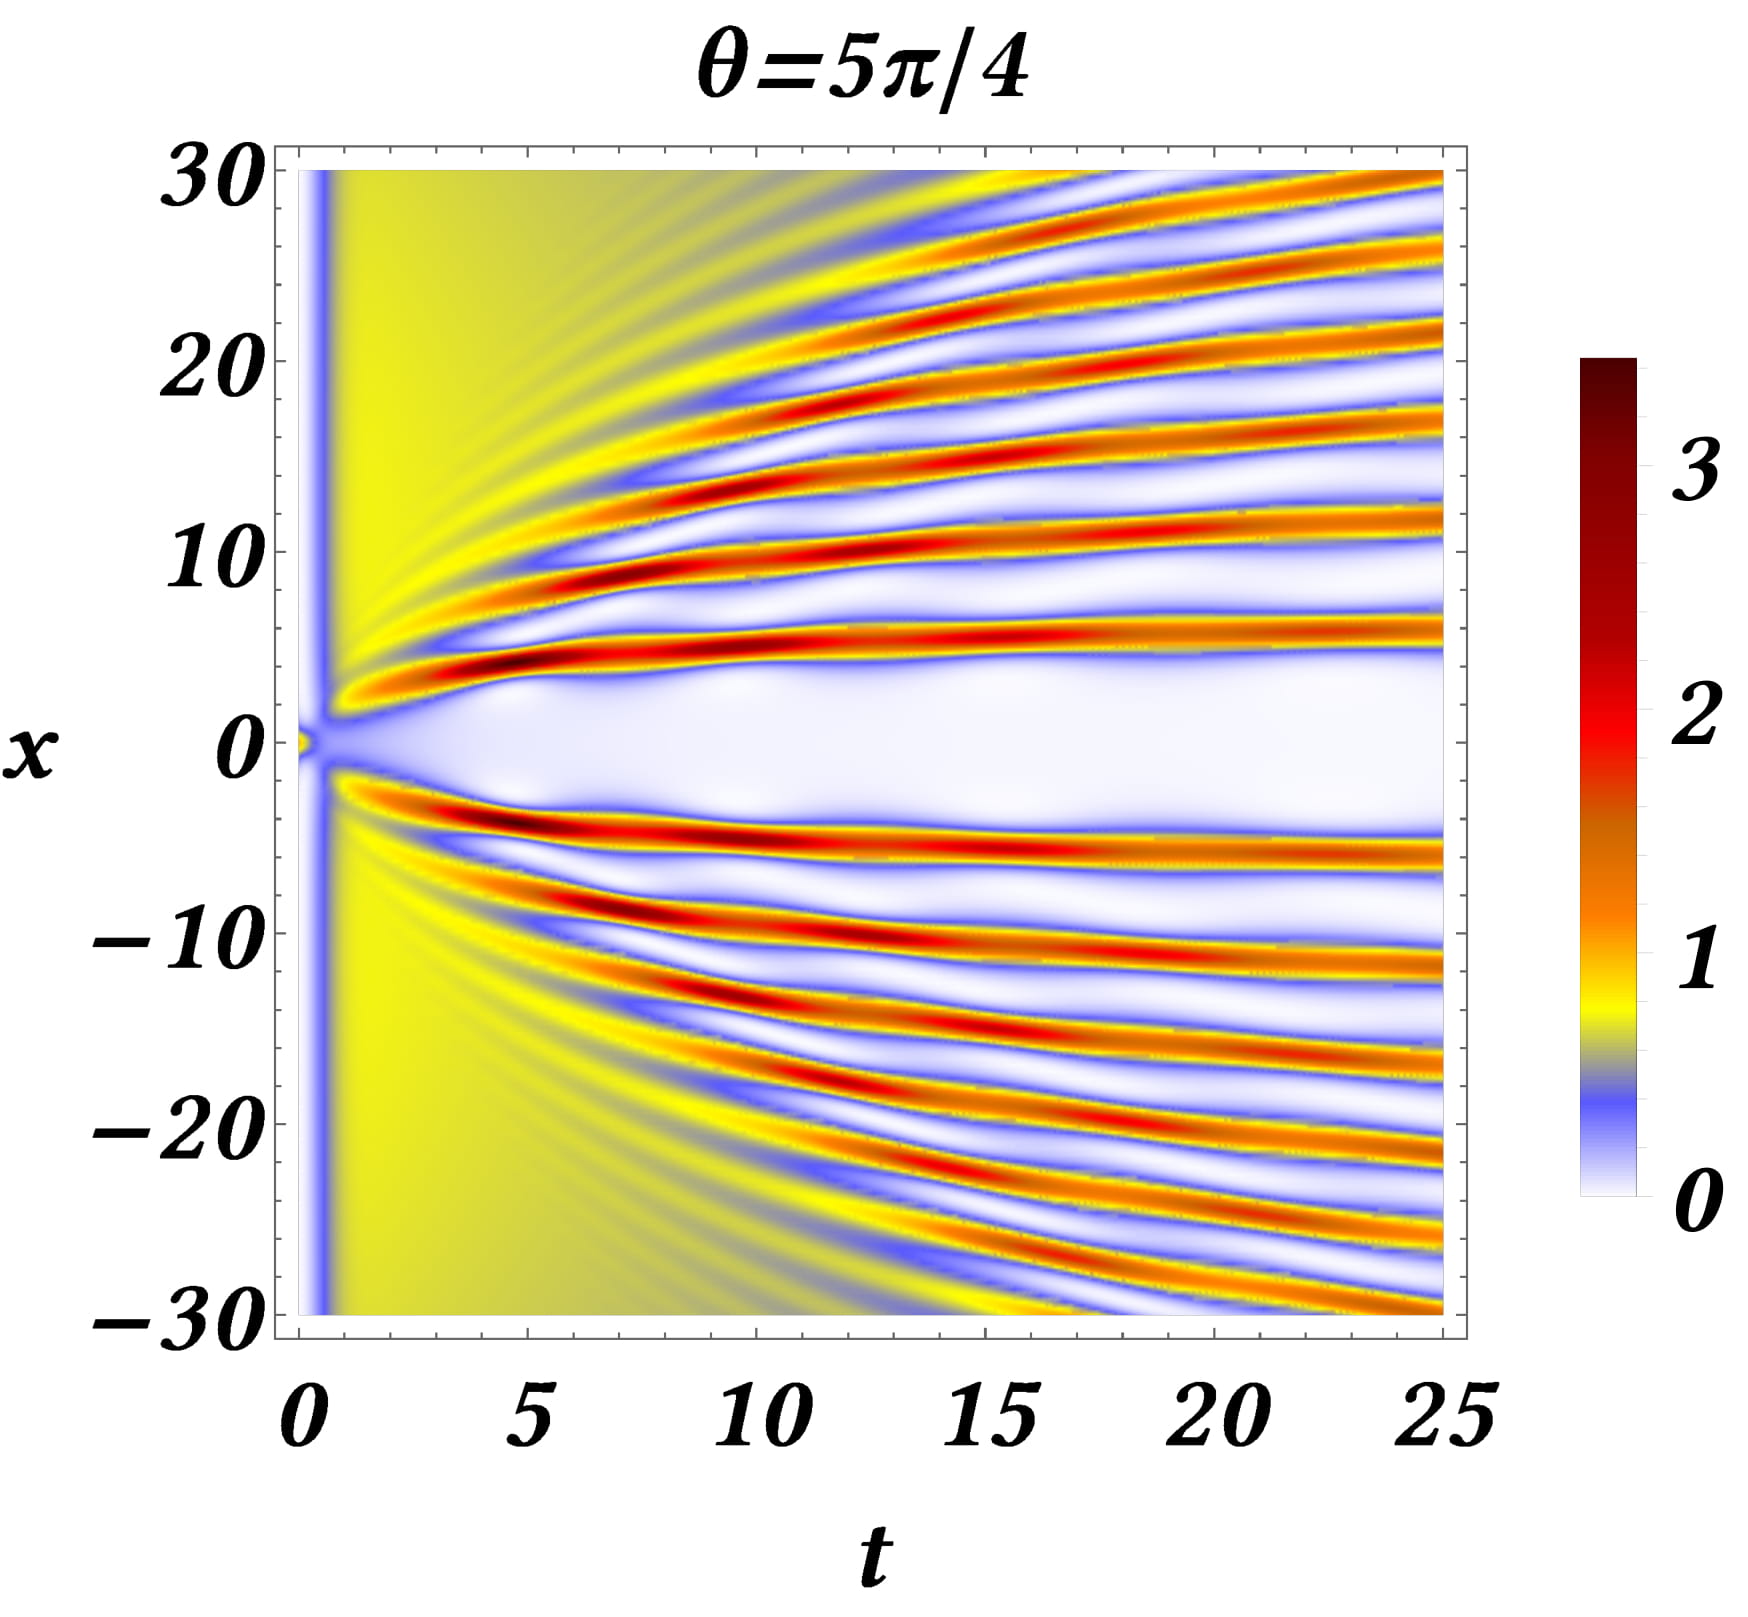
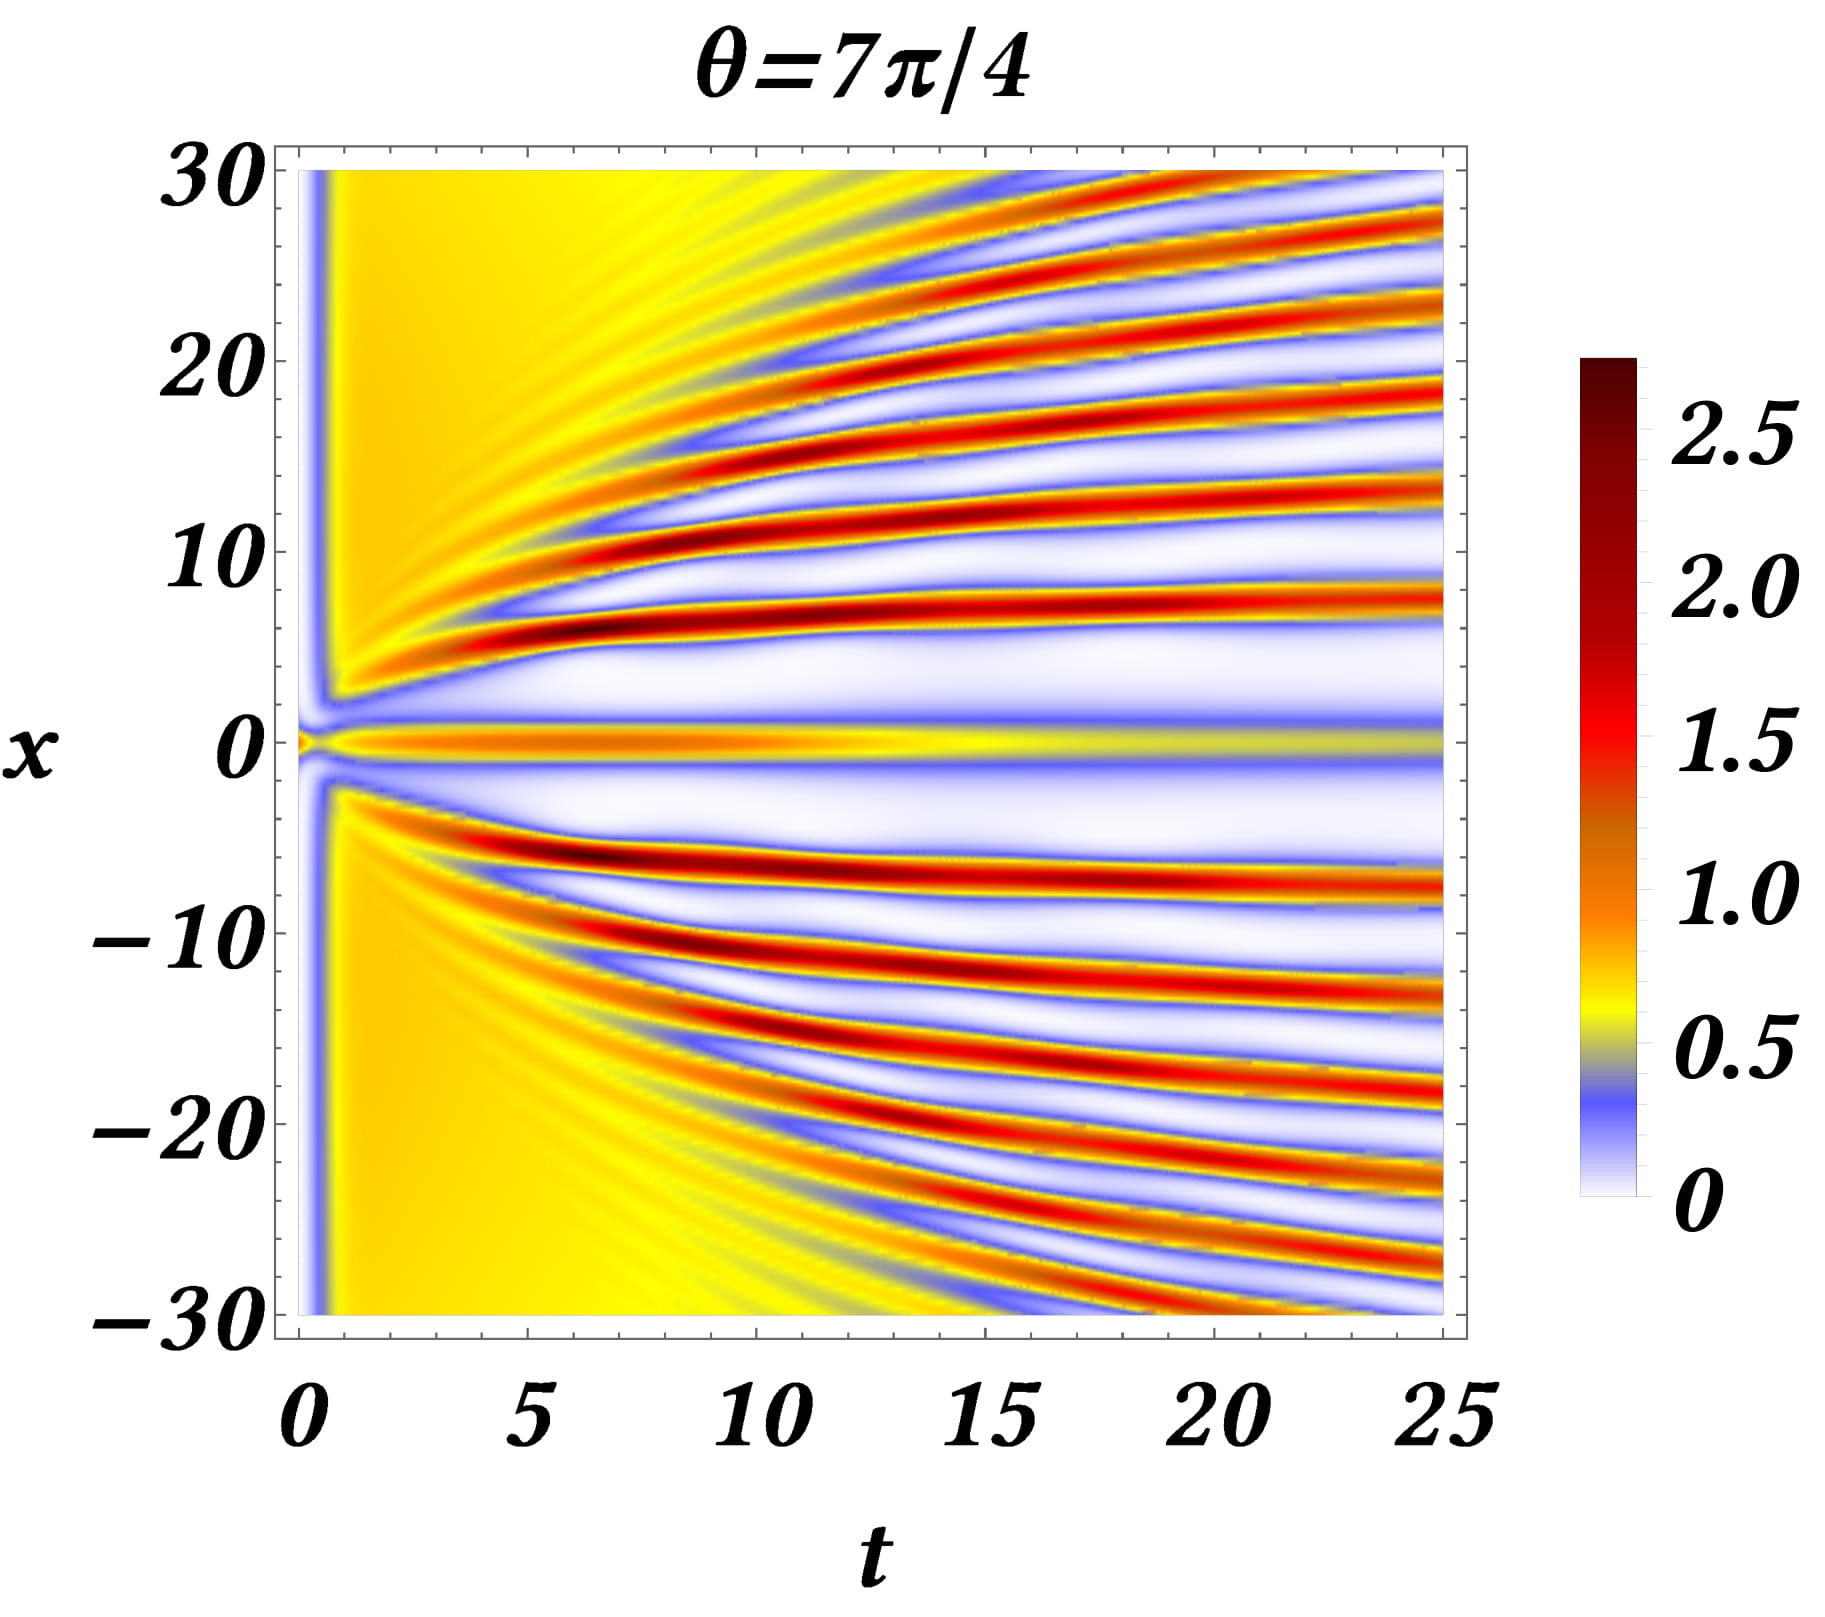
One of the most interesting features of the dynamics of (2) to highlight, is its dependence on the phase parameter of the forcing (6). We remark that in contrast with the integrable limit , or the damped but unforced limit, the damped and forced NLS (2) is not invariant under the gauge change of variables . Figure 9 depicts the distinct spatiotemporal patterns produced when the phase of the forcing is changing counter-clockwise along the diagonals. Here, we assume variation of a constant phase angle along the complex plane without a spatial variation thereof. The initial condition is the quadratically decaying (4) and the rest of parameters are fixed as in the study of Fig. 1; similar patterns are produced by the exponentially decaying (5). The upper left panel repeats (for completeness of the presentation and for a shorter time span) the pattern of Fig. 8 associated with the emergence of PRW as first event, when the phase of the forcing is . When the pattern changes drastically, as shown in the upper right panel: we observe in the center, the emergence of a breathing mode reminiscent of the core of a Kuznetsov-Ma (KM) breather state. The bottom row shows the patterns when and . The dynamics in these cases are not producing extreme-wave events but are reminiscent of the waveforms emerging as a result of the modulational instability in its nonlinear stage as analysed in Ref. BM . Yet, we observe a remarkable difference between these two cases, in the evolution of the center: while in both cases the division of the spatial domain in the left and right -periodic fields is similar, when a density hump is absent in the center, but is present with an almost stationary evolution when . We remark that a complex mixture of the above patterns can be produced when varying between the above prototypical scenarios (not shown herein).
Therefore, varying the phase angle of the driver, we may reconstruct the prototypical spatiotemporal patterns associated to the emergence of extreme-wave events (including PS rogue waves and semi-classical type dynamics, among others) and the patterns associated with the nonlinear stage of the modulational instability. The above study on the dependence of the driver’s phase could be of relevance in the context of weakly nonlinear waves in the presence of wind forcing onorato1 ; brunetti ; DHZ19 . Particularly in DHZ19 , phase-shift effects could be potentially induced due to the stochastic nature of the driving. While the latter setup is not identical to the one considered herein, its exposition of the stochastic nature of the wind forcing (and the associated prefactor) lends relevance to the consideration of a phase variation herein.
Dependence of the dynamics on and
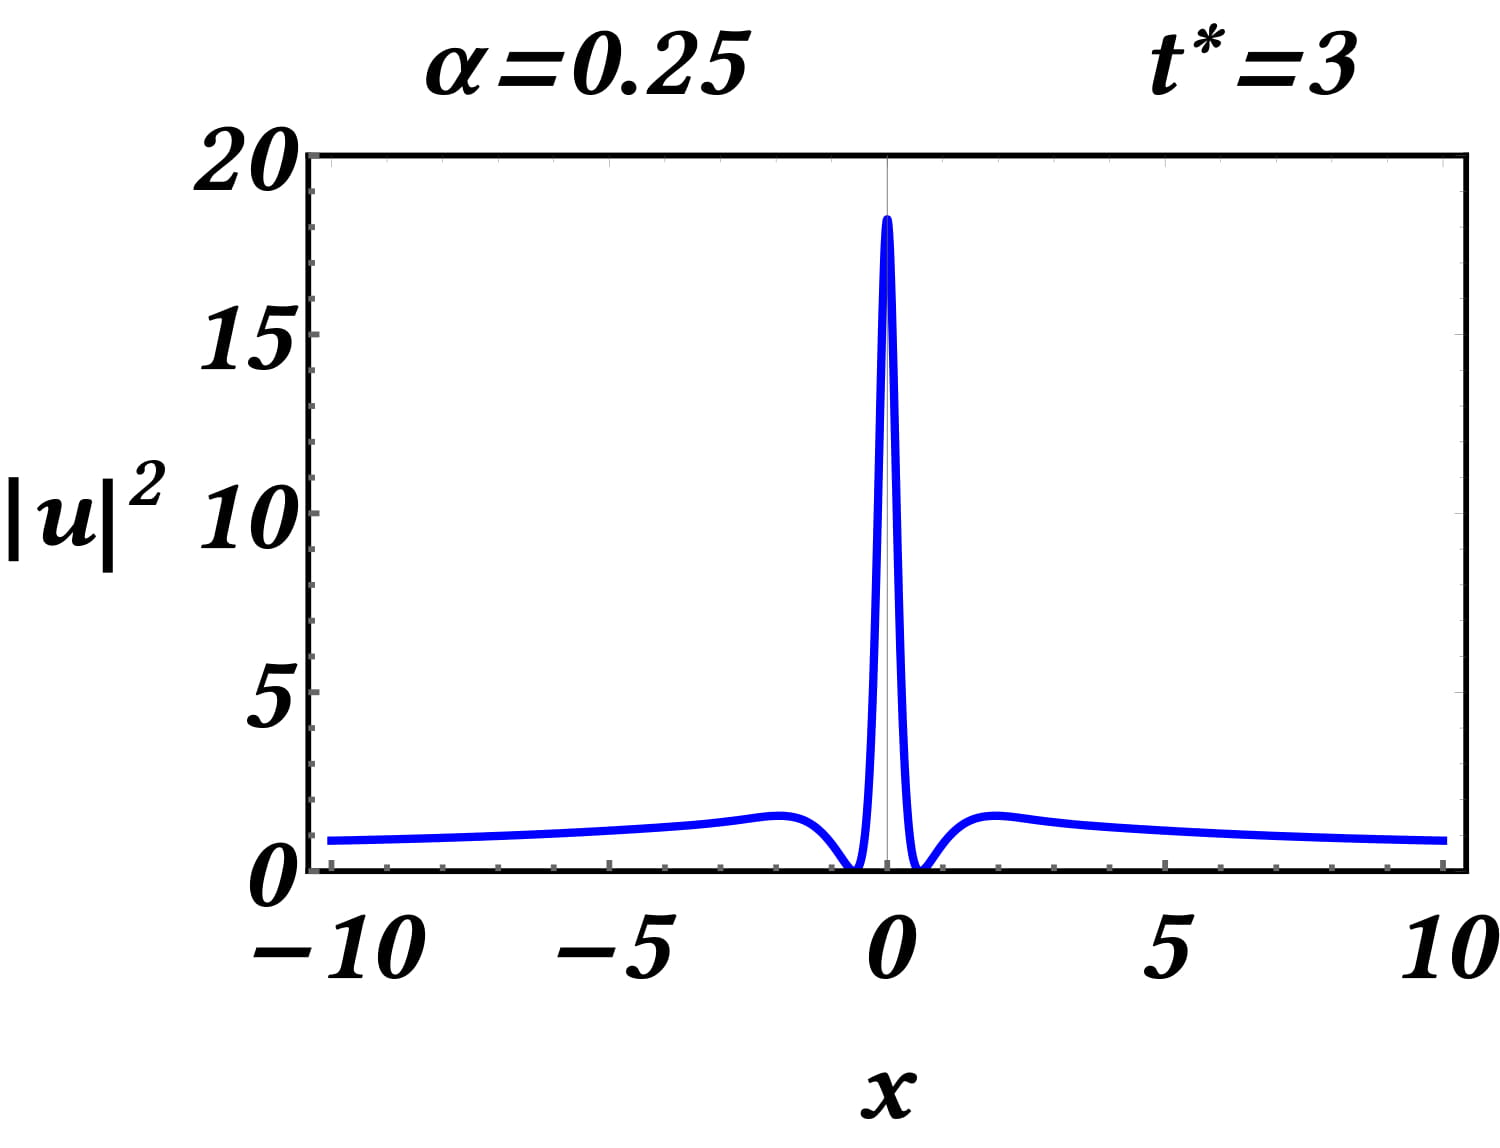
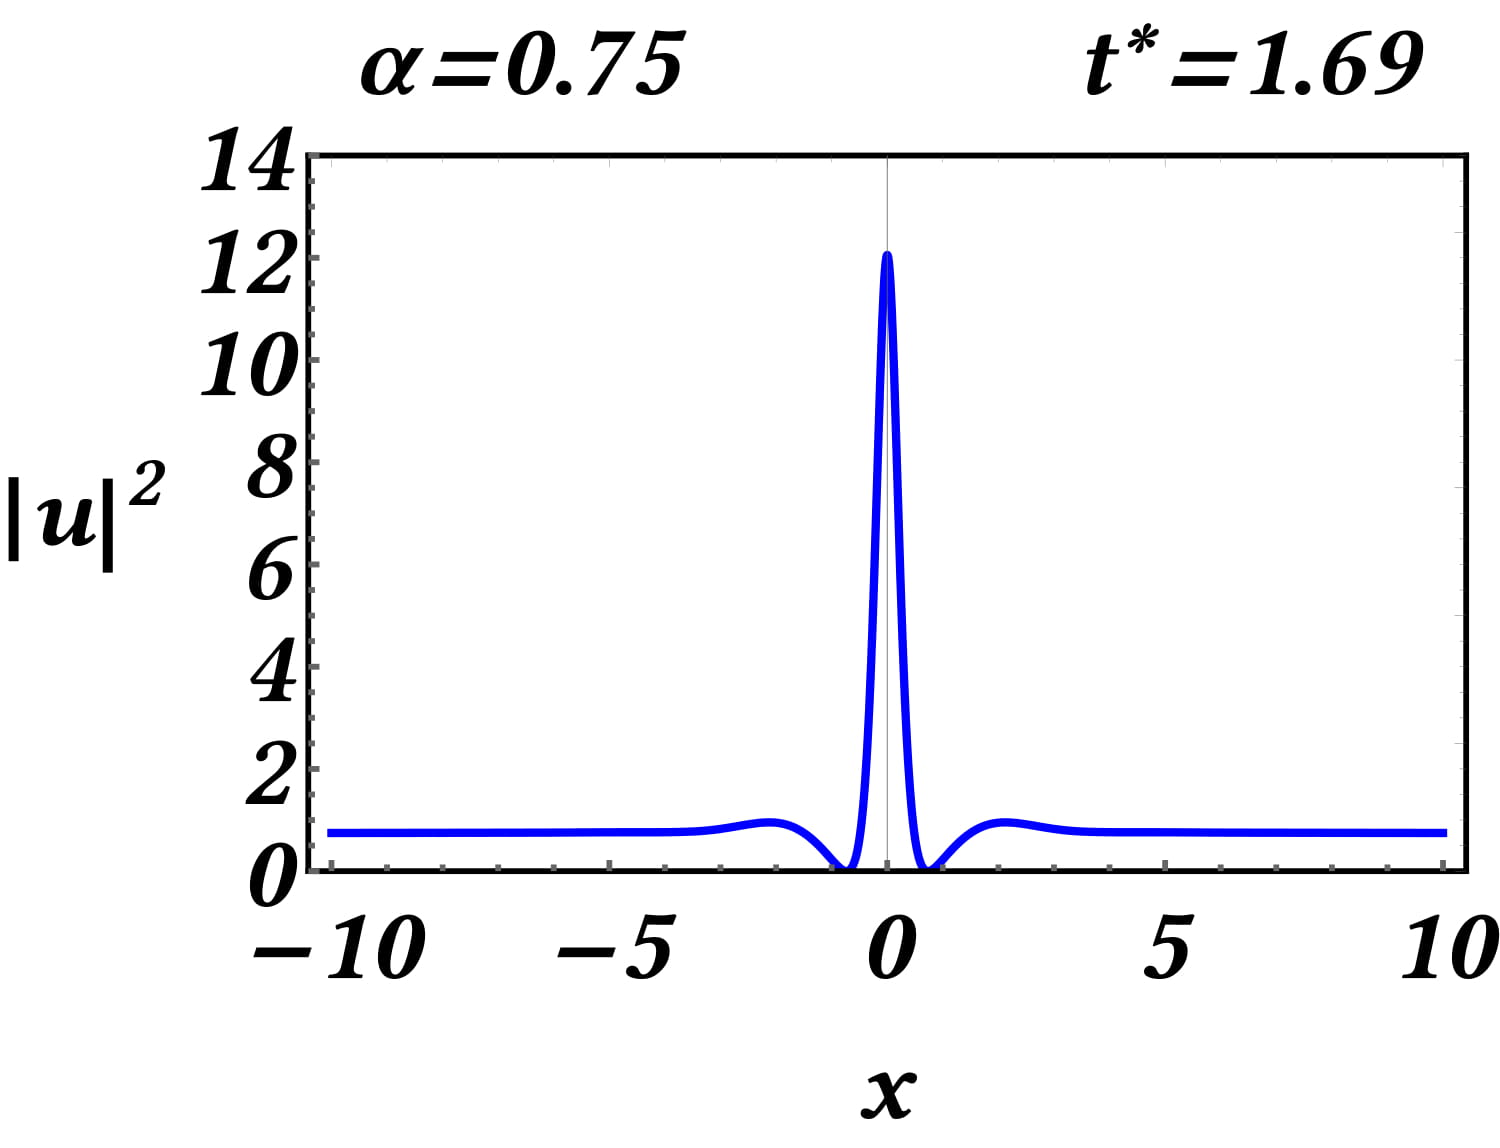
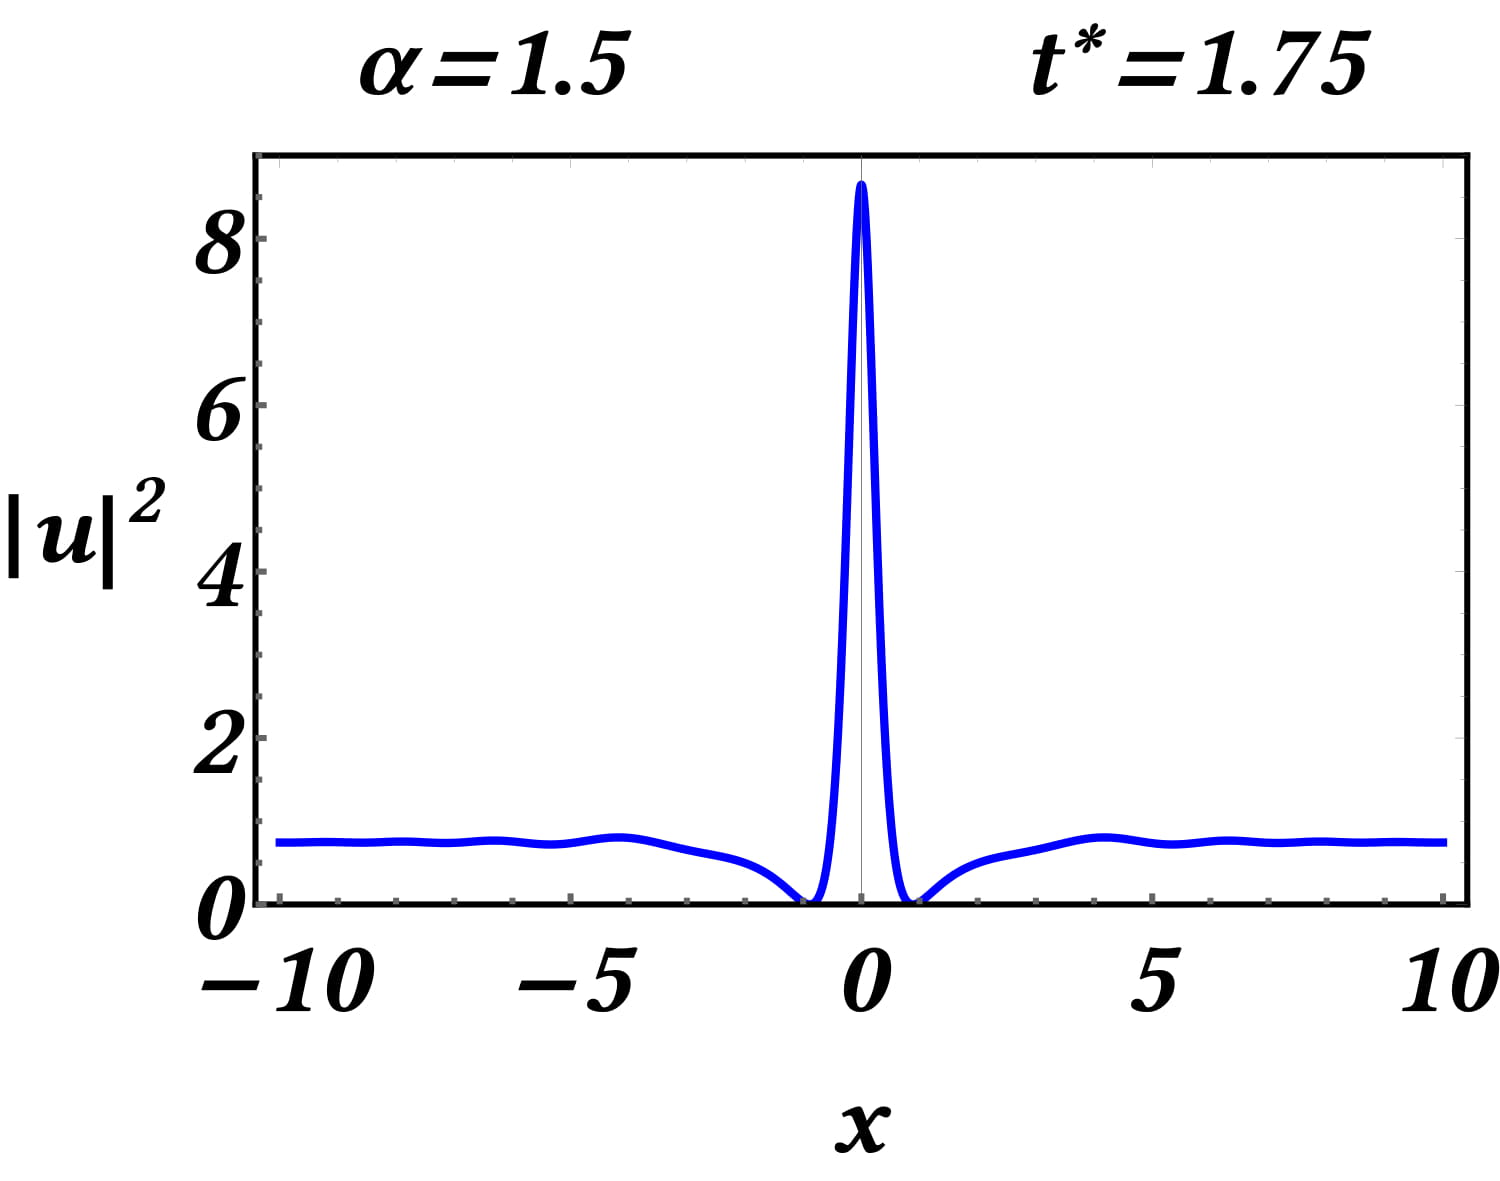
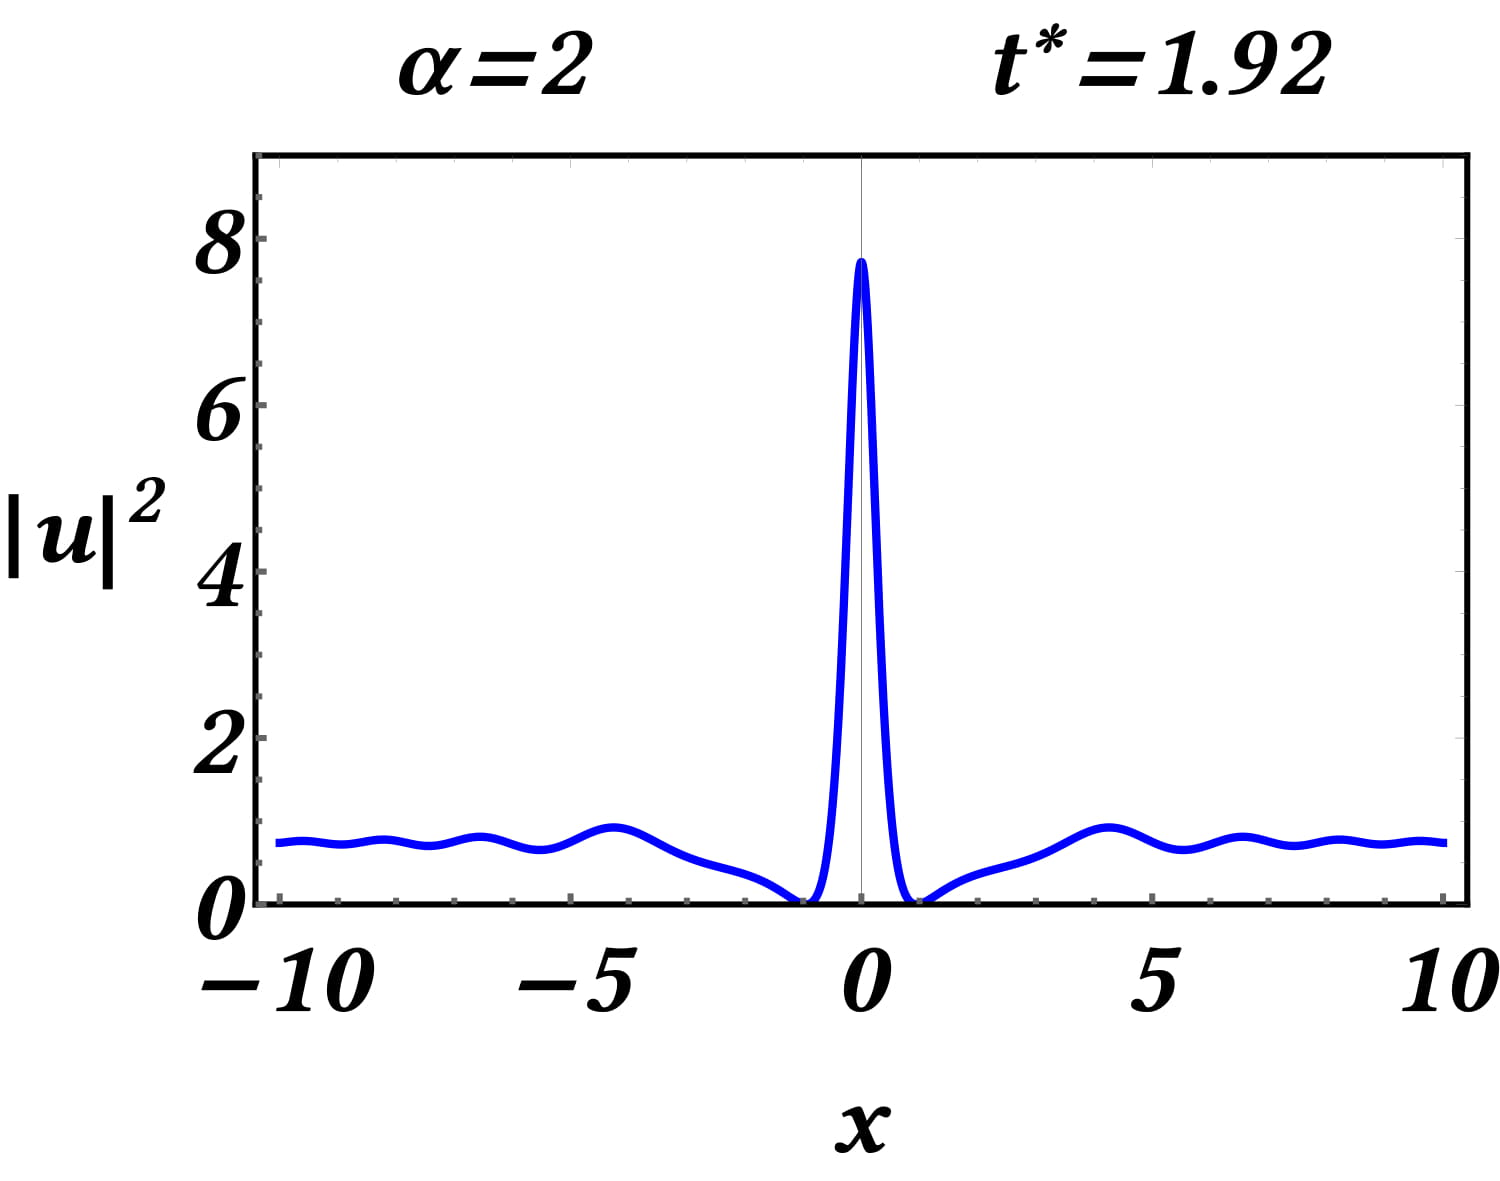
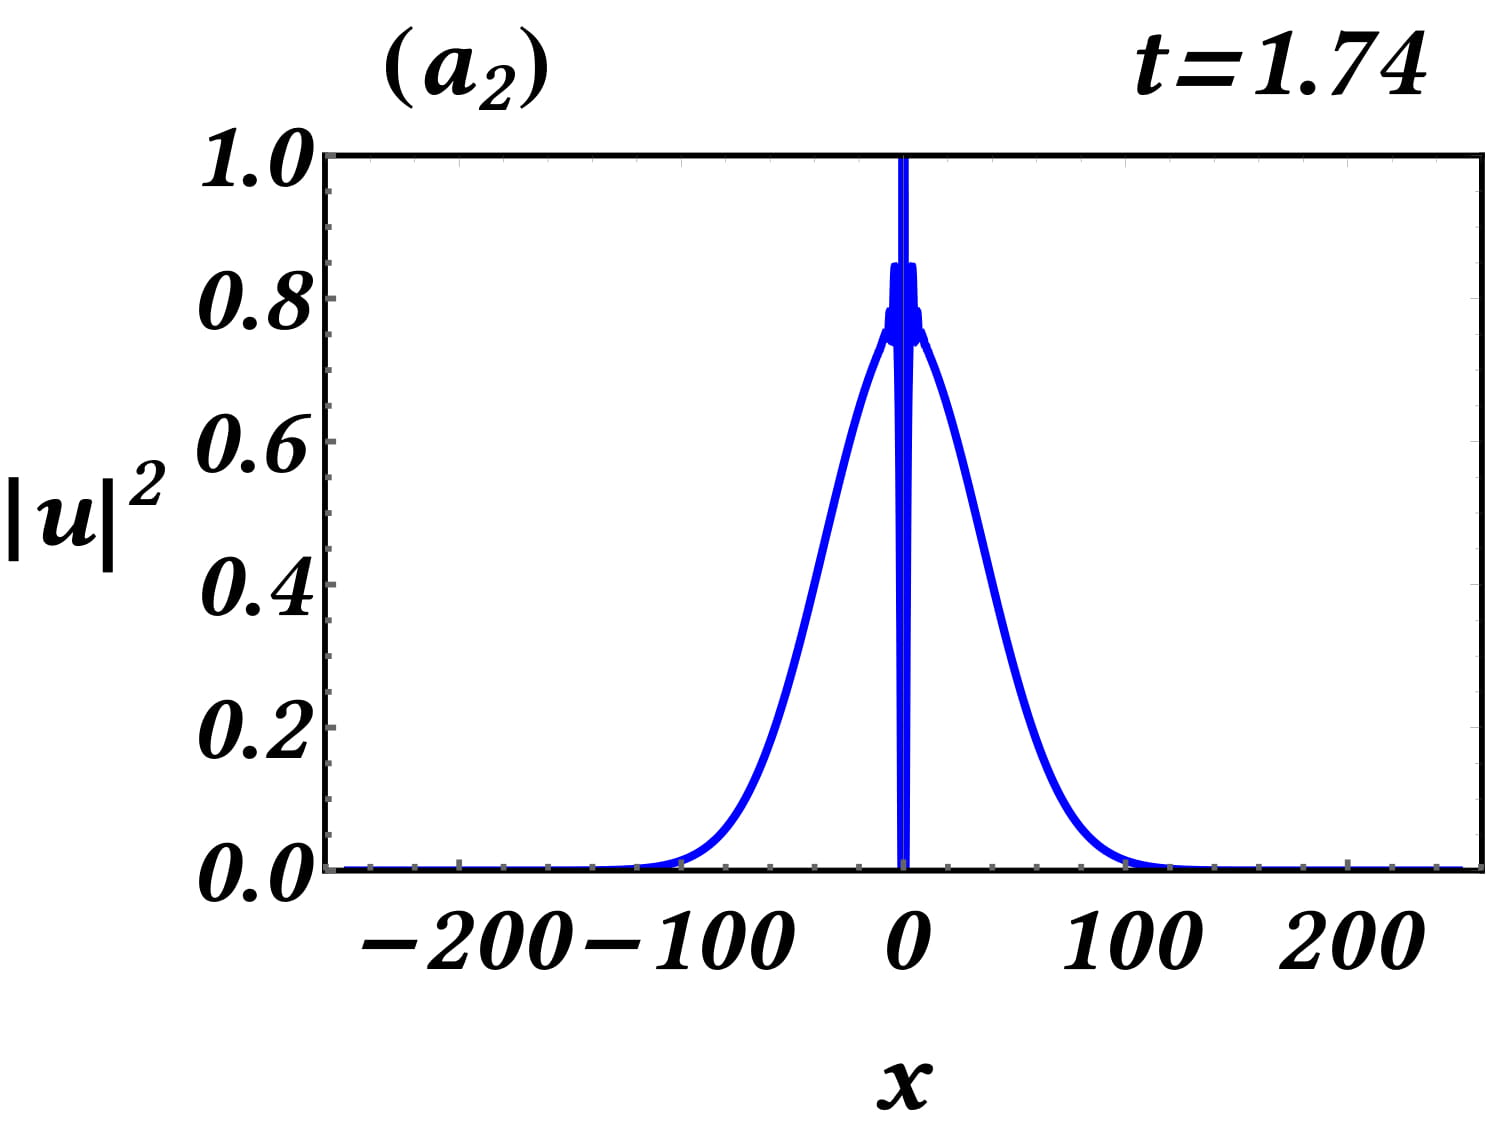
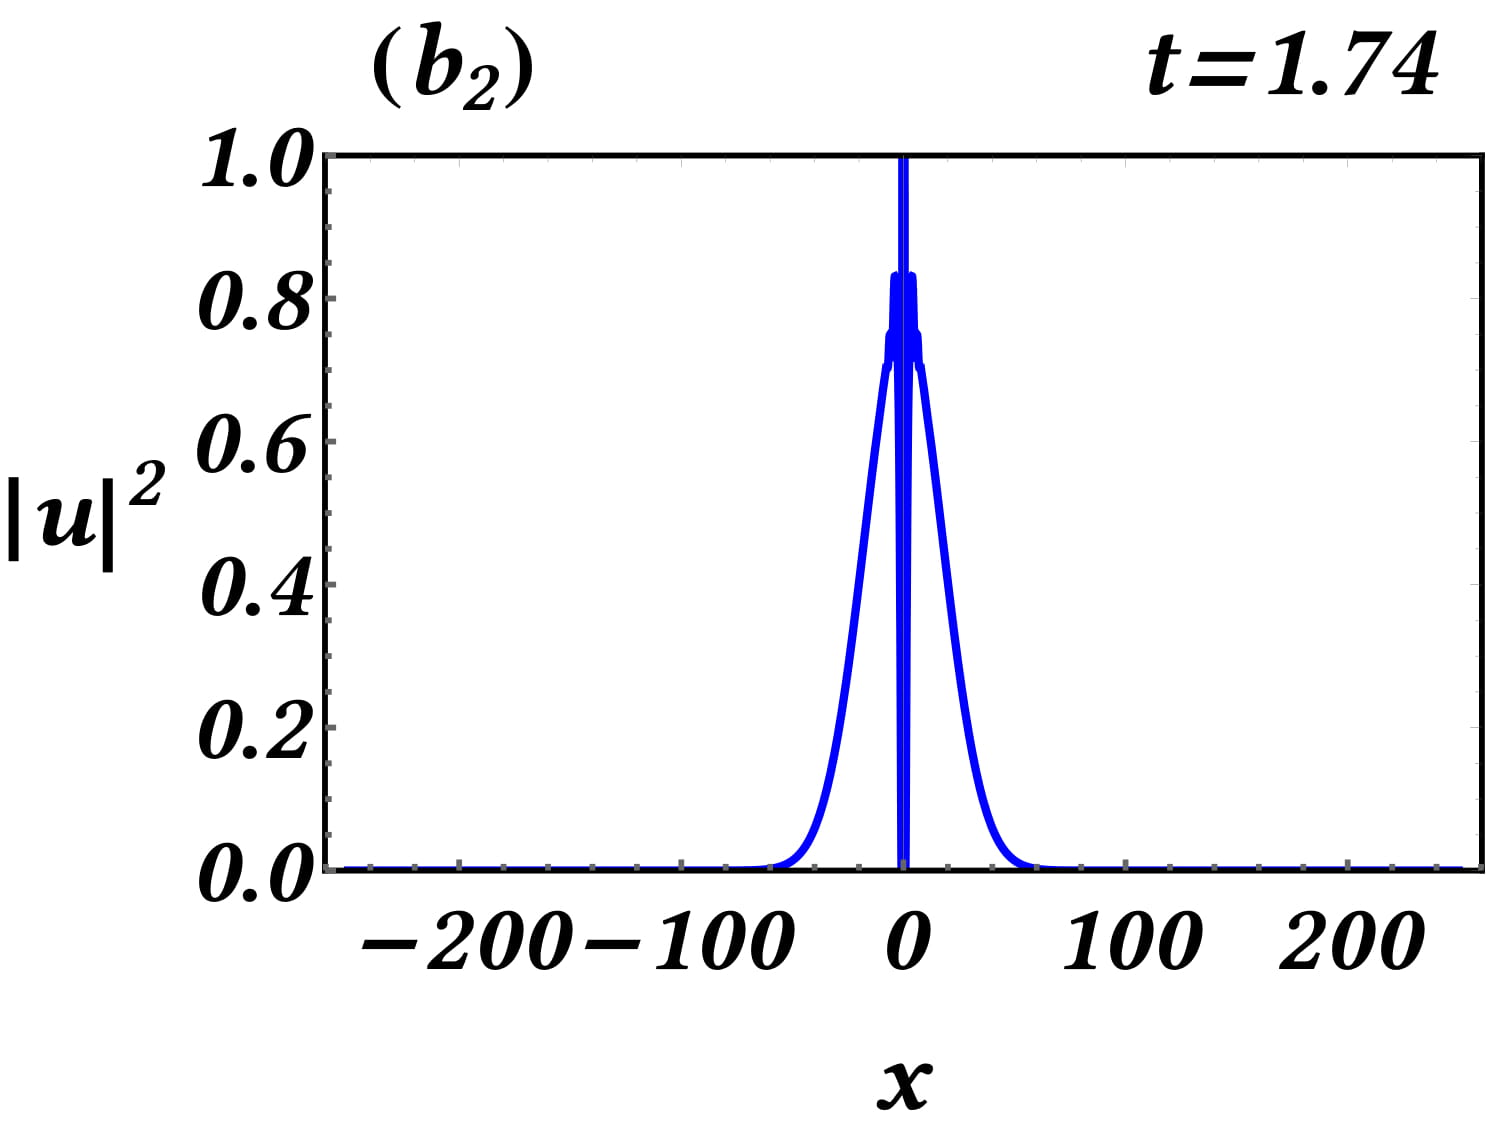
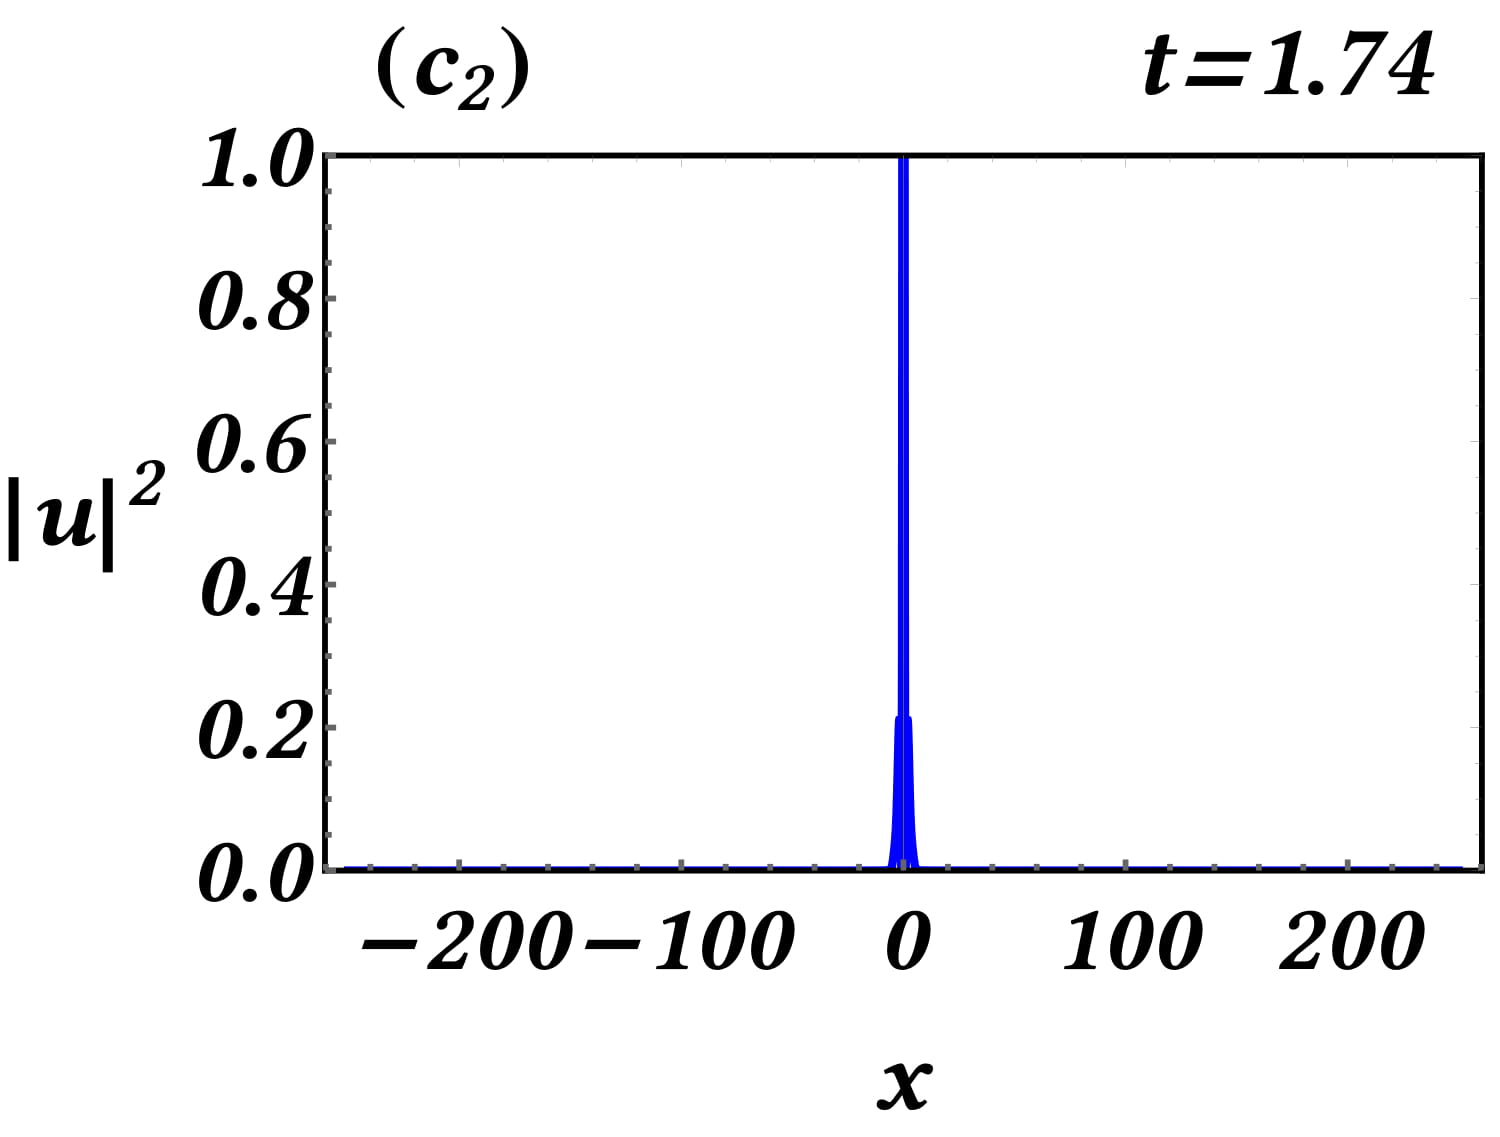
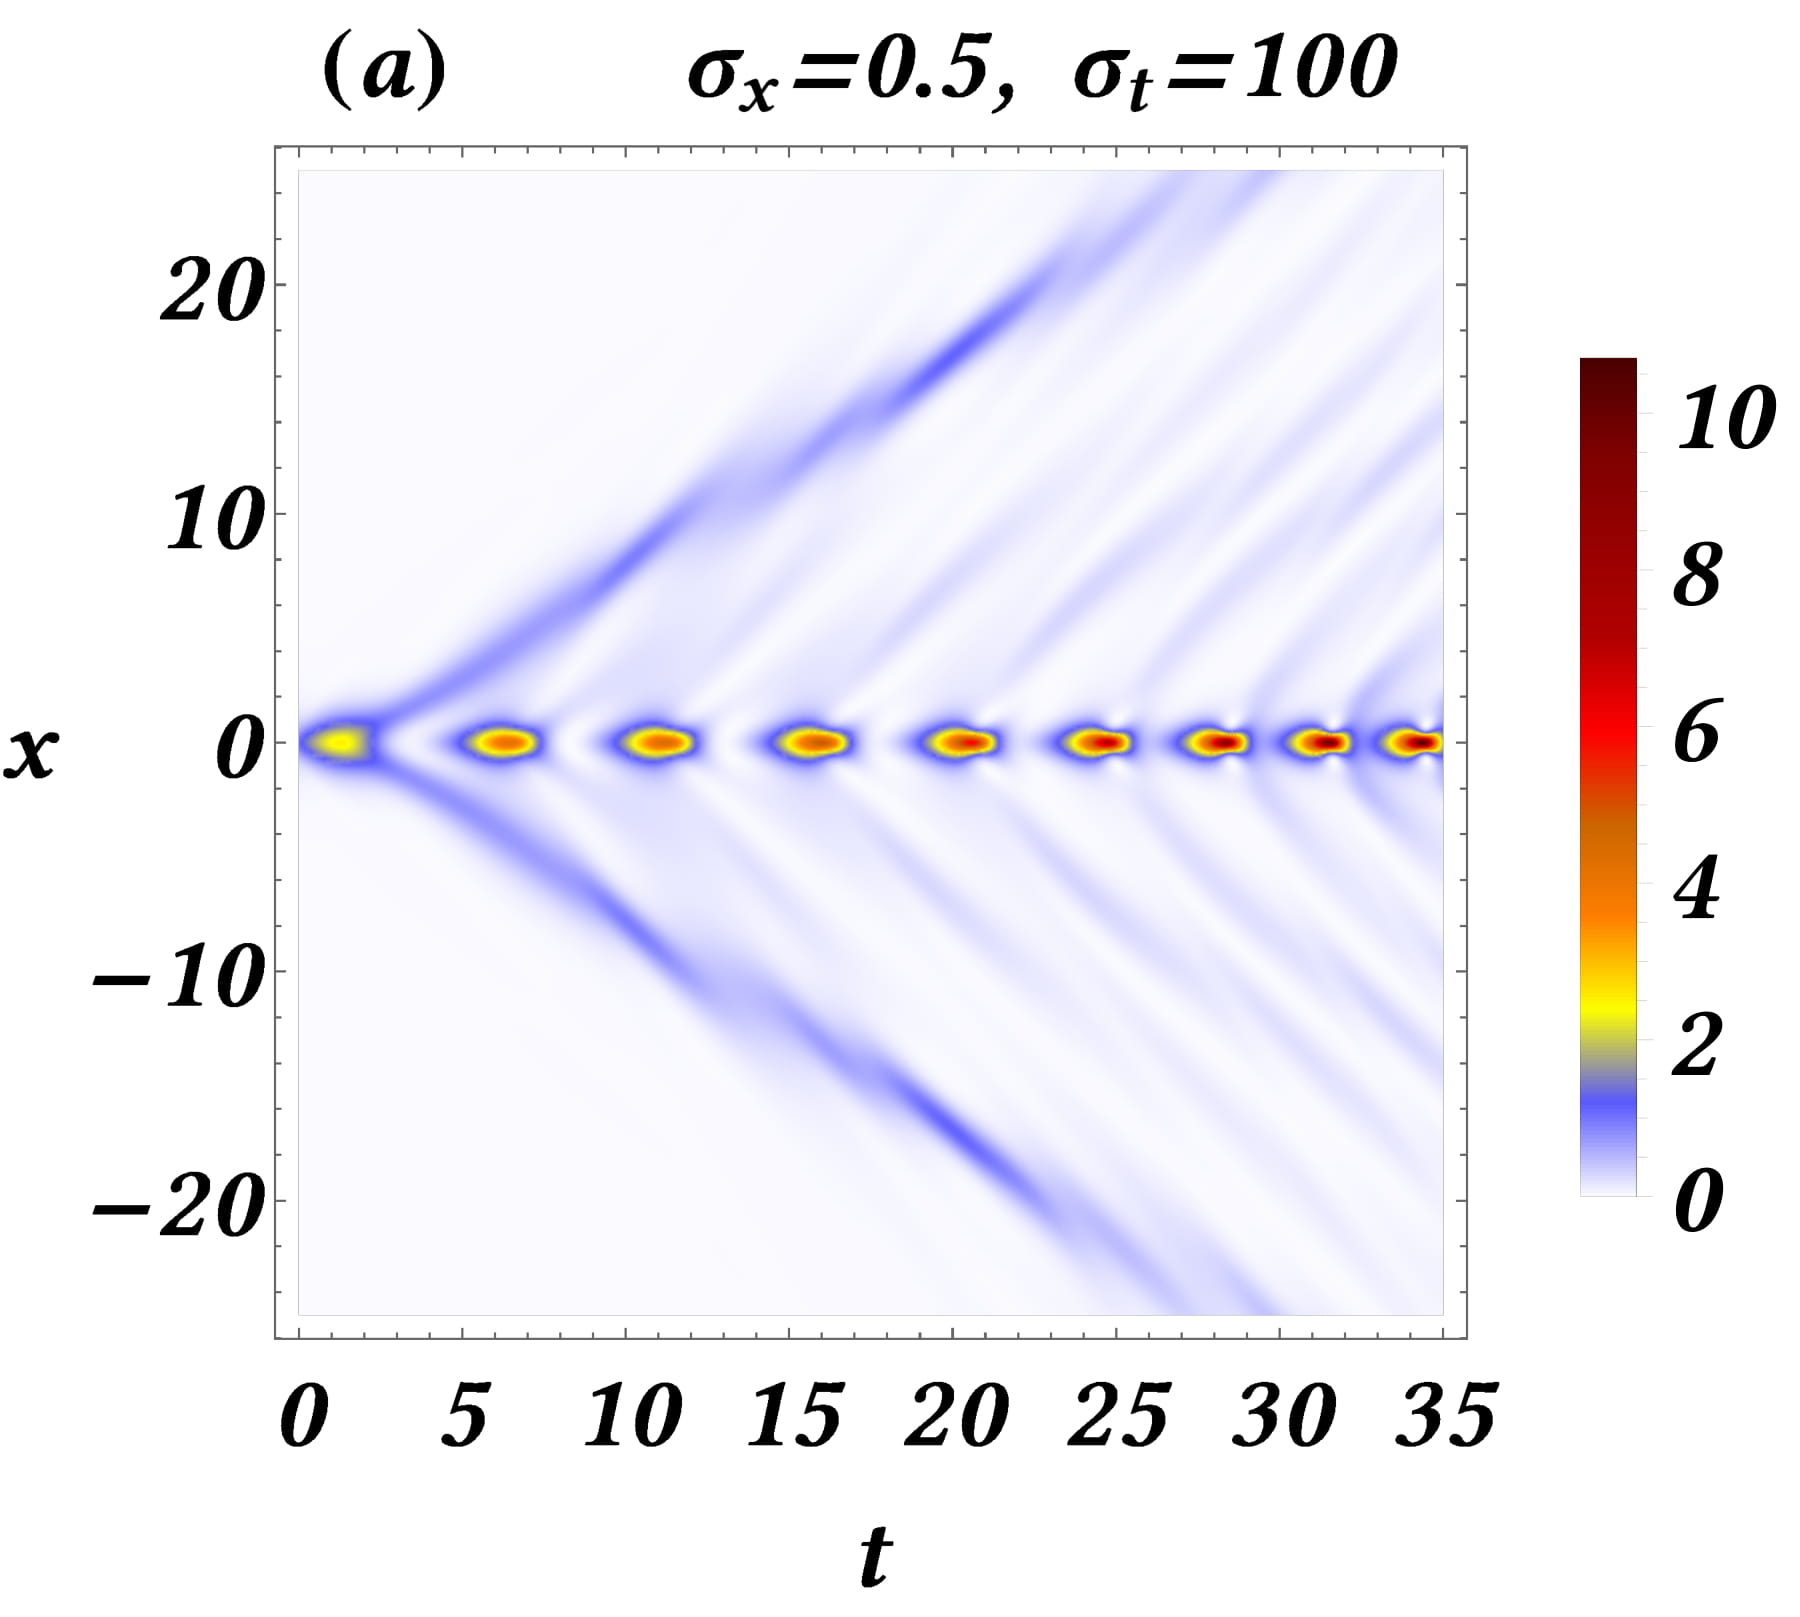
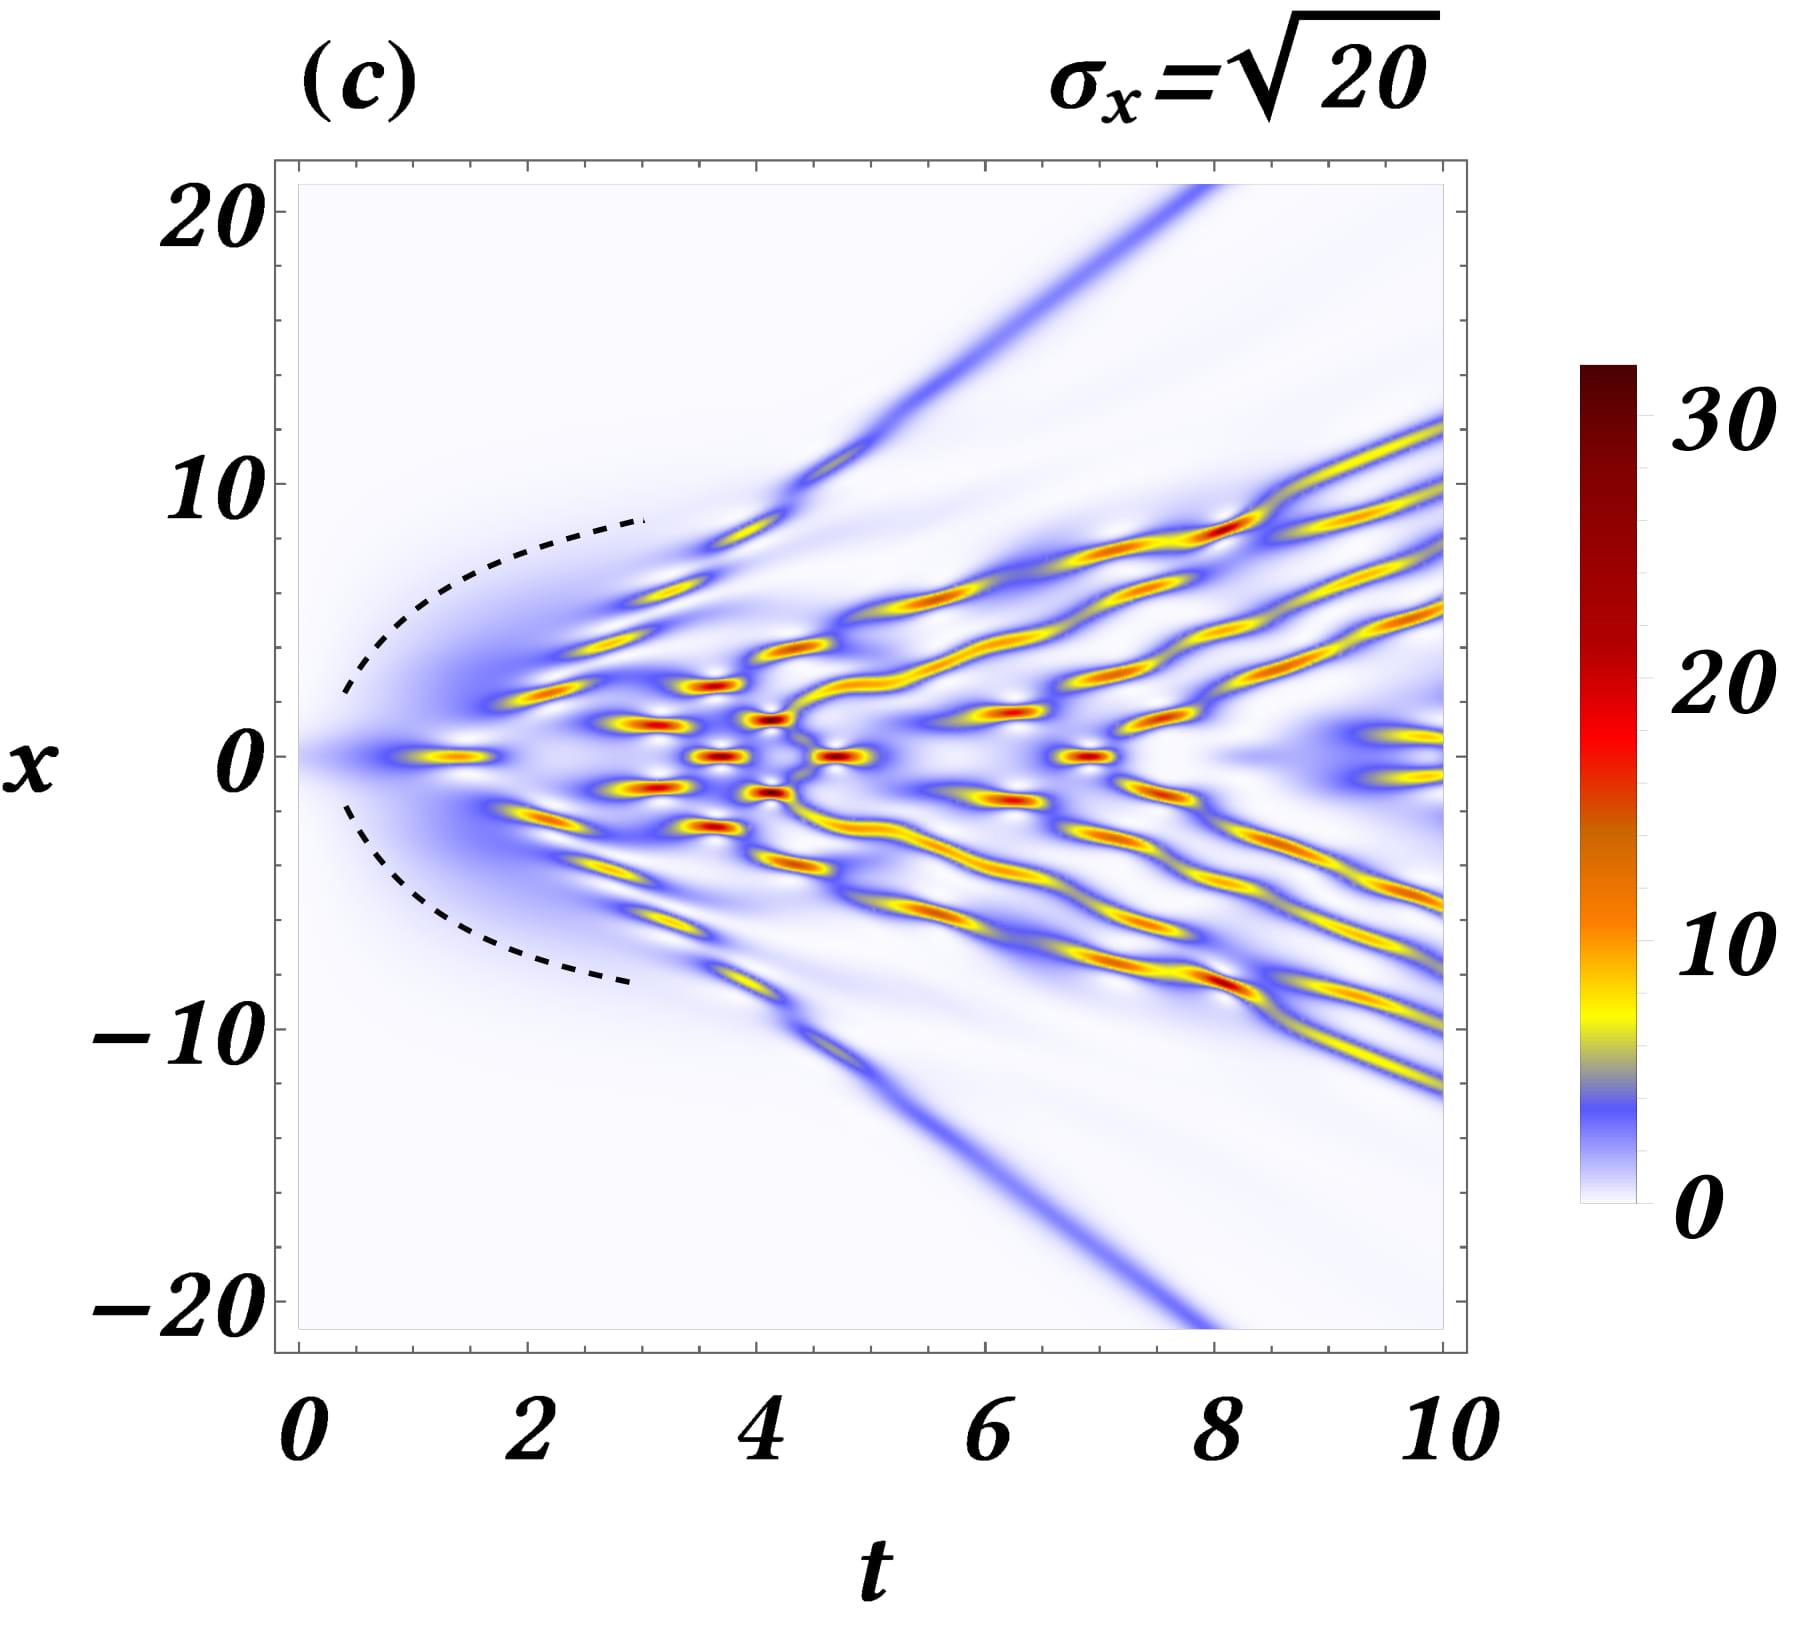
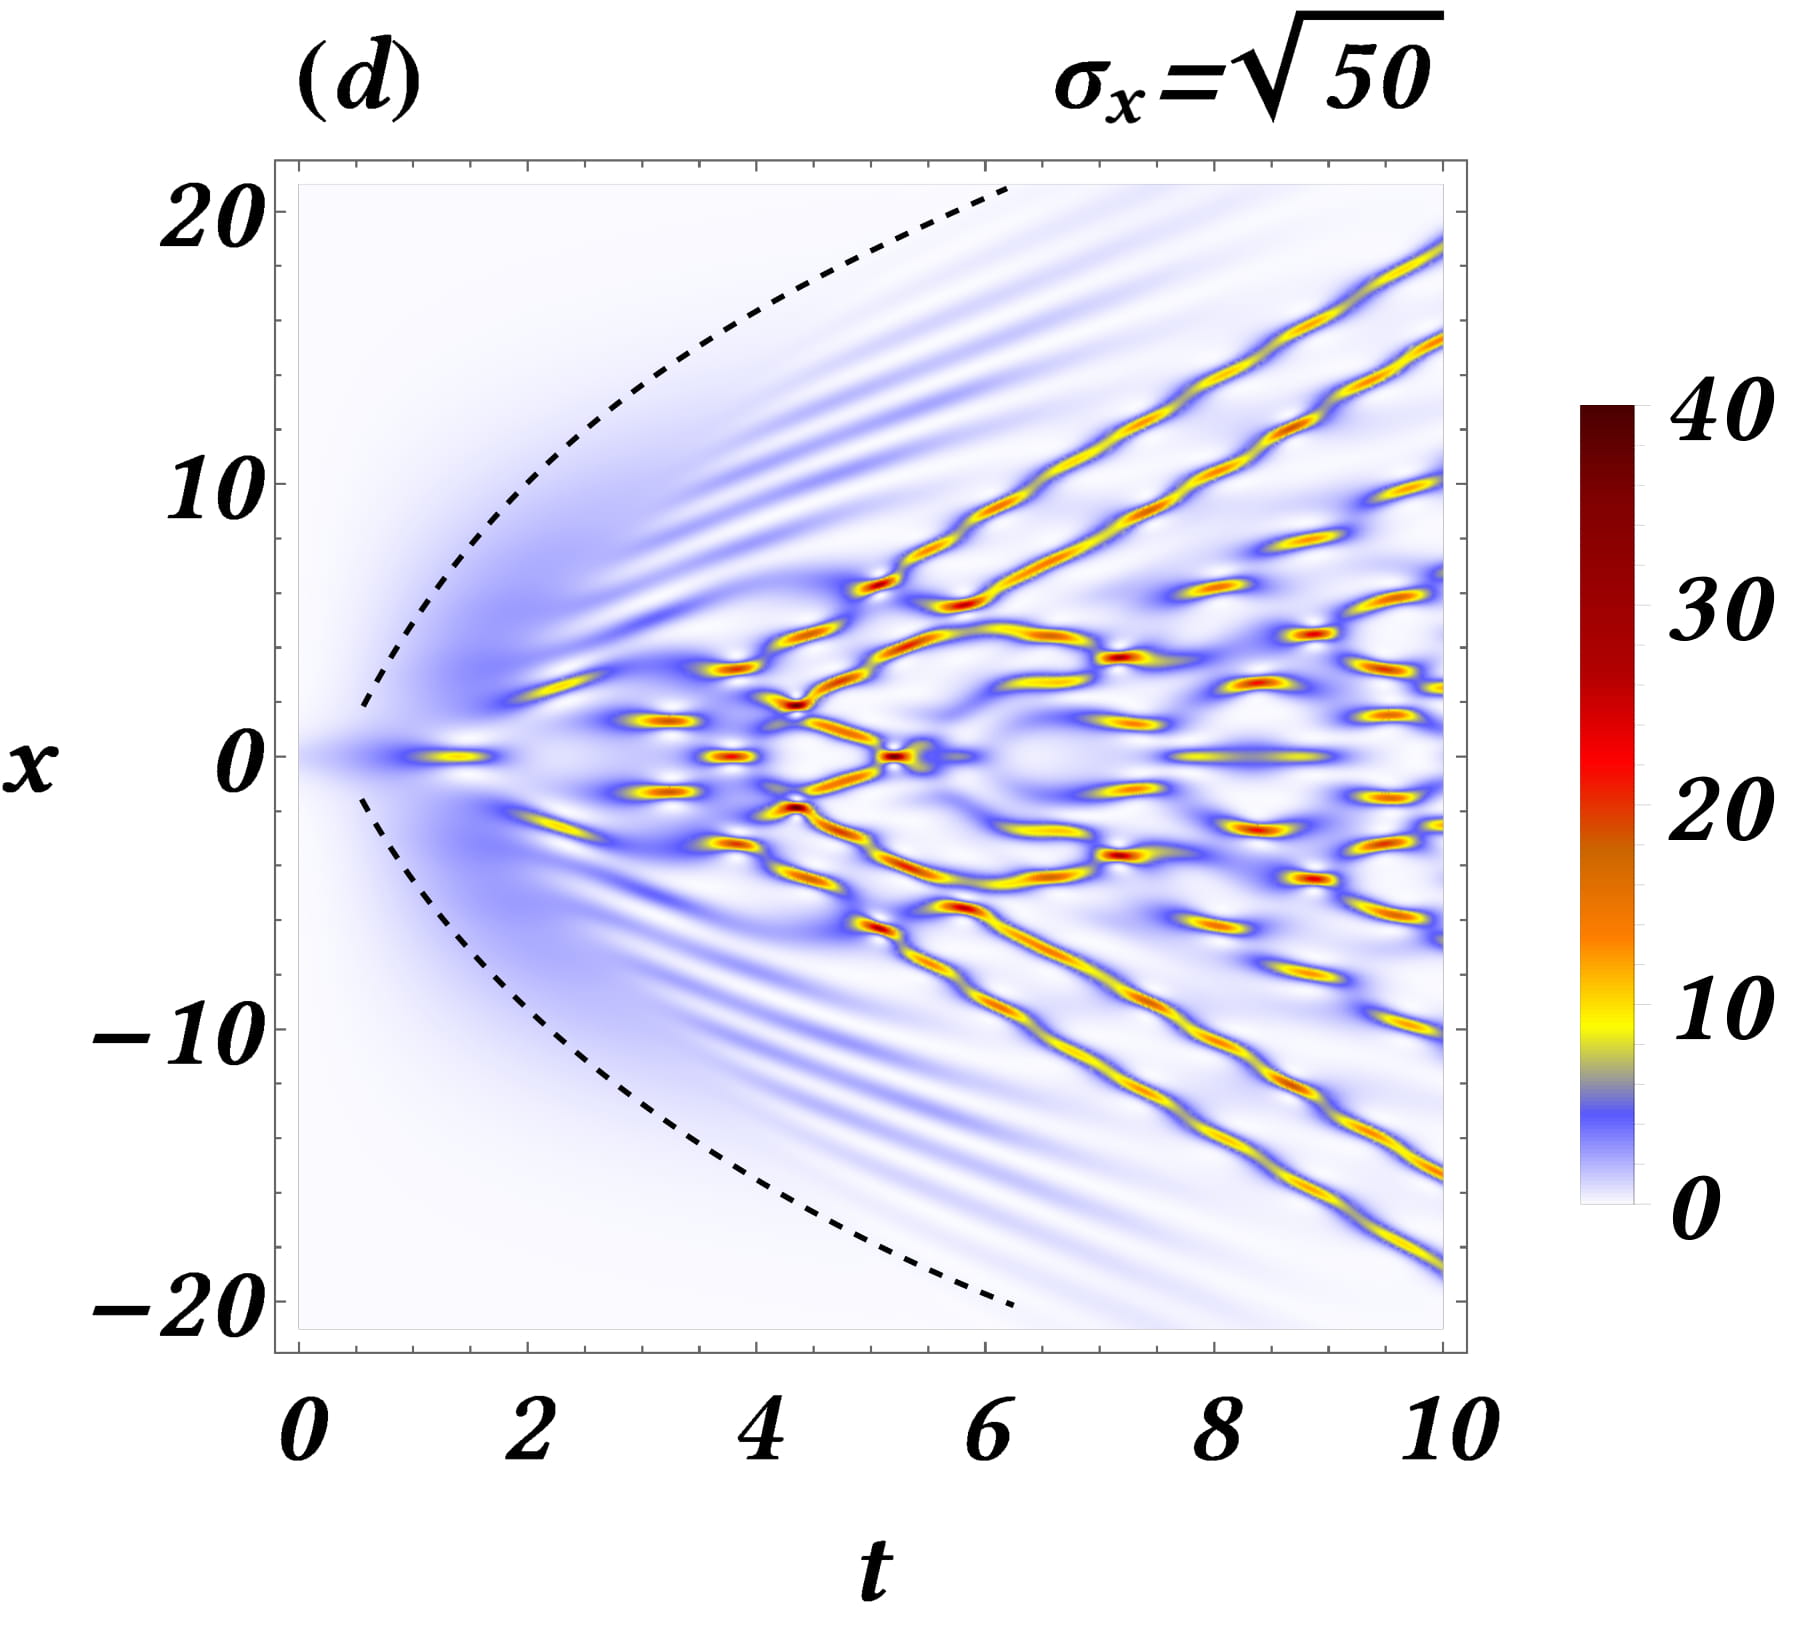
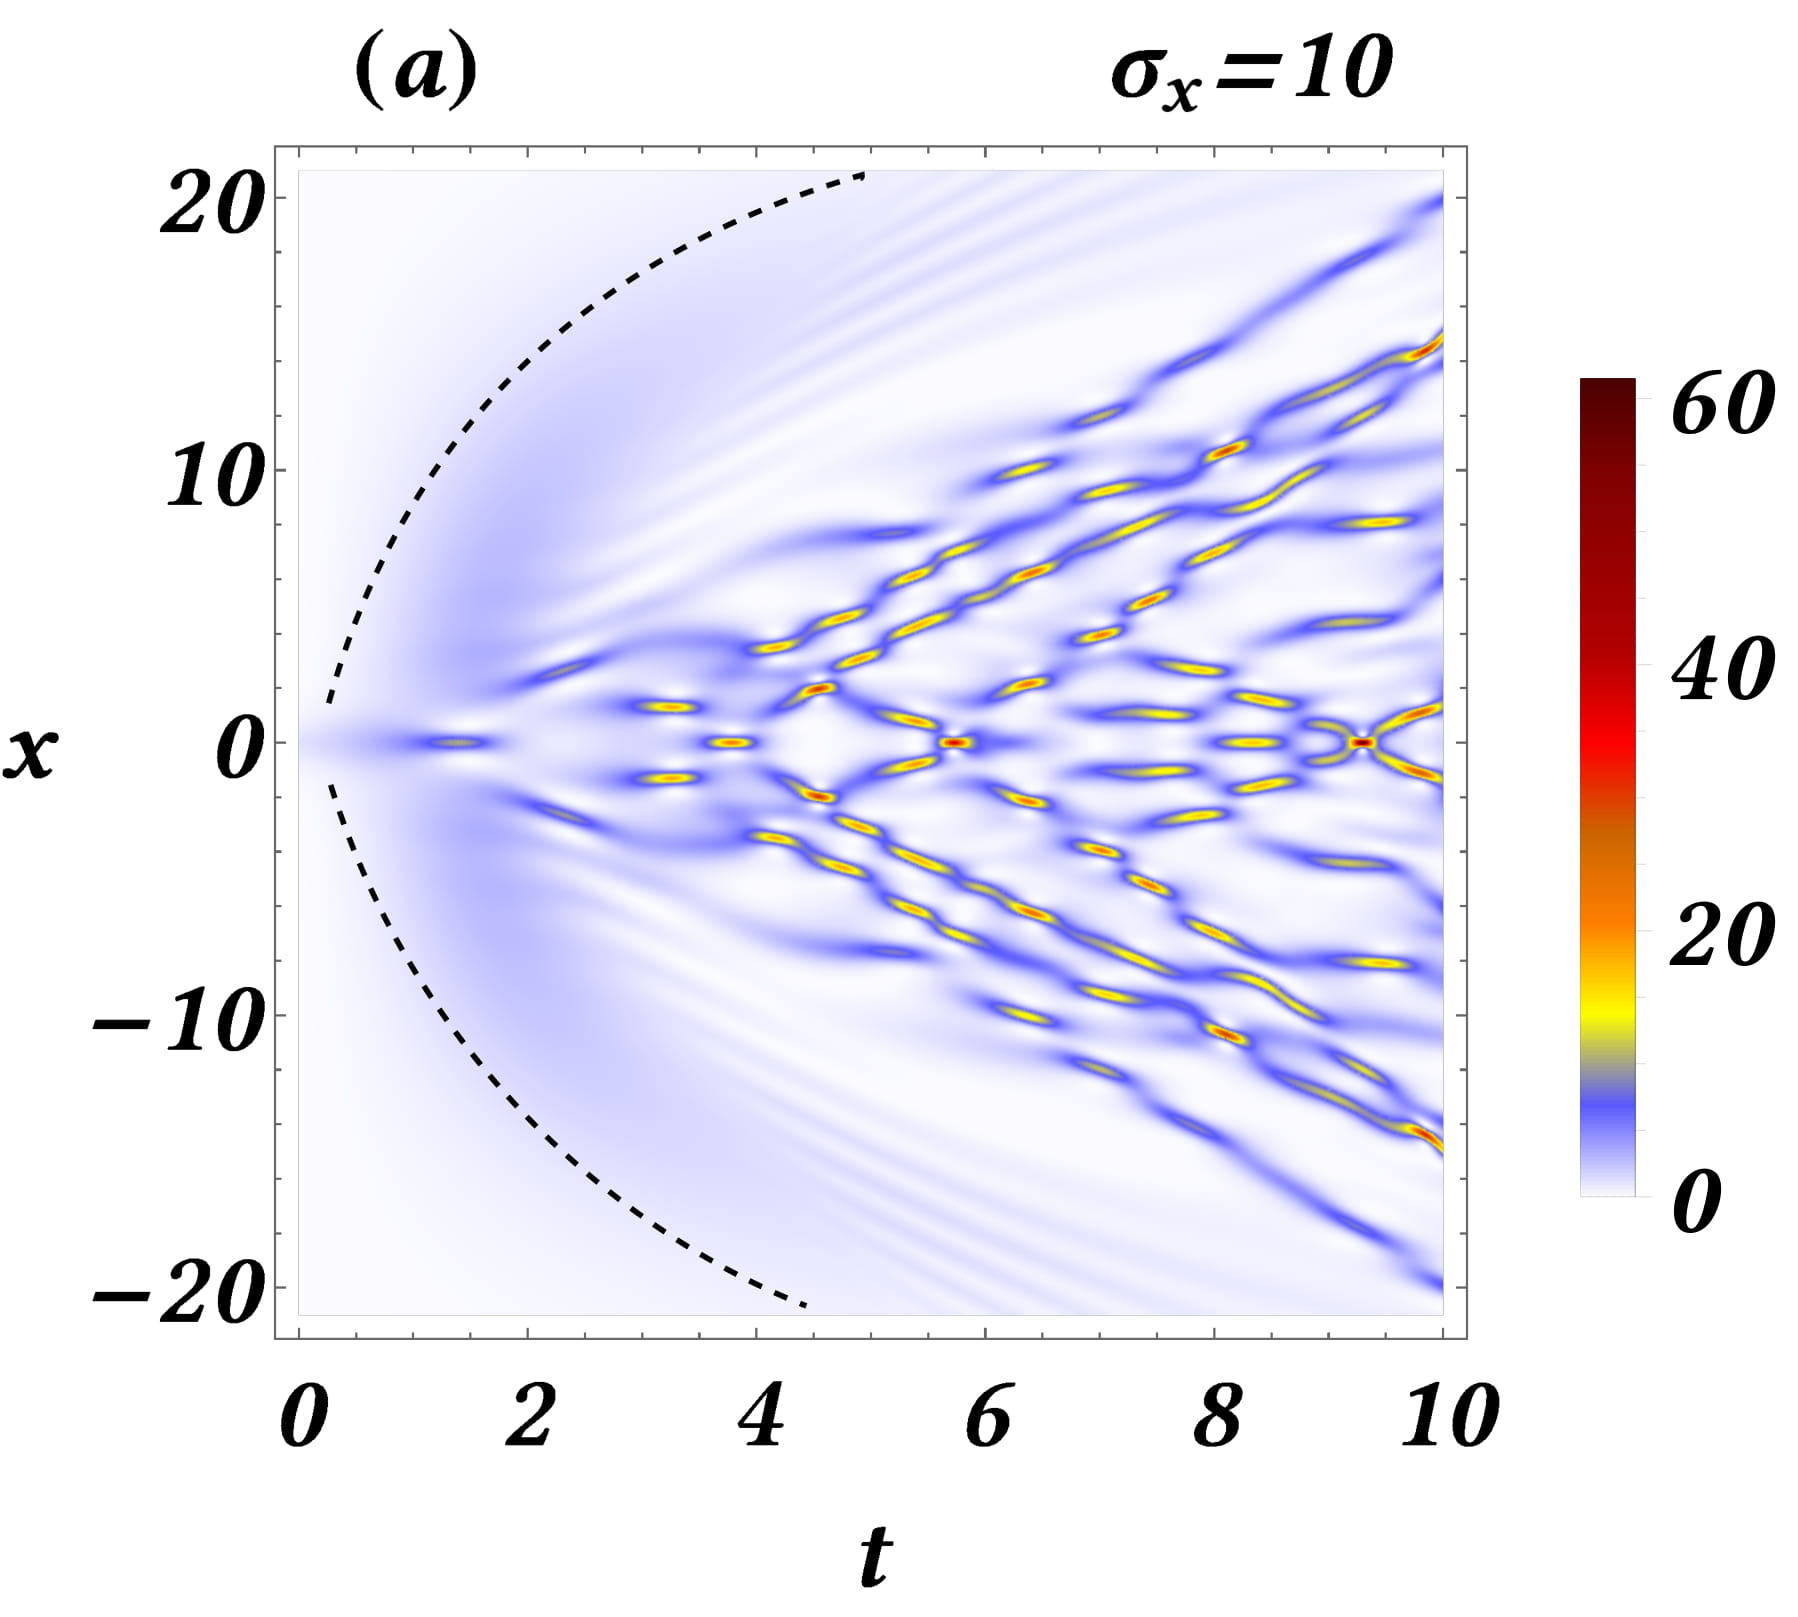
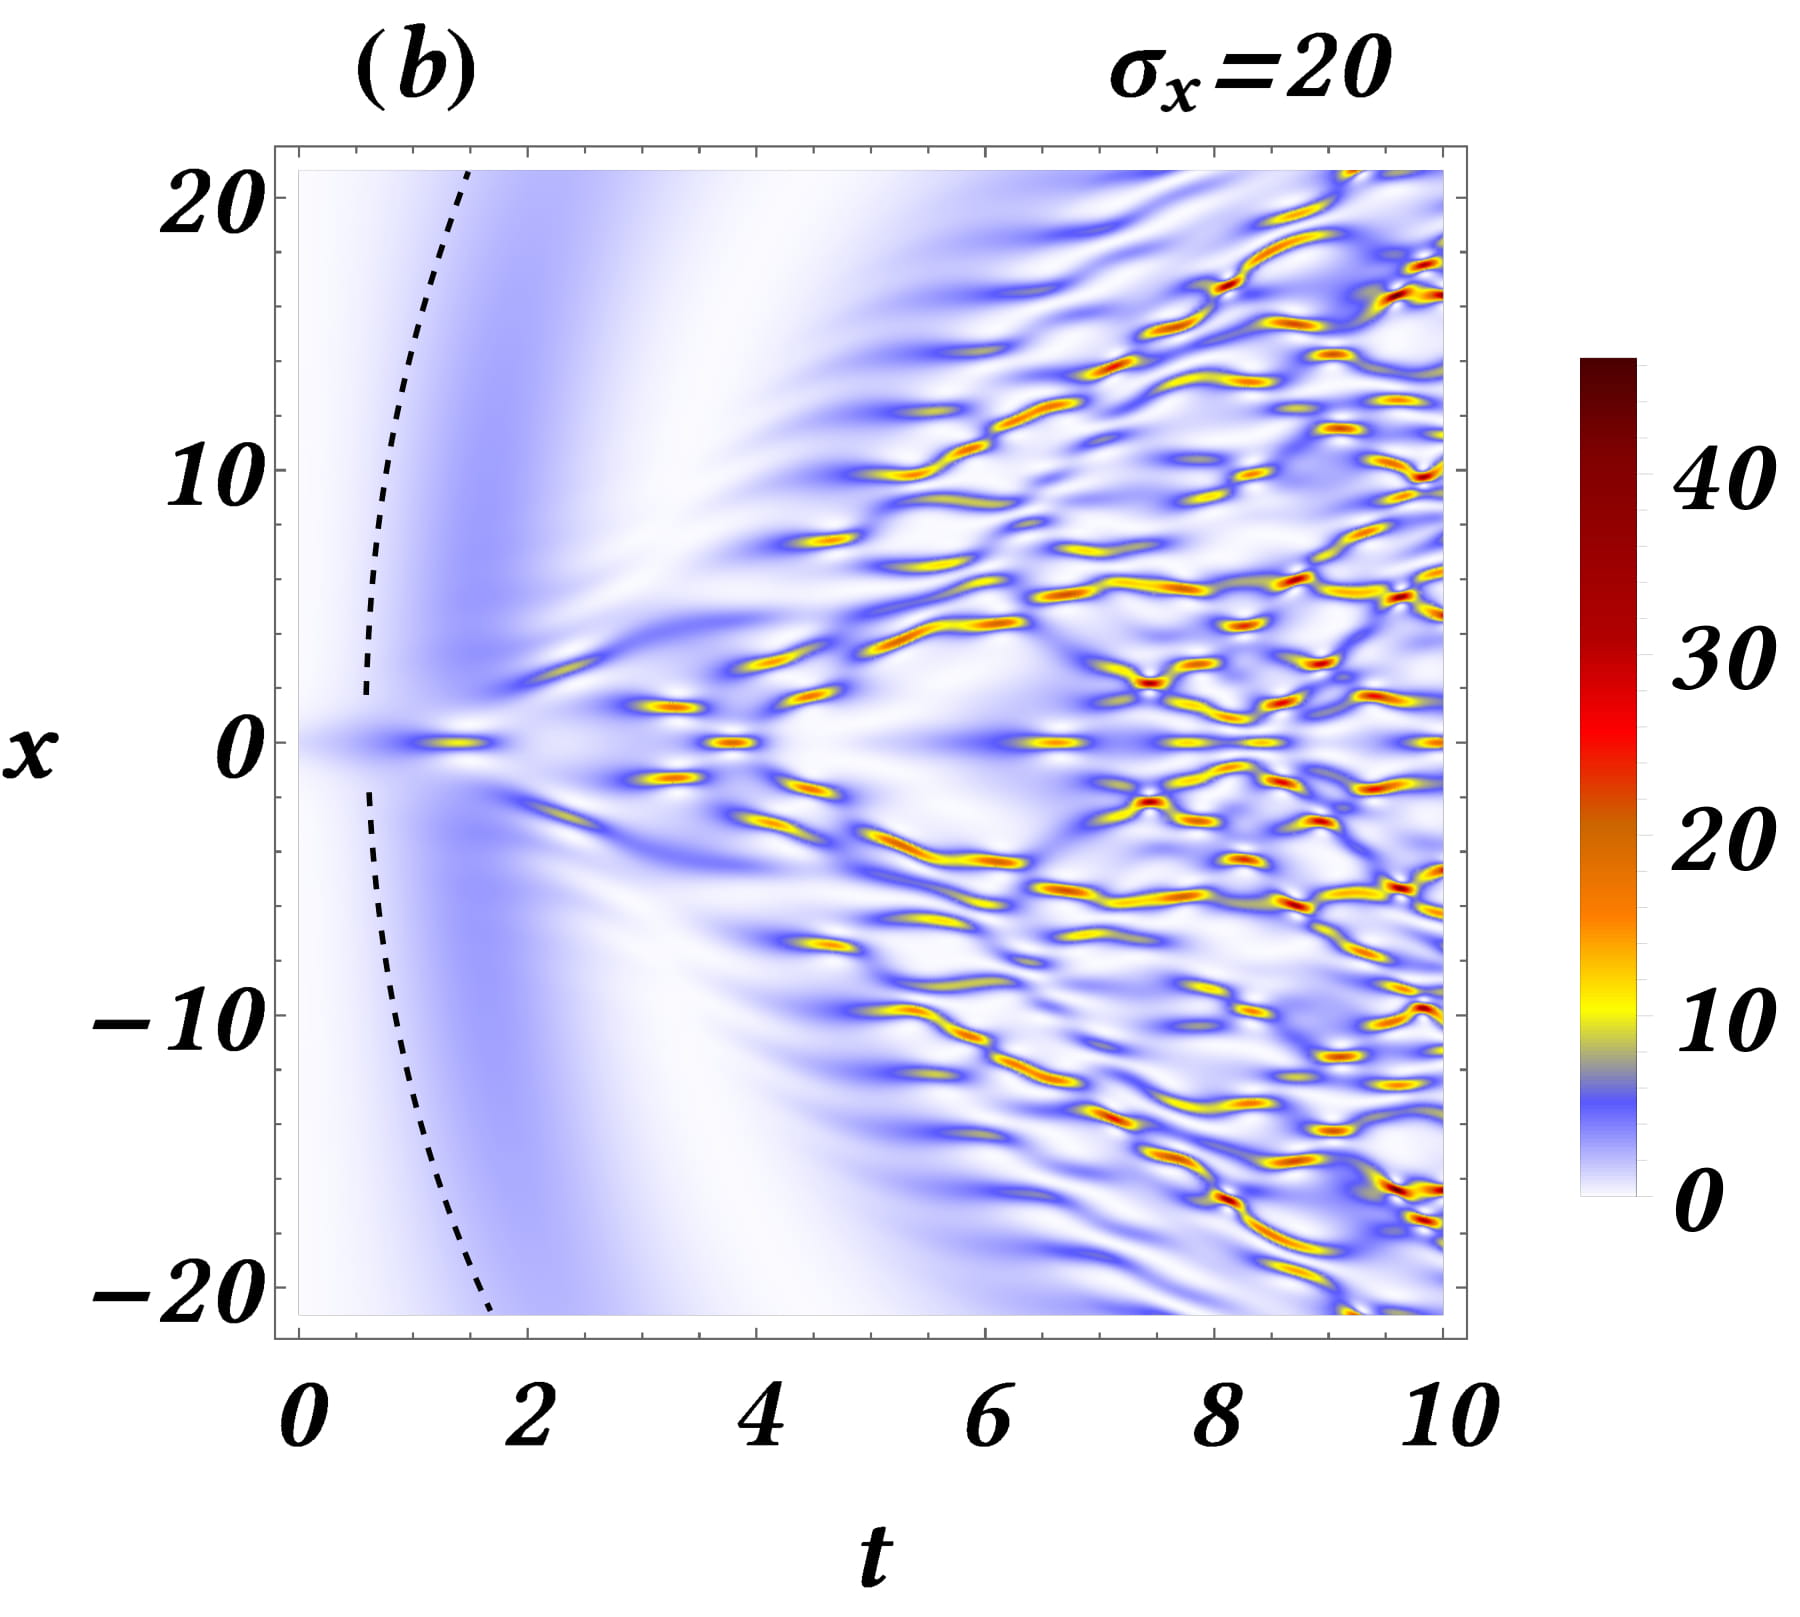
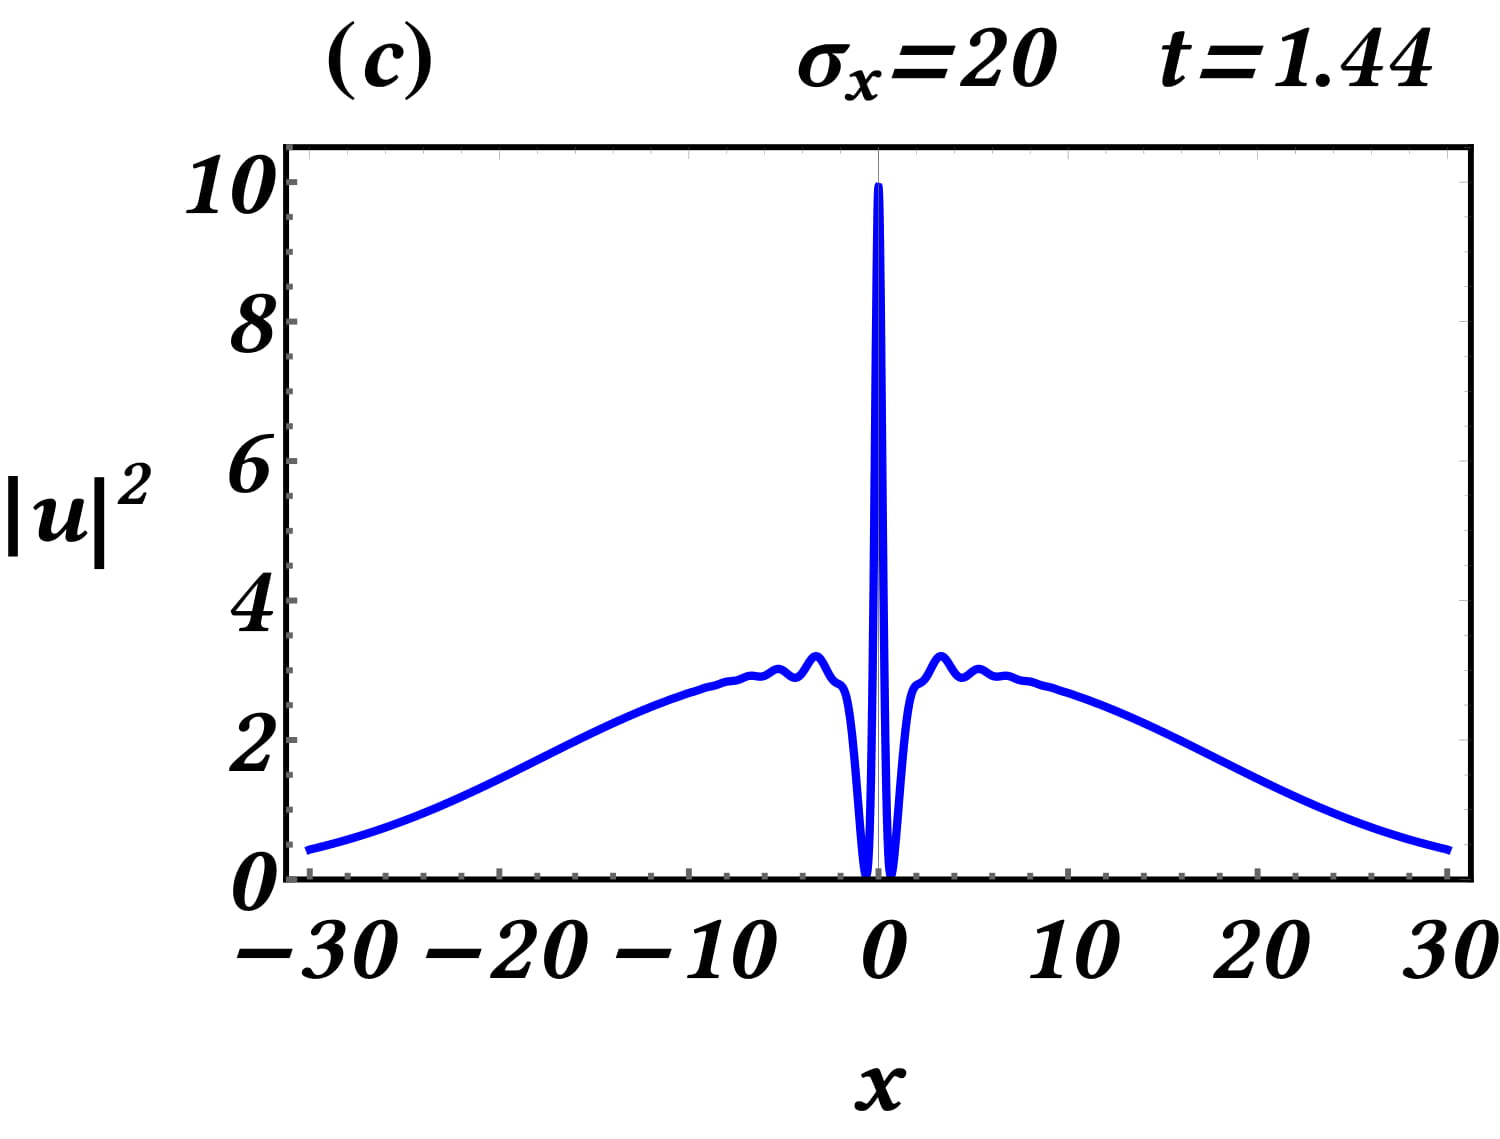
Another important feature of the system is that the driver’s spatial and temporal scales and affect the space-time localization of the numerical solution. This is verified in Fig. 10. There, the top row panels (), (), () show contour plots of the spatiotemporal evolution of the density, for fixed and (left to right), respectively. Each of the bottom row panels ()-()-() depicts snapshots of the density, at , corresponding to the contour plots of the top row. Evidently, controls the width of the decaying support of the emergent wave train. Particularly, we observe that, for , the width of the support is considerably reduced and the solution is strongly localized around the center, exhibiting oscillations in time.
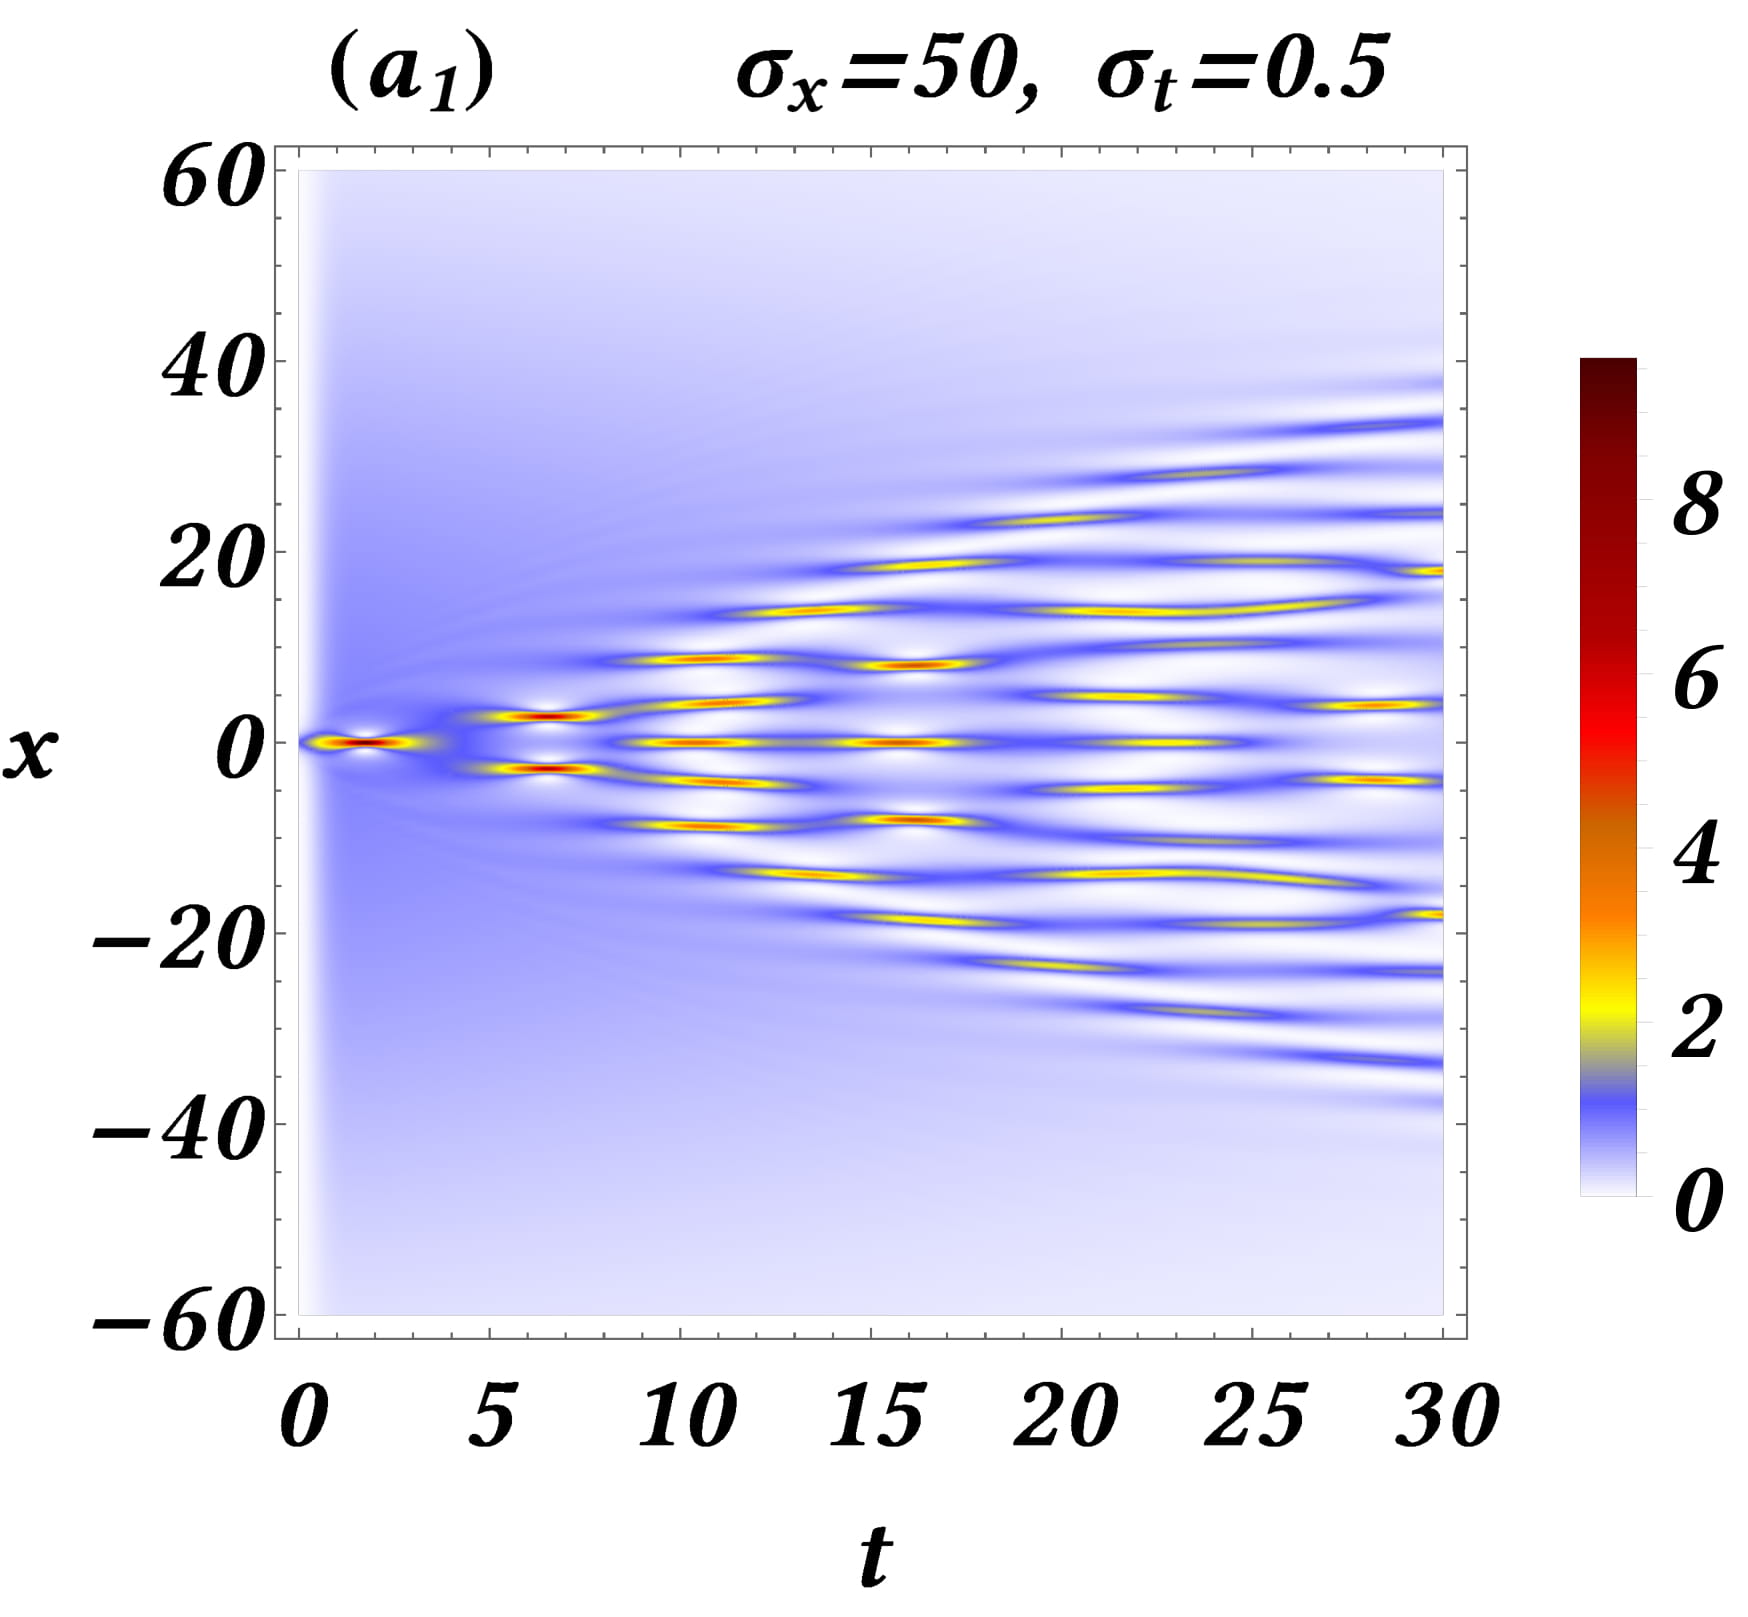
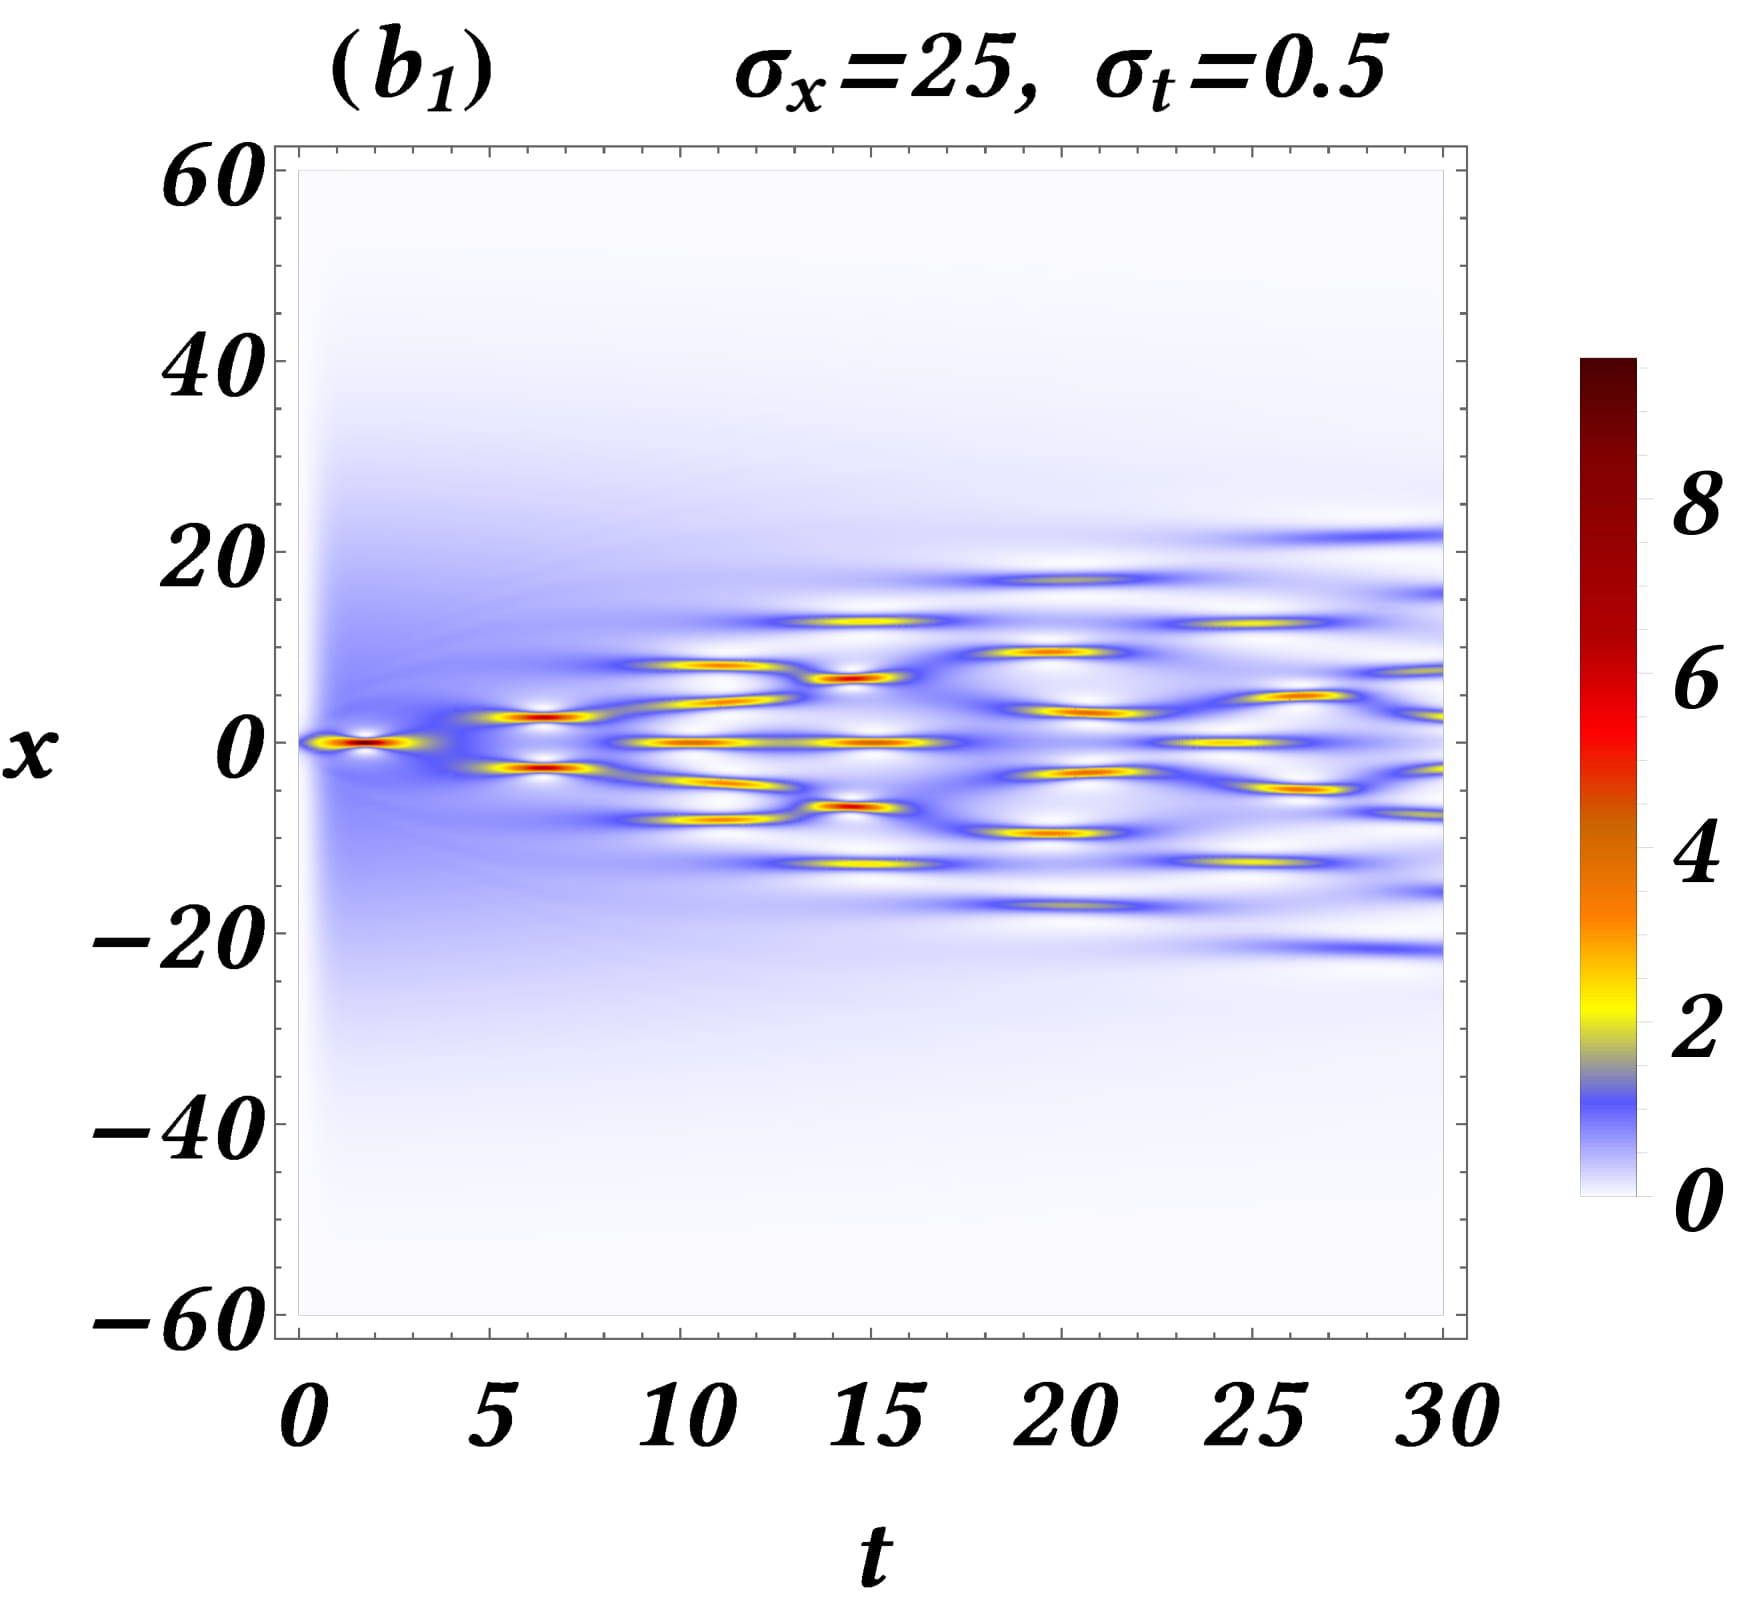
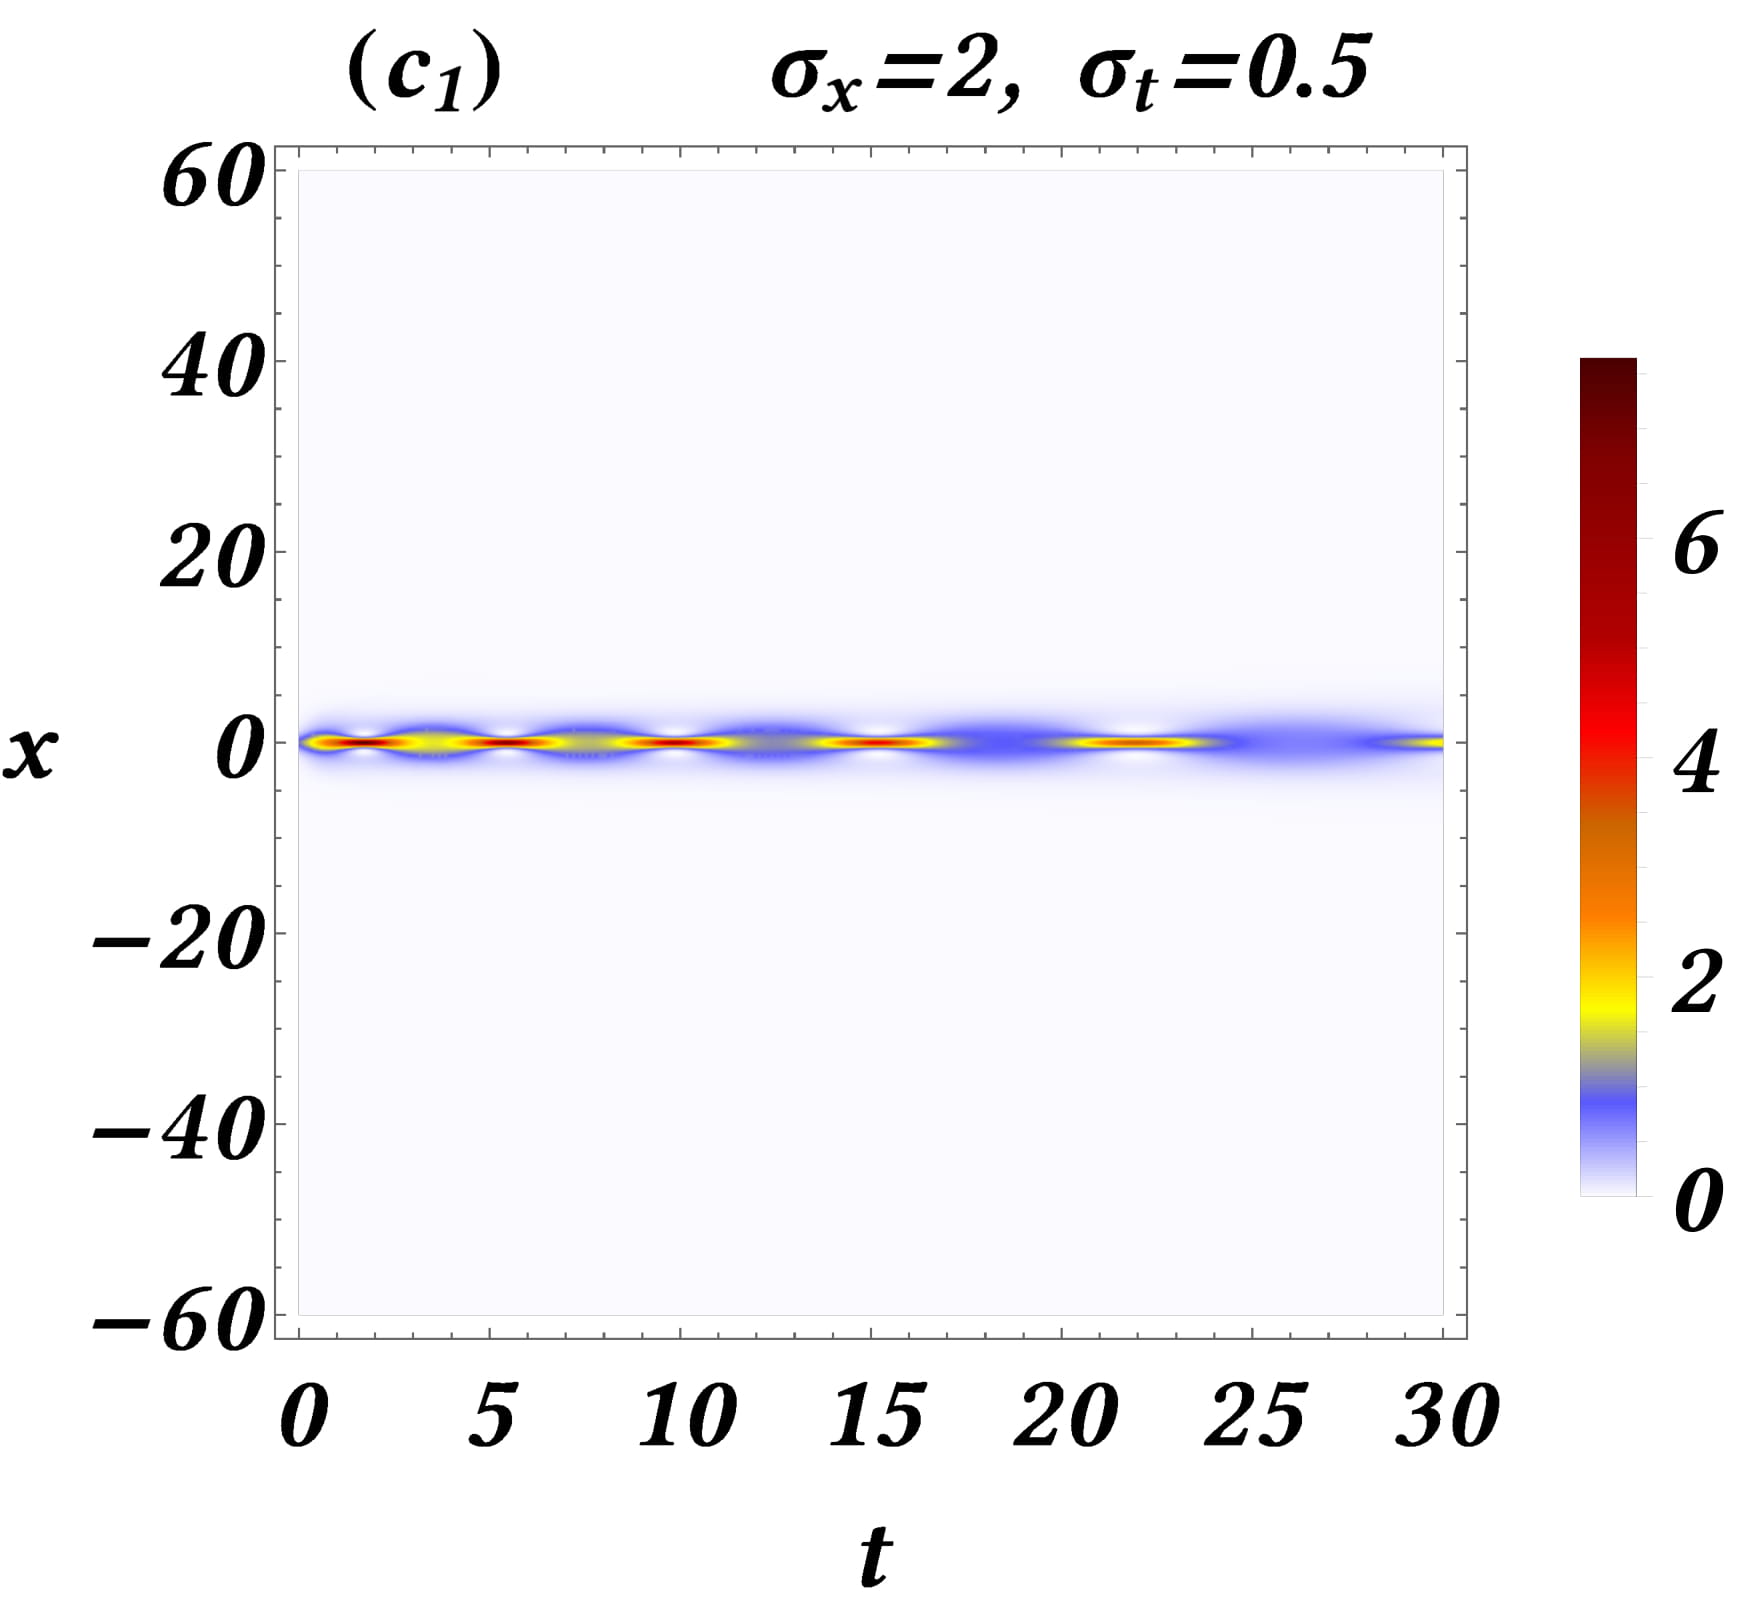
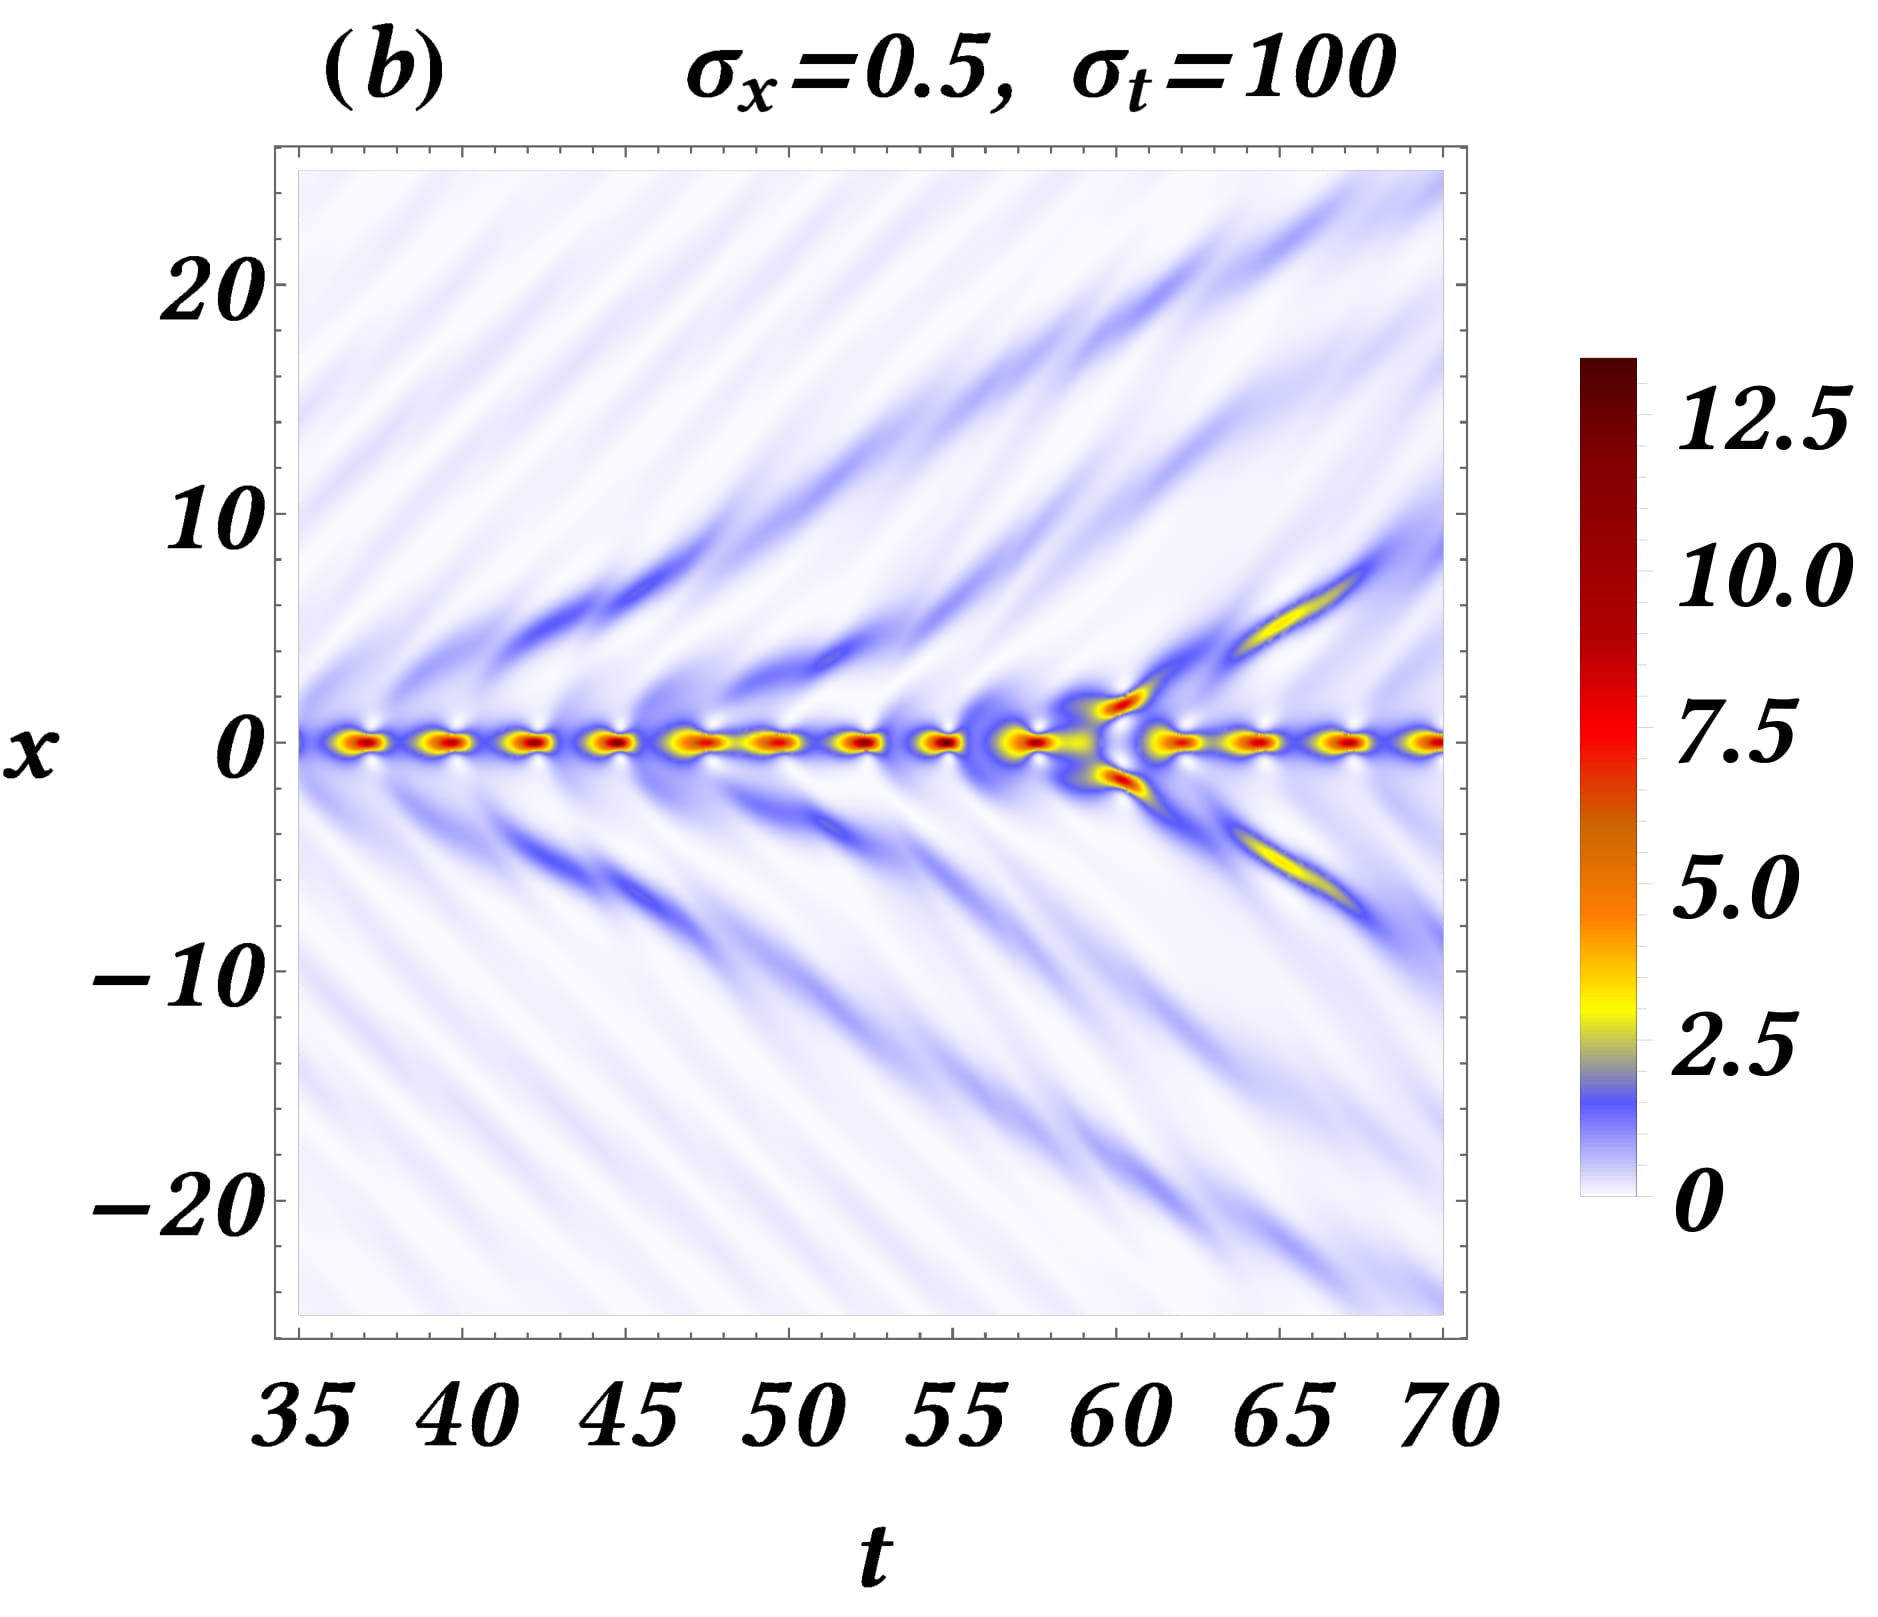
We also explore, in Fig. 11, the impact of increasing the value of to (for sufficiently small ). Panel (a) shows the spatiotemporal evolution of the density of the numerical solution, for . We can observe a dominating oscillation around the center and small-amplitude linear waves emanating from the main pattern. On one hand, the large acting time of the forcing enhances time-periodic oscillations; on the other hand, the small value of reduces considerably the effect of the formation of the decaying support and the localization width of the solution. Panel (b) depicts the continuation of the evolution shown in panel (a) for ; it is observed that the breathing oscillations feature a significant lifetime prior to their eventual decay.
Dynamics in the case of purely spatial forcing
Having identified the role of the temporal localization of the driver above, we proceed by examining the case of a driver showing solely spatial dependence, namely:
| (8) |
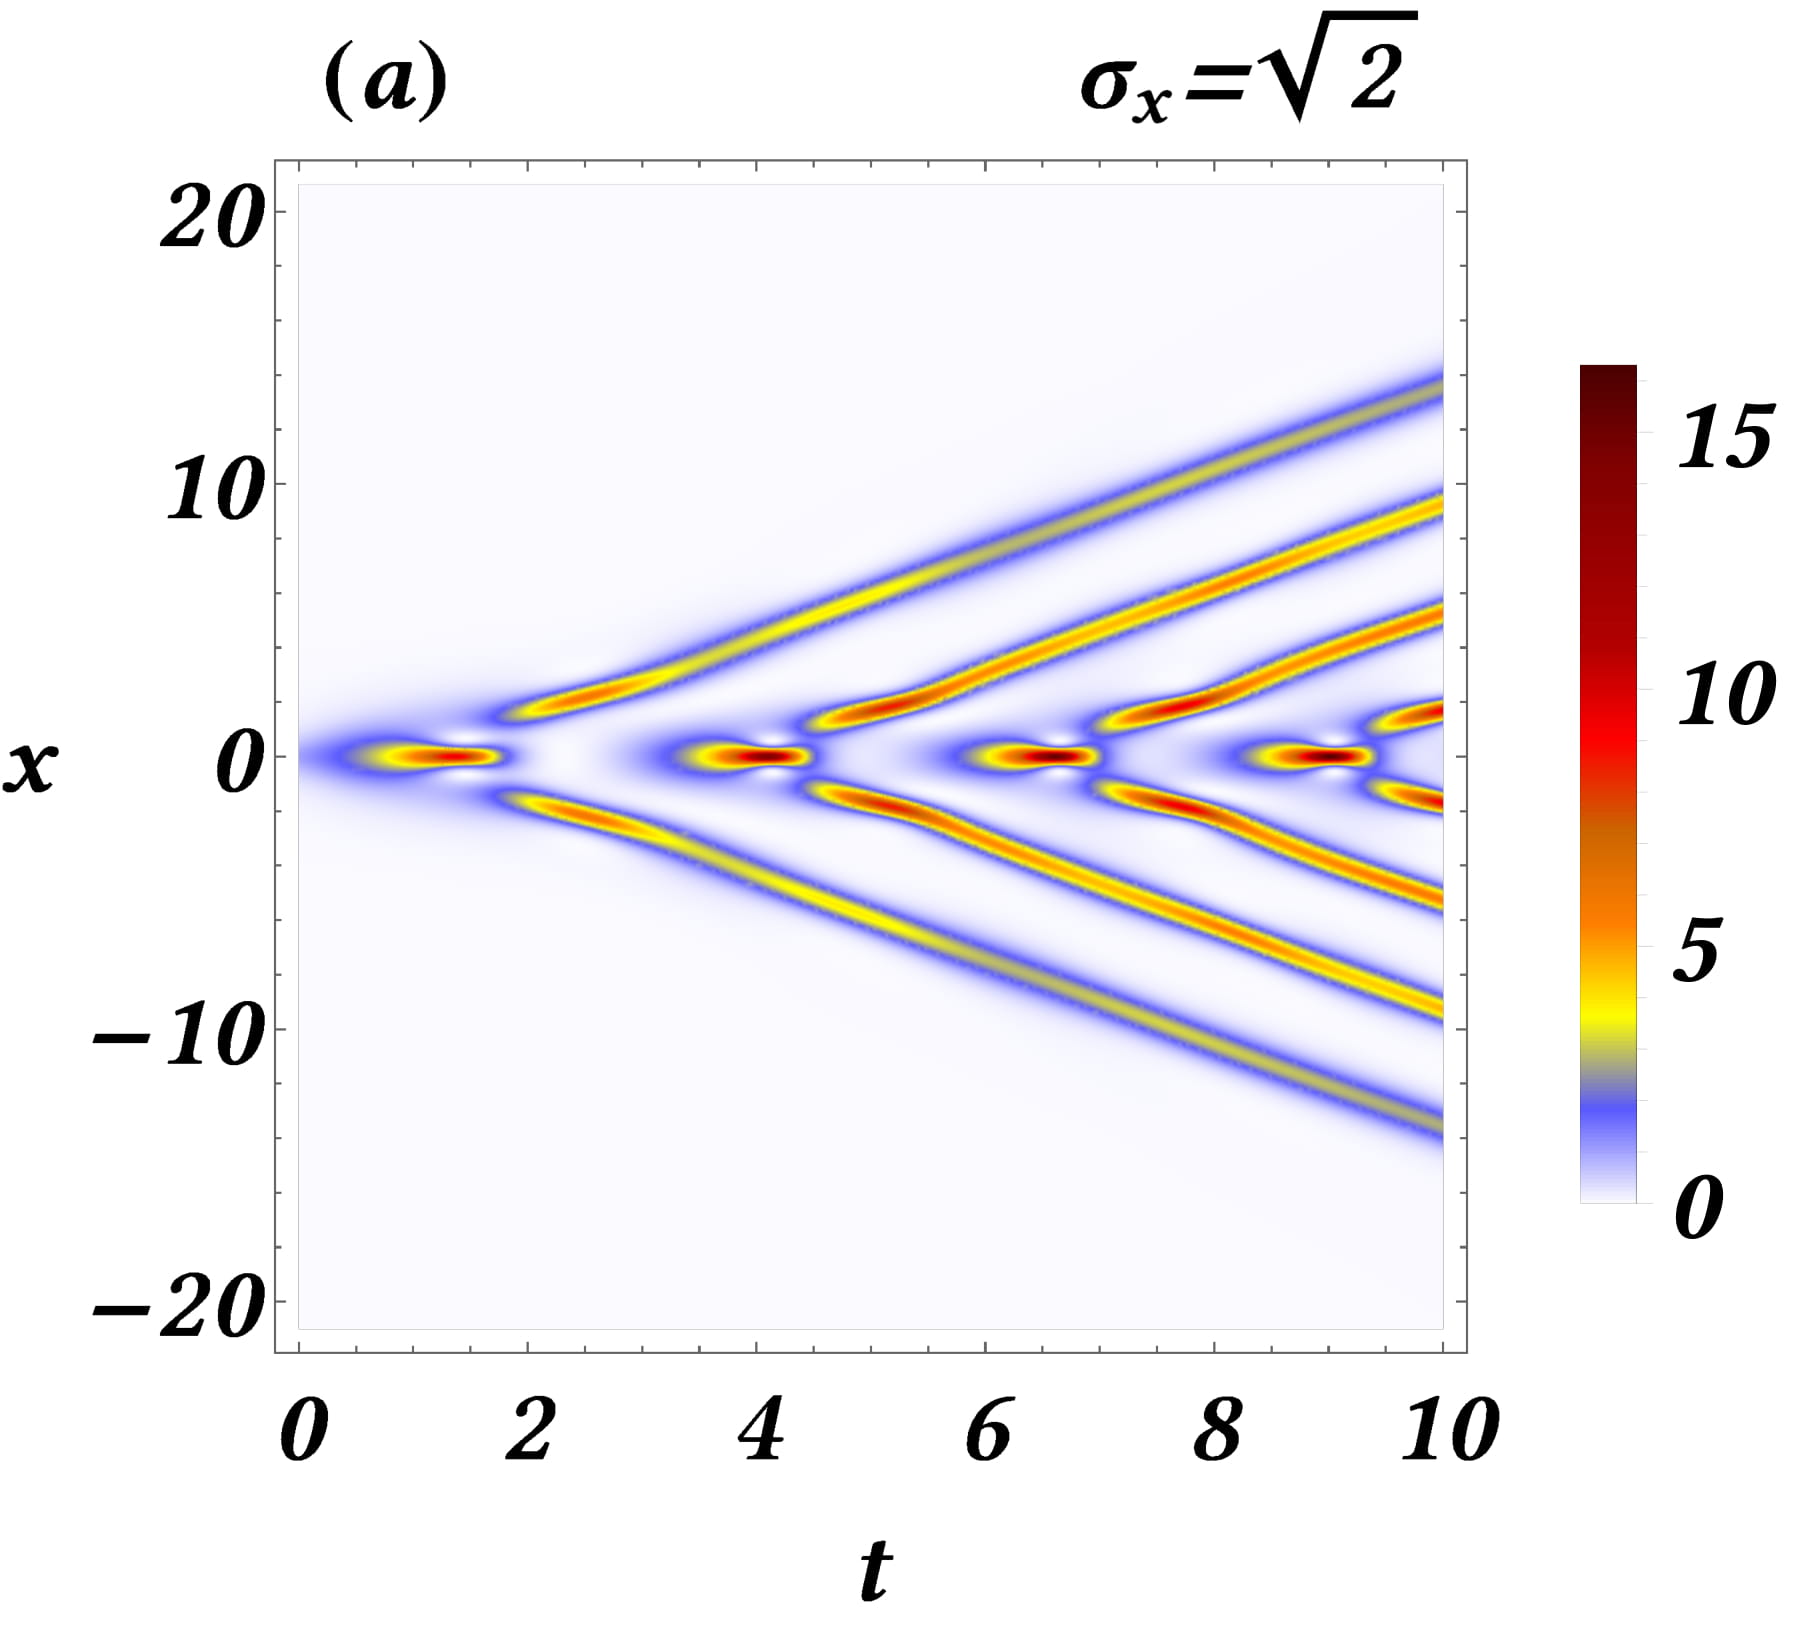
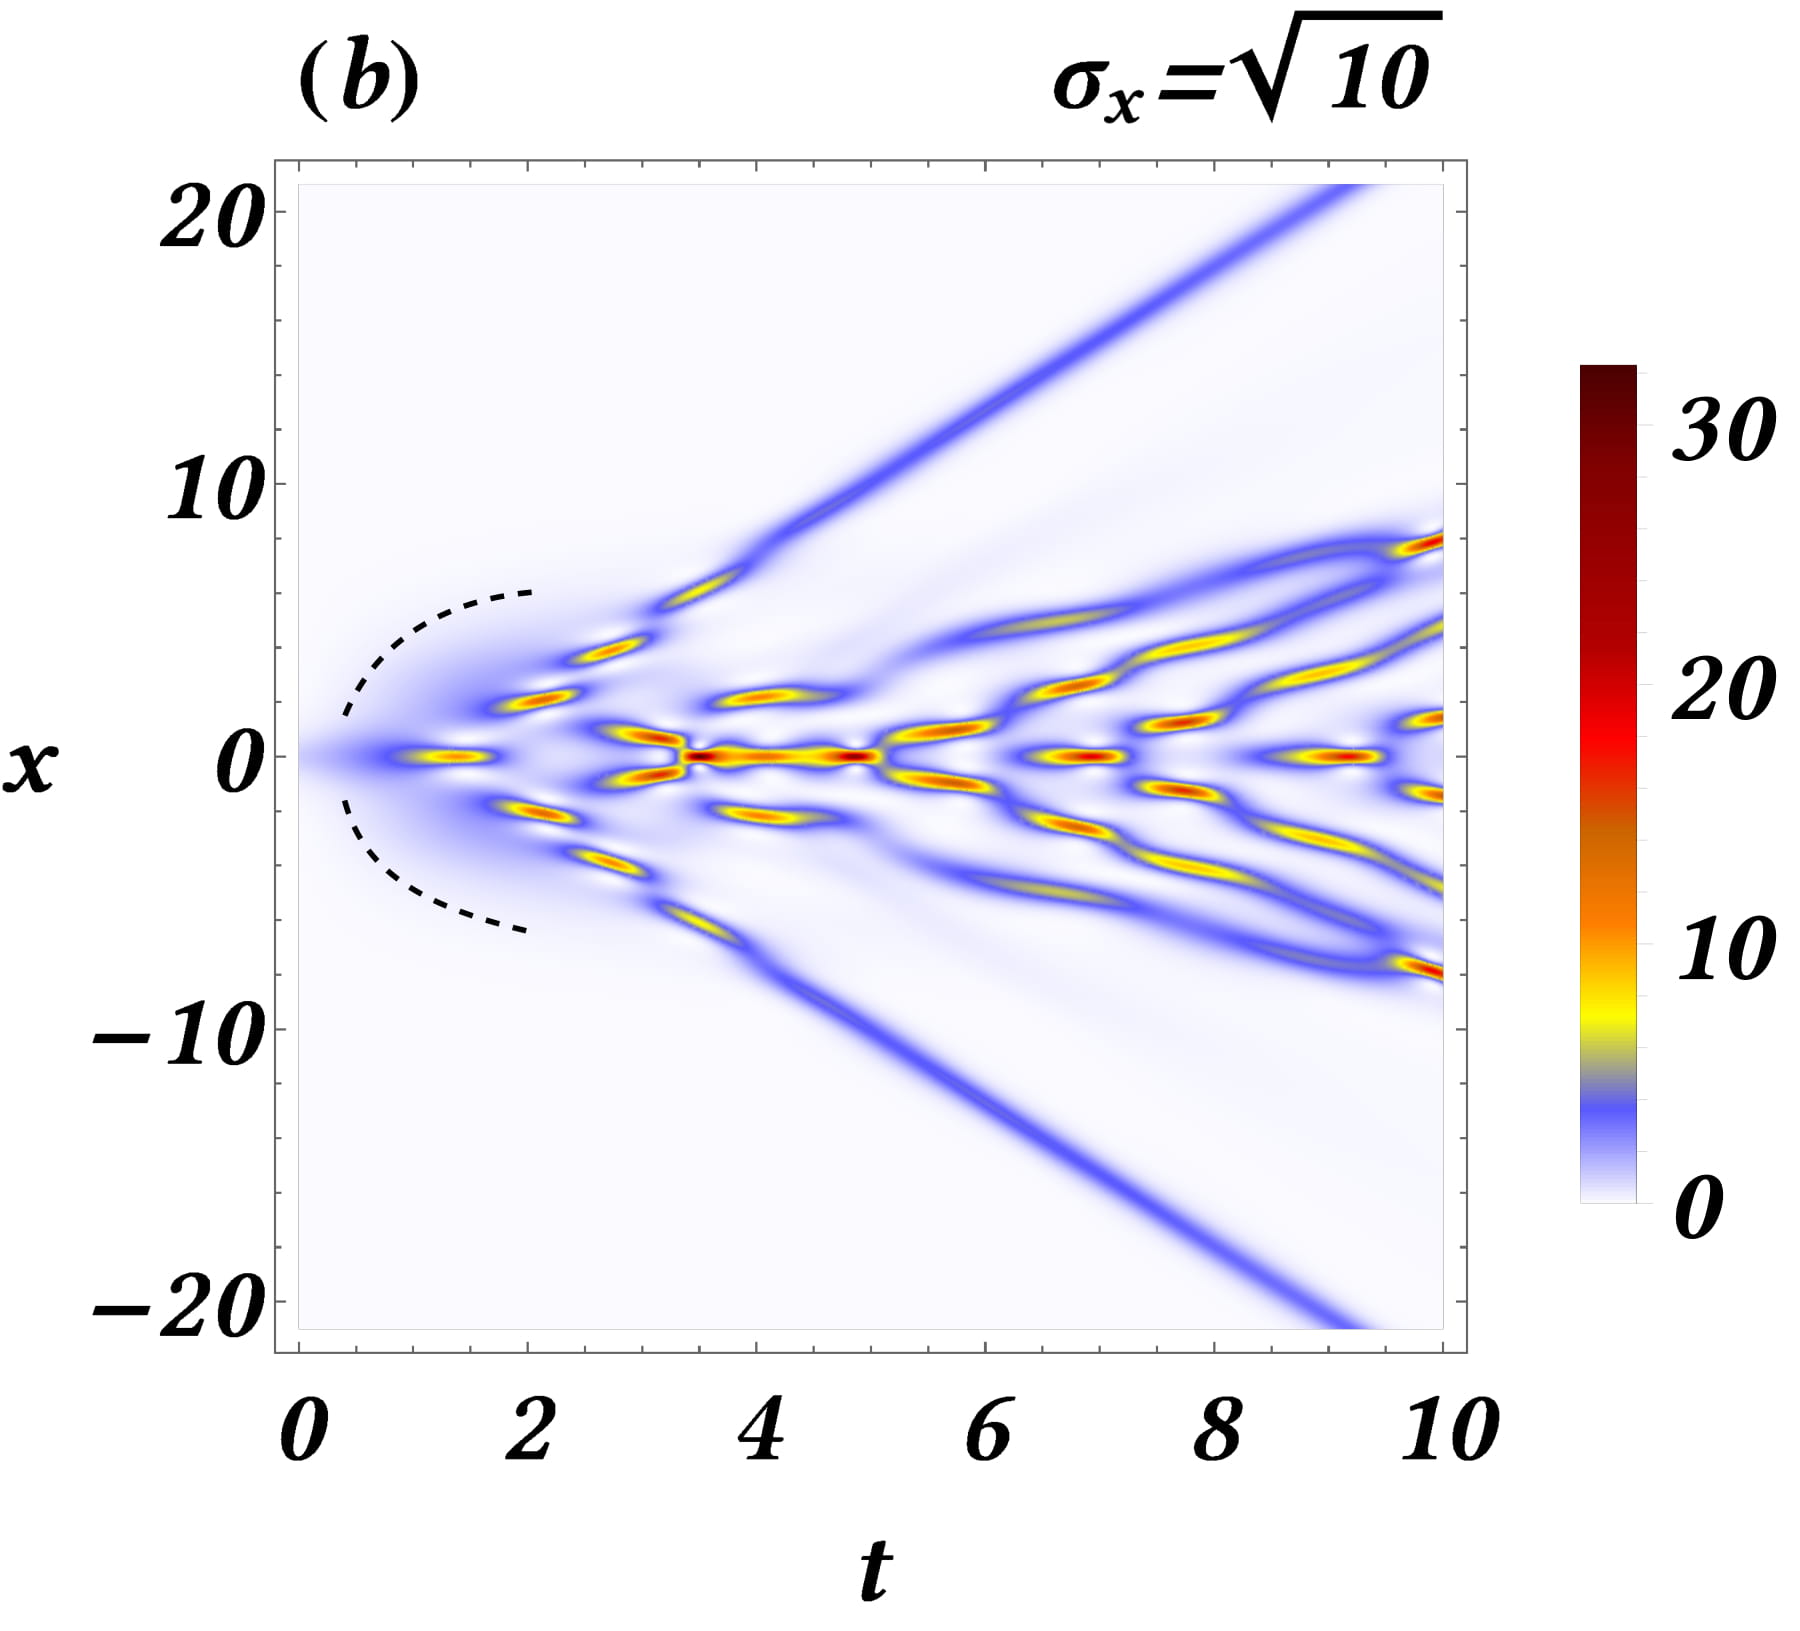
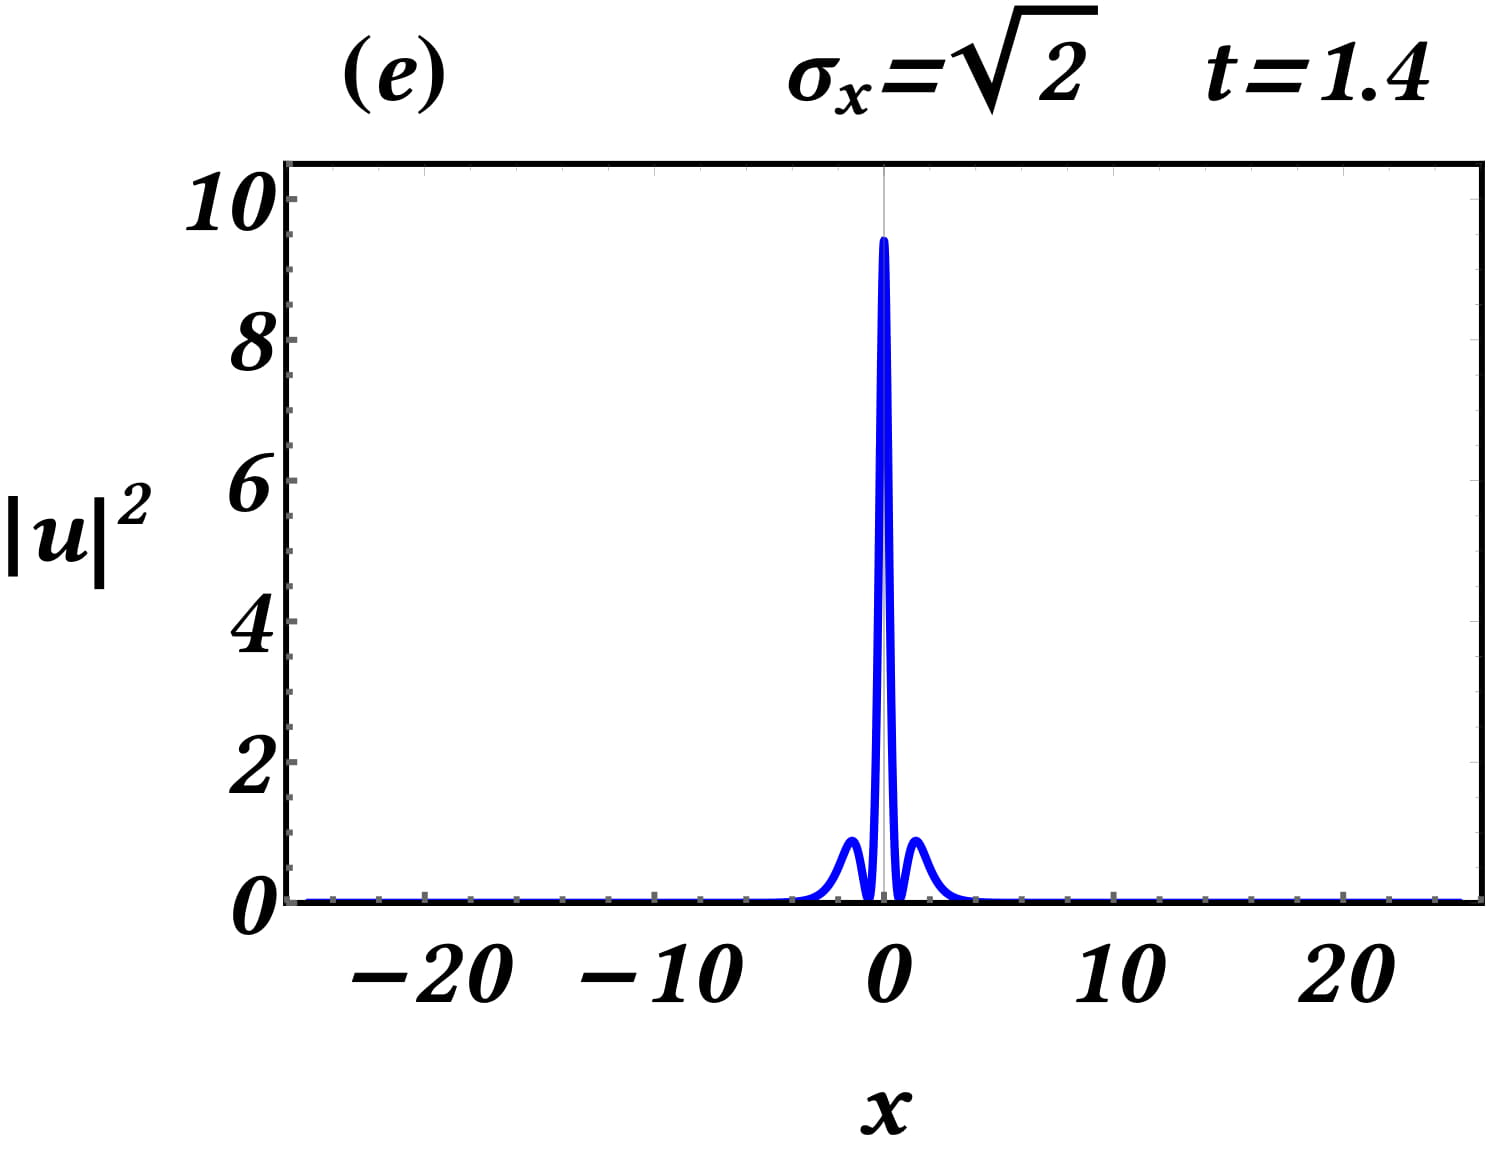
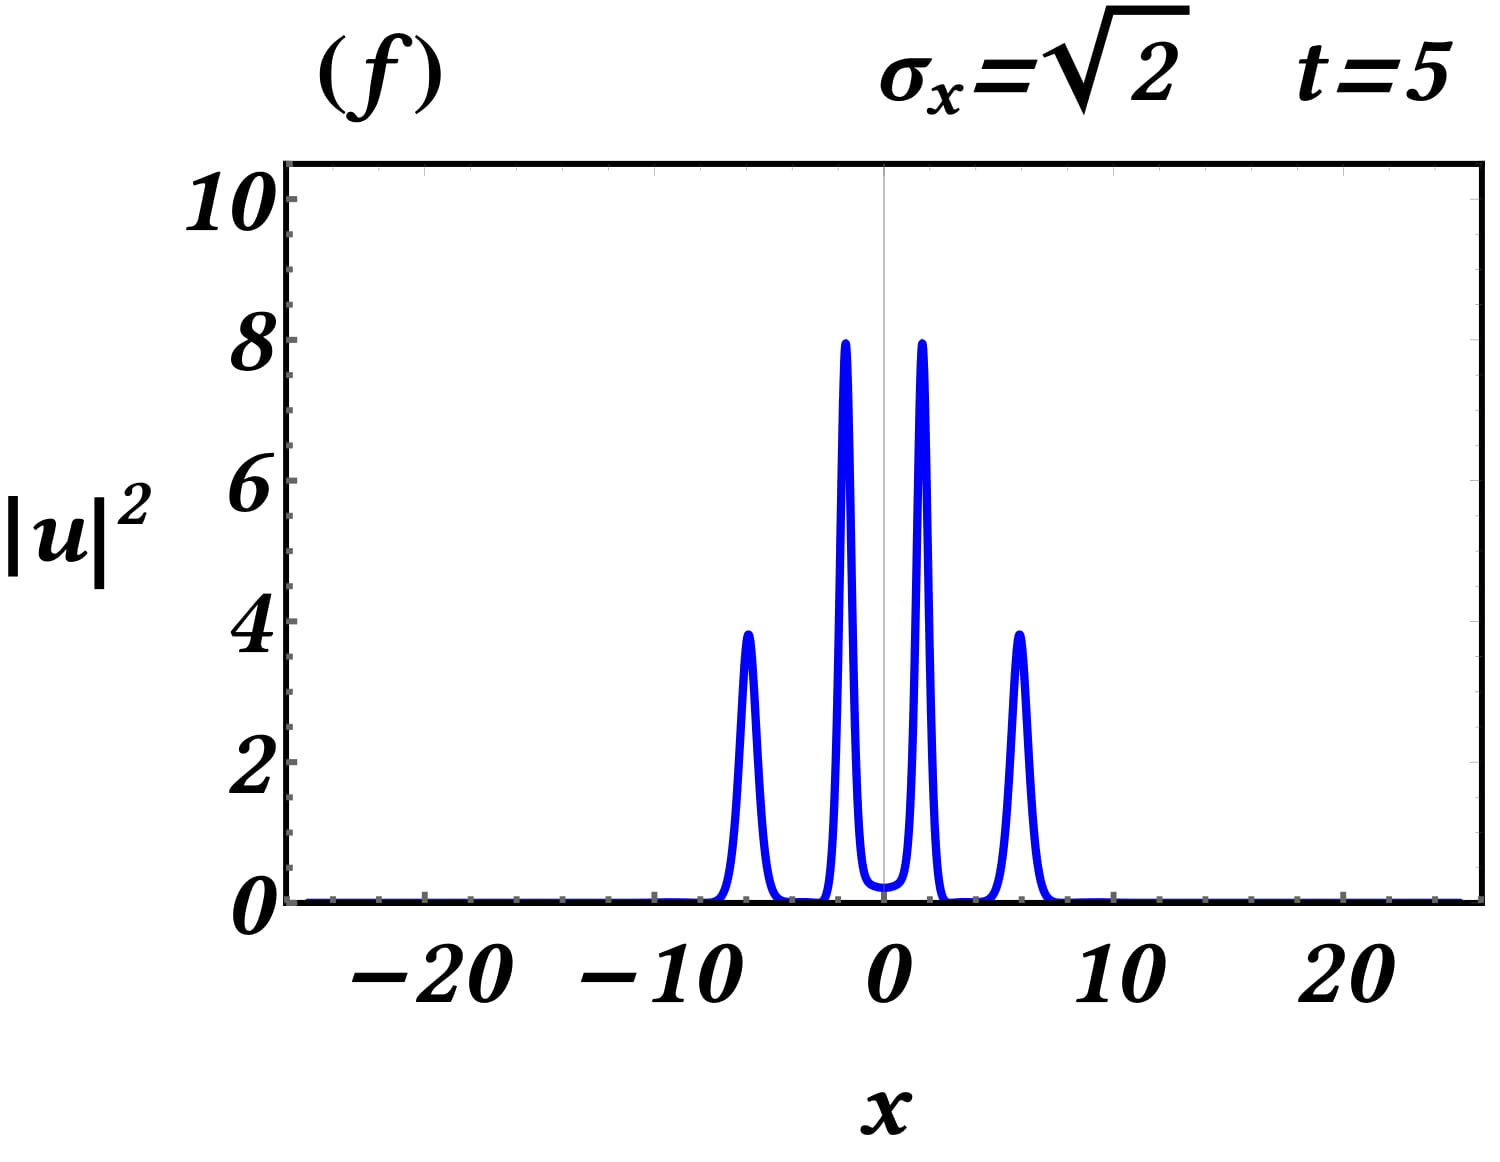
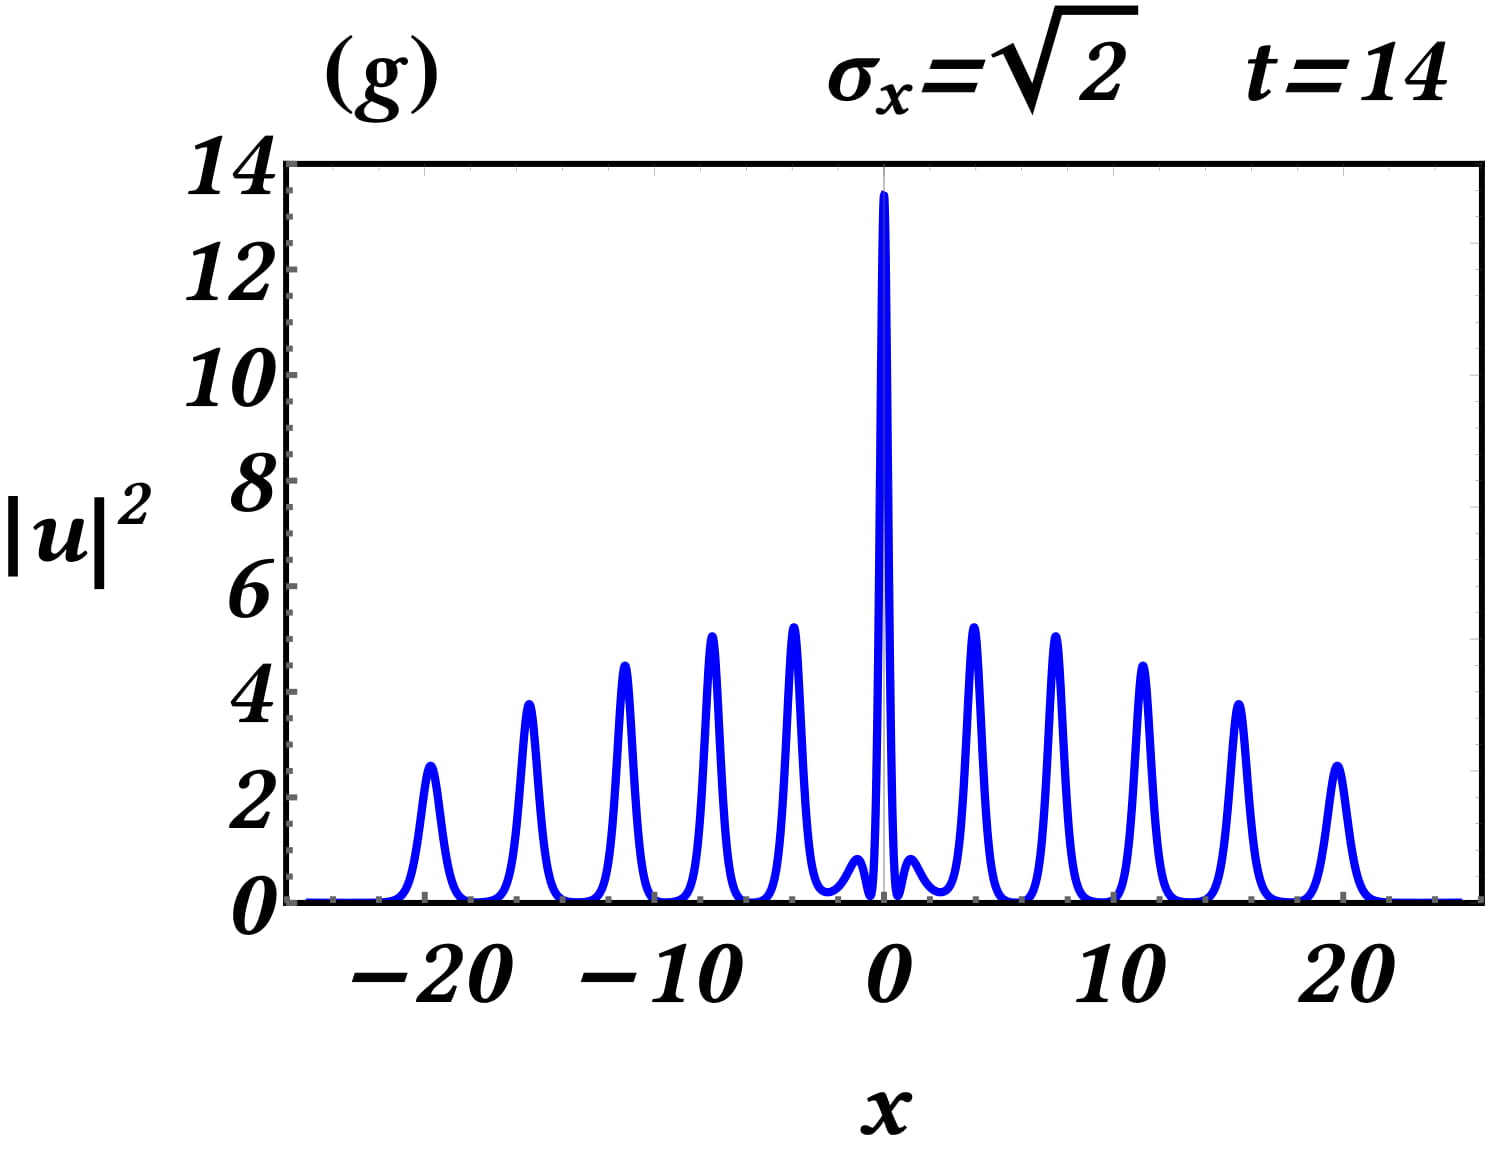
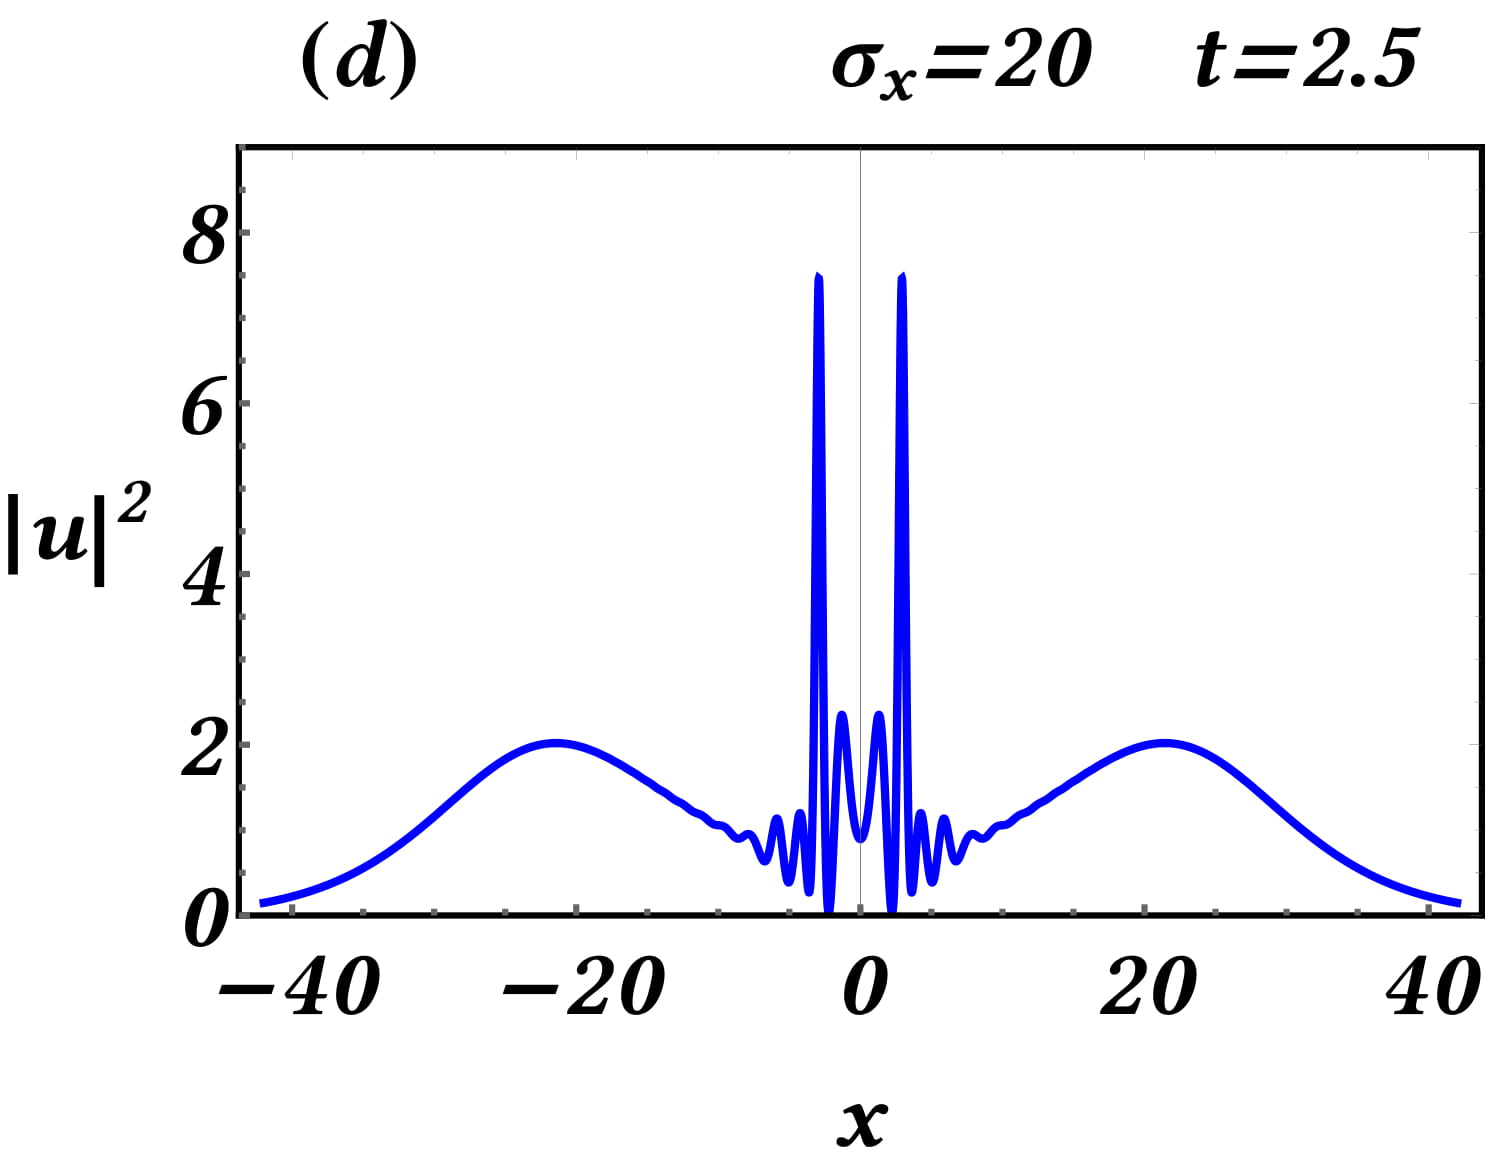
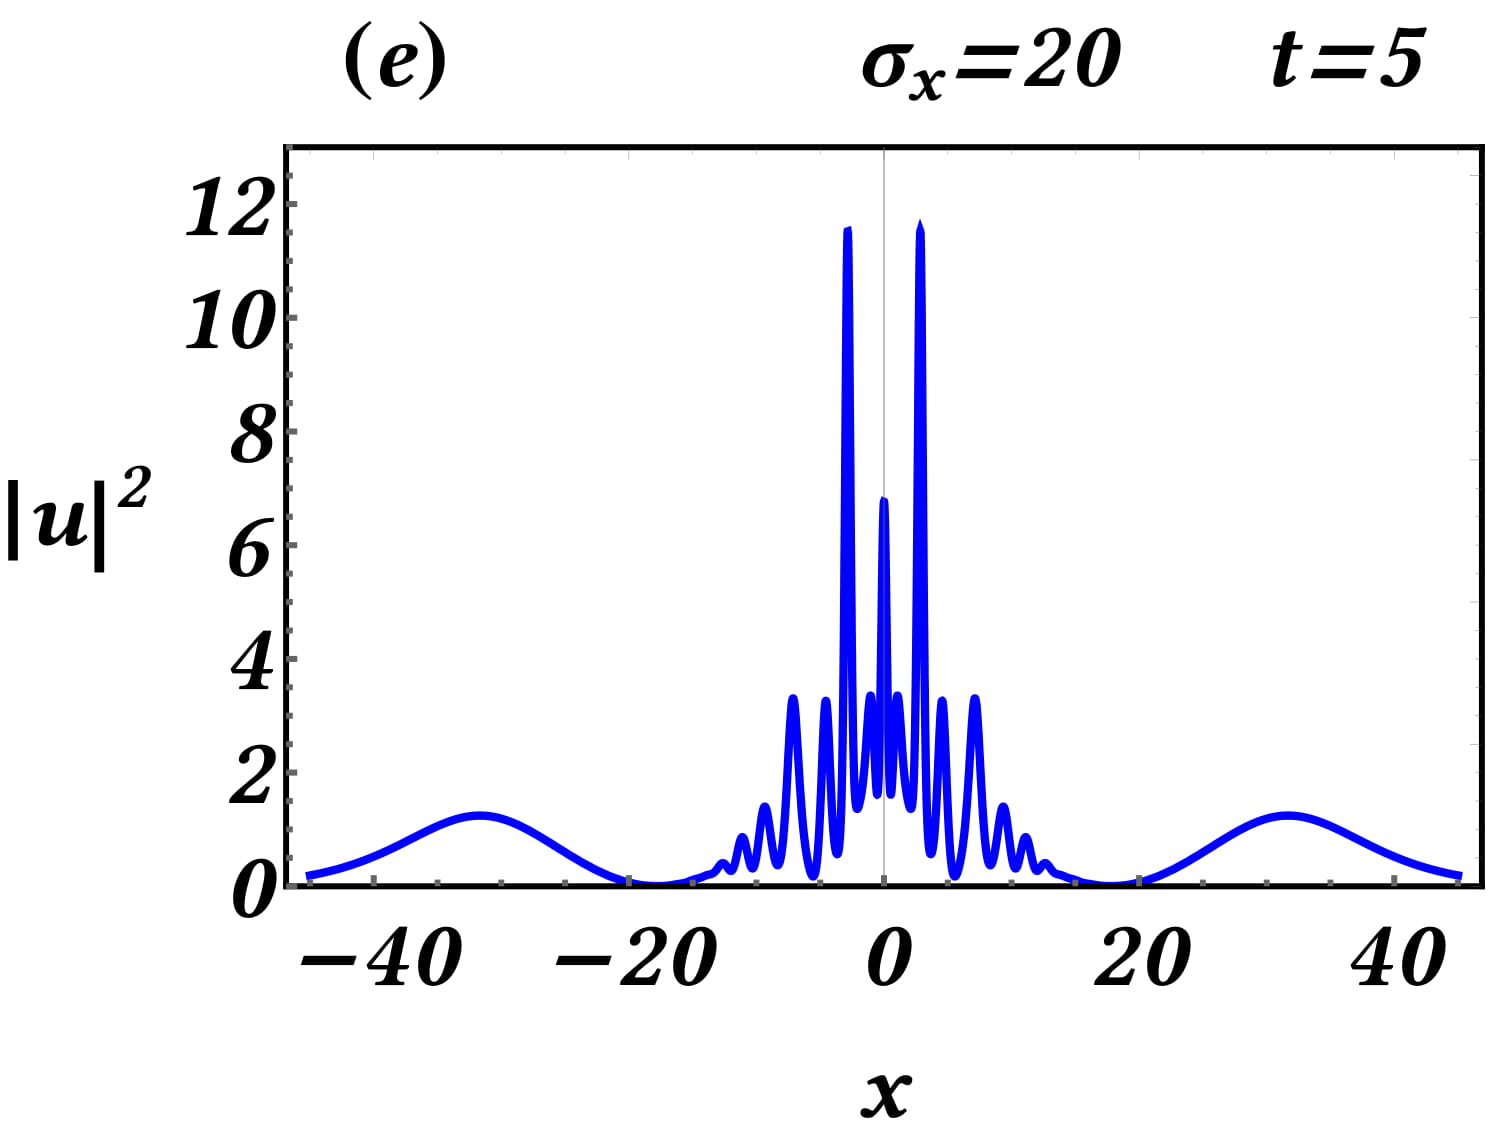
The results in this case portray similarities, but also significant differences, if compared to the case of spatiotemporal driving. We will examine the dynamics of the system for increasing values of , starting from the value of . The contour plot of the spatiotemporal evolution of the density in this case, is shown in panel (a), and the corresponding profile snapshots are depicted in panels (e), (f), (g) of Fig. 12. In the contour plot, we observe the emergence of a triangular spatiotemporal region, occupied by a traveling wavetrain which appears as a set of straight lines each one representing a solitonic-like structure (see snapshots). This setting is reminiscent of the defect scenario classified as flip-flop, emitting wavetrains alternately to the left and right – see Ref. sandstede .
The situation, however, drastically changes for larger values of . First of all, we observe how the straight lines of the interior of the triangular domain of panel (a) are gradually replaced by a region of large amplitude oscillations shown in panels (b) and (c). Eventually, the whole triangular region is consumed by these oscillations, as shown in panel (d). On the other hand, the slope of the exterior straight lines of the triangular region increases as it can be seen in panels (a) - (c), until they disappear in panel (d). Moreover, it can be observed that the support of these solutions exhibits interesting dynamics itself (the region where it becomes significant is marked by dotted curves): First, it is progressively expanded within the spatial domain, for increasing as is illustrated in panels (b) and (c), depicting the dynamics for and , respectively. This phenomenon can be connected to the corresponding one in the case of spatiotemporal driving of Fig. 10 where also the support is expanding for increasing values of . The second effect related to the support, was already observed in panels (b) and (c) of Fig. 12, but it is enhanced for even larger values of ; the support is decomposed into two symmetric outward moving parts (replacing the straight-line paths of the travelling solitons observed in panels (b) and (c)), and a middle part. This effect can be more easily detected in the contour plot (d) of Figure 12 (for ), and the contour plots (a) and (b) of Figure 13 (for and , respectively). This dynamics of the support is highlighted in the snapshots shown in the panels (c)-(e) of Figure 13. Furthermore, the middle part, sustaining large-amplitude spatiotemporal oscillations, expands in its own right forming chaotic patterns reminiscent of the ones studied in NB86 ; nobe1 , as can be seen in panels (d) and (e) of Figure 13. Thus, it is evident that the magnitude of drastically affects the nature of the resulting patterns in the case of purely spatial driving.
Comment on the dynamics of the integrable limit , .
We complete this Section by briefly commenting on the dynamics of the integrable limit, and , with the initial condition
| (9) |
In such a situation, we have found (results not shown here) that the dynamics is reminiscent of that observed in Ref. BS . In particular, for (in this case, (9) coincides with (4)), the solution “locks” to a soliton of amplitude . As is increased, we progressively see a transition from oscillatory spatiotemporal patterns to a “Christmas tree” dynamical behavior, resembling the one at the early stages of Fig. 8.
The above results are, in turn, reminiscent of the initial data width variation reported in Ref. BS going from the solitonic limit of small width to the semiclassical limit of large width (see the connection in BS with the rigorous work of BM1 ). In addition, we should underline a significant difference between these emerging patterns and the case examples of our previous numerical experiments involving the external drive. In the case where the drive is present, the width of the emerging support in which the extreme event lies, is considerably wider, connected to the width of the driving. On the other hand, in the integrable case, due to the absence of such forcing, there is no emergent support and the background, on top of which the extreme events are hosted, is only dictated by the initial condition.
III Discussion and Conclusions
In this work, direct numerical simulations revealed the excitation of extreme wave events for the linearly damped NLS equation supplemented with vanishing boundary conditions, in the presence of a spatiotemporally localized forcing. The driver assumed the form of a Gaussian function, and the dynamics emerged as a result of quadratically and exponentially decaying initial conditions. We found that when the spatial localization scale of the driving is considerably larger than the scale of its temporal localization, the excited Peregrine rogue waveforms appear on top of a decaying support, and the transient dynamics, prior to decay, resembles the one of the semi-classical NLS BM1 ; BM2 ; nevertheless, the extreme events in our case do not appear as a lattice of Peregrine waveforms arising at points corresponding to the poles of the tritronquée solution of the Painlevé-I equation. The role of the driving/forcing strengths and of the localization widths of the initial conditions in suppressing/enhancing and modifying the dynamical features observed were also elucidated. Another remarkable feature revealed concerned the critical role of the phase-parameter of the forcing. Varying this parameter, one may produce a wealth of spatiotemporal patterns, including the fundamental ones reminiscent of the dynamics in the integrable limit. These involve the emergence of Peregrine rogue waves (as discussed above), Kuznetzov-Ma like breathers, even the division of the spatial domain in spatially periodic structures reminiscent of those analyzed at the nonlinear stage of modulation instability. Finally, the integrable limit for the same type of initial data was explored for completeness; in this case, the width of the initial data plays a crucial role in determining the eventual fate of the algebraically localized initial condition.
Via comparison of the dynamics produced by varying the space and time localization width of the driver, we are led to expect PRW-type structures to form in the presence of effectively strong spatially extended external forces, acting for short times, while transient, large-amplitude, almost time-periodic breather-like structures emerge, when the acting time of the external driving is comparable to its spatial localization width. Particularly, our findings seem to further support one of our concluding remarks in All1 , that suitable additional effects may contribute for the robustness of such waveforms, making them more easily observable. Also, connecting these findings to the linearly damped and linearly forced NLS counterpart, Kharif1 ; Kharif2 ; EPeli , we note that in the work of EPeli , an effectively strong linear driving which is acting for short times facilitates the occurrence of extreme wave conditions.
The results herein constitute a starting point for further studies, such as analytically estimating the decay rates of the numerical solutions, examining the effect of different external drivers and initial conditions possessing different types of decaying rates. In particular, exploring the “separatrix” between the decay rates that favor the scenario of BM1 , vs. those that lead to the dynamics described in BM would be especially important to clarify. Of exceptional interest could be the implementation of the deterministic and statistical diagnostics introduced in Tikan , in the context of damped and forced NLS models. As an additional direction, the consideration of discrete counterparts to the presented phenomenology in the form of the discrete linearly damped and forced NLS equation KevreDNLS will be of interest in their own right. Finally, some other interesting future directions would be to examine similar behaviors in systems of coupled NLSEs BorPT ; BorCD ; BorMAN or in systems where nonlinearity and dispersion management is applied BorDPJ . Relevant works are in progress, and will be reported in future publications.
Acknowledgments. The authors acknowledge that this work was made possible by NPRP Grant No. and NPRP Grant No. from Qatar National Research Fund (a member of Qatar Foundation). The findings achieved herein are solely the responsibility of the authors.
References
- (1) M. J. Ablowitz and H. Segur, Solitons and Inverse Scattering Transform (SIAM, 1981).
- (2) M. J. Ablowitz, Nonlinear dispersive waves: Asymptotic analysis and solitons (Cambridge University Press, 2011).
- (3) K. Nozaki and N. Bekki, Low dimensional chaos in a driven damped nonlinear Schrödinger equation, Phys. D 21, 381–393 (1986).
- (4) D. Cai, D. W. McLaughlin and K. T. R. McLaughlin, The nonlinear Schrödinger equation as both a PDE and a dynamical system, Handbook of dynamical systems, vol. 2, 599–675. North- Holland, Amsterdam, 2002.
- (5) K. Nozaki and N. Bekki, Chaos in a perturbed nonlinear Schrödinger equation, Phys. Rev. Lett. 50, 1226–1229 (1983).
- (6) K. Nozaki and N. Bekki, Solitons as attractors of a forced dissipative nonlinear Schrödinger equation, Phys. Lett. A 102, 383–386 (1984).
- (7) Y. Li and D. W. McLaughlin, Morse and Melnikov Functions for NLS PDE’s, Comm. Math. Phys. 162, 175–214 (1994).
- (8) G. Haller and S. Wiggins, Multi-pulse jumping orbits and homoclinic trees in a modal truncation of the damped-forced nonlinear Schrödinger equation, Physica D 85, 311–347 (1995).
- (9) D. Cai, D. W. McLaughlin, and J. Shatah, Spatiotemporal chaos and effective stochastic dynamics for a near-integrable nonlinear system, Phys. Lett. A 253, 280–286 (1999).
- (10) E. Shlizerman and V. Rom-Kedar, Parabolic Resonance: A Route to Hamiltonian Spatiotemporal Chaos, Phys. Rev. Lett 102, 033901, 1-4 (2009).
- (11) J. M. Ghidaglia, Finite dimensional behavior for the weakly damped driven Schrödinger equations, Ann. Inst. Henri Poincaré 5, 365–405 (1988).
- (12) X. Wang, An energy equation for the weakly damped driven nonlinear Schrödinger equations and its application to their attractors, Phys. D 88, 167–175 (1995).
- (13) O. Goubet, Regularity of the attractor for the weakly damped nonlinear Schrödinger equations, Applicable Anal. 60, 99–119 (1996).
- (14) O. Goubet, Regularity of the Attractor for Schrödinger Equation, Appl. Math. Lett. 10, 57–59 (1997).
- (15) O. Goubet, Regularity of the attractor for a weakly damped nonlinear Schrödinger equation in , Adv. Differential Equations 3, 337–360 (1998).
- (16) O. Goubet, Global attractor for weakly damped nonlinear Schrödinger equations in , Nonlinear Anal. 71, 317–320 (2009).
- (17) P. Laurençot, Long-time behaviour for weakly damped driven nonlinear Schrödinger equations in , , Nonlinear Differential Equations and Applications NoDEA 2, 357–369 (1995).
- (18) Z. A. Anastassi, G. Fotopoulos, D. J. Frantzeskakis, T. P. Horikis, N. I. Karachalios, P. G. Kevrekidis, I. G. Stratis and K. Vetas, Spatiotemporal algebraically localized waveforms for a nonlinear Schrödinger model with gain and loss, Phys. D 355, 24–33 (2017).
- (19) N. I. Karachalios, P. Kyriazopoulos and K. Vetas, Excitation of Peregrine-type waveforms from vanishing initial conditions in the presence of periodic forcing, Z. Naturforsch. A 75, 371–382 (2019).
- (20) E. Pelinovsky and C. Kharif (eds.), Extreme Ocean Waves (Springer, New York, 2008).
- (21) C. Kharif, E. Pelinovsky, and A. Slunyaev, Rogue Waves in the Ocean (Springer, New York, 2009).
- (22) A. R. Osborne, Nonlinear Ocean Waves and the Inverse Scattering Transform (Academic Press, Amsterdam, 2010).
- (23) M. Onorato, S. Residori and F. Baronio, Rogue and Shock Waves in Nonlinear Dispersive Media (Springer-Verlag, Heidelberg, 2016).
- (24) D. H. Peregrine, Water waves, nonlinear Schrödinger equations and their solutions, J. Austral. Math. Soc. B 25, 16–43 (1983).
- (25) E. A. Kuznetsov, Solitons in a parametrically unstable plasma, Sov. Phys.-Dokl. 22, 507–508 (1977).
- (26) Y. C. Ma, The Perturbed Plane‐Wave Solutions of the Cubic Schrödinger equation, Stud. Appl. Math. 60, 43–58 (1979).
- (27) N. N. Akhmediev, V. M. Eleonskii, and N. E. Kulagin, Exact first order solutions of the nonlinear Schrödinger equation, Theor. Math. Phys. 72, 809–818 (1987).
- (28) K. B. Dysthe and K. Trulsen, Note on breather type solutions of the NLS as models for freak-waves, Phys. Scr. T82, 48–52 (1999).
- (29) A. Chabchoub, N. P. Hoffmann and N. Akhmediev, Rogue Wave Observation in a Water Wave Tank, Phys. Rev. Lett. 106, 204502, 1–4 (2011).
- (30) B. Kibler, J. Fatome, C. Finot, G. Millot, F. Dias, G. Genty, N. Akhmediev and J. M. Dudley, The Peregrine soliton in nonlinear fibre optics, Nature Phys. 6, 790–795 (2010).
- (31) C. Lecaplain, Ph. Grelu, J. M. Soto-Crespo, and N. Akhmediev, Dissipative Rogue Waves Generated by Chaotic Pulse Bunching in a Mode-Locked Laser, Phys. Rev. Lett. 108, 233901, 1–4 (2012).
- (32) A. N. Ganshin, V. B. Efimov, G. V. Kolmakov, L. P. Mezhov-Deglin and P. V. E. McClintock, Observation of an Inverse Energy Cascade in Developed Acoustic Turbulence in Superfluid Helium, Phys. Rev. Lett. 101, 065303, 1–4 (2008).
- (33) H. Bailung, S. K. Sharma, and Y. Nakamura, Observation of Peregrine Solitons in a Multicomponent Plasma with Negative Ions, Phys. Rev. Lett. 107, 255005, 1–4 (2011).
- (34) A. Ankiewicz, N. Devine, N. Akhmediev, Are rogue waves robust against perturbations?, Phys. Lett. A 373, 3997–4000 (2009).
- (35) A. Calini and C. M. Schober, Rogue Waves in Higher Order Nonlinear Schrödinger Models, pp. 31–51 in Ref. k2a .
- (36) Y. Wang, L. Song, L. LI and B. A. Malomed, High-power pulse trains excited by modulated continuous waves, J. Opt. Soc. Am. B 32, 2257–2263 (2015).
- (37) L. H. Wang, K. Porsezian, and J. S. He, Breather and rogue wave solutions of a generalized nonlinear Schrödinger equation, Phys. Rev. E 87, 053202, 1–10 (2013).
- (38) A. Ankiewicz, Y. Wang, S. Wabnitz, and N. Akhmediev, Extended nonlinear Schrödinger equation with higher-order odd and even terms and its rogue wave solutions, Phys. Rev. E 89, 012907, 1–9 (2014).
- (39) Y. Yang, Z. Yan and B. A. Malomed, Rogue waves, rational solitons, and modulational instability in an integrable fifth-order nonlinear Schrödinger equation, Chaos 25, 103112, 1–9 (2015).
- (40) Y. V. Bludov, R. Driben, V. V. Konotop and B. A. Malomed, Instabilities, solitons and rogue waves in -coupled nonlinear waveguides, J. Opt. 15 064010, 1–7 (2013).
- (41) H. N. Chan, B. A. Malomed, K. W. Chow and E. Ding, Rogue waves for a system of coupled derivative nonlinear Schrödinger equations, Phys. Rev. E 93, 012217, 1–10 (2016).
- (42) W. P. Zhong, M. Belić and B. A. Malomed, Rogue waves in a two-component Manakov system with variable coefficients and an external potential, Phys. Rev. E 92, 053201, 1–5 (2015).
- (43) J. Cuevas-Maraver, B. A. Malomed, P.G.Kevrekidis and D.J.Frantzeskakis, Stabilization of the Peregrine soliton and Kuznetsov–Ma breathers by means of nonlinearity and dispersion management, Phys. Lett. A 382, 968-972 (2018).
- (44) C. Kharif and J. Touboul, Under which conditions the Benjamin-Feir instability may spawn an extreme wave event: A fully nonlinear approach, Eur. Phys. J. Special Topics 185, 159–-168 (2010).
- (45) C. Kharif, R. A. Kraenkel, M. A. Manna and R. Thomas, The modulational instability in deep water under the action of wind and dissipation, J. Fluid Mech. 664, 138–149 (2010).
- (46) M. Bertola and A. Tovbis, Universality for the focusing Nonlinear Schrödinger Equation at the gradient catastrophe point: Rational breathers and poles of the Tritronquée solution to Painlevé, Comm. Pure Appl. Math. 66, 678–752 (2009).
- (47) R. H. J. Grimshaw and A. Tovbis, Rogue Waves: analytical predictions, Proc. R. Soc. A 469, 20130094 (2013).
- (48) A. Tikan, C. Billet, G. El, A. Tovbis, M. Bertola, T. Sylvestre, F. Gustave, S. Randoux, G. Genty, P. Suret, and J. M. Dudley, Universality of the Peregrine Soliton in the Focusing Dynamics of the Cubic Nonlinear Schrödinger Equation, Phys. Rev. Lett. 119, 033901, 1–6, (2017).
- (49) E. G. Charalampidis, J. Cuevas-Maraver, D. J. Frantzeskakis, and P. G. Kevrekidis, Rogue Waves in Ultracold Bosonic Seas, Rom. Rep. Phys. 70 504, 1–26 (2018).
- (50) G. Yang, L. Li and S. Jia, Peregrine rogue waves induced by the interaction between a continuous wave and a soliton, Phys. Rev. E 85, 046608 (2012).
- (51) G. Yang, Y. Wang, Z. Qin, B. A. Malomed, D. Mihalache and L. Li, Breatherlike solitons extracted from the Peregrine rogue wave Phys. Rev. E 90, 062909 (2014).
- (52) G. Biondini and D. Mantzavinos, Universal nature of the nonlinear stage of modulational instability, Phys. Rev. Lett. 116, 043902 (2016).
- (53) B. Sandstede, A. Scheel, Defects in oscillatory media: toward a classification, SIAM J. Appl. Dyn. Syst. 3, 1–68 (2004).
- (54) J. Cuevas Maraver, P. G. Kevrekidis, D. J. Frantzeskakis, N. I. Karachalios, M. Haragus and G. James, Floquet analysis of Kuznetsov-Ma breathers: A path towards spectral stability of rogue waves, Phys. Rev. E 96, 012202, 1–8 (2017).
- (55) A. Slunyaev, A. Sergeeva and E. Pelinovsky, Wave amplification in the framework of forced nonlinear Schrödinger equation: The rogue wave context, Phys. D 303, 18–27 (2015).
- (56) A. Tikan, Effect of local Peregrine soliton emergence on statistics of random waves in the 1-D focusing Nonlinear Schrödinger equation, https://arxiv.org/abs/1905.11938.
- (57) P. G. Kevrekidis, The Discrete Nonlinear Schrödinger Equation: Mathematical Analysis, Numerical Computations and Physical Perspectives (Springer, 2009).
- (58) M. Onorato and D. Proment, Approximate rogue wave solutions of the forced and damped nonlinear Schrödinger equation for water waves, Phys. Lett. A 376, 3057 (2012).
- (59) M. Brunetti, N. Marchiando, N. Berti, J. Kasparian, Nonlinear fast growth of water waves under wind forcing, Phys. Lett. A 378, 1025 (2014).
- (60) L. Dostal, M. Hollm and E. Kreuzer, Study on the behavior of weakly nonlinear water waves in the presence of Random Wind Forcing, https://arxiv.org/abs/1909.11761.