Fiber coupled EPR-state generation using a single temporally multiplexed squeezed light source
Abstract
A prerequisite for universal quantum computation and other large-scale quantum information processors is the careful preparation of quantum states in massive numbers or of massive dimension. For continuous variable approaches to quantum information processing (QIP), squeezed states are the natural quantum resources, but most demonstrations have been based on a limited number of squeezed states due to the experimental complexity in up-scaling. The number of physical resources can however be significantly reduced by employing the technique of temporal multiplexing. Here, we demonstrate an application to continuous variable QIP of temporal multiplexing in fiber: Using just a single source of squeezed states in combination with active optical switching and a fiber delay line, we generate fiber-coupled Einstein-Podolsky-Rosen entangled quantum states. Our demonstration is a critical enabler for the construction of an in-fiber, all-purpose quantum information processor based on a single or few squeezed state quantum resources.
INTRODUCTION
The realization of quantum computation (QC) with demonstrated quantum supremacy requires a scalable platform of quantum resources Nielsen and Chuang (2000); Bennett and DiVincenzo (2000): Usually hundreds of logical qubits, or thousands of physical qubits, are needed to reach this longstanding goal Dalzell et al. (2018). In one-way measurement based quantum computation (MBQC) Gottesman and Chuang (1999); Raussendorf and Briegel (2001), universal computation is performed with only single-qubit projective measurements of an entangled cluster state Raussendorf et al. (2003). Thereby, scalability is relaxed to the generation of a cluster state of suitable size Gu et al. (2009). Cluster states of multiple modes of light are readily accessible in continuous variable optical platforms, but most demonstrations have been limited by the amount of spatial resources et al. (2003, 2007a, 2007b); Yukawa et al. (2008); et al. (2009a). However, by time and frequency multiplexing with squeezed states of light, large cluster states can be deterministically generated as demonstrated with 60 frequency modes in Roslund et al. (2014); Chen et al. (2014) and temporal modes in et al. (2016, 2013). This allows for excellent scalability, thereby rendering the need for spatially distributed resources unnecessary.
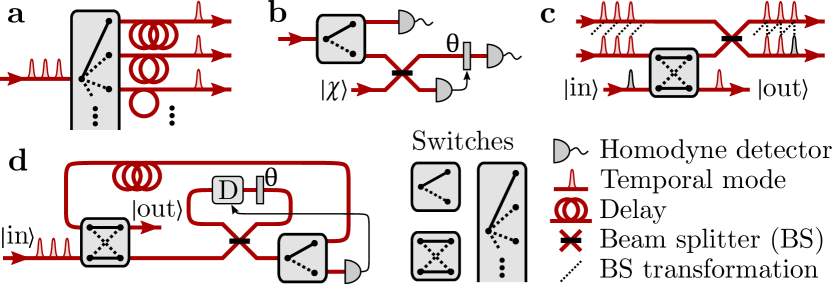
MBQC based on temporally encoded cluster states Menicucci (2011); Alexander et al. (2018) from a single squeezed state resource Andersen et al. (2016) requires optical switching and passive optical storage (such as an optical delay line) in different configurations as illustrated in Fig. 1. Multiple time-synchronized squeezed states can be generated in the network illustrated in Fig. 1a, allowing 2D cluster state generation from a single squeezing source Menicucci (2011); Alexander et al. (2018). Moreover, in MBQC, sequential measurements are performed on the cluster in which each measurement strategy is adaptively changed based on previous measurement outcomes. In some cases, switching between completely different measurement schemes, e.g. homodyne detection and a non-Gaussian measurement, is required Alexander et al. (2018) (Fig. 1b). As an alternative to switching between Gaussian and non-Gaussian measurement schemes, one might fix the measurement setting to Gaussian homodyne detection and switch ancillary non-Gaussian states into selected modes of the cluster state Alexander et al. (2017) (Fig. 1c). Finally, it is possible to realize MBQC by applying optical switching in loop-based architectures Motes et al. (2014); Takeda and Furusawa (2017) as illustrated in Fig. 1d. No matter which of the strategies is chosen, switching and delay lines are key functionalities in managing temporal modes in optical MBQC.
In this article, we demonstrate optical fiber switching combined with an optical fiber delay in a continuous variable (CV) quantum setting in the telecom band. This enables us to generate an Einstein-Podolsky-Rosen (EPR) state et al. (2009b) between two fiber modes by time multiplexing of a single source of squeezed states of light. Our demonstration of optical switching and optical delay in a CV, fiber-integrated and low-loss setting is a critical step towards the realization of a scalable platform for CV quantum information processing and ultimately universal quantum computation.
RESULTS
The quadrature entangled EPR-state is an important resource in numerous quantum information and sensing protocols ranging from CV teleportation et al. (1998) and cryptography Madsen et al. (2012) to CV computing et al. (2006). The most wide-spread realization of quadrature entanglement is based on cavity-enhanced spontaneous parametric down-conversion in an optical parametric oscillator (OPO). Correlations can be established between different polarization or frequency modes from a single non-degenerate OPO Ou et al. (1992); Bardroff and Stenholm (2000); Schori et al. (2002); Bowen et al. (2002); Hayasaka et al. (2004); Laurat et al. (2005); Wenger et al. (2005); Villar et al. (2006), or by combining the squeezed state outputs of two degenerate OPOs onto a balanced beam splitter et al. (1998, 2001); Bowen et al. (2003); Takei et al. (2005). Here we use the latter approach of combining two squeezed states on a beam splitter, but instead of using two OPOs, we exploit time multiplexing of a single source.
Experimental setup
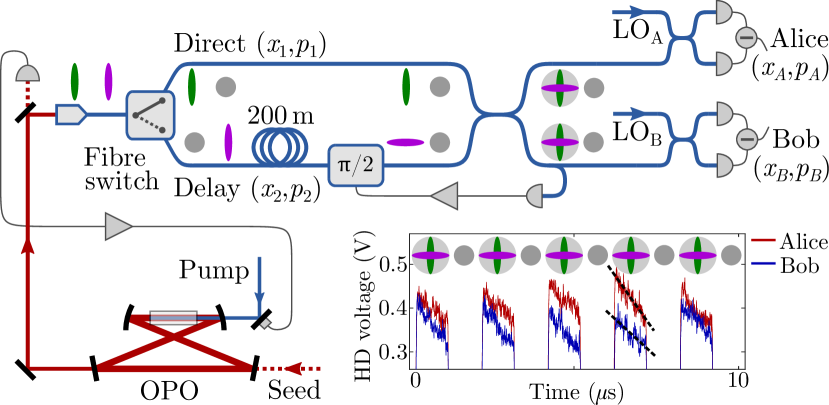
The experimental setup is sketched in Fig. 2. We inject a single squeezed beam into a fiber switch that alternately guides the squeezed beam into two different fibers at a frequency of ; thereby delaying one mode by with respect to the other. To compensate for the delay and thus synchronize the two modes in time, the mode ahead propagates through a fiber spool. The two modes interfere with a relative phase shift of in a balanced fiber coupler, thereby forming a two-mode squeezed state.
For state characterization, we sample on an oscilloscope the quadratures of the fiber coupler outputs measured by two homodyne detection stations, Alice and Bob. Typical time traces of such measurements are shown in the inset of Fig. 2. A single data set consists of time traces triggered by the switching signal. Each time trace is affected by a frequency dependent response of the detector giving rise to the negative slope seen in the inset of Fig. 2, and a noisy oscillatory response of the fiber switch. Besides this, there is a variation in the slope of each time trace due to spurious interferences – both effects occur from the coherent amplitude of the initial bright squeezed state together with limited detection, switching and feedback bandwidths. However, since these effects are systematic, repeatable and synchronized with the switching process, they can be tracked and compensated in the data processing – see Methods.
We have striven to reduce the loss of all components to maintain as much of the non-classicality as possible. We used an anti-reflection coated graded-index lens to couple the squeezed light into the fiber with an efficiency of 97% (by matching counter-propagating light in the OPO cavity), we spliced together all fiber components to minimize fiber-to-fiber coupling losses and by using the wavelength of , fiber propagation loss was negligible: Even through the fiber delay (standard SMF-28e+ fiber), the propagation loss is . The largest loss contribution is caused by the fiber switch (Nanona by Boston Applied Technologies Inc.), where light is coupled into a bulk electro-optic material and back into fiber leading to 17% loss. Including OPO escape efficiency, detection efficiency and various tapping for phase locks, the total transmission from the squeezed state source to the detected signal becomes (for more details see Methods).
Experimental results
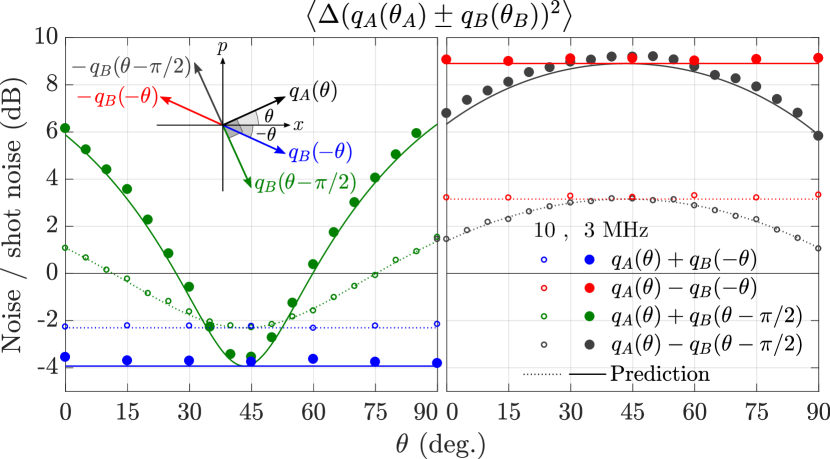
To perform partial tomography of the generated two-mode squeezed states, we measure the quadratures and as a function of the local oscillator phase . Here where is the amplitude and the phase quadrature at Alice () and Bob (). The resulting noise variances at the and side band frequencies are shown in Fig. 3 together with theoretical predictions. We observe a maximum shot noise suppression of . The very small discrepancy of the measurements at results from technical noise of the seed beam as well as additional noise added in the delay line – both noise effects are discussed and analyzed below and in supplementary information section 3.
The variances of ,
| (1) |
associated with the maximally squeezed and anti-squeezed quadratures, respectively, are seen to be constant with , indicating symmetric two-mode squeezing. This is expected as the individual single mode squeezed states in the direct () and delay () line originate from the same squeezing source, that is and . From the data sets at and , entanglement can be verified by the inseparability criterion Duan et al. (2000) which reads
| (2) |
at , and at . Here is the variance of the vacuum state.
When measuring the variances of
| (3) |
as a function of , we trace out one specific projection that in particular realizes the squeezed and anti-squeezed quadratures. Maximum squeezing and anti-squeezing are measured at where correlations are strongest, corresponding to the measurements of . At and we expect no correlations and measure the variances corresponding to the added noise of thermal states at Alice and Bob when tracing out one mode.
From the partial tomography, we reconstruct the covariance matrix of the two-mode squeezed state at the side band frequency et al. (2012):
| (4) |
Here, the entries with ’-’ were not measured as it would require a more elaborate measurement scheme, but they should in principle be zero due to the symmetry of the states. However, due to uncertainties in the phase control and non-perfect phase-space alignments, the values will in practice be slightly different from zero. This is also clear from the off-diagonal correlation terms and which in practice are non-zero as seen in the measured co-variance matrix but in theory should be zero for a perfectly aligned system (see supplementary information section 4). Finally, from the covariance matrix we determine the conditional variances between Alice and Bob’s measurements from which we test the EPR-criterion Reid (1989):
| (5) |
where is the conditional uncertainty in predicting when measuring . Since both conditional variance products are below , the generated states are EPR entangled in both directions.
As seen from Eq. (LABEL:eq:qA_pm_pB) for and , the measured two-mode squeezing is equivalent to the squeezing of the single mode states in the direct and delayed paths, respectively. The spectra of such measurements are shown in Fig. 4. The squeezing spectra are Lorentzian and resemble that of the OPO cavity. Furthermore, the anti-squeezing is seen to be symmetric, while the squeezing has degraded slightly in the delay line due to additional phase noise. To characterize this, we measure the seed spectrum by blocking the pump to the squeezing cavity. The low frequency noise that can be observed in the direct line results from technical noise of the seed beam. Even more low frequency noise is apparent in the squeezed state of the delay line. We believe it originates from phase noise generated by the fiber and amplitude noise from the fiber switch which is most prominent at .
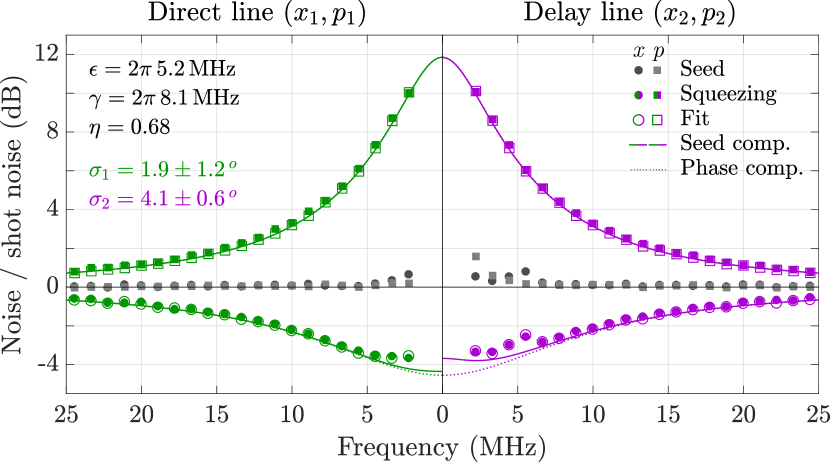
To infer the phase fluctuations, , associated with the direct () and delay () line, the squeezing spectra including a normal distributed phase with standard deviation, approximated to for and Aoki et al. (2006), is fitted with as the only fitting parameter. Here, following Collett and Gardiner (1984) with additional seed noise coupled into the OPO and ,
| (6) |
where , is the pump rate, is the total OPO decay rate, is the overall efficiency and is the angular frequency, while with being the decay rate due to the seed beam coupling mirror and is the seed beam quadrature noise before injection into the OPO (for detailed derivation see supplementary information section 3.1). We find a decay rate of by measuring the OPO intracavity losses (0.55%), the cavity length () and the transmissivity of the coupling mirror (10%), and we estimate the pump rate to for a pump power of and a measured OPO threshold power of . is estimated as where is the quadrature noise measured with no pump (, gray points in direct line of Fig. 4). Finally, to include excess noise of the delay line, the seed noise difference of the direct and delay line is added to the fit in the delay line. The fit is shown as hollow points in Fig. 4, and is seen to fit very well with the measured data. The resulting phase fluctuations obtained from the fit are and with uncertainties estimated as the 95% confidence interval. These values are included in the theoretical model used for Fig. 3.
From the theoretical model with fitted phase fluctuations, the solid lines in Fig. 4 indicate the expected squeezing spectra if the seed beam were shot noise limited and no additional noise existed in the delay line. In that case, we can expect more than two-mode squeezing. The phase fluctuation in the delay line, , is more than double that in the direct line, . This is mainly due to limited phase control bandwidth of the fiber delay and low signal-to-noise ratio of the feedback signal. Finally, the dotted line in Fig. 4 shows the squeezing spectrum we would expect if we had perfect phase control, and thus the optimum squeezing we may measure with the given efficiency.
DISCUSSION
The fast switching frequency of demonstrated here is suitable for encoding temporal modes of megahertz bandwidth and is thus applicable in the optical schemes in Fig. 1. Similarly, the low loss of the fiber allows for an efficient delay of almost , compatible with the temporal modes defined by the switching. However, the 17% loss of the particular switch used here, as well as the phase fluctuations of standard deviation in the fiber delay, leads to decoherence and results in some limitations when used in quantum settings: For cluster state generation from a temporal multiplexed source, as in Fig. 1a, or when switching modes in and out of a cluster state, as in Fig. 1c, the switching loss and phase fluctuation leads to limited entanglement even when large amount of initial squeezing is available. Yet, it does not accumulate through the cluster state as the loss and phase fluctuation on each mode is local, and so it does not limit the cluster state size. It will be more detrimental in loop based architectures, as in Fig. 1d, where a temporal mode passes through the same switch and delay line multiple times, and so the switch efficiency and delay phase fluctuations limit the number of passes possible and thereby the computation depth.
High efficient fast switching is demonstrated in free-space Kaneda and Kwiat (2018), while one can imagine more compact fiber coupled switching based on Mach-Zehnder interferometry. However, in either case care must be taken not to compromise the high switching frequency, as this leads to longer delay lines necessary and thereby larger phase fluctuations. In work towards temporal encoded optical quantum information processing, faster switching is preferable as it minimizes the required delay lengths and increases the computational speed. Thus the ideal switch, besides being efficient, is as fast as the detection or squeezing source bandwidth.
In conclusion, using a single squeezing source with optical switching and delay, we have successfully generated in-fiber EPR-states with nearly of two-mode squeezing, characterized by fiber-coupled homodyne detection. Our setup has great scalability potentials: Adding an additional delay line, it is possible to extend the setup to generate one-dimensional cluster states et al. (2016, 2013), and by adding a multi-port switch and more delay lines, two-dimensional cluster states Menicucci (2011); Alexander et al. (2018) can be generated from a single squeezing source. Moreover, by inserting the switch inside a loop, as in Fig. 1d, combined with dynamical control, various entangled states can be generated and in principle universal quantum computation can be realized. Since all switches and delay lines are fiber components, the setup remains very small and flexible despite the increasing complexity in generating more complex states. Moreover, since fiber propagation losses are extremely low at the operating wavelength of , decoherence is not a big issue despite the increasing number of fiber delays. The largest decoherence source in the current setup is the optical switch which introduces a loss of 17%. However, with future developments of the optical switch, we expect that the in-fiber temporal multiplexing technique demonstrated here will play a significant role in reducing the resources in future large-scale photonic circuits for continuous variable quantum information processing, including quantum computing Gu et al. (2009), quantum teleportation Pirandola et al. (2015), distributed sensing et al. (2019) and multi-partite quantum key distribution.
METHODS
Squeezing source
The experimental setup is outlined in Fig. 2. As squeezing source, we use an optical parametric oscillator (OPO) based on a periodically poled potassium titanyl phosphate (PPKTP) crystal in a bowtie shaped cavity, locked by a counter propagating coherent beam. A pump beam at a wavelength of is used to drive the parametric process and thus produce squeezed light at via type-0 phase matching. The OPO has a bandwidth of . Stable phase locking at different stages of the experiment is facilitated by an excitation of the squeezed state, realized by injecting a bright seed beam into the OPO. To lock the phase of the input pump beam to the deamplification point of the parametric process, thereby producing amplitude squeezed states, we tap off and detect 1% of the excited squeezed beam for feedback to a piezo-mounted mirror in the pump beam. This, as well as all other feedback controls in the experiment, is realized by the open-source software package PyRPL et al. (2017) running on Red Pitaya boards that integrate an FPGA system-on-chip with fast ADCs and DACs.
In-fiber phase control
For locking the relative phase difference when interfering the two beams of bright squeezed states in a balanced fiber coupler for EPR-state generation, 1% is tapped off one of the fiber coupler output arms, and fed back to a homemade fiber stretcher in the delay line based on Mei et al. (2007). Here, using a piezoelectric actuator, a phase shift is induced by stretching the fiber. For more details, see the supplementary information section 2. The optical transmission efficiency is near unity, as it simply depends on the fiber which has negligible loss at wavelength. This allows high-efficient in-fiber phase control, and the same design is used for phase control of the local oscillators in the homodyne detection.
Fiber-coupled homodyne detection
To detect quadratures of the in-fiber generated EPR-state, we developed a fiber-coupled homodyne detector (HD) where signal and local oscillator (LO) is interfered in a balanced fiber coupler before detection. For schematics and details, see supplementary information section 2. This has the benefit of being mobile, and the visibility between signal and LO is easily optimized to near unity due to the single mode nature of the fiber used.
The fiber coupler is not exactly symmetric, but has a coupling ratio of approximately 48:52. To compensate for this, the HD is balanced by attenuation in the fiber coupler output arm of stronger LO by inducing bending losses. With an asymmetry of in the fiber coupler, after balancing this leads to loss.
Finally, to couple and focus light from the fiber onto the HD photo diodes of diameter (Laser Components Nordic AB), anti-reflective coated graded-index (GRIN) lens are used in front of the diode, leading to a free-space waist diameter of at from the GRIN lens facet. The quantum efficiency is measured to be , and so together with loss from balancing and 99% visibility, the total HD efficiency achieved is 91%.
Overall efficiency
With the OPO escape efficiency of 95%, and 1% tapping for gain lock, the efficiency in free-space before fiber coupling is 94%. In fiber, including 97% fiber coupling efficiency, 17% loss in the fiber switch and 1% tapping for phase control, the efficiency is 80%. Finally, with 91% detection efficiency, the overall efficiency becomes
| (7) |
Temporal data processing
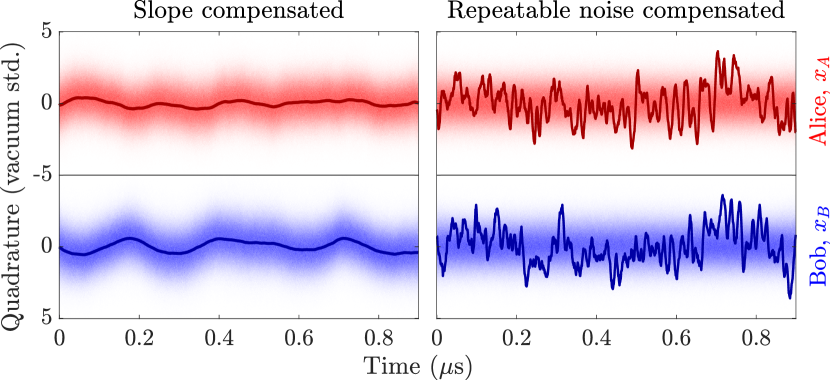
To recover two-mode squeezing from the acquired time traces affected by a frequency dependent detector response (leading to a negative slope), spurious interference (leading to slope variations) and an oscillating response from the switch, we use the statistic of time traces in a dataset synchronized with the switching process. To compensate for the negative and varying slope of each time trace, linear regression lines (as the dashed lines in the inset of Fig. 2) are subtracted from each individual trace of the dataset. The result is shown in Fig. 5(left). Here, the repeatable oscillating noise is visible, and compensated for by subtracting the average time trace of the dataset from every single time trace. The final processed dataset is seen in Fig. 5(right) with a constant temporal histogram and a single time trace at Alice and Bob showing anti-correlations as in Takei et al. (2006). For detailed discussion on the data processing, see supplementary information section 2.1.
DATA AVAILABILITY
Experimental data and analysis code is available on request.
ACKNOWLEDGEMENTS
The work was supported by the Danish National Research Foundation through the Center for Macroscopic Quantum States (bigQ, DNRF142), and the VILLUM FOUNDATION Young Investigator Programme.
AUTHOR CONTRIBUTIONS
U.L.A., J.S.N. and M.V.L. conceived the experiment. J.S.N., X.G. and C.R.B. designed and built the squeezing source. M.V.L. performed the experiment and analyzed the data. All authors contributed to the manuscript.
References
- Nielsen and Chuang (2000) M. A. Nielsen and I. L. Chuang, Quantum Computation and Quantum Information (Cambridge University Press, England, 2000).
- Bennett and DiVincenzo (2000) C. H. Bennett and D. P. DiVincenzo, “Quantum information and computation,” Nature 404, 247 (2000).
- Dalzell et al. (2018) A. M. Dalzell, A. W. Harrow, D. E. Koh, and R. L. La Placa, “How many qubits are needed for quantum computational supremacy?” arXiv:quant-ph/1805.05224v2 (2018).
- Gottesman and Chuang (1999) D. Gottesman and I. L. Chuang, “Quantum teleportation as a universal computational primitive,” Nature 402, 390 (1999).
- Raussendorf and Briegel (2001) R. Raussendorf and H. J. Briegel, “A one-way quantum computer,” Phys. Rev. Lett. 86, 5188 (2001).
- Raussendorf et al. (2003) R. Raussendorf, D. E. Browne, and H. J. Briegel, “Measurement-based quantum computation with cluster states,” Phys. Rev. A 68, 022312 (2003).
- Gu et al. (2009) M. Gu, C. Weedbrook, N. C. Menicucci, T. C. Ralph, and P. van Loock, “Quantum computing with continuous-variable clusters,” Phys. Rev. A 79, 062318 (2009).
- et al. (2003) O. Glöckl et al., “Experiment towards continuous-variable entanglement swapping: Highly correlated four-partite quantum state,” Phys. Rev. A 68, 012319 (2003).
- et al. (2007a) X. Su et al., “Experimental preparation of quadripartite cluster and Greenberger-Horne-Zeilinger entangled states for continuous variables,” Phys. Rev. Lett. 98, 070502 (2007a).
- et al. (2007b) R. Dong et al., “An efficient source of continuous variable polarization entanglement,” New J. Phys. 9, 410 (2007b).
- Yukawa et al. (2008) M. Yukawa, R. Ukai, P. van Loock, and A. Furusawa, “Experimental generation of four-mode continuous-variable cluster states,” Phys. Rev. A 78, 012301 (2008).
- et al. (2009a) T. Aoki et al., “Quantum error correction beyond qubits,” Nat. Phys. 5, 541 (2009a).
- Roslund et al. (2014) J. Roslund, R. Medeiros de Araújo, S. Jiang, C. Fabre, and N. Treps, “Wavelength-multiplexed quantum networks with ultrafast frequency combs,” Nat. Photonics 8, 109 (2014).
- Chen et al. (2014) M. Chen, N. C. Menicucci, and O. Pfister, “Experimental realization of multipartite entanglement of 60 modes of a quantum optical frequency comb,” Phys. Rev. Lett. 112, 120505 (2014).
- et al. (2016) J. Yoshikawa et al., “Invited article: Generation of one-million-mode continuous-variable cluster state by unlimited time-domain multiplexing,” APL Photonics 1, 060801 (2016).
- et al. (2013) S. Yokoyama et al., “Ultra-large-scale continuous-variable cluster states multiplexed in the time domain,” Nat. Photonics 7, 982 (2013).
- Menicucci (2011) N. C. Menicucci, “Temporal-mode continuous-variable cluster states using linear optics,” Phys. Rev. A 83, 062314 (2011).
- Alexander et al. (2018) R. N. Alexander, S. Yokoyama, A. Furusawa, and N. C. Menicucci, “Universal quantum computation with temporal-mode bilayer square lattices,” Phys. Rev. A 97, 032302 (2018).
- Andersen et al. (2016) U. L. Andersen, T. Gehring, C. Marquardt, and G. Leuchs, “30 years of squeezed light generation,” Physica Scripta 91, 053001 (2016).
- Alexander et al. (2017) R. N. Alexander, N. C. Gabay, P. P. Rohde, and N. C. Menicucci, “Measurement-based linear optics,” Phys. Rev. Lett. 118, 110503 (2017).
- Motes et al. (2014) K. R. Motes, A. Gilchrist, J. P. Dowling, and P. P. Rohde, “Scalable boson sampling with time-bin encoding using a loop-based architecture,” Phys. Rev. Lett. 113, 120501 (2014).
- Takeda and Furusawa (2017) S. Takeda and A. Furusawa, “Universal quantum computing with measurement-induced continuous-variable gate sequence in a loop-based architecture,” Phys. Rev. Lett. 119, 120504 (2017).
- et al. (2009b) M. D. Reid et al., “Colloquium: The Einstein-Podolsky-Rosen paradox: From concepts to applications,” Rev. Mod. Phys. 81, 1727 (2009b).
- et al. (1998) A. Furusawa et al., “Unconditional quantum teleportation,” Science 282, 706 (1998).
- Madsen et al. (2012) L. S. Madsen, V. C. Usenko, M. Lassen, R. Filip, and U. L. Andersen, “Continuous variable quantum key distribution with modulated entangled states,” Nat. Commun. 3, 1083 (2012).
- et al. (2006) N. C. Menicucci et al., “Universal quantum computation with continuous-variable cluster states,” Phys. Rev. Lett. 97, 110501 (2006).
- Ou et al. (1992) Z. Y. Ou, S. F. Pereira, H. J. Kimble, and K. C. Peng, “Realization of the Einstein-Podolsky-Rosen paradox for continuous variable,” Phys. Rev. Lett. 68, 3663 (1992).
- Bardroff and Stenholm (2000) P. J. Bardroff and S. Stenholm, “Two-mode laser with excess noise,” Phys. Rev. A 62, 023814 (2000).
- Schori et al. (2002) C. Schori, J. L. Sørensen, and E. S. Polzik, “Narrow-band frequency tunable light source of continuous quadrature entanglement,” Phys. Rev. A 66, 033802 (2002).
- Bowen et al. (2002) W. P. Bowen, N. Treps, R. Schnabel, and P. K. Lam, “Experimental demonstration of continuous variable polarization entanglement,” Phys. Rev. Lett. 89, 253601 (2002).
- Hayasaka et al. (2004) K. Hayasaka, Y. Zhang, and K. Kasai, “Generation of twin beams from an optical parametric oscillator pumped by a frequency-doubled diode laser,” Optics Lett. 29, 1665 (2004).
- Laurat et al. (2005) J. Laurat, T. Coudreau, G. Keller, N. Treps, and C. Fabre, “Effects of mode coupling on the generation of quadrature Einstein-Podolsky-Rosen entanglement in a type-II optical parametric oscillator below threshold,” Phys. Rev. A 71, 022313 (2005).
- Wenger et al. (2005) J. Wenger, A. Ourjoumtsev, R. Tualle-Brouri, and P. Grangier, “Time-resolved homodyne characterization of individual quadrature-entangled pulses,” Eur. Phys. J. D 32, 391 (2005).
- Villar et al. (2006) A. S. Villar, M. Martinelli, C. Fabre, and P. Nussenzveig, “Direct production of tripartite pump-signal-idler entanglement in the above-threshold optical parametric oscillator,” Phys. Rev. Lett. 97, 140504 (2006).
- et al. (2001) C. Silberhorn et al., “Generation of continuous variable Einstein-Podolsky-Rosen entanglement via the Kerr nonlinearity in an optical fiber,” Phys. Rev. Lett. 86, 4267 (2001).
- Bowen et al. (2003) W. P. Bowen, R. Schnabel, P. K. Lam, and T. C. Ralph, “Experimental investigation of criteria for continuous variable entanglement,” Phys. Rev. Lett. 90, 043601 (2003).
- Takei et al. (2005) N. Takei, H. Yonezawa, T. Aoki, and A. Furusawa, “High-fidelity teleportation beyond the no-cloning limit and entanglement swapping for continuous variables,” Phys. Rev. Lett. 94, 220502 (2005).
- Duan et al. (2000) L. Duan, G. Giedke, J. I. Cirac, and P. Zoller, “Inseparability criterion for continuous variable systems,” Phys. Rev. Lett. 84, 2722 (2000).
- et al. (2012) C. Weedbrook et al., “Gaussian quantum information,” Rev. Mod. Phys. 84, 621 (2012).
- Reid (1989) M. D. Reid, “Demonstration of the Einstein-Podolsky-Rosen paradox using nondegenerate parametric amplification,” Phys. Rev. A 40, 913 (1989).
- Aoki et al. (2006) T. Aoki, G. Takahashi, and A. Furusawa, “Squeezing at 946nm with periodically poled KTiOPO4,” Opt. Express 14, 6930 (2006).
- Collett and Gardiner (1984) M. J. Collett and C. W. Gardiner, “Squeezing of intracavity and traveling-wave light fields produced in parametric amplification,” Phys. Rev. A 30, 1386 (1984).
- Kaneda and Kwiat (2018) F. Kaneda and P. G. Kwiat, “High-efficiency single-photon generation via large-scale active time multiplexing,” arXiv:quant-ph/1803.04803v1 (2018).
- Pirandola et al. (2015) S. Pirandola, J. Eisert, C. Weedbrook, A. Furusawa, and S. Braunstein, “Advances in quantum teleportation,” Nature Photonics 9, 641 (2015).
- et al. (2019) X. Guo et al., “Distributed quantum sensing in a continuous variable entangled network,” arXiv:quant-ph/1905.09408 (2019).
- et al. (2017) L. Neuhaus et al., “PyRPL (Python Red Pitaya Lockbox) – An open-source software package for FPGA-controlled quantum optics experiments,” CLEO/Europe-EQEC IEEE http://www.pyrpl.org (2017).
- Mei et al. (2007) H. Mei, B. Li, H. Huang, and R. Rao, “Piezoelectric optical fiber stretcher for application in an atmospheric optical turbulence sensor,” Appl. Opt. 46, 4371 (2007).
- Takei et al. (2006) N. Takei, N. Lee, D. Moriyama, J. S. Neergaard-Nielsen, and A. Furusawa, “Time-gated Einstein-Podolsky-Rosen correlation,” Phys. Rev. A 74, 060101 (2006).