Demonstration of defect-defect ferromagnetic coupling in Gd doped GaN epitaxial films: A polarization selective magneto-photoluminescence study
Abstract
Magnetic field dependent polarization selective photoluminescence(PL) study has been carried out at 1.5 K on Gd-doped GaN epitaxial layers grown on c-SiC substrates by molecular beam epitaxy technique. It has been found that the incorporation of Gd in GaN leads to the generation of three types of donor like defects that result in neutral donor bound excitonic features in low temperature PL. The study reveals that the rate of spin-flip scattering for all the three excitonic features becomes almost -independent suggesting that these signals must be stemming from defects which are ferromagnetically coupled with each other. This is further confirmed by the study carried out on a GaN sample co-doped with Si and Gd, where defects are found to be ferromagnetically coupled, while Si-donors do not show any involvement in coupling.
Gadolinium (Gd)-doped GaN (GaN:Gd) remains to be one of the active areas in physics for exhibiting certain intriguing magnetic properties. Ferromagnetism far above room temperature even with doping concentration as low as 1015 cm-3 as well as several orders of magnitude larger effective magnetic moment per Gd ion as compared to that of a bare Gd3+ ion (8 ) have been observed in GaN:Gd epitaxial layersDhar et al. (2005a, b). Element specific magnetic studies on these layers show a very small polarization for Ga and paramagnetism for Gd ions, indicating that the magnetism does not solely arise from Gd itselfNey et al. (2010). Since then, a large volume of work in this field has revealed ferromagnetic like behavior not only in GaN:GdHite et al. (2006a); Bedoya-Pinto et al. (2009); Asahi et al. (2004) but also in other rare-earth doped GaNHite et al. (2006b); Sun et al. (2011). Similar magnetic behavior has also been reported in GdDhar et al. (2006); Khaderbad et al. (2007) and DyWang et al. (2017)-implanted GaN layers. Effective magnetic moment per Gd ion, which is reported to be larger in Gd implanted GaN layers,Dhar et al. (2006) shows a reduction upon annealingKhaderbad et al. (2007), suggesting a defect origin of the magnetism. Formation of multiple type of defects due to Gd incorporation have been demonstrated in molecular beam epitaxy (MBE) grown GaN:Gd layersMishra et al. (2010, 2011); Bedoya-Pinto et al. (2009). In these samples, Mishra et al. have also found a connection between the magnetism and the density of certain defects that results in a low temperature photoluminescence(PL) peak at 3.05 eVMishra et al. (2011); Mishra and Dhar (2016). However, the microscopic origin of the defects and their involvement in establishing long range magnetic ordering is still unclear. Theoretical studies have shown that certain defects, such as Ga-vacancies(),Gohda and Oshiyama (2008); Dev et al. (2008); Liu et al. (2008); Thiess et al. (2015) N-interstitials()Mitra and Lambrecht (2009), O-interstitials()Mitra and Lambrecht (2009) as well as nitrogen vacancy()-Ga vacancy complexes Zhang et al. (2014); Gohda and Oshiyama (2010), which possess magnetic moment, can account for the large effective magnetic moment per Gd ion and explain ferromagnetism in this material. It is noteworthy that ferromagnetism above room temperature has been observed in semiconductors such as HfO, ZnO, TiO2, In2O3, where atoms with partially filled or shells are not present at allSun et al. (2012). Though, crystalline defects are predicted to be the reason for ferromagnetism in these semiconductors, there is no experimental report, which directly evidences coupling between defects.
Here, we have carried out a magnetic field dependent polarization selective photoluminescence(PL) study at 1.5 K on several Gd-doped GaN epitaxial layers grown on c-6H SiC substrates by MBE. The study reveals that the incorporation of Gd in GaN leads to the generation of three types of donor like defects, all of which give rise to neutral donor bound excitonic transitions in low temperature PL. It has been shown that the dependence of spin-flip scattering rate on the magnetic field () for a given excitonic transition carries the information about the magnetic coupling of the associated defects. Spin-flip scattering rates for all the three excitonic features are found to be almost -independent for samples with Gd concentration more than 1017 cm-3 suggesting that these signals must be stemming from the defects which are ferromagnetically coupled with each other.
| Sample | NGd | NSi | MS (2 K) | MS (300 K) | |
| (nm) | (cm-3) | (cm-3) | (emu/cm3) | (emu/cm3) | |
| C | 700 | 61016 | 0 | 0.52 | 0.41 |
| D | 700 | 2.451017 | 0 | 0.8 | 0.54 |
| D* | 700 | 2.451017 | 0 | - | 0.22 |
| E | 200 | 11018 | 21019 | 4 | 2.5 |
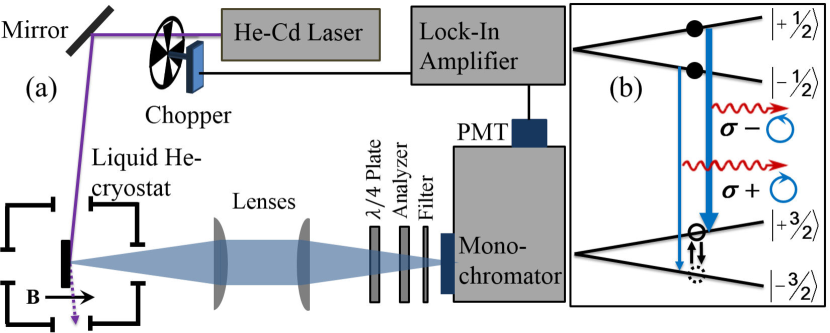
GaN layers with different Gd concentrations were grown directly on 6H-SiC(0001) substrates using reactive molecular-beam epitaxy (RMBE) technique. A Gd-undoped GaN layer was also grown as the reference standard (sample R). One of the samples (sample E) was co-doped with both Gd and Si. More details about the growth can be found elsewhereDhar et al. (2005a, b). Magnetization measurements show ferromagnetic like behavior even above 300 K in all of the Gd-doped samples. One of the Gd doped sample (sample D) was rapid thermally annealed at 600oC for 30 s in flowing N2 gas. See Tab. 1 to know more about these samples. A commercial grade hydride vapor phase epitaxy (HVPE) grown Si doped (NSi 11018 cm-3) c-plane GaN(3 m)/sapphire sample from TDI Inc. of USA, was used as another reference standard (Sample RS). Magneto-photoluminescence(PL) studies were carried out at 1.5 K in a liquid helium cryostat equipped with a split coil superconducting magnet and optical windows. Experimental setup is shown schematically in Fig. 1(a). A linearly polarized He-Cd laser (325 nm) was used as the excitation source. Magnetic field was applied perpendicular to the sample surface (c-direction). Luminescence was collected along the magnetic field direction [Faraday geometry] through a 0.5 m focal length monochromator attached with a photomultiplier tube (PMT). Combination of an achromatic -plate and a Glan-Taylor calcite analyser was used to select either the or polarization of the luminescence. Polarization of photoluminescence = , where and are the intensities associated with and polarized lights, respectively, was measured as a function of the applied magnetic field at the peak positions of the defect related PL features.
As shown in Figure 2(a), 1.5 K PL spectra for both the reference samples R and RS is dominated by the neutral donor bound excitonic peak () appearing at 3.457 and 3.48 eV, respectively. The high and low energy peaks can be attributed to associated with Si and unintentionally incorporated oxygen shallow donorsDhar et al. (2005a, b). PL spectra for Gd doped GaN samples C, D and E are featured by three relatively broad peaks appearing in the range of 3.05-3.1 eV (), 3.15-3.2 eV () and 3.25-3.3 eV (). Bare SiC substrate does not show any feature in the photon energy range. Note that , and features, which are found to be present in all GaN:Gd samples, are attributed to certain defects produced in the GaN lattice as a result of Gd incorporationMishra et al. (2011). A close examination reveals that the broadening associated with these transitions increases while their peaks shift to higher energies as the concentration of Gd (NGd) increases. This implies an enhancement in the density of the three defect types with the Gd concentration.
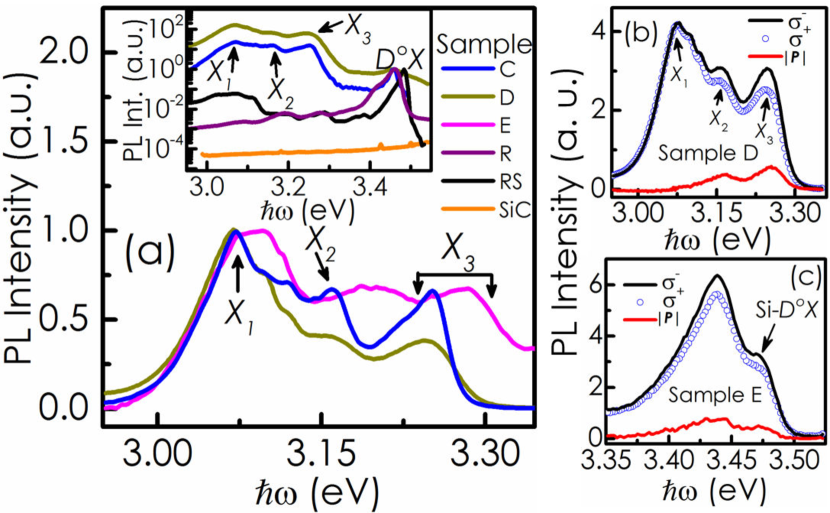
As shown in Figure 2(b), the degree of polarization is negative not only for the transitions [see Figure 2(c)] but also for all the -features. This has indeed been found for all Gd doped samples investigated here. Note that the magnitude of PL polarization for peak is much weaker than those for and peaks[see Figure 2(b)].
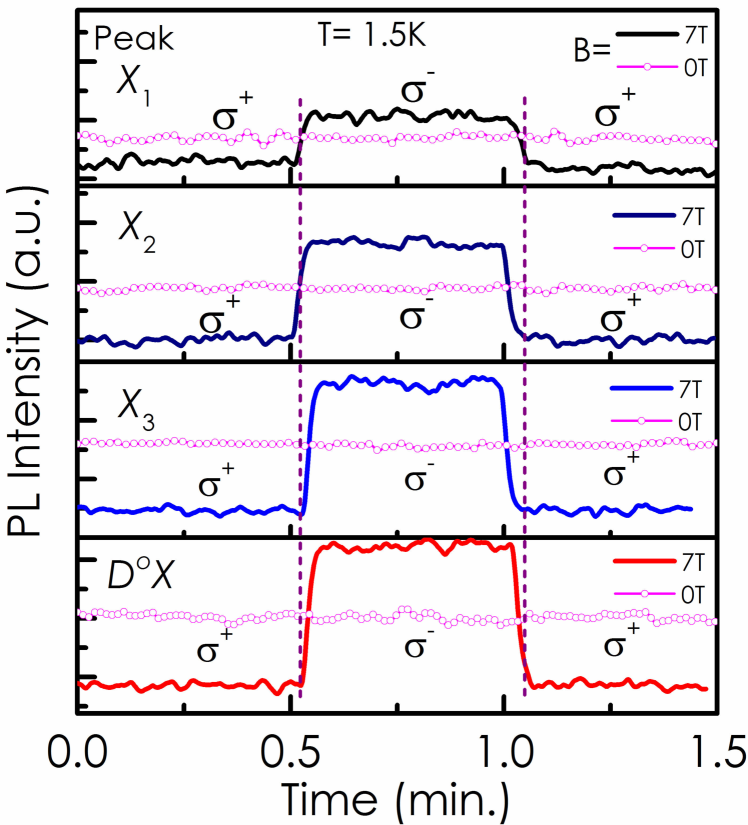
Fig. 3 compares the time dependent PL intensities recorded at -features for sample E and at peak for sample RS under zero and 7 T magnetic fields as the polarization selection is switched between and states at two time points. For all cases, the change in intensity due to the switching is evident only at non-zero fields.
Since the -factor for the conduction band Rodina and Meyer (2001) is comparable to that of ’A’-valence band holes Rodina et al. (2001) in GaN, the Zeeman splitting under a magnetic field along the c-axis is expected to be almost the same for the two bands. Note that a neutral donor bound exciton (NDBX) is composed of two electrons occupying and conduction band like J-states and a hole occupying either or ’A’-band like J-states. Photons collected along c-direction can either have or polarizations as shown in Fig. 1(b). In this geometry, the intensity of PL for a NDBX transition with polarization should be more as compared to that of as is energetically lower than state for the holes. is thus negative for a NDBX transition. Observation of negative for all the -features implies that these features are NDBX in nature as well.
At the steady state condition, as shown in the supplementary materialsup , the polarization associated with -th type of NDBX can be obtained asBacher et al. (2001) , where and the rate of recombination and spin flip events, respectively, while the energy splitting of the two hole spin states associated with i-th type of NDBX.
It can be shown that in this material, the term , in the expression of , tends to zero at 1.5 K, for 1 T. Polarization can thus be written as = for 1 T, meaning the ratio = 1/ -1 can be obtained for Si-, and all the -features, separately. Note that is expected to depend upon the magnetic fieldBeschoten et al. (2001). However, should be -independent. If the i-th type of -defects are ferromagnetically coupled, Zeeman splitting of the valence band like state of the exciton can be given by = + , where is the magnetization and is the magnetic coupling coefficient. This means that each of the defects experiences an overall magnetic field of = + . Saturation of magnetization leads to the saturation of the molecular field at = , where the coupling constant for the defects. If -feature is stemming from a region of ferromagnetically coupled i-th defects, where prevails over , is expected to show much weaker -dependence beyond the saturation field. Therefore, the ratio as a function of can carry the information about the involvement of individual defect types in ferromagnetic coupling.
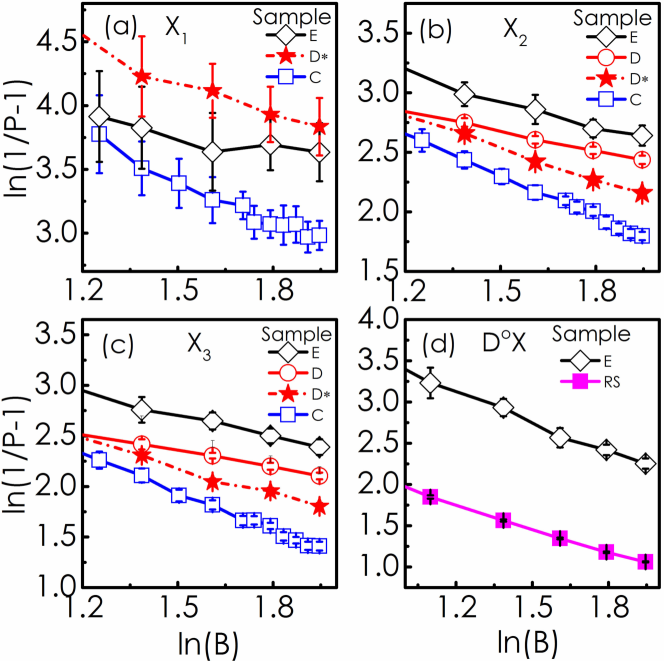
In Fig. 4, ln is plotted as a function of for [Panel (a)], [Panel (b)], [Panel (c)] and [Panel (d)] excitonic peaks in these samples. Evidently, in all cases, the data show a linear variation at high fields, which suggests that for all these NDBX. It is interesting to note that for all the -features, the slope substantially decreases in samples with NGd 1017 cm-3. Moreover, in sample D, the slope is increased for all the -features upon annealing. Note that the saturation magnetization of the sample decreases by about 50 after annealing (see Tab. 1)Mishra et al. (2011). On the other hand, the slope for the exciton in the Si doped reference sample RS is very much the same as that of the sample E, which is co-doped with both Si and Gd. These results thus suggest that the defects associated with -features in Gd doped GaN samples must be experiencing an overwhelmingly large field, meaning these defects are ferromagnetically coupled. Interestingly, for the co-doped sample, excitons associated with Si shallow donors do not experience any field, which suggests that they are not involved in the ferromagnetic coupling. Role of the internal field in governing the slope of these plots becomes more explicit from the fact that upon annealing, (and hence ) decreases and at the same time the slope increases in sample D.
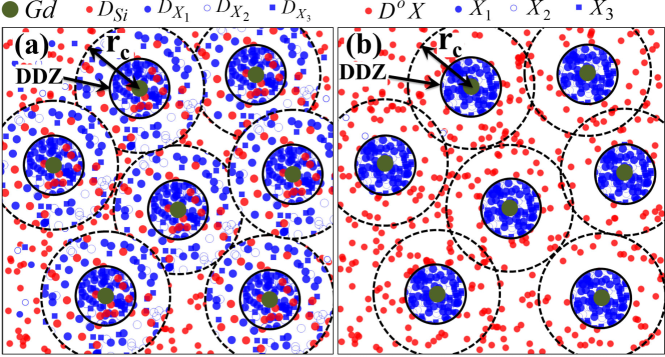
Note that these defects are likely to be generated surrounding each Gd ion, whereas Si shallow donors are randomly distributed over the entire lattice as shown schematically in Fig. 5(a). Close proximity of the defects in the regions surrounding the Gd sites leads to defect-defect ferromagnetic coupling Mishra et al. (2011). This results in the formation of ferromagnetic domains surrounding every Gd site. Beyond a percolation threshold, a long range ferromagnetic order sets in. In this framework, the saturation magnetization can be expressed as Ms = NGd + No[1-(-NGd)], where and are the bare magnetic moments per Gd ion and defect, respectively, the defect density within the cluster and =4/3 the volume of each cluster. In one of our earlier works, we have estimated No = 4.68 1019 cm-3 and = 22 nm by fitting the experimental data from Ref.1 with the above expressionMishra et al. (2011). If an average magnetic moment 3 (predicted for N-interstitialsMitra and Lambrecht (2009)) is attributed per defect site, No comes out to be 1.56 1019 cm-3. It is noteworthy that a same order of magnitude of defect density has been estimated by Roever et al. in their MBE grown Gd:GaN samplesRoever et al. (2011). However, the actual distribution of No() may not be uniform inside the defect sphere. Rather a reduction of No() from the center to the surface is more realistic a scenario. Note that in the co-doped sample (sample E), NSi is comparable with No. If radial variation of No is taken into account, one can find a defect dominated zone (DDZ) around every Gd site, where No NSi as shown schematically in the figure. -excitons are thus expected to be mostly present in DDZs, whereas Si- signal is arising from the regions outside these zones as depicted in Fig. 5(b). Because of their non-involvement in ferromagnetic coupling, Si-donors do not experience any strong molecular field, even though they are located in the regions where the back ground -defects are ferromagnetically coupled. This can explain why ln shows almost a independent behavior for all the -features for this sample , while it decreases faster with increasing for the Si- feature [see Fig. 4]. It should be mentioned that even though the saturation magnetizations are comparable for sample D and C, variation of ln with is much faster in sample C than in sample D. The reason might be the strength of the molecular field , where could depend upon the overlap of the defect clusters. Since in sample D, NGd is more than that in sample C, the overlap and hence is expected to be higher. We believe that prevails over in sample D, while in sample C, the field .
Observation of Fig. 4 suggests that the defects associated with all the X-features have neutral donor like states. Among all the defects, which are theoretically predicted to have magnetic moment, Oi, VGa and VN-VGa complexes do not contribute any donor like state at a position matching with those of , and Diallo and Demchenko (2016); Wright (2005), meaning that the , and defects are unlikely to be either of the three. In fact, Roever et al. using positron annihilation spectroscopy have shown that there is no direct correlation between Ga-vacancy and ferromagnetism observed in this material Roever et al. (2011). Nitrogen split interstitials, whose formation energy is one of the lowest among all point defects and their complexes, can have a 0/-1 state at about 0.48 eV below the conduction band minimum Diallo and Demchenko (2016). This position matches quite well with that of X1 feature. Moreover, each Ni is expected to contribute 3 of magnetic moment Mitra and Lambrecht (2009). Our finding, therefore, indicates that defects are N-interstitials. Positions of and do not match with those of any known point defect contributing neutral donor like states. It is noteworthy that upon annealing, PL intensity of -feature reduces quite significantly as compared to those of and Mishra et al. (2011); Mishra and Dhar (2016) implying that and defects have better thermal stability than defects. It is plausible that and defects are also Nis that make complexes with certain other point defects/impurities, which has better thermal stability than isolated Ni.
In conclusion, incorporation of Gd in GaN produce three types of donor like defects, which result in three neutral donor bound excitonic (NBDX) features appearing at about 3.05, 3.15 and 3.25 eV in the low temperature PL spectra. It has been shown that the dependence of spin-flip scattering rate on the magnetic field () for these NDBX features carry the information about the involvement of the associated defects in magnetic coupling. Our study shows that all the three signals must be stemming from those defects, which are ferromagnetically coupled with each other.
Acknowledgements
The authors acknowledge the financial support of this work by the Department of Science and Technology of the Government of India under the Project Code SR/S2/CMP-71/2012. We also would like to thank Paul-Drude-Institute, Berlin, Germany for the samples and Prof. S. Ghosh of TIFR, Mumbai for help in certain characterizations.
References
- Dhar et al. (2005a) S. Dhar, O. Brandt, M. Ramsteiner, V. F. Sapega, and K. H. Ploog, Phys. Rev. Lett. 94, 037205 (2005a).
- Dhar et al. (2005b) S. Dhar, L. Pérez, O. Brandt, A. Trampert, K. H. Ploog, J. Keller, and B. Beschoten, Phys. Rev. B 72, 245203 (2005b).
- Ney et al. (2010) A. Ney, T. Kammermeier, K. Ollefs, V. Ney, S. Ye, S. Dhar, K. Ploog, M. Röver, J. Malindretos, A. Rizzi, F. Wilhelm, and A. Rogalev, Journal of Magnetism and Magnetic Materials 322, 1162 (2010), proceedings of the Joint European Magnetic Symposia.
- Hite et al. (2006a) J. K. Hite, R. M. Frazier, R. Davies, G. T. Thaler, C. R. Abernathy, S. J. Pearton, and J. M. Zavada, Applied Physics Letters 89, 092119 (2006a).
- Bedoya-Pinto et al. (2009) A. Bedoya-Pinto, J. Malindretos, M. Roever, D. D. Mai, and A. Rizzi, Phys. Rev. B 80, 195208 (2009).
- Asahi et al. (2004) H. Asahi, Y. K. Zhou, M. Hashimoto, M. S. Kim, X. J. Li, S. Emura, and S. Hasegawa, Journal of Physics: Condensed Matter 16, S5555 (2004).
- Hite et al. (2006b) J. Hite, G. T. Thaler, R. Khanna, C. R. Abernathy, S. J. Pearton, J. H. Park, A. J. Steckl, and J. M. Zavada, Applied Physics Letters 89, 132119 (2006b).
- Sun et al. (2011) L. Sun, C. Liu, J. Li, J. Wang, F. Yan, Y. Zeng, and J. Li, Materials Letters 65, 667 (2011).
- Dhar et al. (2006) S. Dhar, T. Kammermeier, A. Ney, L. Pérez, K. H. Ploog, A. Melnikov, and A. D. Wieck, Applied Physics Letters 89, 062503 (2006).
- Khaderbad et al. (2007) M. A. Khaderbad, S. Dhar, L. Pérez, K. H. Ploog, A. Melnikov, and A. D. Wieck, Applied Physics Letters 91, 072514 (2007).
- Wang et al. (2017) S. Wang, X. Xie, H. Liu, Q. Hao, Y. Li, L. Liang, and C. Liu, Journal of Alloys and Compounds 712, 482 (2017).
- Mishra et al. (2010) J. Mishra, S. Dhar, and O. Brandt, Solid State Communications 150, 2370 (2010).
- Mishra et al. (2011) J. K. Mishra, B. P. Singh, and S. Dhar, Applied Physics Letters 99, 072119 (2011).
- Mishra and Dhar (2016) J. Mishra and S. Dhar, Solid State Communications 226, 25 (2016).
- Gohda and Oshiyama (2008) Y. Gohda and A. Oshiyama, Phys. Rev. B 78, 161201 (2008).
- Dev et al. (2008) P. Dev, Y. Xue, and P. Zhang, Phys. Rev. Lett. 100, 117204 (2008).
- Liu et al. (2008) L. Liu, P. Y. Yu, Z. Ma, and S. S. Mao, Phys. Rev. Lett. 100, 127203 (2008).
- Thiess et al. (2015) A. Thiess, S. Blügel, P. H. Dederichs, R. Zeller, and W. R. L. Lambrecht, Phys. Rev. B 92, 104418 (2015).
- Mitra and Lambrecht (2009) C. Mitra and W. R. L. Lambrecht, Phys. Rev. B 80, 081202 (2009).
- Zhang et al. (2014) Z. Zhang, U. Schwingenschlögl, and I. S. Roqan, Journal of Applied Physics 116, 183905 (2014).
- Gohda and Oshiyama (2010) Y. Gohda and A. Oshiyama, Journal of the Physical Society of Japan 79, 083705 (2010).
- Sun et al. (2012) S. Sun, P. Wu, and P. Xing, Applied Physics Letters 101, 132417 (2012), and references therein.
- Rodina and Meyer (2001) A. V. Rodina and B. K. Meyer, Phys. Rev. B 64, 245209 (2001).
- Rodina et al. (2001) A. V. Rodina, M. Dietrich, A. Göldner, L. Eckey, A. Hoffmann, A. L. Efros, M. Rosen, and B. K. Meyer, Phys. Rev. B 64, 115204 (2001).
- (25) See supplementary materials for the derivation of polarization associated with luminescence arising from neutral donor bound excitons.
- Bacher et al. (2001) G. Bacher et al., Advances in Solid State Physics, Vol. 41 (Springer, Springer-Verlag Berlin Heidelberg, 2001) pp 51-62.
- Beschoten et al. (2001) B. Beschoten, E. Johnston-Halperin, D. K. Young, M. Poggio, J. E. Grimaldi, S. Keller, S. P. DenBaars, U. K. Mishra, E. L. Hu, and D. D. Awschalom, Phys. Rev. B 63, 121202 (2001).
- Roever et al. (2011) M. Roever, J. Malindretos, A. Bedoya-Pinto, A. Rizzi, C. Rauch, and F. Tuomisto, Phys. Rev. B 84, 081201 (2011).
- Diallo and Demchenko (2016) I. C. Diallo and D. O. Demchenko, Phys. Rev. Applied 6, 064002 (2016).
- Wright (2005) A. F. Wright, Journal of Applied Physics 98, 103531 (2005).