Bulk properties of van-der-Waals hard ferromagnet VI3
Abstract
We present comprehensive measurements of the structural, magnetic and electronic properties of layered van-der-Waals ferromagnet VI3 down to low temperatures. Despite belonging to a well-studied family of transition metal trihalides, this material has received very little attention. We outline, from high-resolution powder x-ray diffraction measurements, a corrected room-temperature crystal structure to that previously proposed and uncover a structural transition at 79 K, also seen in the heat capacity. Magnetization measurements confirm VI3 to be a hard ferromagnet (9.1 kOe coercive field at 2 K) with a high degree of anisotropy, and the pressure dependence of the magnetic properties provide evidence for the two-dimensional nature of the magnetic order. Optical and electrical transport measurements show this material to be an insulator with an optical band gap of 0.67 eV - the previous theoretical predictions of -band metallicity then lead us to believe VI3 to be a correlated Mott insulator. Our latest band structure calculations support this picture and show good agreement with the experimental data. We suggest VI3 to host great potential in the thriving field of low-dimensional magnetism and functional materials, together with opportunities to study and make use of low-dimensional Mott physics.
Two-dimensional van-der-Waals (vdW) magnetic materials have in recent years become the subject of a wide range of intense research (Ajayan et al., 2016). While a large portion of research into two-dimensional materials has centered on graphene, the addition of magnetism into such a system leads to many interesting fundamental questions and opportunities for device applications (Park, 2016; Kuo et al., 2016; Zhou et al., 2016; Samarth, 2017; Burch et al., 2018). Particularly for future spintronics applications, semiconducting or metallic materials which exhibit ferromagnetism down to monolayer thickness are an essential ingredient. This has led to a large volume of recent publications on two-dimensional honeycomb ferromagnet CrI3 (McGuire et al., 2015; Zhang et al., 2015; Wang et al., 2016; Huang et al., 2017; Lado and Fernández-Rossier, 2017; Klein et al., 2018). CrI3 and VI3 belong to a wider family of MX3 transition metal trihalides, with X = Cl, Br, I, which were synthesized in the 60s (Juza et al., 1969; Dillon and Olson, 1965) but have since seen little interest until recently (McGuire, 2017).
VI3 is an insulating two-dimensional ferromagnet with a Curie Temperature, Tc, given as 55 K and reported to have the layered crystal structure of BiI3 with space group R-3 (Trotter and Zobel, 1966; Handy, 1950; Wilson et al., 1987). As shown in a recent review (McGuire, 2017), there is very little available information on VI3 other than the structure and the expected from the configuration of the vanadium sites. Calculations using density functional theory, which additionally yield the exchange constants, have suggested VI3 to not only remain ferromagnetic down to a single crystalline layer, but to also exhibit Dirac half-metallicity, of interest for spintronic applications (He et al., 2016).
In these vdW materials, hydrostatic pressure forms an extremely powerful tuning parameter. Given the weak mechanical forces between the crystal planes, the application of pressure will dominantly have the effect of pressing the ab planes together, and gradually and controllably pushing the system from two- to three-dimensionality. Additionally, first-principles calculations have suggested in-plane strain and compression to stabilize both antiferromagnetic phases and spin reorientation in CrI3 (Zheng et al., 2017) and both VBr3 and VCl3 are antiferromagnetic (Wilson et al., 1987).
Finding the correct crystal structure is crucial for accurate ab-initio calculations of a new material’s behavior and for general insight into its properties. The structure of VI3 has not been previously outlined beyond its basic crystallographic family (Trotter and Zobel, 1966; Berry et al., 1969; Juza et al., 1969; Wilson et al., 1987). This earlier work assigned VI3 as belonging to the BiI3 type structure, but no detailed crystallographic results are available or any description of temperature dependence. Here we present the crystal structure of VI3 from refined powder x-ray diffraction data and find a transition to an alternative structure at low temperature.
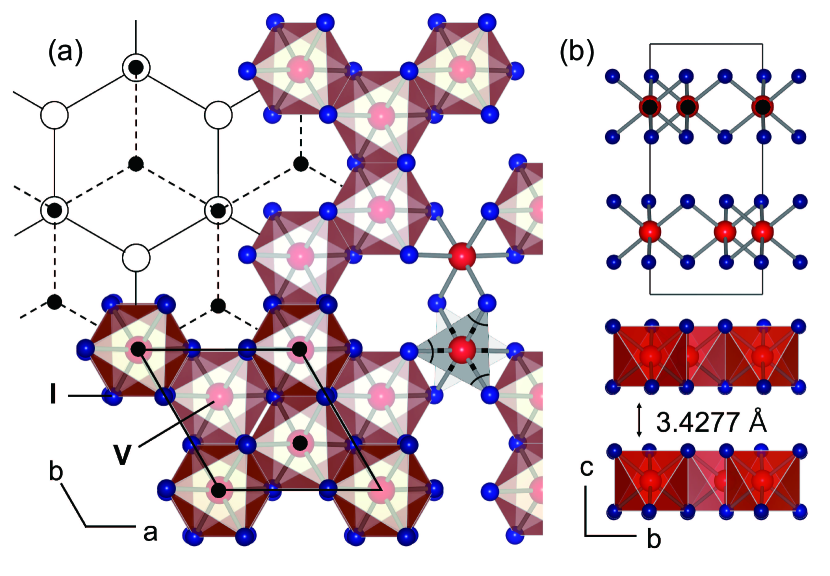
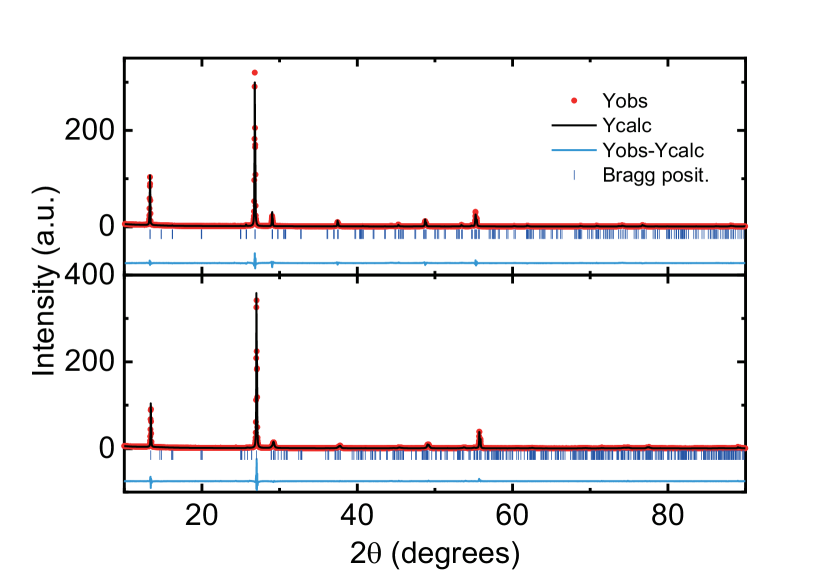
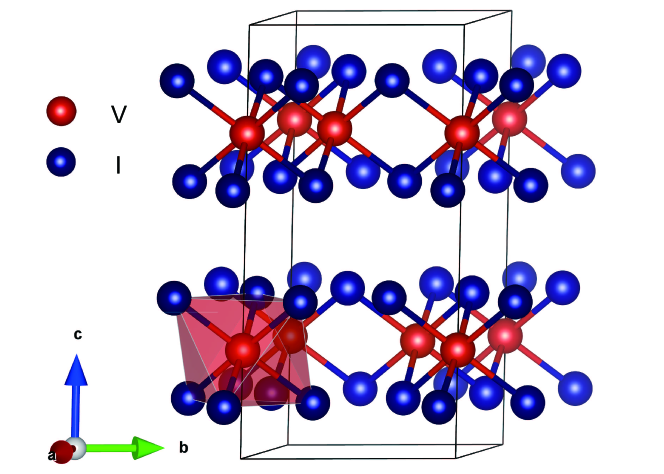
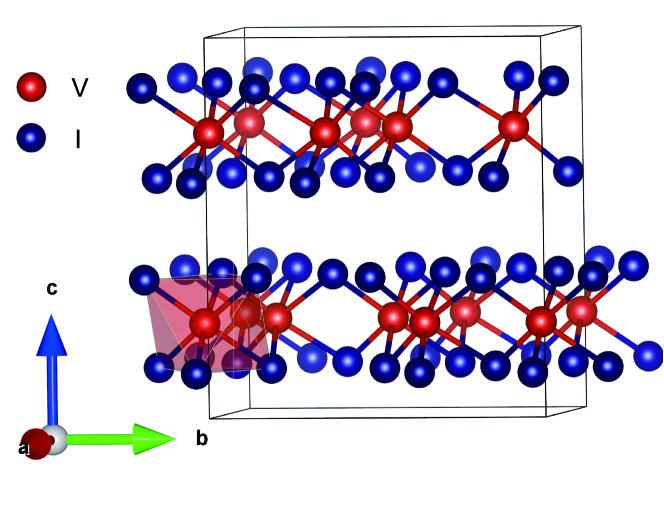
The results show good agreement between the high-resolution x-ray diffraction (HR-XRD) measurement and refined data (Figs 6-9 and Tab. 1. The FULLPROF, GSAS-II and VESTA software suites were employed (Rodríguez-Carvajal, 1993; Toby, 2013; Momma, 2011)). Contrary to the previous reports, we find the room temperature structure to be fitted better with the space group of than . Even though both structures show very similar simulation results, several peaks were missing from the simulations, and peak shapes and ratios are better fit by the (Fig 7). The structure at room temperature is shown in Fig. 1. The unit cell has an ideal honeycomb bilayer of V formed of [VI6]3- octahedra, separated by a clear van-der-Waals gap. All the shortest V-V and V-I bonds have the same lengths.
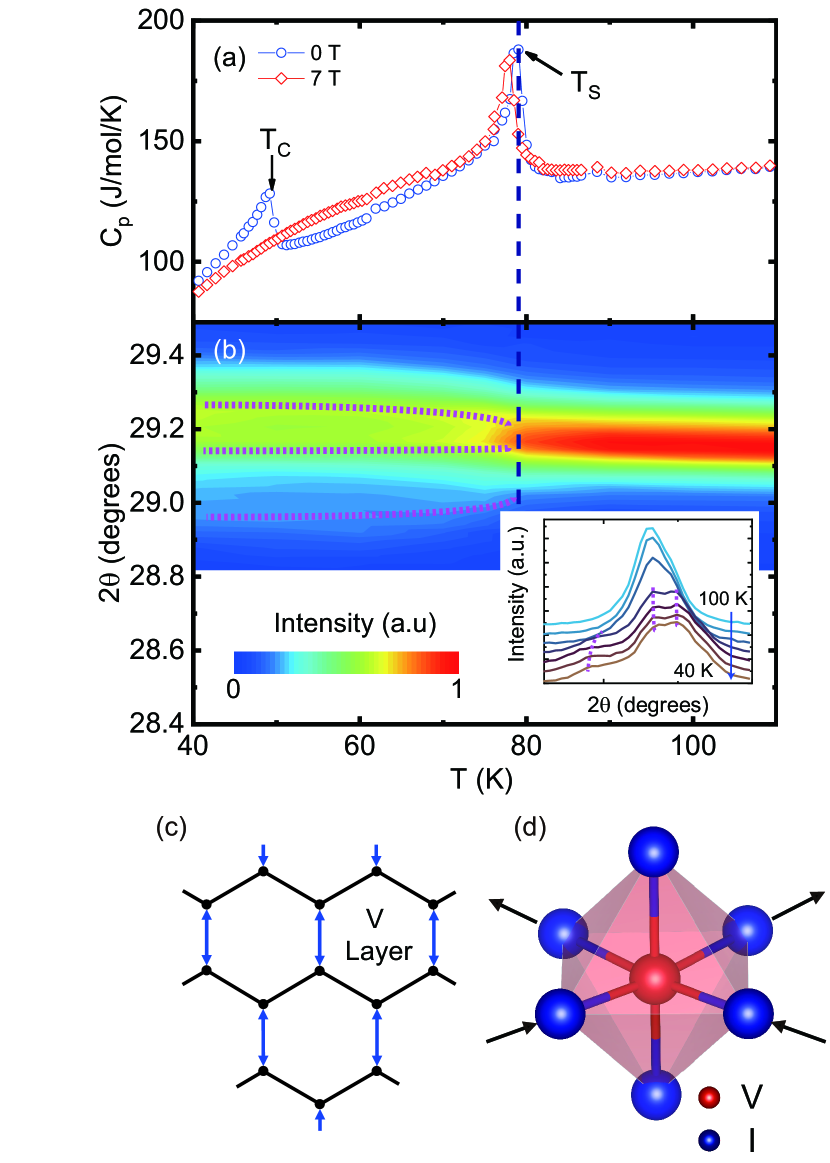
Following the powder diffraction patterns down to low temperature additionally reveals a phase transition to a new low-temperature structure below Ts = 79.0(5) K. Fig. 2 (a) and (b) show heat capacity and details of the x-ray diffraction patterns as a function of temperature. A clear peak at 79 K in the heat capacity and the peak splitting in the XRD patterns demonstrate the existence of a sharp structural phase transition at this temperature.
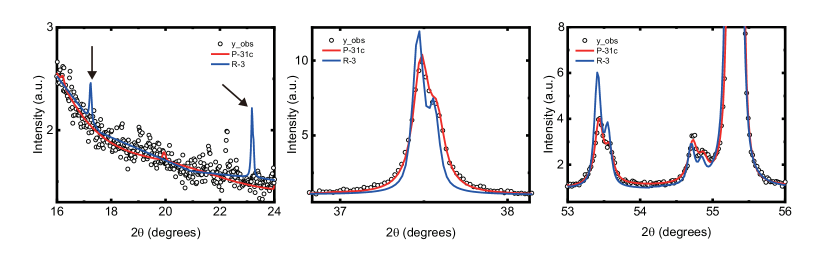
As one can see from the long debates about the low temperature structure of -TiCl3 (Natta et al., 1961), the overlap of many peaks via symmetry breaking at low temperature gives multiple potential solutions to the structure. Among the possible candidates, we obtained the best results for a structure, a sub-space group of the room temperature structure. Contrary to MoCl3 (Hillebrecht et al., 1997) and -TiCl3(McGuire, 2017) undergoing dimerization of the transition metal ions at low temperature, the V atoms here stretch in a single direction from their perfect honeycomb - anti-dimerization (see Fig. 2(c)). The short bonding length is 3.92(5) Å and the long 4.12(11) Å. Furthermore, accompanying the anti-dimerization of V honeycomb atoms, the VI6 octahedra experience an off-center distortion when the low-temperature structure is entered. Fig. 2(d) illustrates the structural deformation of the VI6 octahedra at low temperature. Plots of the refinement results and structural parameters at 40 and 300 K are given in the Figs 6 and 7, Tab. 1.
The peak seen in the heat capacity at 50 K (Tc) we identify as the ferromagnetic transition from the broadening of peak width in an applied 7 T of magnetic field. All measurements were reproducible over multiple thermal cycles, which rules out the effect of sample degradation on the results. Like other transition-metal halides with vdW gaps such as CrI3 and -RuCl3, VI3 is easily exfoliated by the common Scotch tape method (Novoselov et al., 2004) (Fig 11), placing it as a valuable system for studying two-dimensional physics and applications.
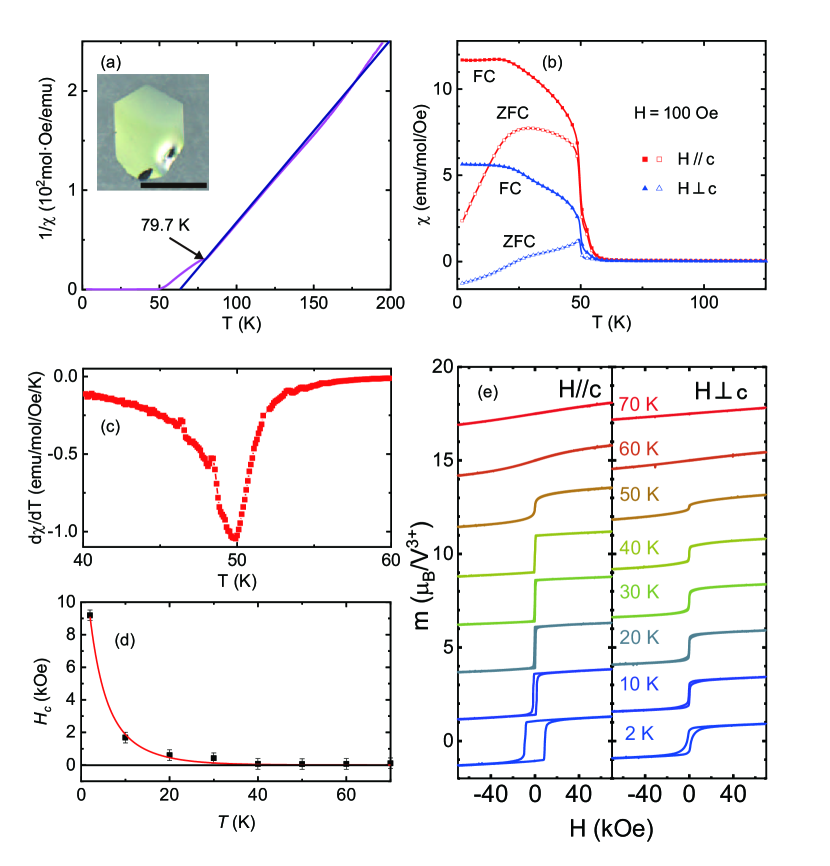
We next explore the magnetic properties of single crystal VI3. The results of measurements are shown in Fig. 3 and additional data given in the Fig 10. Measurements were carried out with the magnetic field both parallel and perpendicular to the crystallographic axis, which is easily identified as perpendicular to the crystal planes this two-dimensional material forms. Orientation-dependent magnetic susceptibility is shown in Fig. 3(a), measured during warming after cooling to 2 K with the measurement magnetic field of 100 Oe applied, i.e. field-cooled (FC). Similarly to the previous result of Wilson et al. (Wilson et al., 1987) we find VI3 to be ferromagnetic with Tc of 50.0(1) K, defined from the derivative of the susceptibility.
As shown in Fig. 3(a), there is a strong anisotropy in the susceptibility - magnetic field applied in-plane () leads to magnetization roughly half that found when it is applied out of plane (). We can conclude that VI3 has Ising-type spins with the easy axis along . A small kink in the magnetic susceptibility, as well as a change in slope, in the paramagnetic state at 79.3 K was observed, corresponding to the structural transition temperature Ts. A structural phase transition accompanies similar features in the susceptibility of CrI3 and -TiCl3 (Tsutsumi et al., 1990; McGuire et al., 2015). The kink was not seen when the field was applied in-plane, but was clearly present with the field along the easy axis, implying the coupling of the structural phase transition and the magnetism and a link to the magnetic anisotropy.
Zero-field-cooled data are presented in the Fig 10 - a linear Curie-Weiss fit to these data above Ts allows us to extract an effective moment . Wilson et.al. reported a value of , which agrees with our fit within error and our ab-initio calculations give a moment of . The extrapolated Curie Temperature from the fit is 64.5(5) K, which differs from the observed Tc as the structural transition at Ts alters the slope of the susceptibility and destabilizes magnetic order.
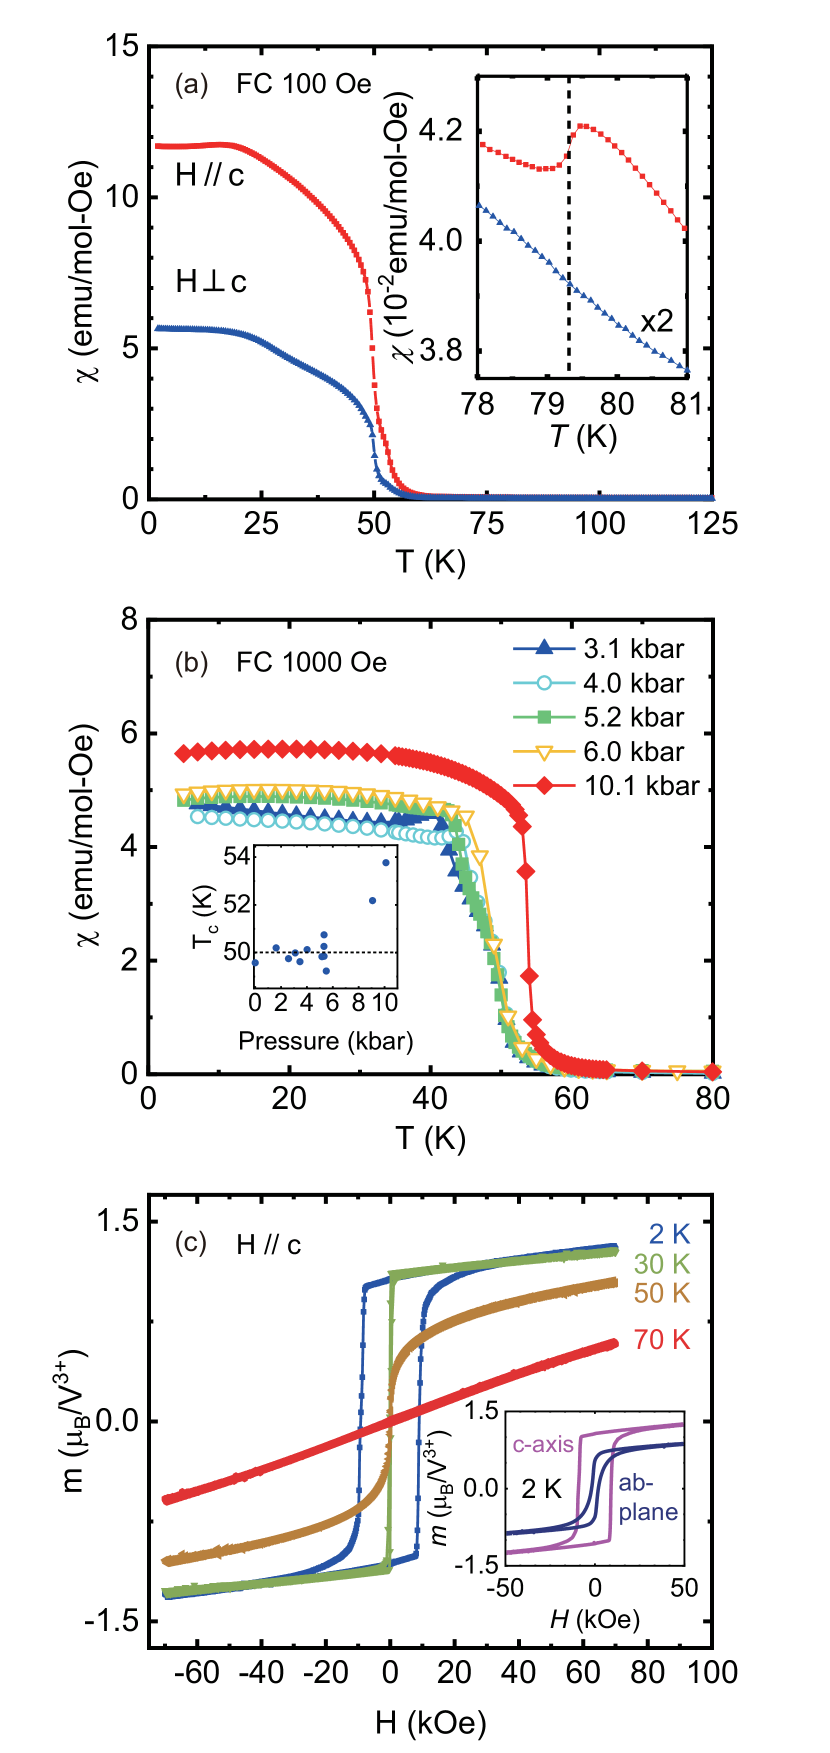
The effect of applied hydrostatic pressure on the FC susceptibility in a 1000 Oe field applied along is shown in Fig 3(b). Along with the evolution of several bumps in the data most likely due to domain dynamics, the key result shown in the inset is the behavior of Tc. The effect of pressure on a vdW material such as VI3 will be predominately to continuously decrease inter-layer spacing, increasing inter-planar exchange and tuning towards a three-dimensional system. At pressures up to around 7 kbar however, no change in Tc was observed, but at higher pressures it begins to rapidly increase. We interpret this as evidence of the true two-dimensional nature of the magnetic order in VI3. Bringing the planes closer together has zero effect on stabilizing the magnetic order to higher temperatures - inter-planar interactions are unaffected and hence are presumed to be negligible to begin with. Only above 8 kbar does changing inter-layer spacing lead to easier formation of magnetic order - at this point the dimensionality is starting to tune away from 2. The only prior pressure study, to our knowledge, on the MX3 materials to date is the work of Yoshida et.al. (Yoshida et al., 1997), which reports a continuous decrease in the value of Tc with increasing pressure - the opposite effect to our observations.
Characteristic ferromagnetic hysteresis loops of the magnetic moment with applied field along the axis are shown in Fig. 3(c) for several temperatures. As temperature is increased, the coercive field is exponentially decreased (Fig. 10) and above Tc the hysteresis loops close and the system reverts to paramagnetic linear behavior. At the maximum applied field of 70 kOe (7 T) and at 2 K the magnetic moment was found to be 1.3(1) , which is smaller than the expected saturated moment of a V3+ ion, . The moment is not fully saturated at 70 kOe, but clearly cannot reach this predicted value. The reason for this disagreement is not currently clear.
The orientation dependence of the magnetization is illustrated in the inset of Fig. 3(c). The field-in-plane curves show coercivity of 1.8 kOe, smaller than that of out-of-plane (9.1 kOe), which again suggests the easy axis to lie along the -axis, from the Stoner-Wohlfarth model (Stoner and Wohlfarth, 1948). This simple model, it should be noted, while offering valuable insight into the overall behavior strictly applies only to a single-domain crystal - more complex treatments (Ryabchenko et al., 2014) may prove more suitable for these data going forwards. One thing to note here is its huge coercive field at 2 K - 9.1 kOe, in contrast to other vdW ferromagnets such as CrBr3(Richter et al., 2018), CrI3(McGuire et al., 2015), Fe3GeTe2(León-Brito et al., 2016) and Cr2Ge2Te6(Gong et al., 2017). To our knowledge, all other such ferromagnets are soft, contrary to this hard vdW ferromagnet VI3. Understanding the physical origin of the hard-ferromagnetic behavior and the comparison of otherwise similar systems VI3 and CrI3 forms a rich opportunity for low-dimensional magnetism going forwards and may help in designing future magnetic materials for specific applications. Interestingly, Chang et al.(Chang et al., 2015) reported in their comparison of V- and Cr-doped Sb2Te3 that the V-doped samples show much higher coercive fields than the Cr-doped systems. The Stoner-Wohlfarth model describes that a small saturated moment, , and/or a large total magnetic anisotropy lead to larger coercive fields. The smaller saturated moment in V3+ driven by the smaller number of d-orbital spin and the larger anisotropy coming from the partially filled -band of the V3+ ion, unlike the fully filled Cr3+ orbitals, could contribute the large anisotropy, and in turn coercive field.
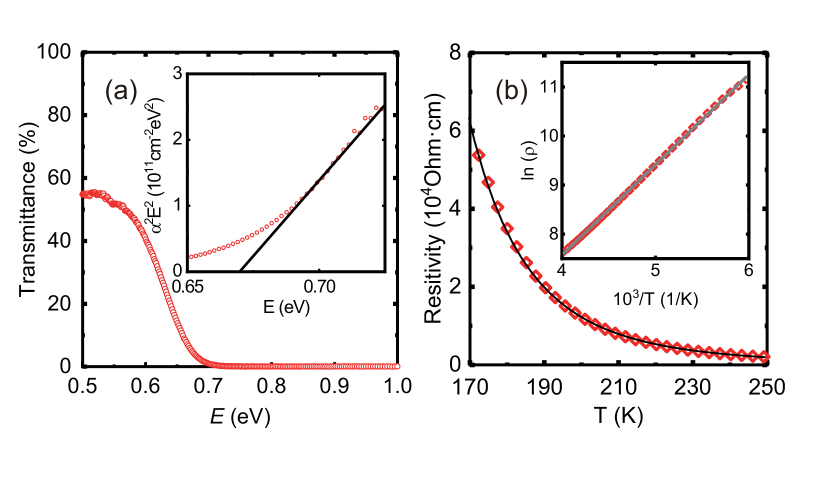
To investigate the electronic properties, we measured the bandgap by optical transmittance and the temperature dependence of the bulk resistivity. Fig. 4(a) shows the transmittance at room temperature as a function of incident photon energy, from which we can extract the optical bandgap. The dependence of the absorption coefficient on incident photon energy is given by the expression where is the incident photon energy, is the optical band gap and for a direct allowed transition the exponent can be taken as . For , the material cannot absorb photons so the bandgap is found from extrapolating vs. to zero (inset). The obtained direct optical bandgap value for VI3 was 0.67(1) eV.
The temperature dependence of the in-plane resistivity, , of a bulk single crystal of VI3 is plotted in Fig. 4(b) from room temperature down to the point where the resistance becomes too high to measure on our setup. The increasing resistivity as temperature was lowered shows clear insulating behavior. The resistivity can be fitted well by an Arrhenius type exponential function: , where is the activation energy and Boltzmann’s constant. The inset illustrates the standard vs. plot - the straight line proves good agreement to Arrhenius-type thermally activated transport. The extracted activation energy was 0.16 eV, giving an electrical bandgap of 0.32 eV - significantly smaller than the measured optical bandgap. The reason for this (common) mismatch is not immediately clear in this material; a potential explanation is the presence of some form of impurity band within the gap or denaturing of the surface contact - iodine deficiency or the effect of exposure to oxygen or moisture may be possible candidates.
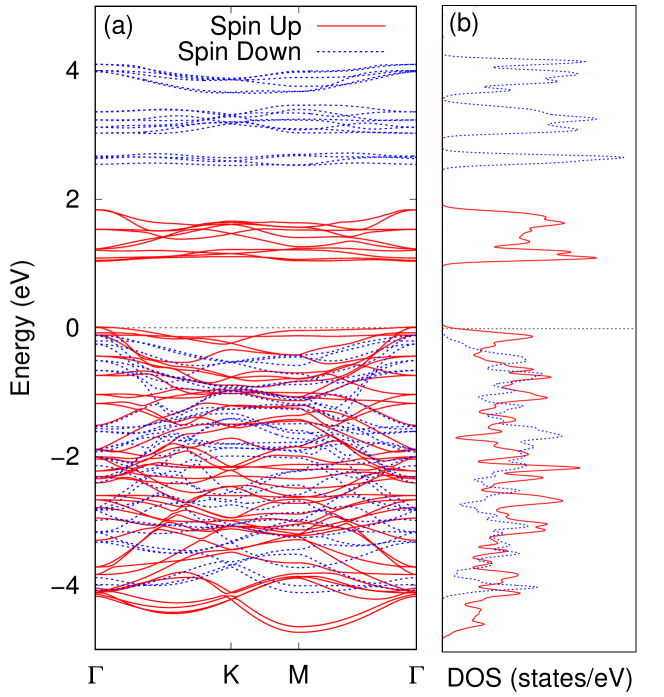
Sister compound CrI3 is a Mott insulator (McGuire et al., 2015) , with all the rich electronic correlation that implies. Previous results from ab-initio calculations (He et al., 2016) predict VI3 to be metallic, rather than the observed insulating behavior - giving a hint that VI3 is also a Mott-insulating system. Our band structure calculations (Fig 5) implemeted in the Quantum ESPRESSO package (Gianozzi, 2009; Dudarev, 1998; Hamann, 2013; Schlipf, 2015; Perdew, 1966; Monkhorst, 1976), which use our updated crystal structure parameters and include the effects of a Hubbard , suggest a ground state that is indeed Mott insulating, rather than metallic, with a ~1 eV band gap in good agreement with observed data. Reducing the on-site Coulomb interaction leads to half-metallicity in our calculations.
We have presented an overview of the basic properties of near-unexplored van-der-Waals ferromagnet VI3. We suggest an updated crystal structure - crucial for accurate ab-initio calculations - and a transition into a distorted alternative structure at low temperature. A key result is a coercive field far higher than in any other vdW ferromagnet system, setting VI3 apart as a hard vdW ferromagnet and raising several questions worthy of further exploration. Optical and electrical transport measurements show this material to be an insulator with an optical band gap of 0.67 eV. In contrast to previously published studies, our band structure calculations yield an insulating ferromagnetic ground state when an on-site Coulomb interaction is included, leading us to believe VI3 to be a correlated Mott insulator. This evidence of Mott physics evokes potential for bandgap tuning and the emergence of exotic sates due to strong electron correlations in this 2D ferromagnetic system.
Acknowledgements.
The authors would like to thank Sanghyun Lee, S.E. Dutton, Inho Hwang and Y. Noda for their generous help and discussions. We would also like to acknowledge support from Jesus College of the University of Cambridge, IHT KAZATOMPROM and the CHT Uzbekistan programme. The work was carried out with financial support from the Ministry of Education and Science of the Russian Federation in the framework of Increase Competitiveness Program of NUST MISiS (№ К2-2017-024). The work of D.Kh. was supported by the German research project SFB 1238 and by Köln University via the German Excellence Initiative. This work was supported by the van der Waals Materials Research Center NRF-2017R1A5A1014862 and the Institute for Basic Science of the Republic of Korea (Grant No. IBS-R009-G1).References
- Ajayan et al. (2016) \BibitemOpen\bibfieldauthor P. Ajayan, P. Kim, and K. Banerjee, \bibfieldjournal Physics Today 69, 38 (2016)\BibitemShutNoStop
- Park (2016) \BibitemOpen\bibfieldauthor J.-G. Park, \bibfieldjournal J. Phys.: Condens. Matter 28, 301001 (2016)\BibitemShutNoStop
- Kuo et al. (2016) \BibitemOpen\bibfieldauthor C. Kuo, M. Neumann, K. Balamurugan, H. Park, S. Kang, H. Shiu, J. Kang, B. Hong, M. Han, T. Noh, and J.-G. Park, \bibfieldjournal Scientific Reports 6, 20904 (2016)\BibitemShutNoStop
- Zhou et al. (2016) \BibitemOpen\bibfieldauthor Y. Zhou, H. Lu, X. Zu, and F. Gao, \bibfieldjournal Scientific Reports 6 (2016), 10.1038/srep19407\BibitemShutNoStop
- Samarth (2017) \BibitemOpen\bibfieldauthor N. Samarth, \bibfieldjournal Nature 546, 216 (2017)\BibitemShutNoStop
- Burch et al. (2018) \BibitemOpen\bibfieldauthor K. Burch, D. Mandrus, and J.-G. Park, \bibfieldjournal Nature 563, 47 (2018)\BibitemShutNoStop
- McGuire et al. (2015) \BibitemOpen\bibfieldauthor M. McGuire, H. Dixit, V. Cooper, and B. Sales, \bibfieldjournal Chemistry of Materials 27, 612 (2015)\BibitemShutNoStop
- Zhang et al. (2015) \BibitemOpen\bibfieldauthor W.-B. Zhang, Q. Qu, P. Zhu, and C.-H. Lam, \bibfieldjournal Journal of Materials Chemistry C 3, 12457 (2015)\BibitemShutNoStop
- Wang et al. (2016) \BibitemOpen\bibfieldauthor H. Wang, F. Fan, S. Zhu, and H. Wu, \bibfieldjournal EPL (Europhysics Letters) 114, 47001 (2016)\BibitemShutNoStop
- Huang et al. (2017) \BibitemOpen\bibfieldauthor B. Huang, G. Clark, E. Navarro-Moratalla, D. Klein, R. Cheng, K. Seyler, D. Zhong, E. Schmidgall, M. A. McGuire, D. H. Cobden, W. Yao, D. Xiao, P. Jarillo-Herrero, and X. Xu, \bibfieldjournal Nature 546, 270 (2017)\BibitemShutNoStop
- Lado and Fernández-Rossier (2017) \BibitemOpen\bibfieldauthor J. L. Lado and J. Fernández-Rossier, \bibfieldjournal 2D Materials 4, 035002 (2017)\BibitemShutNoStop
- Klein et al. (2018) \BibitemOpen\bibfieldauthor D. R. Klein, D. MacNeill, J. L. Lado, D. Soriano, E. Navarro-Moratalla, K. Watanabe, T. Taniguchi, S. Manni, P. Canfield, J. Fernández-Rossier, and P. Jarillo-Herrero, \bibfieldjournal Science 360, 1218 (2018)\BibitemShutNoStop
- Juza et al. (1969) \BibitemOpen\bibfieldauthor D. Juza, D. Giegling, and H. Schäfer, \bibfieldjournal Zeitschrift für anorganische und allgemeine Chemie 366, 121 (1969)\BibitemShutNoStop
- Dillon and Olson (1965) \BibitemOpen\bibfieldauthor J. Dillon and C. Olson, \bibfieldjournal Journal of Applied Physics 36, 1259 (1965)\BibitemShutNoStop
- McGuire (2017) \BibitemOpen\bibfieldauthor M. McGuire, \bibfieldjournal Crystals 7, 121 (2017)\BibitemShutNoStop
- Trotter and Zobel (1966) \BibitemOpen\bibfieldauthor J. Trotter and T. Zobel, \bibfieldjournal Zeitschrift für Kristallographie - Crystalline Materials 123 (1966), 10.1524/zkri.1966.123.16.67\BibitemShutNoStop
- Handy (1950) \BibitemOpen\bibfieldauthor L.L. Handy and N.W. Gregory \bibfieldjournal Journal of the American Chemical Society 72, 5049-5051 (1950) \BibitemShutNoStop
- Wilson et al. (1987) \BibitemOpen\bibfieldauthor J. Wilson, C. Maule, P. Strange, and J. Tothill, \bibfieldjournal Journal of Physics C: Solid State Physics 20, 4159 (1987)\BibitemShutNoStop
- He et al. (2016) \BibitemOpen\bibfieldauthor J. He, S. Ma, P. Lyu, and P. Nachtigall, \bibfieldjournal Journal of Materials Chemistry C 4, 2518 (2016)\BibitemShutNoStop
- Zheng et al. (2017) \BibitemOpen\bibfieldauthor F. Zheng, J. Zhao, Z. Liu, M. Li, M. Zhou, S. Zhang, and P. Zhang, \bibfieldjournal ArXiv e-prints 1709.05472 (2017), \BibitemShutNoStop
- Berry et al. (1969) \BibitemOpen\bibfieldauthor K. Berry, R. Smardzewski, and R. McCarley, \bibfieldjournal Inorganic Chemistry 8, 1994 (1969)\BibitemShutNoStop
- Rodríguez-Carvajal (1993) \BibitemOpen\bibfieldauthor J. Rodríguez-Carvajal, \bibfieldjournal Physica B: Condensed Matter 192, 55-69 (1993) \BibitemShutNoStop
- Toby (2013) \BibitemOpen\bibfieldauthor B.H. Toby and R.B. Von Dreele \bibfieldjournal Journal of Applied Crystallography 46, 544-549 (2013) \BibitemShutNoStop
- Momma (2011) \BibitemOpen\bibfieldauthor K. Momma and F. Izumi \bibfieldjournal Journal of Applied Crystallography 44, 1272-1276 (2011) \BibitemShutNoStop
- Natta et al. (1961) \BibitemOpen\bibfieldauthor G. Natta, P. Corradini, and G. Allegra, \bibfieldjournal Journal of Polymer Science 51, 399 (1961)\BibitemShutNoStop
- Hillebrecht et al. (1997) \BibitemOpen\bibfieldauthor H. Hillebrecht, P. Schmidt, H. Rotter, G. Thiele, P. Zönnchen, H. Bengel, H.-J. Cantow, S. Magonov, and M.-H. Whangbo, \bibfieldjournal Journal of Alloys and Compounds 246, 70 (1997)\BibitemShutNoStop
- Novoselov et al. (2004) \BibitemOpen\bibfieldauthor K. S. Novoselov, A. Geim, S. V. Morozov, D. Jiang, Y. Zhang, S. V. Dubonos, I. V. Grigrieva, and A. A. Firsov, \bibfieldjournal Science 306, 666 (2004)\BibitemShutNoStop
- Tsutsumi et al. (1990) \BibitemOpen\bibfieldauthor K. Tsutsumi, H. Okamoto, C. Hama, and Y. Ishihara, \bibfieldjournal Journal of Magnetism and Magnetic Materials 90-91, 181 (1990)\BibitemShutNoStop
- Yoshida et al. (1997) \BibitemOpen\bibfieldauthor H. Yoshida, J. Chiba, T. Kaneko, Y. Fujimori, and S. Abe, \bibfieldjournal Physica B: Condensed Matter 237-238, 525 (1997)\BibitemShutNoStop
- Stoner and Wohlfarth (1948) \BibitemOpen\bibfieldauthor E. Stoner and E. Wohlfarth, \bibfieldjournal Philosophical Transactions of the Royal Society A: Mathematical, Physical and Engineering Sciences 240, 599 (1948)\BibitemShutNoStop
- Richter et al. (2018) \BibitemOpen\bibfieldauthor N. Richter, D. Weber, F. Martin, N. Singh, U. Schwingenschlögl, B. V. Lotsch, and M. Kläui, \bibfieldjournal Physical Review Materials 2 (2018), 10.1103/physrevmaterials.2.024004\BibitemShutNoStop
- León-Brito et al. (2016) \BibitemOpen\bibfieldauthor N. León-Brito, E. D. Bauer, F. Ronning, J. D. Thompson, and R. Movshovich, \bibfieldjournal Journal of Applied Physics 120, 083903 (2016)\BibitemShutNoStop
- Gong et al. (2017) \BibitemOpen\bibfieldauthor C. Gong, L. Li, Z. Li, H. Ji, A. Stern, Y. Xia, T. Cao, W. Bao, C. Wang, Y. Wang, Z. Qiu, R. Cava, S. Louie, J. Xia, and X. Zhang, \bibfieldjournal Nature 546, 265 (2017)\BibitemShutNoStop
- Chang et al. (2015) \BibitemOpen\bibfieldauthor C.-Z. Chang, W. Zhao, D. Y. Kim, H. Zhang, B. A. Assaf, D. Heiman, S.-C. Zhang, C. Liu, M. H. W. Chan, and J. S. Moodera, \bibfieldjournal Nature Materials 14, 473 (2015)\BibitemShutNoStop
- Ryabchenko et al. (2014) \BibitemOpen\bibfieldauthor S.M. Ryabchenko, V.M. Kalita \bibfieldjournal Journal of Experimental and Theoretical Physics 118, 284-296 (2014)\BibitemShutNoStop
- Gianozzi (2009) \BibitemOpen\bibfieldauthor P. Giannozzi, S. Baroni, N. Bonini, M. Calandra, R. Car, C. Cavazzoni, D. Ceresoli, G.L. Chiarotti, M. Cococcioni, I. Dabo, A. Dal Corso, S. de Gironcoli, S. Fabris, G. Fratesi, R. Gebauer, U. Gerstmann, C. Gougoussis, A. Kokalj, M. Lazzeri, L. Martin-Samos, N. Marzari, F. Mauri, R. Mazzarello, S. Paolini, A. Pasquarello, L. Paulatto, C. Sbraccia, S. Scandolo, G. Sclauzero, A.P. Seitsonen, A. Smogunov, P. Umari and R.M. Wentzcovitch \bibfieldjournal J. Phys. Cond. Mat. 21, 395502 (2009) \BibitemShutNoStop
- Dudarev (1998) \BibitemOpen\bibfieldauthor S.L. Dudarev, G.A. Botton, S.Y. Savrasov, C.J. Humphreys and A.P. Sutton \bibfieldjournal Phys. Rev. B 57, 1505-1509 (1998) \BibitemShutNoStop
- Hamann (2013) \BibitemOpen\bibfieldauthor D.R. Hamann \bibfieldjournal Phys. Rev. B 88 (2013) \BibitemShutNoStop
- Schlipf (2015) \BibitemOpen\bibfieldauthor M. Schlipf and F. Gygi \bibfieldjournal Computer Physics Comms. 196, 1272-1276 (2015) \BibitemShutNoStop
- Perdew (1966) \BibitemOpen\bibfieldauthor J.P. Perdew, K. Burke and M. Ernzerhof \bibfieldjournal Phys. Rev. Lett. 77, 3865-3868 (1996) \BibitemShutNoStop
- Monkhorst (1976) \BibitemOpen\bibfieldauthor H.J. Monkhorst and J.D. Pack \bibfieldjournal Phys. Rev. B 13, 5188-5192 (1976) \BibitemShutNoStop
Methods
Single crystals of VI3 were grown via a self-flux chemical vapor transport method in quartz tubes evacuated to high vacuum, following the method of Juza et.al.(Juza et al., 1969). Vanadium powder (99.9%, Sigma Aldrich) and crystalline iodine (99.99%, Alfa Aesar) were combined in the stoichiometric ratio with additional 5% Iodine within an Ar atmosphere glove box, and their containing quartz tube then evacuated to ~ Torr and sealed. The tubes were placed in a two-zone furnace and heated to 400 C / 320 C over 6 hours. The furnace was held at these temperatures for 7 days, then cooled to room temperature over 12 hours. The crystals grown formed shiny black flakes or platelets, allowing the crystal planes to be easily identified. The maximum dimension of single crystals was 1 cm*1 cm*100 um. Powder samples were grown via solid state reaction in a 5 Torr Ar atmosphere. The resulting powder was ground and then annealed at 300 C for 2 days, and then another annealing was made at 400 C for 2 days after further grinding. At each case, after additional 2 days in Ar atmosphere for the removal of excessive Iodine in the sample, the sample stoichiometry and quality were verified with energy dispersive x-ray (EDX) spectroscopy and powder x-ray diffraction (XRD).
Temperature dependent powder XRD measurements were carried out using a Bruker D8 Discovery system with Cu target K and K wavelengths. Diffraction data were analyzed in the FULLPROF (Rodríguez-Carvajal, 1993) and GSAS-II (Toby, 2013) software suites and visualized in VESTA (Momma, 2011). It was necessary to take into account the effect of preferred orientation through the (00l) direction in all refinements.
Resistivity measurements were carried out using a Keithley 6430 source meter and a closed cycle cryostat system developed in-house. These were on bulk single crystals with current applied and voltage measured in the crystal plane in a 4-wire geometry. Crystal dimensions were obtained by inspection under microscope with scale calibrants. Optical transmittance measurements were done by using an Agilent Cary 5000 spectrophotometer. As with all but the most carefully prepared CrI3 or other halide samples (Handy, 1950; McGuire et al., 2015), VI3 was found to be extremely sensitive to atmospheric moisture. All sample preparation was therefore carried out in an argon atmosphere. All measurements of magnetic properties were performed using a Quantum Design MPMS3 EverCool SQUID magnetometer. Single crystals were characterized in ranges of temperature (2 to 300 K) and magnetic field (-7 to 7 T) with the vibrating sample magnetometer option. A high-pressure environment was achieved within the MPMS by employing a piston-cylinder clamp cell developed by CamCool Research Ltd, UK. This cell is optimized for the dimensions of the MPMS and its geometry and gold-plated beryllium-copper construction are designed for a minimal magnetic background. Daphne oil 7373 was used as the pressure transmitting medium and the superconducting transition of lead as a pressure calibrant. The DC data collection option was used for these measurements, and the background signal of an empty pressure cell subtracted from the raw data before fitting the dipole signal.
The electronic structure of bulk VI3 was calculated within density functional theory (DFT) using the Quantum ESPRESSO package (Gianozzi, 2009). The atomic coordinates of the high-temperature structure (Table 1) were used for the calculations. To consider the strong correlation effects of localized 3d electrons of V atoms, a simplified version of the DFT+U method suggested by Dudarev et al. (Dudarev, 1998) was employed. The effective Hubbard interaction parameter of V atoms was set to 3.7 eV, consistent with a recent calculation result based on a linear response approach (He et al., 2016). Interactions between ion cores and electrons were represented by optimized norm-conserving pseudopotentials (Hamann, 2013; Schlipf, 2015). The generalized gradient approximation of Perdew, Burke and Ernzerhof (Perdew, 1966) was used to calculate exchange correlation energy. The kinetic energy cutoff of plane-wave basis was set to 60 Ry and a 6 × 6 × 6 Monkhorst-Pack grid (Monkhorst, 1976) was used to perform Brillouin-zone integration.
| High-T structure | 300 K | = 7.37% | = 10.1% | ||
|---|---|---|---|---|---|
| = 6.8987(10) Å | = 13.2897(1) Å | V = 547.74(10) Å3 | ρ = 5.236(1) g.cm-3 | ||
| Occ | |||||
| V(2a) | 0 | 0 | 0.25 | 1 | 0.038(5) |
| V(2c) | 0.33333 | 0.66667 | 0.25 | 1 | 0.265(31) |
| I(12i) | 0.326(2) | 0.335(2) | 0.3703(1) | 1 | 0.041(1) |
| Low-T structure | 40 K | = 6.94% | = 9.34% | ||
|---|---|---|---|---|---|
| = 6.9354(3) Å | = 11.9069(5) Å | = 13.1865(1) Å | β = 90.403(2) ° | V = 1088.90(7) Å3 | ρ = 5.266(1) g.cm-3 |
| Occ | |||||
| V(4e) | 0 | 0.010(6) | 0.75 | 1 | 0.03900 |
| V(4e) | 0 | 0.356(5) | 0.75 | 1 | 0.09000 |
| I(8f) | 0.834(2) | 0.168 | 0.63 | 1 | 0.04740 |
| I(8f) | 0.835 | 0.497 | 0.627 | 1 | 0.04740 |
| I(8f) | 0.33 | 0.334 | 0.6271(3) | 1 | 0.04740 |