Peak star formation efficiency and no missing baryons in massive spirals
It is commonly believed that galaxies use, throughout the Hubble time, a very small fraction of the baryons associated to their dark matter halos to form stars. This so-called low ”star formation efficiency” , where is the cosmological baryon fraction, is expected to reach its peak at nearly (at efficiency ) and decline steeply at lower and higher masses. We have tested this using a sample of nearby star-forming galaxies, from dwarfs () to high-mass spirals () with Hi rotation curves and 3.6m photometry. We fit the observed rotation curves with a Bayesian approach by varying three parameters, stellar mass-to-light ratio , halo concentration and mass . We found two surprising results: 1) the star formation efficiency is a monotonically increasing function of with no sign of a decline at high masses, and 2) the most massive spirals () have , i.e. they have turned nearly all the baryons associated to their haloes into stars. These results imply that the most efficient galaxies at forming stars are massive spirals (not galaxies), they reach nearly 100% efficiency and thus, once both their cold and hot gas is considered into the baryon budget, they have virtually no missing baryons. Moreover, there is no evidence of mass quenching of the star formation occurring in galaxies up to halo masses of .
Key Words.:
galaxies: kinematics and dynamics – galaxies: spiral – galaxies: structure – galaxies: formation1 Introduction
In our Universe, only about one-sixth of the total matter is baryonic, while the rest is widely thought to be in form of non-baryonic, collisionless, non-relativistic dark matter (e.g. Planck Collaboration et al. 2018). In the so-called standard Cold Dark Matter (CDM) paradigm, galaxies form within extended haloes of dark matter that were able to grow enough to become gravitationally bound (e.g. White & Rees 1978). In this scenario it is then reasonable to expect that the amount baryons present in galaxies today is roughly a fraction (the “cosmological baryon fraction”, e.g. Planck Collaboration et al. 2018) of the mass in dark matter. However, it was realised that the total amount of baryons that we can directly observe in galaxies (stars, gas, dust etc.) is instead at most only about 20 of the cosmological value (e.g. Persic & Salucci 1992; Fukugita et al. 1998). This became known as the “missing baryons” problem and has prompted the search for large resevoirs of baryons within the diffuse, multi-phase circumgalactic medium of galaxies (Bregman 2007; Tumlinson et al. 2017).
Arguably the most important indicator of this issue is the so-called stellar-to-halo mass relation, which connects the stellar mass of a galaxy to its dark matter halo of mass (see Wechsler & Tinker 2018, for a recent review). This relation can be probed observationally through many different techniques, e.g. galaxy abundance as a function of stellar mass (e.g. Vale & Ostriker 2004; Behroozi et al. 2010; Moster et al. 2013), galaxy clustering (e.g. Kravtsov et al. 2004; Zheng et al. 2007), group catalogues (e.g. Yang et al. 2008), weak galaxy-galaxy lensing (e.g. Mandelbaum et al. 2006; Leauthaud et al. 2012), satellite kinematics (e.g. van den Bosch et al. 2004; More et al. 2011; Wojtak & Mamon 2013) and internal galaxy dynamics (e.g. Persic et al. 1996; McConnachie 2012; Cappellari et al. 2013; Desmond & Wechsler 2015; Read et al. 2017; Katz et al. 2017, hereafter K17). Amongst all these determinations there is wide consensus on the overall shape of the relation and, in particular, on the fact that the ratio of stellar-to-halo mass , sometimes called star-formation efficiency, is a non-monotonic function of mass with a peak () at (roughly the mass of the Milky Way). This can be interpreted as galaxies of these characteristic mass having been overall, during the course of their life, the most efficient at turning gas into stars. And yet, efficiencies of the order of are still relatively low, implying that most baryons are still undetected even in these systems111Since molecular, atomic and ionized gas is typically dynamically sub-dominant in galaxies..
Several works have suggested that the exact shape of the stellar-to-halo mass relation depends on galaxy morphology (e.g. Mandelbaum et al. 2006; Conroy et al. 2007; Dutton et al. 2010; More et al. 2011; Rodríguez-Puebla et al. 2015; Lange et al. 2018), especially on the high-mass side () where red, passive early-type systems appear to reside in more massive halos with respect to blue, star-forming late-type galaxies. This is intriguing, since it is suggesting that galaxies with different morphologies likely followed different evolutionary pathways that led the late-type ones, at a given M⋆, to live in relatively lighter halos and to have a somewhat smaller fraction of missing baryons with respect to early-type systems222 Blue galaxies also have typically larger reservoirs of cold gas with respect to red ones. However, on average, the amount cold gas is sub-dominant with respect to stars for . (e.g. Papastergis et al. 2012). . However, one of the main difficulties associated to these measurements is the paucity of high-mass galaxies in the nearby Universe (e.g. Kelvin et al. 2014), given that most of the aforementioned observational probes use statistical estimates based on on large galaxy samples.
In this paper we use another, complementary approach to estimate the stellar-to-halo mass relation through accurate modelling of the gas dynamics within spiral galaxies. We use the observed Hi rotation curves of a sample of regularly rotating, nearby disc galaxies to fit mass models comprising of a baryonic plus a dark matter component. We then extrapolate the dark matter profile to the virial radius, with cosmologically motivated assumptions, to yield the halo mass. A considerable advantage of this method is that each system can be studied individually and halo masses, along with their associated uncertainties, can be determined in great detail for each object. We show that this approach leads to a coherent picture of the relation between stellar and halo mass in late-type galaxies, which in turns profoundly affects our perspective on the star-formation efficiency in the high-mass regime.
2 Method
Here we describe the data and methodology of our analysis. We adopt a standard CDM cosmology, with parameters estimated by the Planck Collaboration et al. (2018). In particular, we use a Hubble constant of km s-1 Mpc-1 and a cosmological baryon fraction of .
2.1 Data
We use the sample of 175 disc galaxies with near-infrared photometry and Hi rotation curves (SPARC) collected by Lelli et al. (2016a, hereafter LMS16). This sample of spirals in the nearby Universe spans more than 4 orders of magnitude in luminosity at 3.6m and all morphological types, from irregulars to lenticulars. The galaxies have been selected to have extended, regular, high-quality Hi rotation curves and measured near-infrared photometry; thus it is not volume limited. Nevertheless, it still provides a fair representation of the population of (regularly rotating) spirals at and most importantly is best suited for our dynamical study.
The Hi rotation curves are used as tracers of the circular velocity of the galaxies, while the individual contributions of the atomic gas () and stars () to the circular velocity are derived from the Hi and 3.6m total intensity maps respectively (see LMS16, for further details). traces the distribution of atomic hydrogen, corrected for the presence of helium, while the near-infrared surface brightness is decomposed into and exponential disc () and a spherical bulge (). The contribution of the stars to the circular velocity is then , given stellar mass-to-light ratios of the disc () and bulge populations () respectively.
2.2 Model
We model the observed rotation curve as
| (1) |
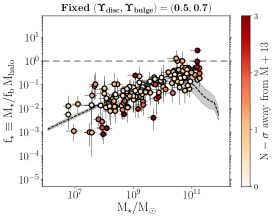
Here is the dark matter contribution to the circular velocity and, for simplicity, we have assumed that , as suggested by stellar population synthesis models (e.g. Schombert & McGaugh 2014), thus . In Appendix A we explore the effect of fixing different mass-to-light ratios and for disc and bulge respectively: our findings on the stellar-to-halo mass relation do not change significantly if we assume and , for which the scatter of the baryonic Tully-Fisher relation is minimised (Lelli et al. 2016b).
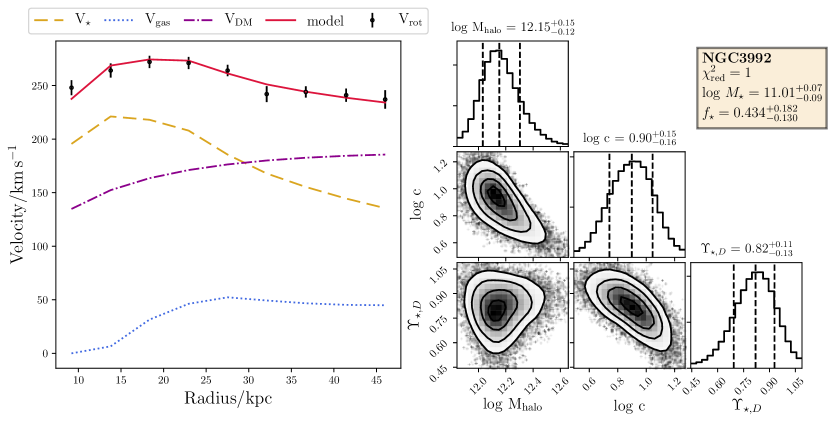
The dark matter distribution is modelled as a Navarro et al. (1996, hereafter NFW) spherical halo, which is characterised by a dimensionless concentration parameter () and the halo mass (), which we take as that within a radius enclosing 200 times the critical density of the Universe. Thus our rotation curve model has three free parameters: , and .
We compute the posterior distributions of these parameters with a Bayesian approach. We define a standard likelihood , given the data , as
| (2) |
where is the -th point of the observed rotation curve at radius and is its observed uncertainty. The posterior distribution of the three parameters is then given by Bayes’ theorem
| (3) |
where is the prior. We sample the posterior with an affine-invariant Markov Chain Monte Carlo method (MCMC, in particular, we use the python implementation by Foreman-Mackey et al. 2013).
We use a flat prior on the stellar mass-to-light ratio limited to a reasonable range, , which encompasses estimates obtained with stellar population models (Meidt et al. 2014; McGaugh & Schombert 2014). In a CDM Universe the halo mass and concentration are well known to be anti-correlated. Thus, in order to test whether standard CDM haloes can be used to fit galaxy rotation curves and then yield a stellar-to-halo mass relation, for the halo concentration we assume a prior which follows the relation as estimated in N-body cosmological simulations (e.g. Dutton & Macciò 2014, hereafter DM14): for each , the prior on is lognormal with mean and uncertainty given by the of DM14 (their Eq. 8). The prior on the dark matter halo mass is, instead, flat over a wide range: .
A non-uniform prior on the halo concentration is needed to infer reasonable constraints on the halo parameters (see e.g. K17). The reason for this is that the Hi rotation curves do not typically extend out enough to probe the region where the NFW density profile steepens, thus yielding only a weak inference on . The CDM-motivated prior on the relation proves to be enough to well constrain all the model parameters. Furthermore, we notice that the DM14 relation does not distinguish between haloes hosting late-type or early-type galaxies, so we use it under the assumption that it provides a reasonable description of the correlation for the haloes where late-type galaxies form. We summarise in Table 1 our choice of priors.
3 Results
We modelled the rotation curves and we have measured the posterior distributions of and for all the 158 SPARC galaxies with inclination on the sky larger than 30 degrees – since for nearly face-on systems the rotation curves are very uncertain. For each parameter, we define the “best-value” to be the median of the posterior distribution and its uncertainty as the 16th - 84th percentiles. In Appendix A we provide in tabular form all the measurements and uncertainties, together with the value of the likelihood associated to the best model (Table LABEL:tab:results). We also present the full rotation curve decomposition for one case as an example (NGC 3992, Figure 3), while we make available the plots of all the other galaxies online at http://astro.u-strasbg.fr/~posti/PFM19_fiducial_fits/.
Unsurprisingly, we find that our model typically does not give very stringent constraints on the stellar mass-to-light ratio, with only 84 (68) galaxies having an uncertainty on smaller than 50 (30). In these cases, which are mostly for where the signal-to-noise is large, the and profiles are similar enough to yield good constraints on . We find that these galaxies are not all maximal discs, as their is homogeneously distributed in the range allowed by our prior. We find the highest mass spirals () to have much better fits with a slightly larger mass-to-light ratio () than the mean of our prior (), consistently with previous works who found that high mass discs are close to maximal (e.g. Lapi et al. 2018; Starkman et al. 2018; Li et al. 2018). Smaller systems, instead, have typically a poorer inference on the mass-to-light ratio, with about cases in which the posterior on is quite flat. Even in these extreme cases it is nevertheless useful to let the MCMC explore the full range of possible mass-to-light ratios () as opposed to just fixing a value for , because this provides a more realistic estimate of the uncertainty on the other parameters of the dark matter halo. In other words, when the inference on is poor, it may be thought as a nuisance parameter over which the posterior distributions of the other two more interesting halo parameters is marginalised.
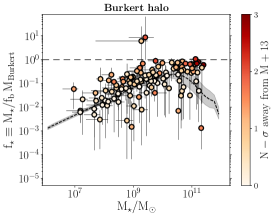
For 137 (out of 158) galaxies we obtain a unimodal posterior distribution for the halo mass, thus we can associate a measurement and an uncertainty to ; the remaining 21 galaxies have, instead, either a multi-modal or a flat posterior on the halo mass and thus we discard them. These 21 are mostly low-mass systems () and their removal does not alter in any way the high-mass end of the population, which is the main focus of our work. For some of the remaining 137 galaxies, we find that the NFW halo model provides a poor fit to the observed rotation curve, as their best-fit is large. This is not surprising, since it is well known that especially low-mass discs tend to have slowly rising rotation curves, which makes them more compatible with having centrally cored haloes (e.g. de Blok et al. 2001, K17). Indeed, by re-fitting all rotation curves with a cored halo model from Burkert (1995), we have found 27, mostly low-mass (), systems for which such cored profile is preferred to the NFW at a 3- confidence level. For consistency we have decided to remove these 27 systems from our sample, but in Appendix A we demonstrate that their stellar and halo masses, derived by extrapolating the Burkert profile to the virial radius, are perfectly consistent with the picture that we present below.
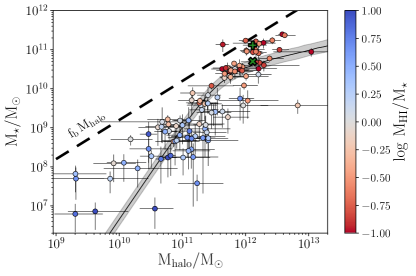
In Figure 1 we plot the relation for the 110 SPARC galaxies in our final sample. Points are the median of the posterior distributions of and ; the 16th-84th percentiles of the distribution define the errorbar, while the uncertainty on the stellar mass is calculated as in Lelli et al. (2016b, their Eq. 5) where the uncertainty on is given by the 16th-84th percentiles of its posterior. For comparison we also plot the relation estimated by Moster et al. (2013) using abundance matching. In general we find that the abundance matching model is in good agreement with our measurements for , albeit our points have a large scatter especially at the lowest masses. The agreement is instead much poorer at high stellar masses, where the Moster et al. (2013) model predicts significantly larger halo masses with respect to our estimates. Our measurements indicate that there is no sign of a break in the stellar-to-halo mass relation of spirals and that it is consistent with being an increasing function of mass with roughly the same slope at all masses.
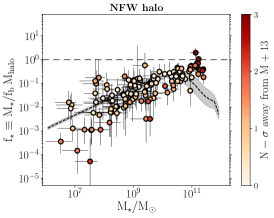
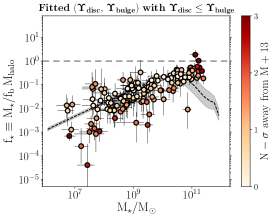
The tension at the high-mass end between our measurements and the abundance matching model is much clearer if one plots the stellar fraction, i.e. , also sometimes called star-formation efficiency, as a function of the stellar mass: we show this in Figure 2. This plot highlights the two main findings of our work, the first being that appears to increase monotonically with galaxy stellar mass with no indication of a peak in the range , where most abundance matching models find a maximum star-formation efficiency. For instance, a galaxy with has in the Moster et al. (2013) model, while we find . By computing the difference between the measured and that expected in the Moster et al. (2013) model, normalised by the sum in quadrature of the measured uncertainty on and of the intrinsic scatter of the model, we find the measurement for the high-mass systems to be inconsistent at with the model (see the colours of the points in Fig. 2). Such a discrepancy is very robust and holds for all the tests we have run (we show in Appendix A, Figure 4, the diagram in all these cases):
-
•
we have fitted the rotation curves assuming a cored (Burkert 1995) instead of a cuspy (NFW) profile. In general, this yields better fits for many low-mass systems, slightly larger stellar masses and smaller halo virial masses for all galaxies;
- •
- •
-
•
we tried allowing both and to vary in our fits, with the additional constraint (). This has an effect only on the 28 (out of 110) galaxies in our final sample that have non-negligible bulges. We find the resulting uncertainties on to be typically significantly larger in this case, but never dramatic.
In all these cases the final result is that the diagram is not significantly different from the one presented in Fig. 2.
Additionally, as shown by Katz et al. (2014, see their Fig. 20 and 23), the effect of adiabatic contraction of the dark matter halos due to the formation of stellar discs has a negligible impact on for galaxies in the interested mass regime.
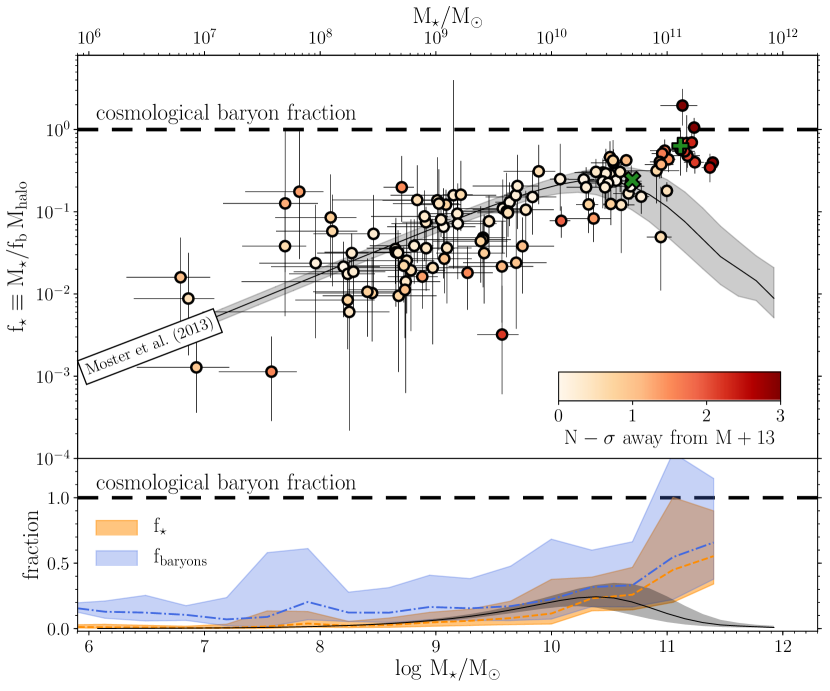
The other main finding highlighted by Fig. 2 is even more surprising: we find that all spirals with have stellar fraction very close to unity, in the range , with a handful of them being consistent with within the uncertainties. This implies that these galaxies were extremely efficient at turning gas into stars and that the amount of mass collapsed in stars is a considerable portion of the total amount of baryons expected to be associated with their haloes. In fact, if we include also the contribution of atomic and molecular hydrogen (the latter estimated through the relation given by Catinella et al. 2018), spirals with are found to be consistent with a cold baryon budget of within the uncertainties (where the factor 1.4 accounts for helium, e.g. Lelli et al. 2016a), with a mean value of and uncertainties of . Moreover, considering that galaxies are known to be surrounded by massive, hot coronae, which are detected both in X-ray and with the Sunyaev-Zeldovich effect and account for about (typically estimated statistically by stacking over many galaxies with a given stellar mass, e.g. Planck Collaboration et al. 2013; Bregman et al. 2018, and references therein), the total (cold+hot) baryon budget is easily compatible with unity at the high-mass end, with very little room for other baryonic components. In other words, we have found that the most massive, regularly rotating spirals in the nearby Universe have virtually no missing baryons.
4 Discussion
Our analysis allowed us to have a robust and unbiased estimate of the halo virial mass for a sample of 108 spiral galaxies in the nearby Universe using their high-quality Hi rotation curves. While we find good agreement with previous determinations of the stellar-to-halo mass relation for galaxies roughly up to the mass of Milky Way (), we also find systematically smaller halo masses (factor ), corresponding to higher stellar-to-halo mass ratios, for the most massive spirals with respect to expectations from most up-to-date abundance matching models (e.g. Wechsler & Tinker 2018).
A possible explanation for this discrepancy is that, while the high-mass end () of the galaxy stellar mass function is vastly dominated by passive early-type galaxies which occupy massive () dark matter halos, there still exists a population of star-forming spirals that inhabit halos of lower masses. The presence of this second population – which is not well represented by current abundance matching models – implies the existence of different evolutionary pathways for building galaxies of a given stellar mass. This suggests that e.g. a massive system that has evolved in isolation may have had the chance to sustain star-formation unimpeded for its entire life, potentially converting most of its available baryons into stars. While this is certainly not the case for high-mass early-types galaxies, which tend to live in high-density environments, it may well be the pathway taken by the high-mass population of spirals studied in this work. In fact, also McGaugh et al. (2010) by simply analysing the Tully-Fisher relation of a similar sample of spirals concluded that does not turn over at the highest masses.
A discrepancy between the expected halo mass for a typical passive (red) galaxy and an active (blue) one of the same , was also noted by other authors using various probes, such as satellite kinematics (e.g. Conroy et al. 2007; More et al. 2011; Wojtak & Mamon 2013), galaxy-galaxy weak lensing (e.g. Mandelbaum et al. 2006, 2016; Reyes et al. 2012), abundance matching (e.g. Rodríguez-Puebla et al. 2015) or combinations (e.g. Dutton et al. 2010). The works most similar to ours are those of K17 and Lapi et al. (2018). We use the same galaxy sample as in K17 (SPARC) and we perform a similar analysis as them, but with the crucial difference that we do not impose a prior on halo mass that follows an relation from abundance matching, which slightly biases towards higher halo masses some of the high-mass galaxies333 Taking into account this difference in the priors used, our results are very well compatible with theirs: our conclusions sit in the middle between their case with uniform priors (their Fig. 3) and that in which they impose a prior following the Moster et al. (2013) relation (their Fig. 5). Lapi et al. (2018), on the other hand, have a much larger sample of spirals than ours, but they rely on “stacked” rotation curves for their mass decompositions – i.e. they stack individual curves of galaxies in bins of absolute magnitude – whereas we focus on individual, well studied systems. Finally, we notice that, amongst the detailed studies of individual systems, i) Corbelli et al. (2010) measured the dynamical mass of M31 by decomposing its Hi rotation cureve, to find a surprisingly high , and ii) Martinsson et al. (2013) decomposed the Hi rotation curves of a small sample of 30 spirals from the DiskMass Survey, to find the highest star-formation efficiencies for their three most massive galaxies (). While our results align with these previous works, to our knowledge we are the first to focus specifically on the relation and to highlight the fact that i) the highest-mass spirals are the most efficient galaxies at turning gas into stars, ii) that increases monotonically with stellar mass for regularly rotating nearby discs and that iii) virtually all high-mass discs have of the total baryons within their haloes in stars.
Our analysis establishes that the most efficient galaxies at forming stars are not galaxies, as previously thought (e.g. Wechsler & Tinker 2018), but much more massive systems, some of the most massive spiral galaxies in the nearby Universe (). Not only the galactic star-formation efficiency peaks at much larger masses than we knew before, but we also showed that several massive discs have efficiencies of the order unity. This result alone is of key importance since it demonstrates that there is no universal physical mechanism that sets the maximum star-formation efficiency to .
Furthermore, the fact that some massive galaxies with high exist has fundamental implications for star-formation quenching. Since these galaxies live in haloes with , if mass is the main driver of quenching and if a critical mass for quenching exists (e.g. as expected in scenarios where virial shock heating of the circumgalactic medium is the key process, see Birnboim & Dekel 2003; Dekel & Birnboim 2008), then it follows that this critical mass can not be smaller than , which is almost an order of magnitude higher than previously thought (e.g. Dekel & Birnboim 2006). Interestingly, such a high threshold is instead expected in scenarios where the accretion of cool gas is hampered (“starvation”), e.g. by the high virial temperature of the circumgalactic gas in a galactic fountain cycle (e.g. Armillotta et al. 2016) or by the complex interplay of radiative cooling and feedback in the smooth gas accretion from cold filaments (e.g. van de Voort et al. 2011).
Even if we have measured high for some massive spirals, still the vast majority of galaxies living in haloes has , which means that they managed to efficiently quench their star-formation. Our results imply that since mass can not be the major player in quenching galaxies, at least for , and some other mechanism must play a fundamental role in the transition from actively to passively star-forming. One of the main suspects is clearly environment, since gas removal happens more frequently and also gas accretion is more difficult in high-density environments (e.g. Peng et al. 2010; van de Voort et al. 2017). Another is the powerful feedback from the active galactic nucleus (AGN), which can episodically suppress any gas condensation throughout the galaxy (e.g. Croton et al. 2006; Fabian 2012). Finally, another key process is the interaction with other galaxies, with passive galaxies being hosted in haloes with an active merger history, which can result in bursty star-formation histories and subsequent suppressive stellar/AGN feedback (e.g. Cox et al. 2006b; Gabor et al. 2010). This latter scenario also naturally accounts for the morphological transformation of disc galaxies, living in haloes with quiet merger histories, to spheroids, which are the dominant galaxy population at the high-mass end, where also mergers are more frequent (e.g. Cox et al. 2006a). This scenario is, in principle, testable both with current cosmological simulations and with a new abundance matching model which depends also on secondary halo parameters, such as merger history or formation time, and it is able to predict not only stellar masses but also other galaxy properties, such as morphology or colour.
Acknowledgements
We thank E. Corbelli, B. Famaey, A. Lapi, F. Lelli, A. Robertson, J. Sellwood and F. van den Bosch for useful discussions and A. Ghari for making their Einasto fits available to us. LP acknowledges financial support from a VICI grant from the Netherlands Organisation for Scientific Research (NWO) and from the Centre National d’Etudes Spatiales (CNES).
References
- Armillotta et al. (2016) Armillotta, L., Fraternali, F., & Marinacci, F. 2016, MNRAS, 462, 4157
- Behroozi et al. (2010) Behroozi, P. S., Conroy, C., & Wechsler, R. H. 2010, ApJ, 717, 379
- Birnboim & Dekel (2003) Birnboim, Y. & Dekel, A. 2003, MNRAS, 345, 349
- Bregman (2007) Bregman, J. N. 2007, ARA&A, 45, 221
- Bregman et al. (2018) Bregman, J. N., Anderson, M. E., Miller, M. J., et al. 2018, ApJ, 862, 3
- Burkert (1995) Burkert, A. 1995, ApJ, 447, L25
- Cappellari et al. (2013) Cappellari, M., Scott, N., Alatalo, K., et al. 2013, MNRAS, 432, 1709
- Catinella et al. (2018) Catinella, B., Saintonge, A., Janowiecki, S., et al. 2018, MNRAS, 476, 875
- Conroy et al. (2007) Conroy, C., Prada, F., Newman, J. A., et al. 2007, ApJ, 654, 153
- Corbelli et al. (2010) Corbelli, E., Lorenzoni, S., Walterbos, R., Braun, R., & Thilker, D. 2010, A&A, 511, A89
- Cox et al. (2006a) Cox, T. J., Dutta, S. N., Di Matteo, T., et al. 2006a, ApJ, 650, 791
- Cox et al. (2006b) Cox, T. J., Jonsson, P., Primack, J. R., & Somerville, R. S. 2006b, MNRAS, 373, 1013
- Croton et al. (2006) Croton, D. J., Springel, V., White, S. D. M., et al. 2006, MNRAS, 365, 11
- de Blok et al. (2001) de Blok, W. J. G., McGaugh, S. S., Bosma, A., & Rubin, V. C. 2001, ApJ, 552, L23
- Dekel & Birnboim (2006) Dekel, A. & Birnboim, Y. 2006, MNRAS, 368, 2
- Dekel & Birnboim (2008) Dekel, A. & Birnboim, Y. 2008, MNRAS, 383, 119
- Desmond & Wechsler (2015) Desmond, H. & Wechsler, R. H. 2015, MNRAS, 454, 322
- Dutton et al. (2010) Dutton, A. A., Conroy, C., van den Bosch, F. C., Prada, F., & More, S. 2010, MNRAS, 407, 2
- Dutton & Macciò (2014) Dutton, A. A. & Macciò, A. V. 2014, MNRAS, 441, 3359
- Einasto (1965) Einasto, J. 1965, Trudy Astrofizicheskogo Instituta Alma-Ata, 5, 87
- Fabian (2012) Fabian, A. C. 2012, ARA&A, 50, 455
- Foreman-Mackey et al. (2013) Foreman-Mackey, D., Hogg, D. W., Lang, D., & Goodman, J. 2013, PASP, 125, 306
- Fukugita et al. (1998) Fukugita, M., Hogan, C. J., & Peebles, P. J. E. 1998, ApJ, 503, 518
- Gabor et al. (2010) Gabor, J. M., Davé, R., Finlator, K., & Oppenheimer, B. D. 2010, MNRAS, 407, 749
- Ghari et al. (2018) Ghari, A., Famaey, B., Laporte, C., & Haghi, H. 2018, arXiv e-prints [arXiv:1811.06554]
- Katz et al. (2017) Katz, H., Lelli, F., McGaugh, S. S., et al. 2017, MNRAS, 466, 1648
- Katz et al. (2014) Katz, H., McGaugh, S. S., Sellwood, J. A., & de Blok, W. J. G. 2014, MNRAS, 439, 1897
- Kelvin et al. (2014) Kelvin, L. S., Driver, S. P., Robotham, A. S. G., et al. 2014, MNRAS, 444, 1647
- Kravtsov et al. (2004) Kravtsov, A. V., Berlind, A. A., Wechsler, R. H., et al. 2004, ApJ, 609, 35
- Lange et al. (2018) Lange, J. U., van den Bosch, F. C., Zentner, A. R., Wang, K., & Villarreal, A. S. 2018, ArXiv e-prints [arXiv:1811.03596]
- Lapi et al. (2018) Lapi, A., Salucci, P., & Danese, L. 2018, ApJ, 859, 2
- Leauthaud et al. (2012) Leauthaud, A., Tinker, J., Bundy, K., et al. 2012, ApJ, 744, 159
- Lelli et al. (2016a) Lelli, F., McGaugh, S. S., & Schombert, J. M. 2016a, AJ, 152, 157
- Lelli et al. (2016b) Lelli, F., McGaugh, S. S., & Schombert, J. M. 2016b, ApJ, 816, L14
- Li et al. (2018) Li, P., Lelli, F., McGaugh, S., & Schombert, J. 2018, A&A, 615, A3
- Mandelbaum et al. (2006) Mandelbaum, R., Seljak, U., Kauffmann, G., Hirata, C. M., & Brinkmann, J. 2006, MNRAS, 368, 715
- Mandelbaum et al. (2016) Mandelbaum, R., Wang, W., Zu, Y., et al. 2016, MNRAS, 457, 3200
- Martinsson et al. (2013) Martinsson, T. P. K., Verheijen, M. A. W., Westfall, K. B., et al. 2013, A&A, 557, A131
- McConnachie (2012) McConnachie, A. W. 2012, AJ, 144, 4
- McGaugh & Schombert (2014) McGaugh, S. S. & Schombert, J. M. 2014, AJ, 148, 77
- McGaugh et al. (2010) McGaugh, S. S., Schombert, J. M., de Blok, W. J. G., & Zagursky, M. J. 2010, ApJ, 708, L14
- Meidt et al. (2014) Meidt, S. E., Schinnerer, E., van de Ven, G., et al. 2014, ApJ, 788, 144
- More et al. (2011) More, S., van den Bosch, F. C., Cacciato, M., et al. 2011, MNRAS, 410, 210
- Moster et al. (2013) Moster, B. P., Naab, T., & White, S. D. M. 2013, MNRAS, 428, 3121
- Navarro et al. (1996) Navarro, J. F., Frenk, C. S., & White, S. D. M. 1996, ApJ, 462, 563
- Papastergis et al. (2012) Papastergis, E., Cattaneo, A., Huang, S., Giovanelli, R., & Haynes, M. P. 2012, ApJ, 759, 138
- Peng et al. (2010) Peng, Y.-j., Lilly, S. J., Kovač, K., et al. 2010, ApJ, 721, 193
- Persic & Salucci (1992) Persic, M. & Salucci, P. 1992, MNRAS, 258, 14P
- Persic et al. (1996) Persic, M., Salucci, P., & Stel, F. 1996, MNRAS, 281, 27
- Planck Collaboration et al. (2013) Planck Collaboration, Ade, P. A. R., Aghanim, N., et al. 2013, A&A, 557, A52
- Planck Collaboration et al. (2018) Planck Collaboration, Aghanim, N., Akrami, Y., et al. 2018, ArXiv e-prints [arXiv:1807.06209]
- Posti & Helmi (2019) Posti, L. & Helmi, A. 2019, A&A, 621, A56
- Read et al. (2017) Read, J. I., Iorio, G., Agertz, O., & Fraternali, F. 2017, MNRAS, 467, 2019
- Reyes et al. (2012) Reyes, R., Mandelbaum, R., Gunn, J. E., et al. 2012, MNRAS, 425, 2610
- Rodríguez-Puebla et al. (2015) Rodríguez-Puebla, A., Avila-Reese, V., Yang, X., et al. 2015, ApJ, 799, 130
- Salucci & Burkert (2000) Salucci, P. & Burkert, A. 2000, ApJ, 537, L9
- Schombert & McGaugh (2014) Schombert, J. & McGaugh, S. 2014, PASA, 31, e036
- Starkman et al. (2018) Starkman, N., Lelli, F., McGaugh, S., & Schombert, J. 2018, MNRAS, 480, 2292
- Tumlinson et al. (2017) Tumlinson, J., Peeples, M. S., & Werk, J. K. 2017, ARA&A, 55, 389
- Vale & Ostriker (2004) Vale, A. & Ostriker, J. P. 2004, MNRAS, 353, 189
- van de Voort et al. (2017) van de Voort, F., Bahé, Y. M., Bower, R. G., et al. 2017, MNRAS, 466, 3460
- van de Voort et al. (2011) van de Voort, F., Schaye, J., Booth, C. M., Haas, M. R., & Dalla Vecchia, C. 2011, MNRAS, 414, 2458
- van den Bosch et al. (2004) van den Bosch, F. C., Norberg, P., Mo, H. J., & Yang, X. 2004, MNRAS, 352, 1302
- Wechsler & Tinker (2018) Wechsler, R. H. & Tinker, J. L. 2018, ARA&A, 56, 435
- White & Rees (1978) White, S. D. M. & Rees, M. J. 1978, MNRAS, 183, 341
- Wojtak & Mamon (2013) Wojtak, R. & Mamon, G. A. 2013, MNRAS, 428, 2407
- Yang et al. (2008) Yang, X., Mo, H. J., & van den Bosch, F. C. 2008, ApJ, 676, 248
- Zheng et al. (2007) Zheng, Z., Coil, A. L., & Zehavi, I. 2007, ApJ, 667, 760
Appendix A Supplementary material
| Name | 16th | 84th | 16th | 84th | 16th | 84th | 16th | 84th | ||||||
|---|---|---|---|---|---|---|---|---|---|---|---|---|---|---|
| D512-2 | 8.51 | 0.62 | 0.22 | 1.02 | 9.91 | 9.59 | 10.26 | 0.98 | 0.86 | 1.11 | 1.05 | 0.0852 | 0.0157 | 0.2845 |
| DDO064 | 8.20 | 0.60 | 0.21 | 1.00 | 10.29 | 9.76 | 10.92 | 1.00 | 0.83 | 1.17 | 1.07 | 0.0237 | 0.0029 | 0.1213 |
| DDO170 | 8.73 | 0.38 | 0.12 | 0.80 | 10.66 | 10.58 | 10.76 | 0.82 | 0.74 | 0.88 | 2.73 | 0.0215 | 0.0052 | 0.0431 |
| ESO116-G012 | 9.63 | 0.44 | 0.20 | 0.69 | 11.72 | 11.49 | 12.05 | 0.89 | 0.74 | 1.01 | 2.52 | 0.0181 | 0.0064 | 0.0374 |
| ESO444-G084 | 7.85 | 0.60 | 0.21 | 0.99 | 11.23 | 10.93 | 11.65 | 0.92 | 0.79 | 1.03 | 0.76 | 0.0011 | 0.0003 | 0.0030 |
| F565-V2 | 8.75 | 0.58 | 0.19 | 1.00 | 11.14 | 10.88 | 11.51 | 0.89 | 0.73 | 1.02 | 1.10 | 0.0103 | 0.0026 | 0.0280 |
| F568-V1 | 9.58 | 0.70 | 0.27 | 1.05 | 11.63 | 11.30 | 12.07 | 1.01 | 0.84 | 1.15 | 0.30 | 0.0314 | 0.0077 | 0.0919 |
| F574-1 | 9.82 | 0.68 | 0.27 | 1.03 | 11.29 | 11.07 | 11.55 | 0.92 | 0.80 | 1.03 | 1.84 | 0.1097 | 0.0312 | 0.2466 |
| F583-1 | 8.99 | 0.57 | 0.18 | 0.98 | 11.08 | 10.77 | 11.42 | 0.86 | 0.73 | 0.98 | 2.11 | 0.0255 | 0.0058 | 0.0731 |
| F583-4 | 9.23 | 0.62 | 0.21 | 1.02 | 10.61 | 10.31 | 10.98 | 0.98 | 0.82 | 1.11 | 0.44 | 0.1377 | 0.0263 | 0.4602 |
| NGC0024 | 9.59 | 1.02 | 0.77 | 1.15 | 11.27 | 11.06 | 11.56 | 1.06 | 0.91 | 1.20 | 0.66 | 0.1306 | 0.0670 | 0.2269 |
| NGC0100 | 9.51 | 0.29 | 0.09 | 0.60 | 11.36 | 11.02 | 11.76 | 0.85 | 0.70 | 0.97 | 1.20 | 0.0208 | 0.0024 | 0.0820 |
| NGC0247 | 9.87 | 0.64 | 0.25 | 1.01 | 11.35 | 11.09 | 11.62 | 0.82 | 0.72 | 0.90 | 2.14 | 0.1013 | 0.0280 | 0.2969 |
| NGC0289 | 10.86 | 0.59 | 0.43 | 0.76 | 11.83 | 11.74 | 11.94 | 0.91 | 0.77 | 1.05 | 1.95 | 0.2833 | 0.1765 | 0.4227 |
| NGC0300 | 9.47 | 0.46 | 0.17 | 0.79 | 11.37 | 11.18 | 11.63 | 0.89 | 0.75 | 1.01 | 0.72 | 0.0268 | 0.0102 | 0.0573 |
| NGC0801 | 11.49 | 0.56 | 0.52 | 0.60 | 12.00 | 11.90 | 12.14 | 0.77 | 0.63 | 0.90 | 6.80 | 1.0564 | 0.7746 | 1.3789 |
| NGC1003 | 9.83 | 0.46 | 0.24 | 0.66 | 11.49 | 11.39 | 11.62 | 0.78 | 0.67 | 0.88 | 3.09 | 0.0485 | 0.0240 | 0.0746 |
| NGC1090 | 10.86 | 0.48 | 0.36 | 0.59 | 11.72 | 11.63 | 11.84 | 0.94 | 0.80 | 1.07 | 2.50 | 0.3931 | 0.2445 | 0.5734 |
| NGC1705 | 8.73 | 0.99 | 0.72 | 1.15 | 10.86 | 10.57 | 11.26 | 1.16 | 0.99 | 1.31 | 0.66 | 0.0352 | 0.0133 | 0.0712 |
| NGC2403 | 10.00 | 0.42 | 0.30 | 0.53 | 11.40 | 11.33 | 11.49 | 1.14 | 1.06 | 1.23 | 9.47 | 0.1012 | 0.0828 | 0.1164 |
| NGC2683 | 10.91 | 0.66 | 0.58 | 0.73 | 11.63 | 11.46 | 11.82 | 0.96 | 0.82 | 1.11 | 1.31 | 0.4620 | 0.2927 | 0.7192 |
| NGC2841 | 11.27 | 0.87 | 0.79 | 0.94 | 12.54 | 12.42 | 12.69 | 0.88 | 0.76 | 1.00 | 1.81 | 0.1796 | 0.1335 | 0.2283 |
| NGC2903 | 10.91 | 0.37 | 0.31 | 0.41 | 11.75 | 11.67 | 11.85 | 1.24 | 1.14 | 1.34 | 7.61 | 0.3001 | 0.1718 | 0.4448 |
| NGC2915 | 8.81 | 0.56 | 0.19 | 0.97 | 11.10 | 10.85 | 11.44 | 1.03 | 0.86 | 1.18 | 0.98 | 0.0106 | 0.0030 | 0.0270 |
| NGC2955 | 11.50 | 0.47 | 0.44 | 0.51 | 12.13 | 11.80 | 12.48 | 0.88 | 0.71 | 1.03 | 4.81 | 0.6863 | 0.3052 | 1.4911 |
| NGC2998 | 11.18 | 0.62 | 0.48 | 0.74 | 12.01 | 11.91 | 12.13 | 0.91 | 0.76 | 1.06 | 2.74 | 0.5532 | 0.3896 | 0.7568 |
| NGC3198 | 10.58 | 0.51 | 0.38 | 0.61 | 11.67 | 11.60 | 11.75 | 0.98 | 0.87 | 1.09 | 1.43 | 0.2475 | 0.1981 | 0.2979 |
| NGC3521 | 10.93 | 0.52 | 0.47 | 0.58 | 12.29 | 11.83 | 12.85 | 0.86 | 0.68 | 1.03 | 0.29 | 0.1212 | 0.0315 | 0.3787 |
| NGC3726 | 10.85 | 0.39 | 0.28 | 0.47 | 11.76 | 11.59 | 11.98 | 0.87 | 0.73 | 1.02 | 2.96 | 0.1987 | 0.1058 | 0.3469 |
| NGC3741 | 7.45 | 0.46 | 0.14 | 0.89 | 10.57 | 10.33 | 10.86 | 0.84 | 0.72 | 0.95 | 1.05 | 0.0013 | 0.0004 | 0.0031 |
| NGC3769 | 10.27 | 0.35 | 0.21 | 0.51 | 11.40 | 11.25 | 11.57 | 1.01 | 0.88 | 1.14 | 0.68 | 0.0970 | 0.0495 | 0.1719 |
| NGC3893 | 10.77 | 0.50 | 0.41 | 0.58 | 12.01 | 11.75 | 12.36 | 0.95 | 0.78 | 1.11 | 1.27 | 0.1227 | 0.0551 | 0.2310 |
| NGC3972 | 10.16 | 0.40 | 0.14 | 0.73 | 12.03 | 11.57 | 12.52 | 0.86 | 0.70 | 0.98 | 1.19 | 0.0240 | 0.0038 | 0.1250 |
| NGC3992 | 11.36 | 0.82 | 0.69 | 0.93 | 12.15 | 12.03 | 12.30 | 0.90 | 0.74 | 1.05 | 0.85 | 0.4339 | 0.3037 | 0.6160 |
| NGC4010 | 10.24 | 0.25 | 0.09 | 0.45 | 11.96 | 11.62 | 12.36 | 0.81 | 0.68 | 0.95 | 2.44 | 0.0216 | 0.0045 | 0.0764 |
| NGC4013 | 10.90 | 0.48 | 0.41 | 0.54 | 11.98 | 11.81 | 12.19 | 0.85 | 0.70 | 0.99 | 1.31 | 0.0776 | 0.0483 | 0.1161 |
| NGC4088 | 11.03 | 0.31 | 0.24 | 0.37 | 11.77 | 11.54 | 12.05 | 0.91 | 0.74 | 1.06 | 0.57 | 0.2924 | 0.1393 | 0.5817 |
| NGC4100 | 10.77 | 0.74 | 0.61 | 0.85 | 11.69 | 11.48 | 11.93 | 0.97 | 0.81 | 1.12 | 1.27 | 0.4199 | 0.2325 | 0.7423 |
| NGC4138 | 10.64 | 0.68 | 0.58 | 0.80 | 11.46 | 11.09 | 11.82 | 0.99 | 0.82 | 1.16 | 1.68 | 0.2491 | 0.1029 | 0.6693 |
| NGC4157 | 11.02 | 0.40 | 0.32 | 0.48 | 11.95 | 11.74 | 12.22 | 0.89 | 0.73 | 1.04 | 0.55 | 0.2388 | 0.1231 | 0.4311 |
| NGC4183 | 10.03 | 0.75 | 0.38 | 1.04 | 11.16 | 10.97 | 11.35 | 1.01 | 0.87 | 1.13 | 0.18 | 0.3102 | 0.1236 | 0.6488 |
| NGC4559 | 10.29 | 0.38 | 0.20 | 0.55 | 11.41 | 11.23 | 11.61 | 0.95 | 0.81 | 1.09 | 0.24 | 0.1513 | 0.0527 | 0.3176 |
| NGC5033 | 11.04 | 0.40 | 0.31 | 0.48 | 11.91 | 11.86 | 11.96 | 1.23 | 1.14 | 1.31 | 3.81 | 0.3049 | 0.1732 | 0.4383 |
| NGC5055 | 11.18 | 0.32 | 0.29 | 0.34 | 11.82 | 11.79 | 11.85 | 1.12 | 1.06 | 1.18 | 2.75 | 0.4220 | 0.3913 | 0.4514 |
| NGC5371 | 11.53 | 0.44 | 0.34 | 0.53 | 11.64 | 11.53 | 11.74 | 1.21 | 1.02 | 1.34 | 6.59 | 1.9570 | 1.1181 | 3.1110 |
| NGC5585 | 9.47 | 0.18 | 0.08 | 0.30 | 11.33 | 11.18 | 11.52 | 0.90 | 0.79 | 0.98 | 5.85 | 0.0142 | 0.0006 | 0.0294 |
| NGC5907 | 11.24 | 0.68 | 0.56 | 0.78 | 12.02 | 11.93 | 12.16 | 0.89 | 0.71 | 1.07 | 6.38 | 0.5110 | 0.4049 | 0.6183 |
| NGC5985 | 11.32 | 0.45 | 0.26 | 0.65 | 12.21 | 12.12 | 12.28 | 1.37 | 1.30 | 1.44 | 2.85 | 0.3156 | 0.1265 | 0.5595 |
| NGC6015 | 10.51 | 0.78 | 0.65 | 0.87 | 11.67 | 11.52 | 11.88 | 0.94 | 0.77 | 1.10 | 8.45 | 0.3054 | 0.1972 | 0.4377 |
| NGC6195 | 11.59 | 0.46 | 0.42 | 0.48 | 12.16 | 11.94 | 12.42 | 0.79 | 0.64 | 0.93 | 3.44 | 0.6961 | 0.3866 | 1.1779 |
| NGC6503 | 10.11 | 0.45 | 0.36 | 0.53 | 11.28 | 11.21 | 11.36 | 1.11 | 1.02 | 1.19 | 1.61 | 0.1585 | 0.1316 | 0.1883 |
| NGC6674 | 11.33 | 0.94 | 0.83 | 1.03 | 12.42 | 12.32 | 12.56 | 0.65 | 0.52 | 0.77 | 3.87 | 0.3996 | 0.2914 | 0.5274 |
| NGC6946 | 10.82 | 0.44 | 0.38 | 0.48 | 11.83 | 11.62 | 12.12 | 0.95 | 0.79 | 1.09 | 1.88 | 0.2336 | 0.1103 | 0.4250 |
| NGC7331 | 11.40 | 0.36 | 0.33 | 0.40 | 12.38 | 12.21 | 12.60 | 0.85 | 0.71 | 0.98 | 0.80 | 0.1527 | 0.0945 | 0.2232 |
| NGC7814 | 10.87 | 0.50 | 0.43 | 0.56 | 12.21 | 12.01 | 12.50 | 1.01 | 0.86 | 1.15 | 1.30 | 0.1245 | 0.0688 | 0.1869 |
| UGC00128 | 10.08 | 0.53 | 0.18 | 0.92 | 11.56 | 11.53 | 11.59 | 0.93 | 0.86 | 0.99 | 3.19 | 0.1058 | 0.0370 | 0.1797 |
| UGC00191 | 9.30 | 0.83 | 0.51 | 1.08 | 10.96 | 10.87 | 11.10 | 0.93 | 0.82 | 1.02 | 3.68 | 0.0947 | 0.0586 | 0.1368 |
| UGC00731 | 8.51 | 0.59 | 0.19 | 1.01 | 10.77 | 10.64 | 10.91 | 0.99 | 0.91 | 1.08 | 0.36 | 0.0176 | 0.0051 | 0.0338 |
| UGC02259 | 9.24 | 0.86 | 0.46 | 1.11 | 10.78 | 10.69 | 10.89 | 1.23 | 1.15 | 1.31 | 1.37 | 0.1220 | 0.0610 | 0.1851 |
| UGC02487 | 11.69 | 0.98 | 0.85 | 1.08 | 12.58 | 12.52 | 12.67 | 0.94 | 0.81 | 1.06 | 5.28 | 0.3968 | 0.3302 | 0.4704 |
| UGC02885 | 11.61 | 0.63 | 0.55 | 0.72 | 12.62 | 12.48 | 12.79 | 0.75 | 0.62 | 0.88 | 1.47 | 0.3448 | 0.2284 | 0.5073 |
| UGC02916 | 11.09 | 0.34 | 0.31 | 0.36 | 12.10 | 11.93 | 12.31 | 1.05 | 0.95 | 1.15 | 10.88 | 0.2354 | 0.1404 | 0.3645 |
| UGC02953 | 11.41 | 0.56 | 0.51 | 0.60 | 12.29 | 12.22 | 12.36 | 1.11 | 1.02 | 1.20 | 6.78 | 0.4796 | 0.3421 | 0.6312 |
| UGC03205 | 11.06 | 0.72 | 0.64 | 0.79 | 12.12 | 11.95 | 12.33 | 0.85 | 0.70 | 1.01 | 3.51 | 0.4040 | 0.2531 | 0.5862 |
| UGC03546 | 11.01 | 0.41 | 0.34 | 0.46 | 11.92 | 11.80 | 12.06 | 1.07 | 0.96 | 1.18 | 1.52 | 0.2236 | 0.1352 | 0.3344 |
| UGC03580 | 10.12 | 0.18 | 0.13 | 0.22 | 11.52 | 11.42 | 11.64 | 0.95 | 0.87 | 1.04 | 3.52 | 0.0459 | 0.0121 | 0.0823 |
| UGC04278 | 9.12 | 0.36 | 0.10 | 0.76 | 11.41 | 11.00 | 11.89 | 0.80 | 0.65 | 0.94 | 2.19 | 0.0095 | 0.0011 | 0.0430 |
| UGC04483 | 7.11 | 0.52 | 0.17 | 0.93 | 9.30 | 8.97 | 9.74 | 1.11 | 0.95 | 1.26 | 0.74 | 0.0160 | 0.0038 | 0.0485 |
| UGC04499 | 9.19 | 0.34 | 0.11 | 0.69 | 10.89 | 10.70 | 11.12 | 0.93 | 0.81 | 1.04 | 0.95 | 0.0322 | 0.0070 | 0.0839 |
| UGC05005 | 9.61 | 0.36 | 0.10 | 0.78 | 11.10 | 10.84 | 11.36 | 0.85 | 0.71 | 0.97 | 1.11 | 0.0718 | 0.0151 | 0.2207 |
| UGC05253 | 11.23 | 0.46 | 0.43 | 0.48 | 12.16 | 12.08 | 12.27 | 1.05 | 0.98 | 1.12 | 3.22 | 0.3759 | 0.2567 | 0.5165 |
| UGC05414 | 9.05 | 0.20 | 0.06 | 0.46 | 11.17 | 10.82 | 11.57 | 0.77 | 0.64 | 0.89 | 1.68 | 0.0061 | 0.0002 | 0.0256 |
| UGC05716 | 8.77 | 0.44 | 0.15 | 0.83 | 10.81 | 10.75 | 10.89 | 0.98 | 0.91 | 1.03 | 1.76 | 0.0186 | 0.0062 | 0.0312 |
| UGC05721 | 8.73 | 0.93 | 0.60 | 1.12 | 10.91 | 10.68 | 11.23 | 1.17 | 1.01 | 1.30 | 1.90 | 0.0317 | 0.0142 | 0.0596 |
| UGC05829 | 8.75 | 0.59 | 0.18 | 1.01 | 10.47 | 10.16 | 10.83 | 0.95 | 0.80 | 1.09 | 0.84 | 0.0539 | 0.0106 | 0.1593 |
| UGC05918 | 8.37 | 0.63 | 0.21 | 1.02 | 10.07 | 9.81 | 10.43 | 1.04 | 0.89 | 1.17 | 0.35 | 0.0580 | 0.0124 | 0.1611 |
| UGC06399 | 9.36 | 0.61 | 0.22 | 0.99 | 11.27 | 10.95 | 11.67 | 0.89 | 0.75 | 1.02 | 0.97 | 0.0362 | 0.0077 | 0.1135 |
| UGC06446 | 8.99 | 0.75 | 0.32 | 1.08 | 10.96 | 10.75 | 11.23 | 1.06 | 0.92 | 1.18 | 0.22 | 0.0385 | 0.0133 | 0.0808 |
| UGC06614 | 11.09 | 0.27 | 0.17 | 0.36 | 12.20 | 12.03 | 12.41 | 0.83 | 0.68 | 0.96 | 0.44 | 0.0828 | 0.0428 | 0.1474 |
| UGC06667 | 9.15 | 0.63 | 0.21 | 1.03 | 11.41 | 11.18 | 11.72 | 0.88 | 0.76 | 0.98 | 1.57 | 0.0113 | 0.0029 | 0.0275 |
| UGC06786 | 10.87 | 0.57 | 0.49 | 0.65 | 12.22 | 12.10 | 12.37 | 1.05 | 0.94 | 1.16 | 1.47 | 0.1669 | 0.1166 | 0.2240 |
| UGC06787 | 10.99 | 0.43 | 0.38 | 0.47 | 12.17 | 12.10 | 12.24 | 1.19 | 1.12 | 1.26 | 27.20 | 0.2041 | 0.1410 | 0.2737 |
| UGC06917 | 9.83 | 0.46 | 0.18 | 0.78 | 11.46 | 11.23 | 11.77 | 0.93 | 0.79 | 1.05 | 0.75 | 0.0438 | 0.0137 | 0.1163 |
| UGC06923 | 9.46 | 0.30 | 0.11 | 0.59 | 11.20 | 10.83 | 11.68 | 0.94 | 0.78 | 1.08 | 0.85 | 0.0194 | 0.0035 | 0.0809 |
| UGC06930 | 9.95 | 0.68 | 0.28 | 1.02 | 11.15 | 10.93 | 11.38 | 0.99 | 0.86 | 1.12 | 0.33 | 0.2057 | 0.0617 | 0.4919 |
| UGC06973 | 10.73 | 0.18 | 0.16 | 0.20 | 12.83 | 12.24 | 13.53 | 0.86 | 0.65 | 1.06 | 1.11 | 0.0032 | 0.0006 | 0.0126 |
| UGC06983 | 9.72 | 0.76 | 0.38 | 1.06 | 11.31 | 11.11 | 11.57 | 1.00 | 0.85 | 1.13 | 0.70 | 0.0767 | 0.0301 | 0.1557 |
| UGC07089 | 9.55 | 0.44 | 0.13 | 1.05 | 10.68 | 9.71 | 11.15 | 0.91 | 0.75 | 1.13 | 1.01 | 0.1587 | 0.0203 | 3.9876 |
| UGC07125 | 9.43 | 0.28 | 0.09 | 0.57 | 10.46 | 10.33 | 10.60 | 0.91 | 0.81 | 1.01 | 1.08 | 0.1392 | 0.0239 | 0.3678 |
| UGC07151 | 9.36 | 0.84 | 0.58 | 1.06 | 10.77 | 10.45 | 11.14 | 0.95 | 0.80 | 1.07 | 2.64 | 0.1613 | 0.0586 | 0.4149 |
| UGC07399 | 9.06 | 0.84 | 0.45 | 1.10 | 11.39 | 11.17 | 11.70 | 1.13 | 1.01 | 1.23 | 1.74 | 0.0163 | 0.0066 | 0.0315 |
| UGC07524 | 9.39 | 0.50 | 0.17 | 0.94 | 11.00 | 10.77 | 11.27 | 0.87 | 0.75 | 0.97 | 0.94 | 0.0657 | 0.0155 | 0.1930 |
| UGC07559 | 8.04 | 0.53 | 0.15 | 1.02 | 9.31 | 8.70 | 9.76 | 1.08 | 0.92 | 1.27 | 1.29 | 0.1263 | 0.0185 | 1.0510 |
| UGC07603 | 8.58 | 0.53 | 0.20 | 0.88 | 11.01 | 10.70 | 11.44 | 0.97 | 0.82 | 1.11 | 1.62 | 0.0084 | 0.0021 | 0.0224 |
| UGC07690 | 8.93 | 0.89 | 0.66 | 1.08 | 10.18 | 9.87 | 10.53 | 1.09 | 0.94 | 1.25 | 0.48 | 0.1986 | 0.0754 | 0.4751 |
| UGC07866 | 8.09 | 0.66 | 0.22 | 1.06 | 9.31 | 8.78 | 9.80 | 1.14 | 0.97 | 1.30 | 0.23 | 0.1754 | 0.0266 | 0.9472 |
| UGC08286 | 9.10 | 0.94 | 0.61 | 1.13 | 10.90 | 10.78 | 11.05 | 1.11 | 1.02 | 1.20 | 2.13 | 0.0801 | 0.0490 | 0.1160 |
| UGC08490 | 9.01 | 0.92 | 0.58 | 1.12 | 10.79 | 10.64 | 10.99 | 1.15 | 1.01 | 1.27 | 0.29 | 0.0746 | 0.0425 | 0.1147 |
| UGC08550 | 8.46 | 0.79 | 0.42 | 1.07 | 10.51 | 10.33 | 10.74 | 1.05 | 0.93 | 1.16 | 0.66 | 0.0314 | 0.0154 | 0.0546 |
| UGC08699 | 10.70 | 0.56 | 0.51 | 0.60 | 11.95 | 11.75 | 12.21 | 0.99 | 0.85 | 1.11 | 1.13 | 0.1982 | 0.1076 | 0.3284 |
| UGC09037 | 10.84 | 0.11 | 0.04 | 0.20 | 11.91 | 11.74 | 12.13 | 0.87 | 0.74 | 0.98 | 1.03 | 0.0381 | 0.0101 | 0.0852 |
| UGC09133 | 11.45 | 0.47 | 0.44 | 0.50 | 12.22 | 12.18 | 12.25 | 0.99 | 0.92 | 1.05 | 8.84 | 0.5423 | 0.4231 | 0.6673 |
| UGC10310 | 9.24 | 0.73 | 0.30 | 1.06 | 10.67 | 10.42 | 10.96 | 1.02 | 0.88 | 1.14 | 0.49 | 0.1258 | 0.0341 | 0.3281 |
| UGC11820 | 8.99 | 0.52 | 0.17 | 0.90 | 11.15 | 11.04 | 11.28 | 0.74 | 0.65 | 0.81 | 2.20 | 0.0221 | 0.0079 | 0.0377 |
| UGC11914 | 11.18 | 0.64 | 0.61 | 0.67 | 13.04 | 12.44 | 13.67 | 0.75 | 0.58 | 0.94 | 2.55 | 0.0492 | 0.0110 | 0.2009 |
| UGC12506 | 11.14 | 0.97 | 0.66 | 1.14 | 12.14 | 11.96 | 12.33 | 0.99 | 0.84 | 1.13 | 0.67 | 0.5698 | 0.2753 | 0.9742 |
| UGC12632 | 9.11 | 0.66 | 0.23 | 1.04 | 10.73 | 10.56 | 10.92 | 0.98 | 0.87 | 1.09 | 0.41 | 0.0878 | 0.0252 | 0.1817 |
| UGC12732 | 9.22 | 0.54 | 0.18 | 0.95 | 11.11 | 10.96 | 11.30 | 0.92 | 0.80 | 1.02 | 0.29 | 0.0361 | 0.0109 | 0.0741 |
| UGCA281 | 8.29 | 0.66 | 0.28 | 1.01 | 9.86 | 9.36 | 10.46 | 1.04 | 0.88 | 1.18 | 0.89 | 0.0382 | 0.0054 | 0.1712 |
| UGCA444 | 7.08 | 0.61 | 0.21 | 1.02 | 9.62 | 9.19 | 10.14 | 1.08 | 0.91 | 1.25 | 0.55 | 0.0088 | 0.0018 | 0.0316 |