LAPTH-050/18
Probing the Fermi-LAT GeV excess with gravitational waves
Abstract
If the gamma-ray excess towards the inner Galaxy (GCE) detected in Fermi-LAT data is due to millisecond pulsars (MSPs), one expects an associated gravitational wave (GW) signal, whose intensity exceeds the disk MSP population emission by an order of magnitude. We compute the expected GW counterpart of the bulge MSP population based on fits of the GCE, and estimate the sensitivity reach of current and future terrestrial GW detectors. The bounds on the average population ellipticity are competitive with the existing ones derived by LIGO/Virgo towards known MSPs. With a 10-year data taking in current LIGO/Virgo configuration, one would detect a signal at the level , while would be attainable with a similar data taking period with a third generation GW detector. This sensitivity should be sufficient for crucial diagnostics on the GCE interpretation in terms of MSPs.
Introduction: The detection of the binary neutron star merger GW170817 has ushered us in the era of multi-messenger astronomy with the use of gravitational waves (GWs) Abbott et al. (2017a, b). In the near future, the exploration and clarification of astrophysical events and processes via the combined use of different messengers is expected to become a routine tool for understanding “celestial labs”.
Here, we focus on the perspectives of such an approach for elucidating the nature of the so-called Galactic Center Excess (GCE), inferred at GeV energies from several, independent analyses of Fermi-LAT gamma-ray data collected from the inner part of our Galaxy (see e.g. Gordon and Macias (2013); Calore et al. (2015a); Ackermann et al. (2017)).
This intriguing signal roughly shares many of the properties (spectrum, intensity and morphology) expected for annihilation of weakly-interacting dark matter particles, and has thus raised the interest of the astroparticle physics community in the last decade, see e.g. Daylan et al. (2016); Calore et al. (2015b). However, a number of arguments (clustering of the photon counts Bartels et al. (2016); Lee et al. (2016), tracing of the stellar mass in the bulge Macias et al. (2018); Bartels et al. (2018a), possible correlation with 511 keV emission Bartels et al. (2018b)) has been collected, suggesting rather an astrophysical origin of (most of) the excess emission. According to different analyses, the cumulative emission of point sources too faint to be detected individually by the LAT represents the dominant contribution to the GCE. If added to the similarity of the GCE spectrum to the one of gamma-ray millisecond pulsars (MSP) Abazajian (2011), a still unknown, sub-threshold population of MSPs in the Galactic bulge emerges as the leading culprit for the CGE. By itself, the observed GCE properties raise some interesting questions on the underlying progenitors of this new MSP population (see for instance the discussion in Ploeg et al. (2017); Eckner et al. (2018)). However, alternative astrophysical scenarios (see e.g. Petrović et al. (2014); Cholis et al. (2015); Gaggero et al. (2015)) are still viable, in particular if contributing only partially to the GCE. The conjectured origin in an MSP population thus awaits confirmation from a source identification at some other wavelength, notably radio Calore et al. (2016) or X-rays.
Since MSPs are primary targets for terrestrial GW detectors, it is natural to wonder if the GW window may offer some complementary insights on the GCE nature. Hence our question: Under the hypothesis that the GCE is due to MSPs, what is the expected signal in GWs?
In this Letter we explore what is the sensitivity of current and third generation GW detectors to a population of MSPs in the Galactic bulge. The spatial distribution and total number of MSPs are based on fits to the GCE properties, while the period distribution is taken from recent analyses of radio MSPs. We show that the prospects to probe this new population are very good and competitive with other, currently performed, GW searches.
The expected GW signal from MSPs: Neutron star high rotation velocities make any irregularity in their shape a quadrupolar source of GWs. This “monochromatic”, continuous, emission is often considered the leading GW signal associated to pulsars (young and MSP alike) Ipser (1971), and the only one we consider in the following. However, we note that the GW signal from spinning neutron stars could also be induced by other mechanisms Andersson (1998); Owen et al. (1998) which we neglect, but that would further enhance the GW signal expected. In this respect, our estimate is conservative.
For a non-precessing triaxial body, rotating about its principal axis , the mass quadrupole is dominated by the - component of the moment of inertia tensor, , and usually parameterized in terms of the ellipticity ,
| (1) |
where in practice , and , for which a rather conservative value Worley et al. (2008) is kg m2, as adopted in the following. The GWs emitted by a star rotating with period and having ellipticity have frequency and luminosity
| (2) |
Currently, the most sensitive search for GW emitted by known pulsars has been reported in Abbott et al. (2017c), using O1 Advanced LIGO data. Single pulsar upper limits range from (10-1) to (10-8), with the bounds on most of the MSPs falling in the range between and . While no detection has been reported, for relatively slow rotators, sometimes, these bounds surpass those inferred from spin-down arguments Abbott et al. (2017c), although, for most MSPs, the typical limits from spin-down are actually about one order of magnitude stronger than current GW ones Abbott et al. (2017c). Interestingly enough, however, there are indications suggesting that MSPs have a minimum ellipticity (see Woan et al. (2018)), thus implying that most MSPs spin down because of GW emission rather than magnetic braking.
Besides single source signals, the population of rotating neutron stars can contribute to the so-called stochastic GW background (SGWB) Giazotto et al. (1997); de Freitas Pacheco and Horvath (1997); Regimbau and de Freitas Pacheco (2001). The SGWB is believed to arise mostly from the superposition of GWs from a large number of unresolved sources. The status of the art in current searches and sensitivities to the SGWB is reported in Abbott et al. (2017d) and Abbott et al. (2017e), for an isotropic and directional background, respectively, both based on the LIGO run O1. None of these searches has found evidence for a signal, and therefore they only set upper limits assuming a specific frequency spectrum. As we shall argue, despite being ignored till now, we expect the MSP population in the Galactic bulge to be the strongest Galactic SGWB component in the LIGO/Virgo sensitivity band. Below, we estimate the current sensitivity to this signal and forecast the reach of future terrestrial detectors.
GW from MSPs in the bulge: Compared to other contributors to the SGWB, the one associated to the GCE is very anisotropic, peaking at the GC. Our modelling of the MSP population in the Galactic bulge is based on gamma-ray results from analyses of the MSP source population Bartels et al. (2018c); Ploeg et al. (2017) and GCE Calore et al. (2015a); Bartels et al. (2018a). The MSP spatial distribution matches the spatial properties of the GCE, namely it follows a power-law –with a slope of about 2.5– with exponential cutoff at about 3 kpc Calore et al. (2015a).111Including the oblateness of the GCE profile, as found in Bartels et al. (2018a), will have only a negligible impact on our estimate, given the poor angular resolution of GW detectors. The total number of sources is set by the GCE intensity and the MSP luminosity function. We adopt the most recent estimate of the GCE intensity (0.1 – 100 GeV) from Bartels et al. (2018a), erg/s. As for the MSP gamma-ray luminosity function, this has been derived recently from detected MSPs in the Galactic disk Bartels et al. (2018c); Ploeg et al. (2017). Under the hypothesis that the GCE emission is all due to bulge MSPs and that the gamma-ray luminosity function of bulge MSPs is the same as the one of disk MSPs, we find that in total there are about MSPs in the bulge, when adopting the best-fit parameterisation (i.e. broken power-law) of the luminosity function from Bartels et al. (2018c).222For the best-fit parameters of a log-normal distribution and , we find instead . We also mention that Ref. Ploeg et al. (2017) estimates , above for the GCE intensity from Macias et al. (2018). Typically, the gamma-ray luminosity function is especially uncertain at low luminosities and therefore the total number of sources can depend on the minimal luminosity assumed, . However, for the actual problem at hand the total number of sources varies very mildly with . We note that an alternative way to estimate the number of MSPs in the bulge is to use instead the radio luminosity function of MSPs in globular clusters. Following Ref. Calore et al. (2016), the total numbers of MSPs expected in the bulge would be about 104, hence of the same order of magnitude.
Given the poor angular resolution of LIGO/Virgo, the details of the spatial distribution of the sources are irrelevant for the prediction of the GW signal, which thus results almost indistinguishable from a single source located at the GC with a characteristic frequency spectrum. In what follows, we assume a semi-aperture of the pointing cone of . A posteriori, this is a slightly conservative estimate of the angular resolution (see below). Moreover, we note that integrating over a larger would imply a moderately larger signal (see Appendix), thus making the estimates below conservative also in this respect.
From the definition of the GW power spectral density (see e.g. Talukder et al. (2014)333The additional factor of 2 that we include in Eq. 3, with respect to Ref. Talukder et al. (2014), is required by the sum over the two GW polarisations.), we write:
| (3) |
is the differential number of sources at a line of sight (l.o.s.) distance within a cone of semi-aperture around the GC. is the probability density function of MSP frequencies. As for , Eq. 3 is valid under the assumption that they do not depend on frequency and position of the sources. If they are not constant, the parameters have to be intended as appropriate averages over the population in the sightlines and angular region probed. For illustrative purposes, we also define the number
| (4) |
which coincides with the total number of sources in the limit in which they are all concentrated at the GC (point-like approximation), i.e. if:
| (5) |
Below, we set the GC distance to kpc. Note that is given per unit frequency, Hz-1, and it is linearly proportional to the effective number of sources, , and to the squared ellipticity, .
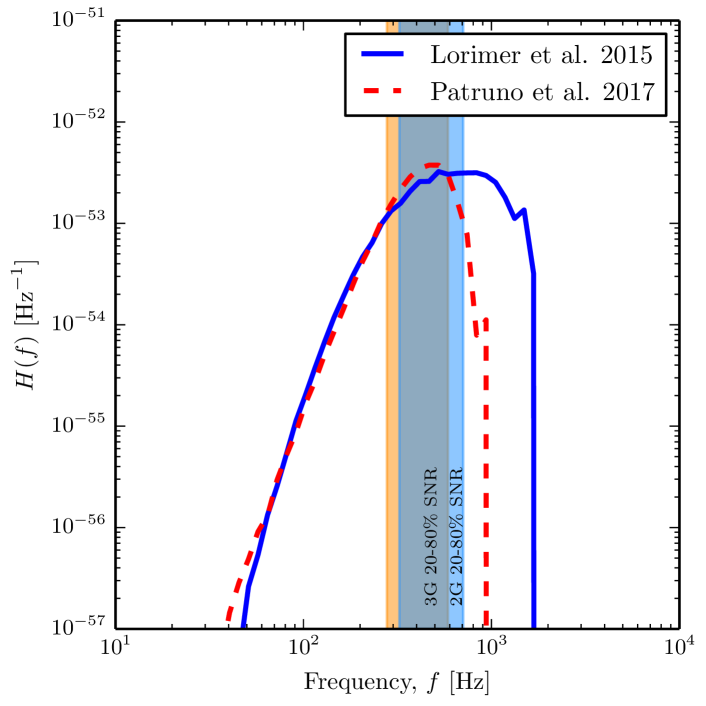
As for the period distribution, which determines the functional dependence of in Eq. 3, we adopt two possible parameterizations: The first is a log-normal distribution from Ref. Lorimer et al. (2015), obtained by a fit to radio MSPs; the second is a Weibull distribution from a more recent statistical analysis of spin frequencies of an extended sample of radio MSPs Patruno et al. (2017). The corresponding are displayed in Fig. 1, where we assume , consistently with current upper limits for most of the pulsars analyzed in Ref. Abbott et al. (2017c), and .
Till now, we have assumed that the bulge MSP component dominates with respect to the MSP disk population. However, we have checked that this is indeed the case, when integrating the total number of MSPs (disk and bulge) along the sightline. To model disk MSPs we adopt the best-fit model of Ref. Bartels et al. (2018c), namely a Lorimer-disk spatial distribution, a broken power-law luminosity function, and the same period distribution as for bulge MSPs. The total number of disk MSPs is about , 3500 of which contained in a cone of 10∘ semi-aperture towards the GC direction. In the direction of the GC, disk MSPs amount to about 10% of bulge MSPs. (For a more detailed description with further quantitative results, we refer the interested reader to the Appendix.) Although the bulge signal dominance over the disk one has been illustrated for a specific model, we believe that it is valid in general, for any viable interpretation of the GCE in terms of unresolved MSPs in the bulge. Ultimately, our conclusion relies on the empirical argument that—contrarily to the GCE—there is no evidence, yet, for a “Galactic Disk Excess” in the gamma-ray band that could be attributed to MSPs, see in particular A.3.3 in Bartels et al. (2018a).
Sensitivity of LIGO/Virgo: The methods used to search for the SGWB make minimal assumptions on the morphology of the signal, relying instead on excess coherence in the cross-correlated data streams from multiple detectors, as opposed to the independent and uncorrelated individual detector noise. To probe anisotropies in the SGWB, the standard method is the GW radiometer which is analogous to aperture synthesis used in radio astronomy Ballmer (2006). By applying appropriate time-varying delays between detectors it is possible to map the angular power distribution in a pixel or spherical harmonic basis.
The detectability for a pair of detectors with given noise power spectral densities scales with and depends on the observation time as (see Eq. 16 of Ballmer (2006)). Using the calculated in the previous section and assuming the parameterization of Lorimer et al. (2015), we obtain
| (6) |
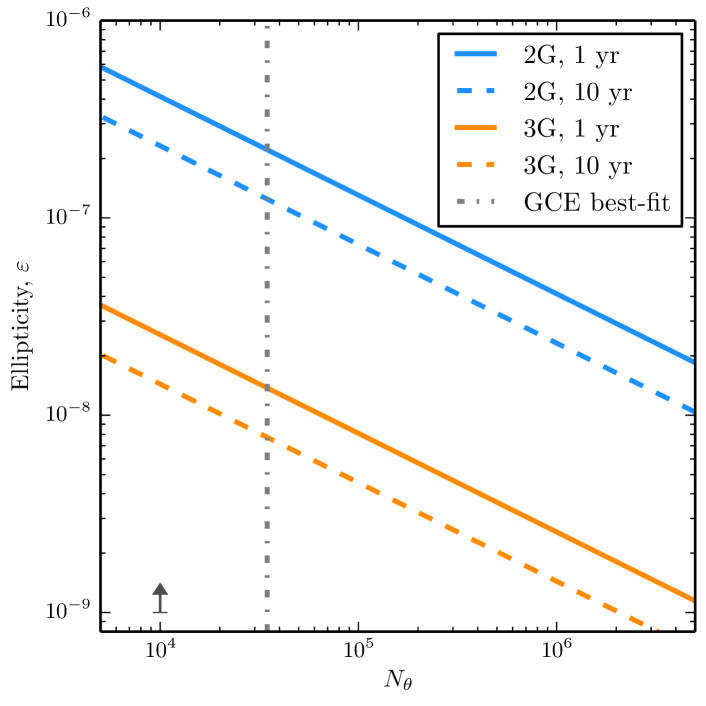
where the first number refers to a network composed of the two LIGO detectors at Hanford and Livingston and Virgo, all at their designed sensitivity (hereafter 2G detectors); the number in curly brackets corresponds to third generation detectors (3G), such as Einstein telescope Punturo et al. (2010) or Cosmic Explorer Abbott et al. (2017f). In particular, in Eq. 6 we assume two Cosmic Explorer detectors at the actual LIGO sites and one Einstein Telescope at the actual Virgo site. In Fig. 2, we show the sensitivity (i.e. ) of current (2G, top blue curves) and future (3G, bottom orange curves) GW detectors vs. , for 1 year (solid curves) or 10 years (dashed curves). For the benchmark value of , corresponding to the total number of MSP in the bulge in the approximation of Eq. 5 and illustrated with a vertical dashed line, we obtain that a signal from bulge MSPs with is observable at after one year (ten years) at 2G, while at 3G in the same time one attains , respectively. We stress that the search discussed here is directly sensitive to a population average of , contrarily to single source searches.
Concerning the sensitivity to MSP population models, the rightmost and leftmost vertical bands in Fig. 1 show the frequency ranges contributing to the central 60% (from 20% to 80%) of the for the 2G and 3G detectors, respectively, for the case Lorimer et al. (2015). Namely, all contribute to 20% of the , and all to another 20%. If we were to use instead the parameterization of Patruno et al. (2017), the would only drop by 10% (5%) for 2G (3G) detectors, with a narrowing of the band by 60%, essentially due to a lower caused by the predicted drop of at high frequency. Note that the most sensitive frequencies are around 400 Hz, hence we expect the diffraction-limited spot size on the sky to be , see Abbott et al. (2017e), consistently with the angular scale considered here.
Discussion and conclusions: Motivated by the gamma-ray indications for the existence of a population of unresolved sources –most likely MSPs– in the Galactic bulge Bartels et al. (2016); Lee et al. (2016); Bartels et al. (2018a); Macias et al. (2018), we have shown that the collective GW signal generated by MSPs at the GC would indeed constitute the dominant “Galactic diffuse” background due to MSPs, as opposed to the disk population conventionally searched for. This newly discussed target would thus represent the leading Galactic SGWB component in the LIGO/Virgo sensitivity region, and as such should be considered as a benchmark of primary interest in future studies. The possible discovery of this signal would also provide an independent evidence that the GCE arises from unresolved point sources, rather than from dark matter particle annihilation. The sensitivity to such a signal in the current generation of detectors (2G), which we estimate at in one year, is already comparable to the targeted searches towards known MSPs reported in O1 Abbott et al. (2017c). With detectors of the third generation, one may improve the sensitivity to by more than one order of magnitude. If the ellipticities are comparable to current bounds from spin-down, one may expect a GW discovery in 3G detectors. A null detection in 3G would support a lower value for , maybe close to the lower limit of derived in Woan et al. (2018).
Within the same time frame, targeted studies towards nearby MSPs (such as PSR J1643-1224 and PSR J0711-6830) should lead to a detection at least in 3G Woan et al. (2018): Our study thus opens the perspective of an interesting interplay between the GW knowledge from specific nearby disk MSPs and studies of the putative bulge MSP population, even for a null result for the latter. If the first individual MSPs will be identified in GW in the current 2G run, hence around , there are good perspectives that the 3G may detect the unresolved bulge contribution as well. On the other hand, if the latter is not revealed, one might have to revise the hypothesis that the bulge population has the same period distribution as the disk one444We stress, in fact, that the inference of an MSP origin for the GCE (as opposed to a new population of pulsars with its own characteristics, or an alternative class of astrophysical objects and processes) is only circumstantial. Lacking single source identifications and period measurements, we adopted period estimates taken from the disk MSP population to gauge the GW signal level associated to the GCE. , or the currently favored interpretation of the GCE in terms of MSPs altogether. If no GW detection of single nearby MSP will be announced in the 2G run Woan et al. (2018), the average ellipticity will be likely lower than 10-8 (see Fig.3 of Abbott et al. (2017c)) and therefore we expect that no detection of the bulge population will take place at 3G either. In that case, it is the eventual detection of a bulge signal which would profoundly shake the foundation of the current MSP interpretation of the GCE. While speculative, this possibility is not necessarily far-fetched: here, for instance, we have neglected any contribution from a young pulsar population in the bulge.
At the same time, MSP radio searches are ongoing and expected to dig into the bulge population in the next few years with the operation of the MeerKAT (and later SKA) telescope. Of course, a discovery of bulge pulsars at radio frequencies and the measure of their period and spatial distribution will motivate a revisitation of the current calculations and strengthen the rationale for a dedicated GW pulsar search towards the inner Galaxy.
Acknowledgments: We thank C. Weniger and G. Zaharijas for comments on the manuscript, and T. D. P. Edwards for fruitful discussions. FC and PDS acknowledge support from Agence Nationale de la Recherche under the contract ANR-15-IDEX-02, project “Unveiling the Galactic centre mystery”, GCEM (PI: F. Calore).
References
- Abbott et al. (2017a) B. Abbott et al. (Virgo, LIGO Scientific), Phys. Rev. Lett. 119, 161101 (2017a), arXiv:1710.05832 [gr-qc] .
- Abbott et al. (2017b) B. P. Abbott et al. (GROND, SALT Group, OzGrav, DFN, INTEGRAL, Virgo, Insight-Hxmt, MAXI Team, Fermi-LAT, J-GEM, RATIR, IceCube, CAASTRO, LWA, ePESSTO, GRAWITA, RIMAS, SKA South Africa/MeerKAT, H.E.S.S., 1M2H Team, IKI-GW Follow-up, Fermi GBM, Pi of Sky, DWF (Deeper Wider Faster Program), Dark Energy Survey, MASTER, AstroSat Cadmium Zinc Telluride Imager Team, Swift, Pierre Auger, ASKAP, VINROUGE, JAGWAR, Chandra Team at McGill University, TTU-NRAO, GROWTH, AGILE Team, MWA, ATCA, AST3, TOROS, Pan-STARRS, NuSTAR, ATLAS Telescopes, BOOTES, CaltechNRAO, LIGO Scientific, High Time Resolution Universe Survey, Nordic Optical Telescope, Las Cumbres Observatory Group, TZAC Consortium, LOFAR, IPN, DLT40, Texas Tech University, HAWC, ANTARES, KU, Dark Energy Camera GW-EM, CALET, Euro VLBI Team, ALMA), Astrophys. J. 848, L12 (2017b), arXiv:1710.05833 [astro-ph.HE] .
- Gordon and Macias (2013) C. Gordon and O. Macias, Phys. Rev. D88, 083521 (2013), [Erratum: Phys. Rev.D89,no.4,049901(2014)], arXiv:1306.5725 [astro-ph.HE] .
- Calore et al. (2015a) F. Calore, I. Cholis, and C. Weniger, JCAP 1503, 038 (2015a), arXiv:1409.0042 [astro-ph.CO] .
- Ackermann et al. (2017) M. Ackermann et al. (Fermi-LAT), Astrophys. J. 840, 43 (2017), arXiv:1704.03910 [astro-ph.HE] .
- Daylan et al. (2016) T. Daylan, D. P. Finkbeiner, D. Hooper, T. Linden, S. K. N. Portillo, N. L. Rodd, and T. R. Slatyer, Phys. Dark Univ. 12, 1 (2016), arXiv:1402.6703 [astro-ph.HE] .
- Calore et al. (2015b) F. Calore, I. Cholis, C. McCabe, and C. Weniger, Phys. Rev. D91, 063003 (2015b), arXiv:1411.4647 [hep-ph] .
- Bartels et al. (2016) R. Bartels, S. Krishnamurthy, and C. Weniger, Phys. Rev. Lett. 116, 051102 (2016), arXiv:1506.05104 [astro-ph.HE] .
- Lee et al. (2016) S. K. Lee, M. Lisanti, B. R. Safdi, T. R. Slatyer, and W. Xue, Phys. Rev. Lett. 116, 051103 (2016), arXiv:1506.05124 [astro-ph.HE] .
- Macias et al. (2018) O. Macias, C. Gordon, R. M. Crocker, B. Coleman, D. Paterson, S. Horiuchi, and M. Pohl, Nat. Astron. 2, 387 (2018), arXiv:1611.06644 [astro-ph.HE] .
- Bartels et al. (2018a) R. Bartels, E. Storm, C. Weniger, and F. Calore, Nat. Astron. 2, 819 (2018a), arXiv:1711.04778 [astro-ph.HE] .
- Bartels et al. (2018b) R. Bartels, F. Calore, E. Storm, and C. Weniger, Mon. Not. Roy. Astron. Soc. 480, 3826 (2018b), arXiv:1803.04370 [astro-ph.HE] .
- Abazajian (2011) K. N. Abazajian, JCAP 1103, 010 (2011), arXiv:1011.4275 [astro-ph.HE] .
- Eckner et al. (2018) C. Eckner et al., Astrophys. J. 862, 79 (2018), arXiv:1711.05127 [astro-ph.HE] .
- Ploeg et al. (2017) H. Ploeg, C. Gordon, R. Crocker, and O. Macias, JCAP 1708, 015 (2017), arXiv:1705.00806 [astro-ph.HE] .
- Petrović et al. (2014) J. Petrović, P. D. Serpico, and G. Zaharijaš, JCAP 1410, 052 (2014), arXiv:1405.7928 [astro-ph.HE] .
- Cholis et al. (2015) I. Cholis, C. Evoli, F. Calore, T. Linden, C. Weniger, and D. Hooper, JCAP 1512, 005 (2015), arXiv:1506.05119 [astro-ph.HE] .
- Gaggero et al. (2015) D. Gaggero, M. Taoso, A. Urbano, M. Valli, and P. Ullio, JCAP 1512, 056 (2015), arXiv:1507.06129 [astro-ph.HE] .
- Calore et al. (2016) F. Calore, M. Di Mauro, F. Donato, J. W. T. Hessels, and C. Weniger, Astrophys. J. 827, 143 (2016), arXiv:1512.06825 [astro-ph.HE] .
- Ipser (1971) J. R. Ipser, Astrophys. J. 166, 175 (1971).
- Andersson (1998) N. Andersson, Astrophys. J. 502, 708 (1998), arXiv:gr-qc/9706075 [gr-qc] .
- Owen et al. (1998) B. J. Owen, L. Lindblom, C. Cutler, B. F. Schutz, A. Vecchio, and N. Andersson, Phys. Rev. D58, 084020 (1998), arXiv:gr-qc/9804044 [gr-qc] .
- Worley et al. (2008) A. Worley, P. G. Krastev, and B.-A. Li, Astrophys. J. 685, 390 (2008), arXiv:0801.1653 [astro-ph] .
- Abbott et al. (2017c) B. P. Abbott et al. (Virgo, LIGO Scientific), Astrophys. J. 839, 12 (2017c), [Erratum: Astrophys. J.851,no.1,71(2017)], arXiv:1701.07709 [astro-ph.HE] .
- Woan et al. (2018) G. Woan, M. D. Pitkin, B. Haskell, D. I. Jones, and P. D. Lasky, Astrophys. J. 863, L40 (2018), arXiv:1806.02822 [astro-ph.HE] .
- Giazotto et al. (1997) A. Giazotto, S. Bonazzola, and E. Gourgoulhon, Phys. Rev. D55, 2014 (1997), arXiv:astro-ph/9611188 [astro-ph] .
- de Freitas Pacheco and Horvath (1997) J. A. de Freitas Pacheco and J. E. Horvath, Phys. Rev. D56, 859 (1997), arXiv:astro-ph/9704155 [astro-ph] .
- Regimbau and de Freitas Pacheco (2001) T. Regimbau and J. A. de Freitas Pacheco, Astron. Astrophys. 376, 381 (2001), arXiv:astro-ph/0105260 [astro-ph] .
- Abbott et al. (2017d) B. P. Abbott et al. (Virgo, LIGO Scientific), Phys. Rev. Lett. 118, 121101 (2017d), [Erratum: Phys. Rev. Lett.119,no.2,029901(2017)], arXiv:1612.02029 [gr-qc] .
- Abbott et al. (2017e) B. P. Abbott et al. (Virgo, LIGO Scientific), Phys. Rev. Lett. 118, 121102 (2017e), arXiv:1612.02030 [gr-qc] .
- Bartels et al. (2018c) R. T. Bartels, T. D. P. Edwards, and C. Weniger, (2018c), 10.1093/mnras/sty2529, arXiv:1805.11097 [astro-ph.HE] .
- Talukder et al. (2014) D. Talukder, E. Thrane, S. Bose, and T. Regimbau, Phys. Rev. D89, 123008 (2014), arXiv:1404.4025 [gr-qc] .
- Lorimer et al. (2015) D. R. Lorimer et al., Mon. Not. Roy. Astron. Soc. 450, 2185 (2015), arXiv:1501.05516 [astro-ph.IM] .
- Patruno et al. (2017) A. Patruno, B. Haskell, and N. Andersson, Astrophys. J. 850, 106 (2017), arXiv:1705.07669 [astro-ph.HE] .
- Ballmer (2006) S. W. Ballmer, Gravitational waves. Proceedings, 6th Edoardo Amaldi Conference, Amaldi6, Bankoku Shinryoukan, June 20-24, 2005, Class. Quant. Grav. 23, S179 (2006), arXiv:gr-qc/0510096 [gr-qc] .
- Punturo et al. (2010) M. Punturo et al., Proceedings, 14th Workshop on Gravitational wave data analysis (GWDAW-14): Rome, Italy, January 26-29, 2010, Class. Quant. Grav. 27, 194002 (2010).
- Abbott et al. (2017f) B. P. Abbott et al. (LIGO Scientific), Class. Quant. Grav. 34, 044001 (2017f), arXiv:1607.08697 [astro-ph.IM] .
- (38) A. Matas et al., in preparation .
I Appendix
Contribution of disk MSPs: To model the two MSP populations in the Galaxy, one in the bulge and the other in the disk, we assume that the MSP emission is universal and, therefore, that the two populations share the same luminosity function, period distribution, average ellipticity and moment of inertia, but have distinct spatial distributions. This means that in Eq. 3 writes as , and in Eq. 4 writes as . These quantities are computed directly from a Monte Carlo simulation of the spatial distribution of MSP sources in the Galaxy, cut at the angle with respect to the GC direction (as seen from Earth), and binned as a function of distance along the line of sight. In Fig. 3 we show a cross-section of this simulation in the plane orthogonal to the Galactic disk and containing the Earth-GC line, with red (blue) dots representing the bulge (disk) MSPs fulfilling the geometrical constraint, while grey dots the MSPs outside the angular cut.

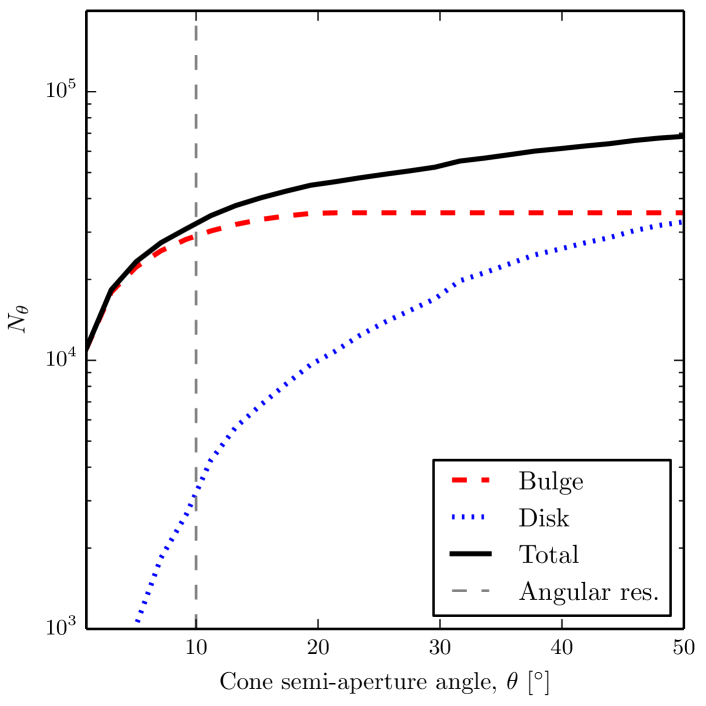
In Fig. 4, we show the effective number, , proportional to signal strength, as a function of . The plot clearly illustrates that the total signal is dominated by (bulge MSPs) up to very large values of . Also, note that almost saturates beyond , so that taking this angle as benchmark, while conservative, is not expected to lead to a large underestimate of the signal.
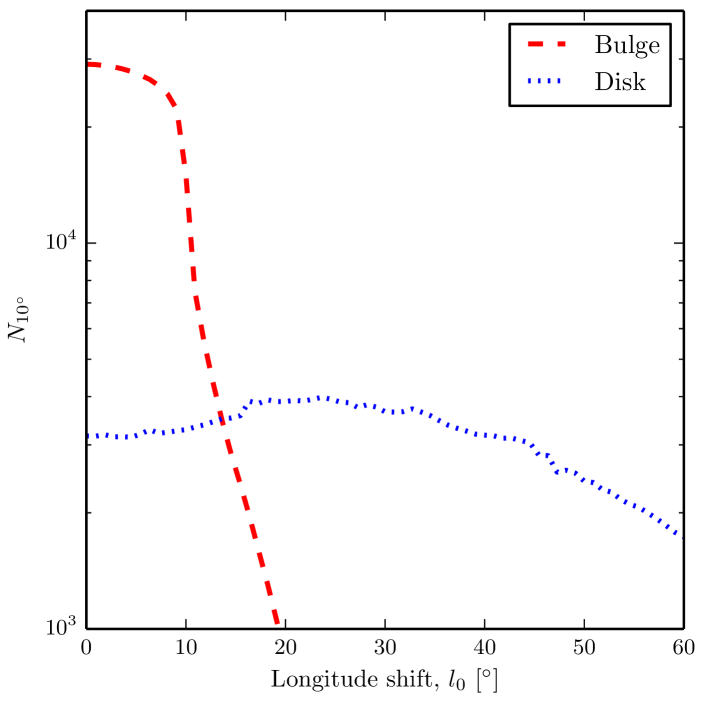
We also check that the GW signal induced by the MSP disk population along the Galactic plane –i.e. centering the cone at different longitudes, – is always subdominant with respect to the signal from the GC direction, see Fig. 5. This implies that the “point-like source” analysis applied here is maximally sensitive to the bulge MSP population.
The MSP disk population thus represents a sub-dominant contribution to both the unresolved gamma-ray and GW signals. At the same time, the two populations represent ideal targets for rather complementary search techniques, with the disk one more appropriately probed via anisotropic, SGWB methods Matas et al. .