Variable stars in Terzan 5: additional evidence of multi-age and multi-iron stellar populations 111Based on observations collected at the Very Large Telescope of the European Southern Observatory under program 097.D-0337. Also based on observations (GO 10845) with the NASA/ESA Hubble Space Telescope, obtained at the Space Telescope Science Institute, which is operated by AURA, Inc., under NASA contract NAS 5-26555.
Abstract
Terzan 5 is a complex stellar system in the Galactic bulge, harboring stellar populations with very different iron content ( dex) and with ages differing by several Gyrs. Here we present an investigation of its variable stars. We report on the discovery and characterization of three RR Lyrae stars. For these newly discovered RR Lyrae and for six Miras of known periods we provide radial velocity and chemical abundances from spectra acquired with X-SHOOTER at the VLT. We find that the three RR Lyrae and the three short period Miras (P300 d) have radial velocity consistent with being Terzan 5 members. They have sub-solar iron abundances and enhanced [/Fe], well matching the age and abundance patterns of the 12 Gyr metal-poor stellar populations of Terzan 5. Only one, out of the three long period (P300 d) Miras analyzed in this study, has a radial velocity consistent with being Terzan 5 member. Its super-solar iron abundance and solar-scaled [/Fe] nicely match the chemical properties of the metal rich stellar population of Terzan 5 and its derived mass nicely agrees with being several Gyrs younger than the short period Miras. This young variable is an additional proof of the surprising young sub-population discovered in Terzan 5.
1 Introduction
Terzan 5 (hereafter Ter5) is a stellar system commonly catalogued as a globular cluster located in the bulge of the Milky Way (MW). It is affected by large (Ortolani, Barbuy, & Bica, 1996; Barbuy et al., 1998; Valenti et al., 2007) and differential (Massari et al., 2012) reddening, with an average color excess E(B-V)=2.38. This stellar system also harbors an exceptionally large population of milli-second pulsars (MSPs; Ransom et al., 2005; Cadelano et al., 2018. See also the updated list at http://www.naic.edu/pfreire/GCpsr.html) and a proto-MSP (Ferraro et al., 2015).
Adaptive optics imaging with the VLT and near IR spectroscopy with Keck revealed the presence of two distinct red clumps in the color-magnitude diagram, that cannot be explained by differential reddening or distance effects, while they show very different iron abundances ([Fe/H]=0.2 and +0.3 dex, respectively, Ferraro et al., 2009). Subsequent spectroscopic studies (Origlia et al., 2011, 2013; Massari et al., 2014a, b) fully confirmed this finding and revealed an additional, minor (a few percent) stellar population (SP) of metal poor stars at [Fe/H] dex, bringing the overall metallicity range covered by the SPs of Ter5 to 1 dex. Note that such a large iron spread has never been observed in any Galactic globular cluster, with the only exception of Centauri in the halo, which is now believed to be the remnant of a dwarf galaxy accreted by the MW (see e.g. Bekki & Freeman, 2003; Bekki & Norris, 2006). The sub-solar SPs of Ter5, with peaks at [Fe/H] and 0.8 dex, are -enhanced and they likely formed early and quickly from a gas mainly polluted by type II supernovae (SNe). The super-solar component at [Fe/H]+0.3 dex is more centrally concentrated than the others (Ferraro et al., 2009; Lanzoni et al., 2010), and it has approximately solar [/Fe] ratio, requiring a progenitor gas polluted by both SNe II and SNe Ia on a longer timescale. Recently, by means of HST and ground-based adaptive optics deep imaging, we detected two distinct main-sequence turnoff points in Ter5, providing the age of the two main stellar populations (Ferraro et al., 2016): 12 Gyr for the (dominant) sub-solar component and 4.5 Gyr for the one at super-solar metallicity.
An intriguing scenario is emerging from these observational facts. (i) Ter5 is not a genuine globular cluster, nor the result of the merging of two globulars; (ii) it has experienced a complex star formation (SF) and chemical enrichment history, possibly characterized by short SF episodes (thus accounting for the small metallicity spread measured within each sub-population); (iii) Ter5 was originally much more massive (107 M⊙) than today (2106 M⊙, Lanzoni et al., 2010), thus able to retain the SN ejecta and also to explain its huge population of MSPs; (iv) Ter5 seems to have formed and evolved in deep connection with the bulge (Massari et al., 2015).
Indeed, there is a striking chemical similarity between the Ter5 and the bulge SPs, which show a metallicity distribution with two major peaks at sub-solar and super-solar [Fe/H] and a tail/minor peak towards lower metallicities (see e.g. Zoccali et al., 2008; Hill et al., 2011; Johnson et al., 2011; Rich, Origlia & Valenti, 2012; Ness et al., 2013a, b; Bensby et al., 2013, and also Johnson et al., 2014; Rojas-Arriagada et al., 2014; Gonzalez et al., 2015; Ryde et al., 2016; Jönsson et al., 2017; Schultheis et al., 2017). These bulge SPs also show [/Fe] enhancement up to about solar metallicity, and then a progressive decline towards solar [/Fe] at super-solar [Fe/H].
Among the mechanisms that could have contributed to form the Galactic bulge, early (gas & stars) merging, friction of massive clumps, proto-disk evaporation etc. have been proposed since several years (see e.g. Immeli et al., 2004; Carollo et al., 2007; Elmegreen, Bournaud & Elmegreen, 2008). More recently, it has been suggested that the giant clumps observed in high redshift galaxies (see e.g. Genzel et al., 2011; Tacchella et al., 2015) could have originated by the clustering of smaller, seed clumps with typical masses of -108 M⊙ (see e.g. Behrendi, Burkert & Schartmann, 2016), in a bottom-up scenario. In this framework (see e.g. Ferraro et al., 2016), the proto-Ter5 could have been one of those seed clumps that did not grow and merge into the Galactic bulge, but for some unknown reasons evolved in isolation and self-enriched. Very recently, McKenzie & Bekki (2018) suggested that the super-solar component of Ter5 could originated from the gas of a giant molecular cloud colliding with the proto-Ter5 some Gyrs ago.
An important and still unexplored tile of the Ter5 puzzle is its population of variable stars, which are independent and powerful tracers of SP properties. Indeed, as well known, while RR Lyrae trace old (10 Gyr) SPs, Mira stars with different pulsation periods and metallicity can trace SPs of different ages. Short period Miras (P300d) usually trace old SPs, while long period (P300d) ones are normally younger.
2 Searching for variables stars in Ter5
| header | RR1 | RR2 | RR3 | M1 | M2 | M3 | M4 | M5 | M6 |
|---|---|---|---|---|---|---|---|---|---|
| RA (h m s) | 17 48 02.8 | 17 48 08.2 | 17 48 04.3 | 17 47 59.5 | 17 48 09.3 | 17 48 07.2 | 17 48 03.4 | 17 47 54.3 | 17 47 53.2 |
| Dec (o ’ ”) | 24 47 47.5 | 24 45 42.1 | 24 47 37.7 | 24 47 17.6 | 24 47 06.3 | 24 46 26.6 | 24 46 42.0 | 24 49 54.6 | 24 44 34.0 |
| P (days) | 0.72 | 0.64 | 0.89 | 217 | 269 | 261 | 464 | 377 | 455 |
| Phasea | 0.70 | 0.49 | 0.63 | 0.61 | 0.38 | 0.51 | 0.73 | 0.42 | 0.35 |
| 6250 | 6000 | 6000 | 3100 | 3400 | 3000 | 3000 | 3100 | 3200 | |
| RVb | 77 | 98 | 92 | 89 | 95 | 75 | 119 | +162 | +48 |
| 0.720.03 | 0.710.03 | 0.670.01 | 0.270.01 | 0.330.05 | 0.260.07 | +0.320.01 | +0.270.01 | +0.310.05 | |
| +0.270.15 | +0.370.04 | +0.350.03 | +0.310.15 | +0.300.16 | +0.320.17 | +0.060.15 | 0.040.06 | 0.020.16 | |
| +0.390.16 | +0.360.15 | +0.370.03 | +0.380.15 | +0.400.16 | +0.300.17 | +0.020.03 | 0.030.15 | 0.050.06 | |
| +0.350.15 | +0.310.15 | +0.360.03 | +0.450.15 | +0.360.09 | +0.330.10 | -0.000.15 | 0.010.15 | 0.010.16 | |
| +0.220.15 | +0.310.15 | +0.290.15 | +0.350.02 | +0.250.05 | +0.330.09 | -0.060.03 | 0.060.07 | 0.020.16 | |
| +0.250.15 | +0.280.15 | +0.360.03 | +0.360.03 | +0.410.06 | +0.410.07 | -0.070.09 | +0.130.02 | 0.050.07 | |
| -0.070.15 | +0.040.15 | -0.070.15 | -0.010.15 | +0.010.16 | +0.080.17 | +0.000.03 | +0.070.15 | -0.010.16 | |
| – | – | – | +0.040.15 | +0.050.16 | -0.030.17 | 0.070.15 | 0.010.15 | 0.020.16 | |
| – | – | – | 0.060.15 | +0.020.19 | -0.060.17 | 0.020.15 | 0.030.15 | 0.070.16 | |
| – | – | – | +0.320.04 | +0.410.12 | +0.440.18 | 0.080.12 | 0.010.02 | +0.030.10 |
A systematic search for RR Lyrae in Ter5 is still missing. Edmonds et al. (2001) discovered one such candidate star by using HST-NICMOS. Recently, we used a sequence of 24 images acquired with the HST Wide Field Planetary Camera 2 (WFPC2), obtained through proposal GO-10845 (PI: Ferraro), to identify other candidates. Each image has an exposure time sec, 12 images have been obtained in the F606W and 12 in the F814W passbands.
In this data-set the planetary camera (with the highest spatial resolution of px-1) is roughly centered on the cluster core. The photometric reduction was performed independently for each image and chip by using DAOPHOT (Stetson, 1987) and following the approach adopted to study other dense stellar fields (e.g. Dalessandro et al., 2018). Briefly, dozens of bright and isolated stars have been selected in each image to model the point-spread function. A first star list was obtained for each image by independently fitting all the star-like sources at from the local background. A master-list including all stars detected in at least 13 (i.e. n/2+1) images was created and a fit was then forced at the corresponding positions in each frame by using ALLFRAME (Stetson, 1994). For each image, instrumental magnitudes were corrected for charge transfer efficiency by using the prescriptions described in Dolphin (2000). Different magnitude estimates were homogeneized by using DAOMATCH and DAOMASTER and were then reported to the VEGAMAG photometric system by following Holtzman et al. (1995) and related zeropoints. Instrumental coordinates were roto-translated to the absolute coordinate system by using the stars in common with the HST catalog used in Ferraro et al. (2009) as secondary astrometric standard and the cross-correlation software CataXcorr.
By taking advantage of the relatively large number of images in this data-set and the photometric quality of HST, we performed a detailed variability analysis of stars with magnitudes in the range (corresponding to the red clump magnitude level) looking for candidate RR Lyrae stars. The analysis of variable stars was carried out in the F606W and F814W bands, separately. As a first diagnostic to identify variables, we used the variability indicator provided by DAOPHOT. We selected only stars showing variability values significantly larger than those of the bulk of stars with similar magnitudes in both bands. Then, we checked visually their preliminary light-curves and considered only stars showing coherent evidence of variability in F606W and F814W. We identified in this way four candidate RR Lyrae. It turns out that one of them (RR4) corresponds to the candidate RR Lyrae star V1 found by Edmonds et al. (2001) by using near IR HST imagery. The other three are newly discovered candidate variables.
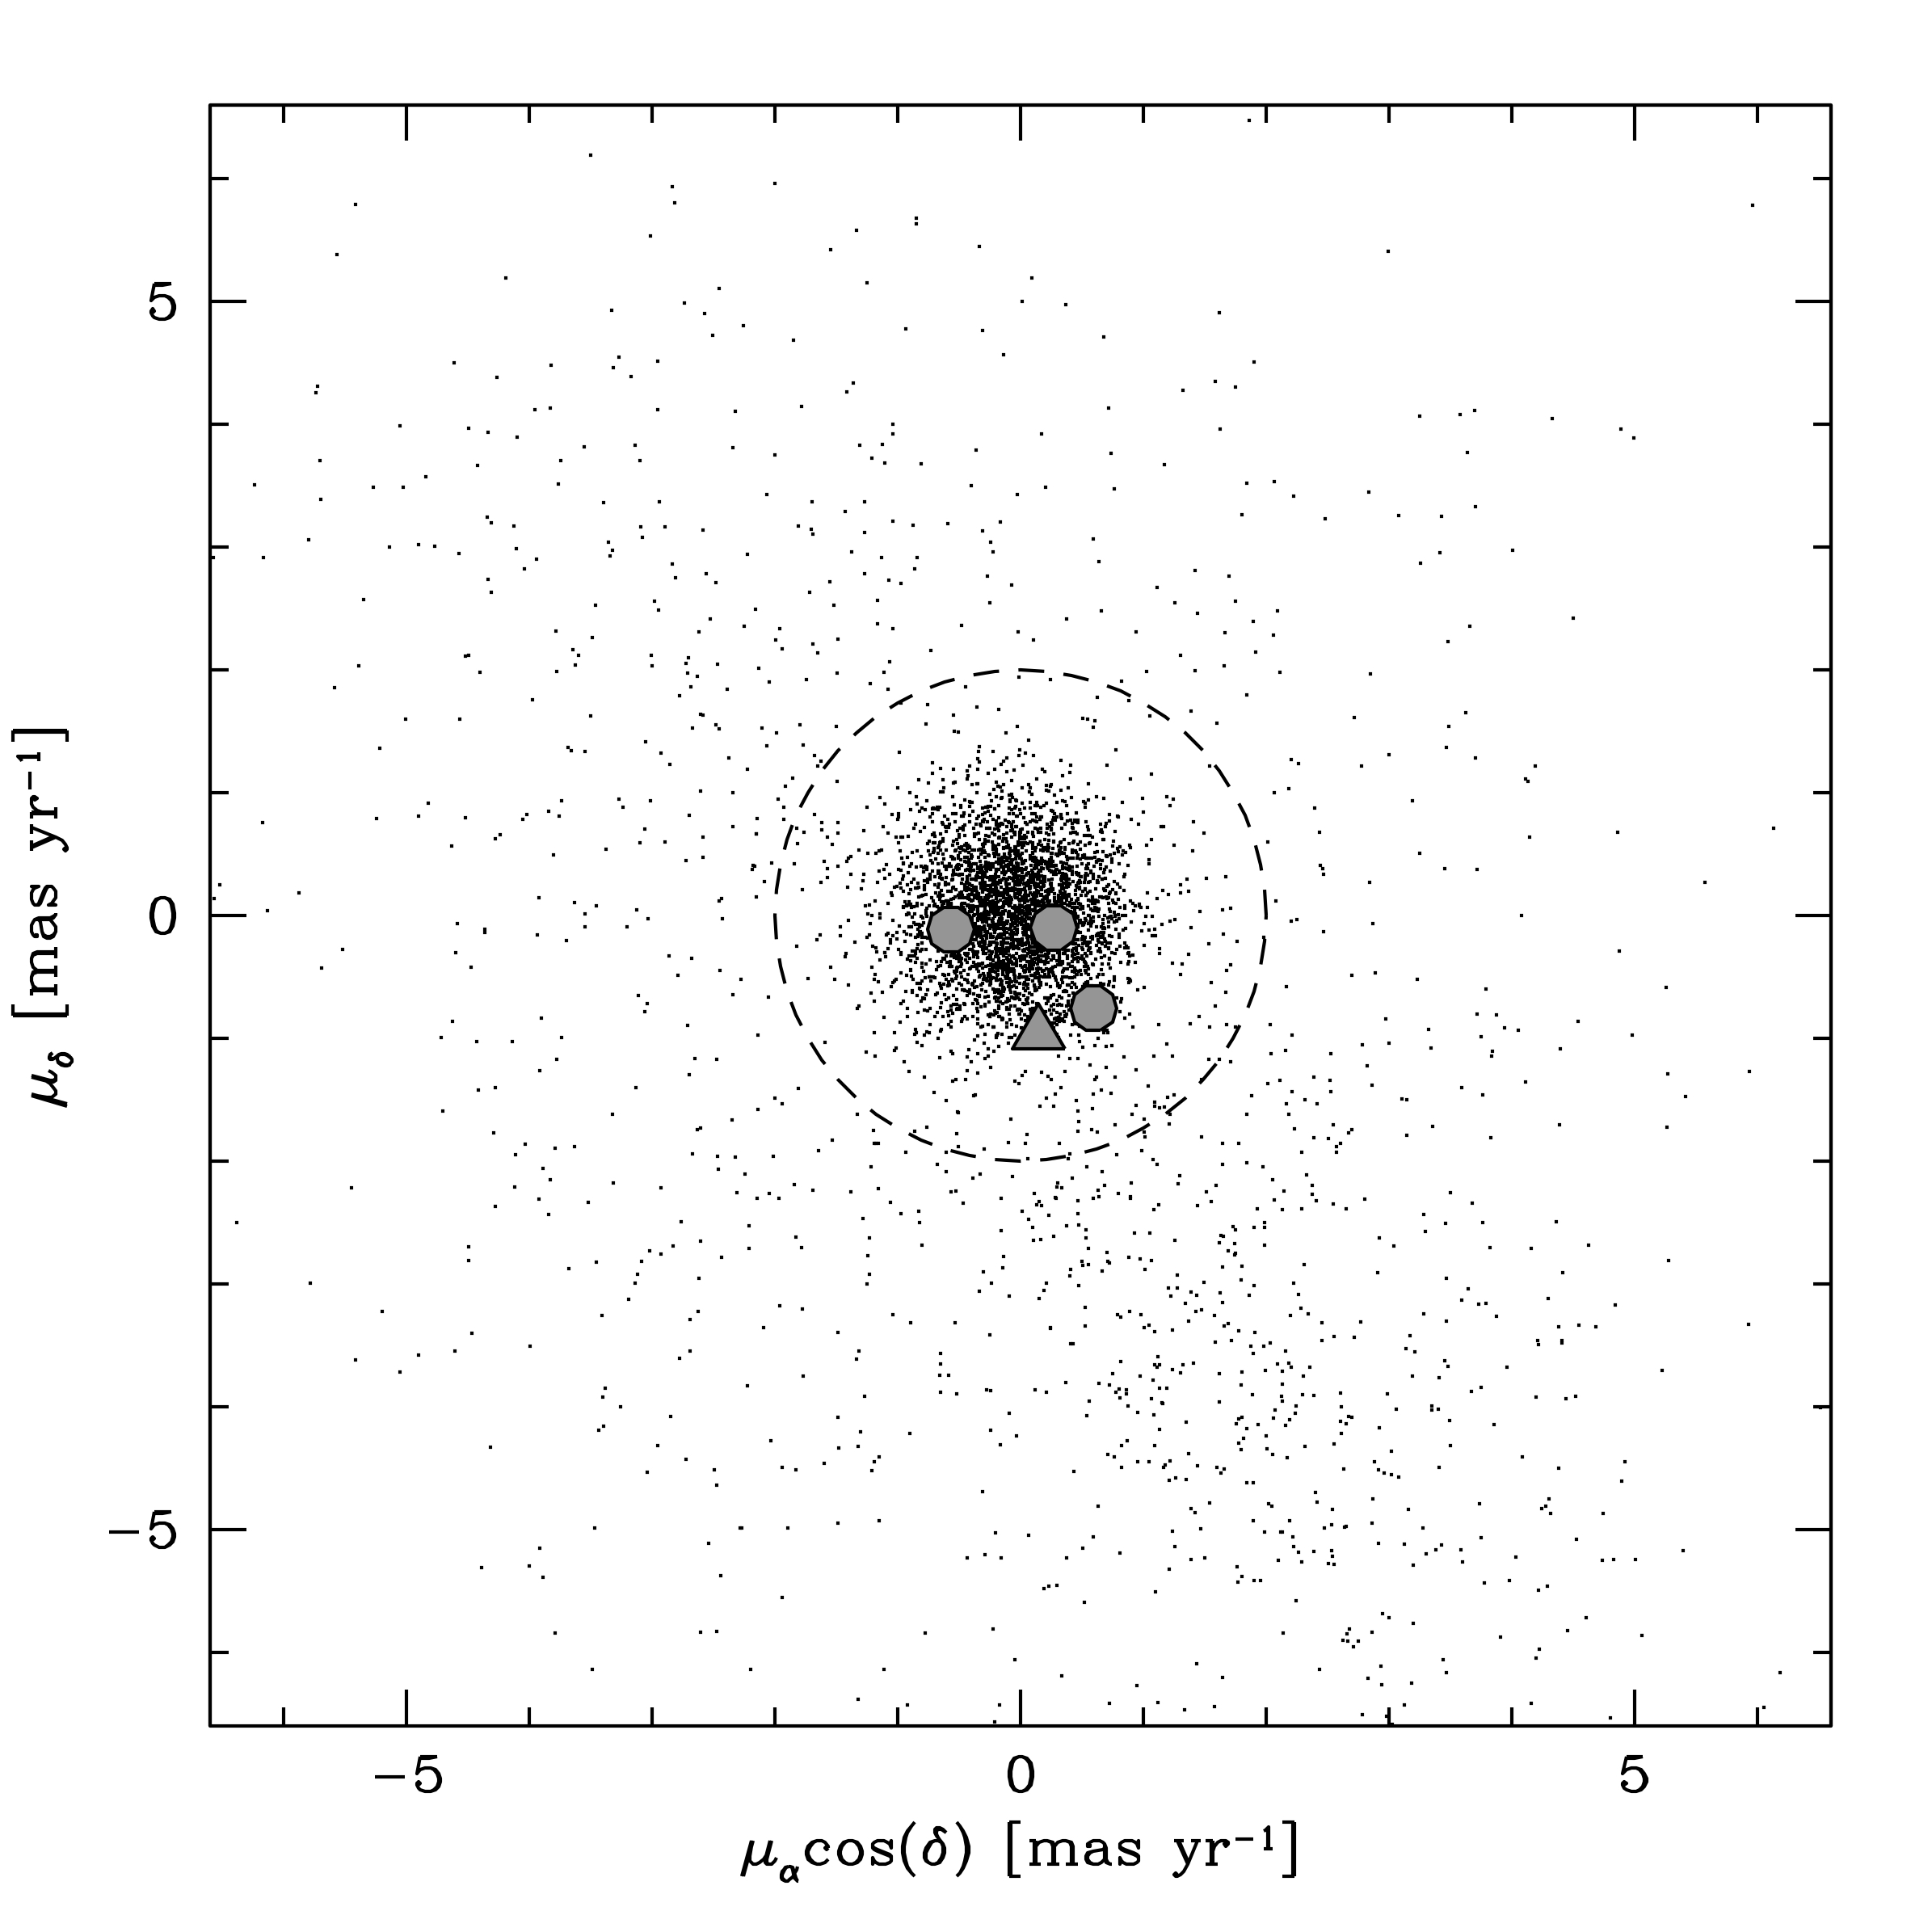
All the four variables are located in the central (where the contamination by bulge field giants is negligible, of the order of 2%; Massari et al., 2014a, b). For these stars there are HST proper motion estimates by Massari et al. (2015), and Fig. 1 shows the vector point diagram with the location of Ter5 stars and the four known RR Lyrae. The variables are well clumped within the bulk of the Ter5 distribution, thus providing a robust evidence for their membership. Because of the reddening, these variables are too faint to be measured by Gaia.
We analysed the light curves of the three new candidate RR Lyrae by using the Graphical Analyzer of Time Series (GRATIS2)222GRATIS2 is a private software developed at the Bologna Observatory by P. Montegriffo.. It uses both the Lomb periodogram (Lomb, 1976) and the best fit of the data with a truncated Fourier series (Barning, 1963). The final periods adopted to fold the light curves are those that minimize the rms scatter of the truncated Fourier series that best fit the data.
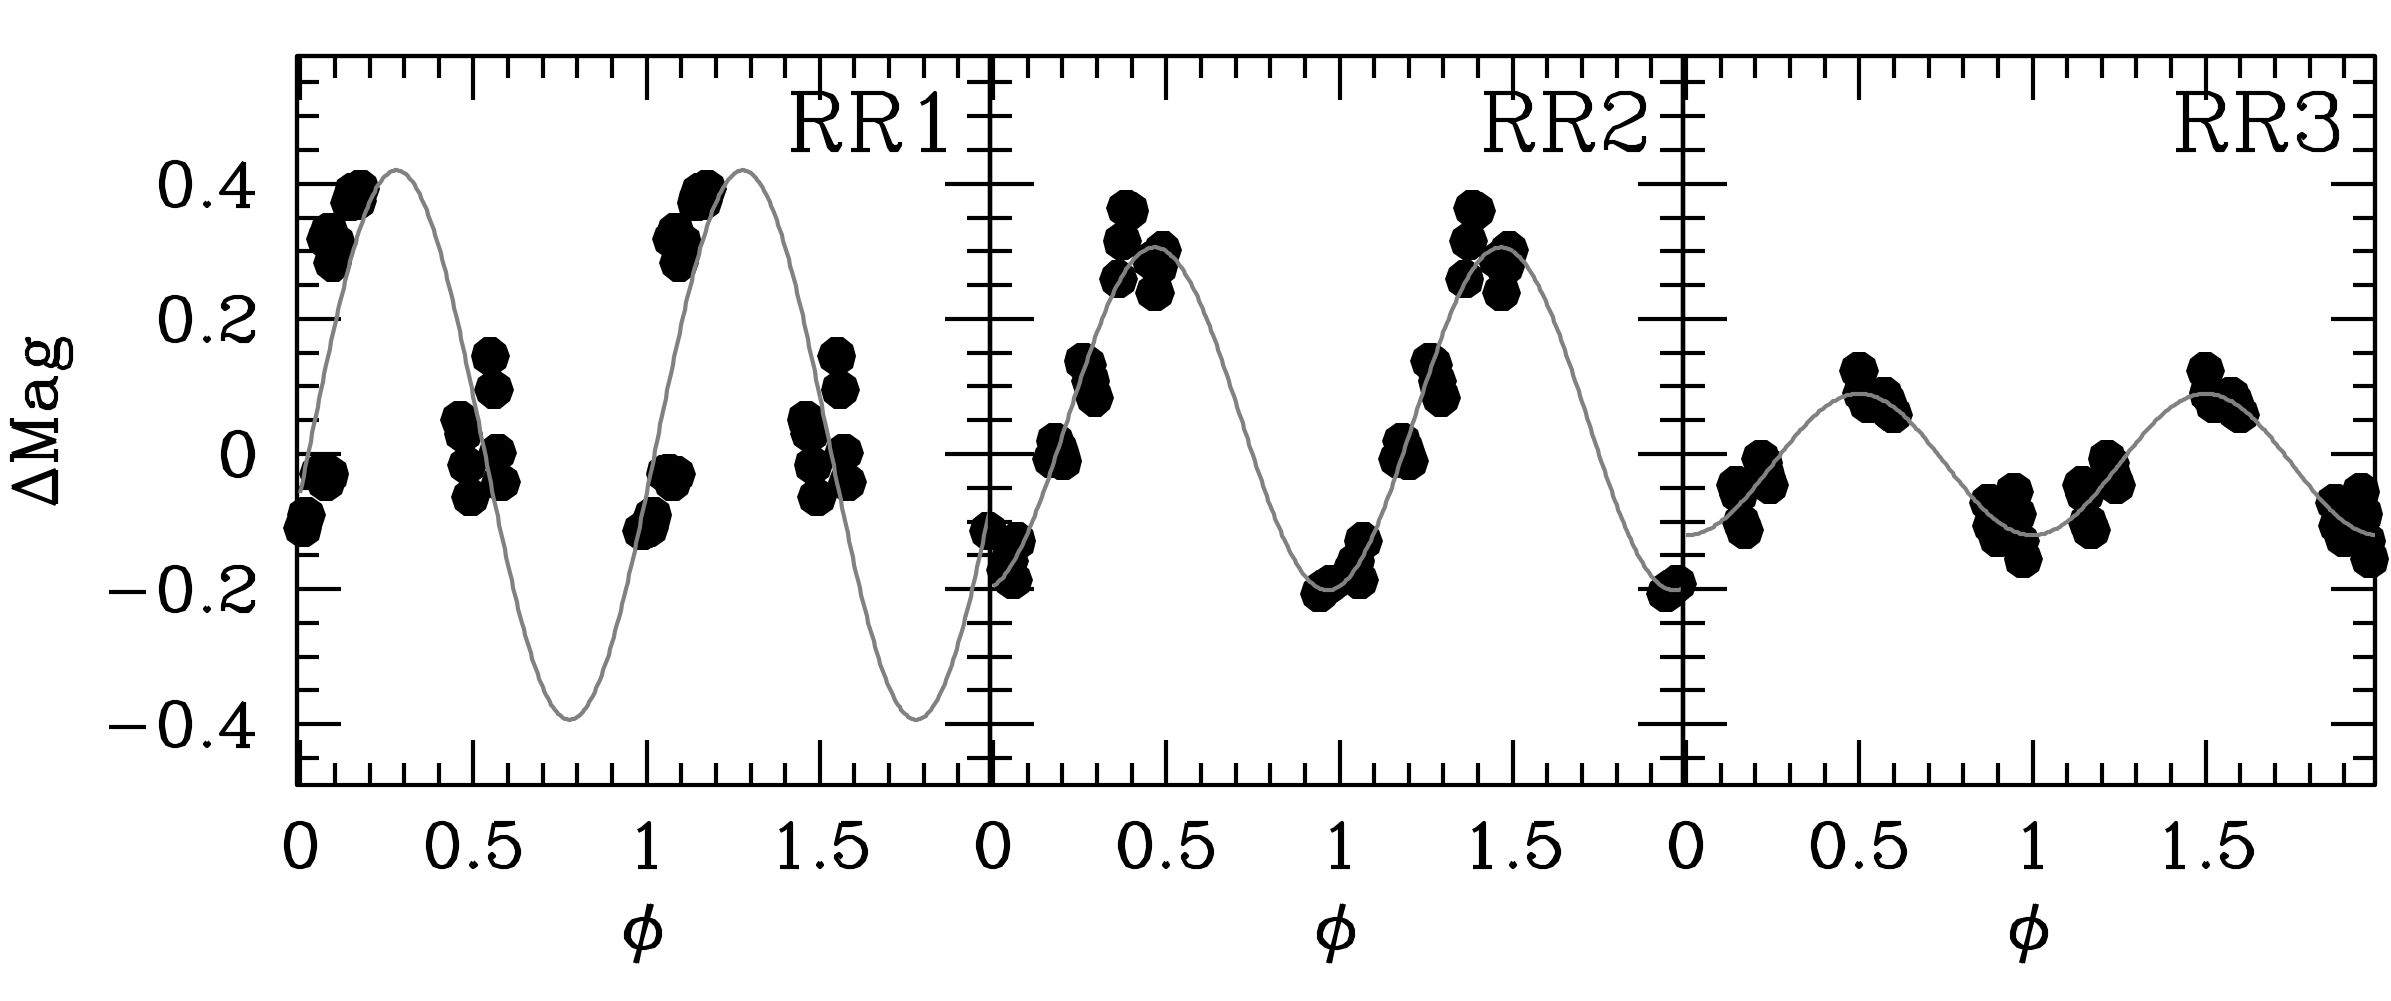
To use the largest possible sample of data-points, for each variable we have scaled the F814W magnitudes to the F606W ones, by using the amplitude ratio AF606W/AF814W=1.49 derived by Fiorentino et al. (2012). The Fourier analysis was then applied to the combined F606W and F814W light-curves, shown in Fig. 2. For all the candidates RR Lyrae we obtained periods in the 0.6-0.9 d range (see Table 1), typical of fundamental pulsators of AB type. The derived light-curves are
However, we note that, given the incomplete sampling of the currently available light curves, particularly in the case of RR1, the inferred pulsation periods and especially amplitudes should be considered as indicative. More precise estimates will follow when better sampled light-curves will become available.
An extensive search for Miras in Ter5 was done by using the SIRIUS near IR camera attached to the 1.4-m Infrared Survey Facility (IRSF) telescope over the period from 2002 to 2005 (Matsunaga, 2007, PhD thesis). Among the detected Mira candidates, six are possibly Ter5 members according to their K-band magnitudes and period–luminosity (P-L) relation (see Sloan et al. 2010 for a discussion of five such candidates). We note that these six Miras (M1 to M6) are known as V2, V6, V8, V5, V7, and V12, respectively in the lists of variable stars in Ter5 by Clement et al. (2001), Matsunaga (2007), and Sloan et al. (2010). Three Miras have periods P300 d, while the other three stars have P300 d (see Table 1). Moreover, we note that four (M1 to M4) out of these six Miras are located in the inner , where field contamination by giant stars is negligible, and the other two targets are at distances of about from the Ter5 center, where contamination is still reasonably low (about 30%, Massari et al., 2014a, b).
These variables lack proper motions from Massari et al. (2015), since they were saturated in that survey, while they are sufficiently bright for Gaia. First proper motion estimates from DR2 (Gaia Collaboration et al., 2018) indicate membership for M1, M2 and M3 and non-membership for M5 and M6, while no measurements are available for M4.
By combining observed and theoretical pulsation properties of Miras with evolutionary models, Feast (1996) derived the following relation (his equation 15; see also Wood & Bessell, 1983): log M/M⊙ = 0.470 log P +0.356 [Fe/H] , that, for a given metallicity, predicts larger masses (i.e., younger ages) for longer pulsation periods. Interestingly, the mass difference between Miras with different pulsation periods becomes even larger if the longer period variables are also more metal-rich. Thus, accurate determination of the metal content of the Mira variables is key to constrain their mass (hence their age) and the properties of their parent stellar population (e.g. Catchpole et al., 2016).
3 Spectroscopic observations and data analysis
We used X-SHOOTER (Vernet et al., 2011) at the VLT under program 097.D-0337 (PI: L. Origlia), to observe the three most isolated RR Lyrae (namely, RR1, RR2, RR3)333RR4, instead, has several neighbors that complicate its observation with medium-high resolution, seeing-limited spectrographs. and the six detected Miras (see Table 1). We selected the VIS and near IR ARMs to simultaneously acquire spectra in the Calcium triplet region with the slit at R11,000, and in the JHK bands with the slit at R8,000. This allowed us to measure several atomic lines and, in the cool Miras, also molecular CO and OH lines, from which deriving radial velocities (RVs) and chemical abundances.
The acquisition of X-SHOOTER spectra has been performed by nodding on slit, with a typical throw of a few arcsec, for an optimal subtraction of the background and the detector noise. The reduction of the X-SHOOTER spectra has been performed by using the ESO X-SHOOTER pipeline version 3.1.0 to obtain 2D rectified and wavelength calibrated spectra. Order and 1D spectrum extraction has been performed manually. Total on-source exposure times were 11 min on Mira variables and 40 min on RR Lyrae. Overall signal-to-noise ratios of 30-50 per resolution element have been measured on the final spectra.
For spectral analysis we have used the MARCS model atmospheres (Gustafsson et al., 2008) and the code described in detail in Origlia, Rich & Castro (2002) and Origlia & Rich (2004), already used to compute synthetic spectra for normal giant stars in Ter5 (Origlia et al., 2011, 2013). The code uses the LTE approximation and it includes thousands of near IR atomic transitions from the Kurucz database444http://www.cfa.harvard.edu/amp/ampdata/kurucz23/sekur.html, Bièmont & Grevesse (1973), and Meléndez & Barbuy (1999), while molecular data are taken from our (Origlia, Moorwood & Oliva, 1993; Origlia et al., 1997, and subsequent updates) and B. Plez (private communications) compilations. We use the Grevesse & Sauval (1998) abundances for the Solar reference. A list of suitable lines for each measurable chemical element, free from significant blending and/or contamination by telluric absorption and without strong wings, has been identified. Chemical abundances have been derived by minimizing the scatter between observed and synthetic spectra with suitable photospheric parameters and also using as a figure of merit equivalent width measurements of selected lines. The typical random error of the measured line equivalent widths is 20-30 mÅ, mostly arising from a 1-2% uncertainty in the placement of the pseudo-continuum, as estimated by overlapping the synthetic and the observed spectra. This error corresponds to abundance variations of about 0.1 dex, comparable with the typical 1 scatter (0.15 dex) in the derived abundances from different lines. The errors quoted in Table 1 for the final abundances were obtained by dividing the 1 scatter by the square root of the number of used lines, typically a few per species. When only one line was available, we assumed a 0.15 dex error.
4 Results
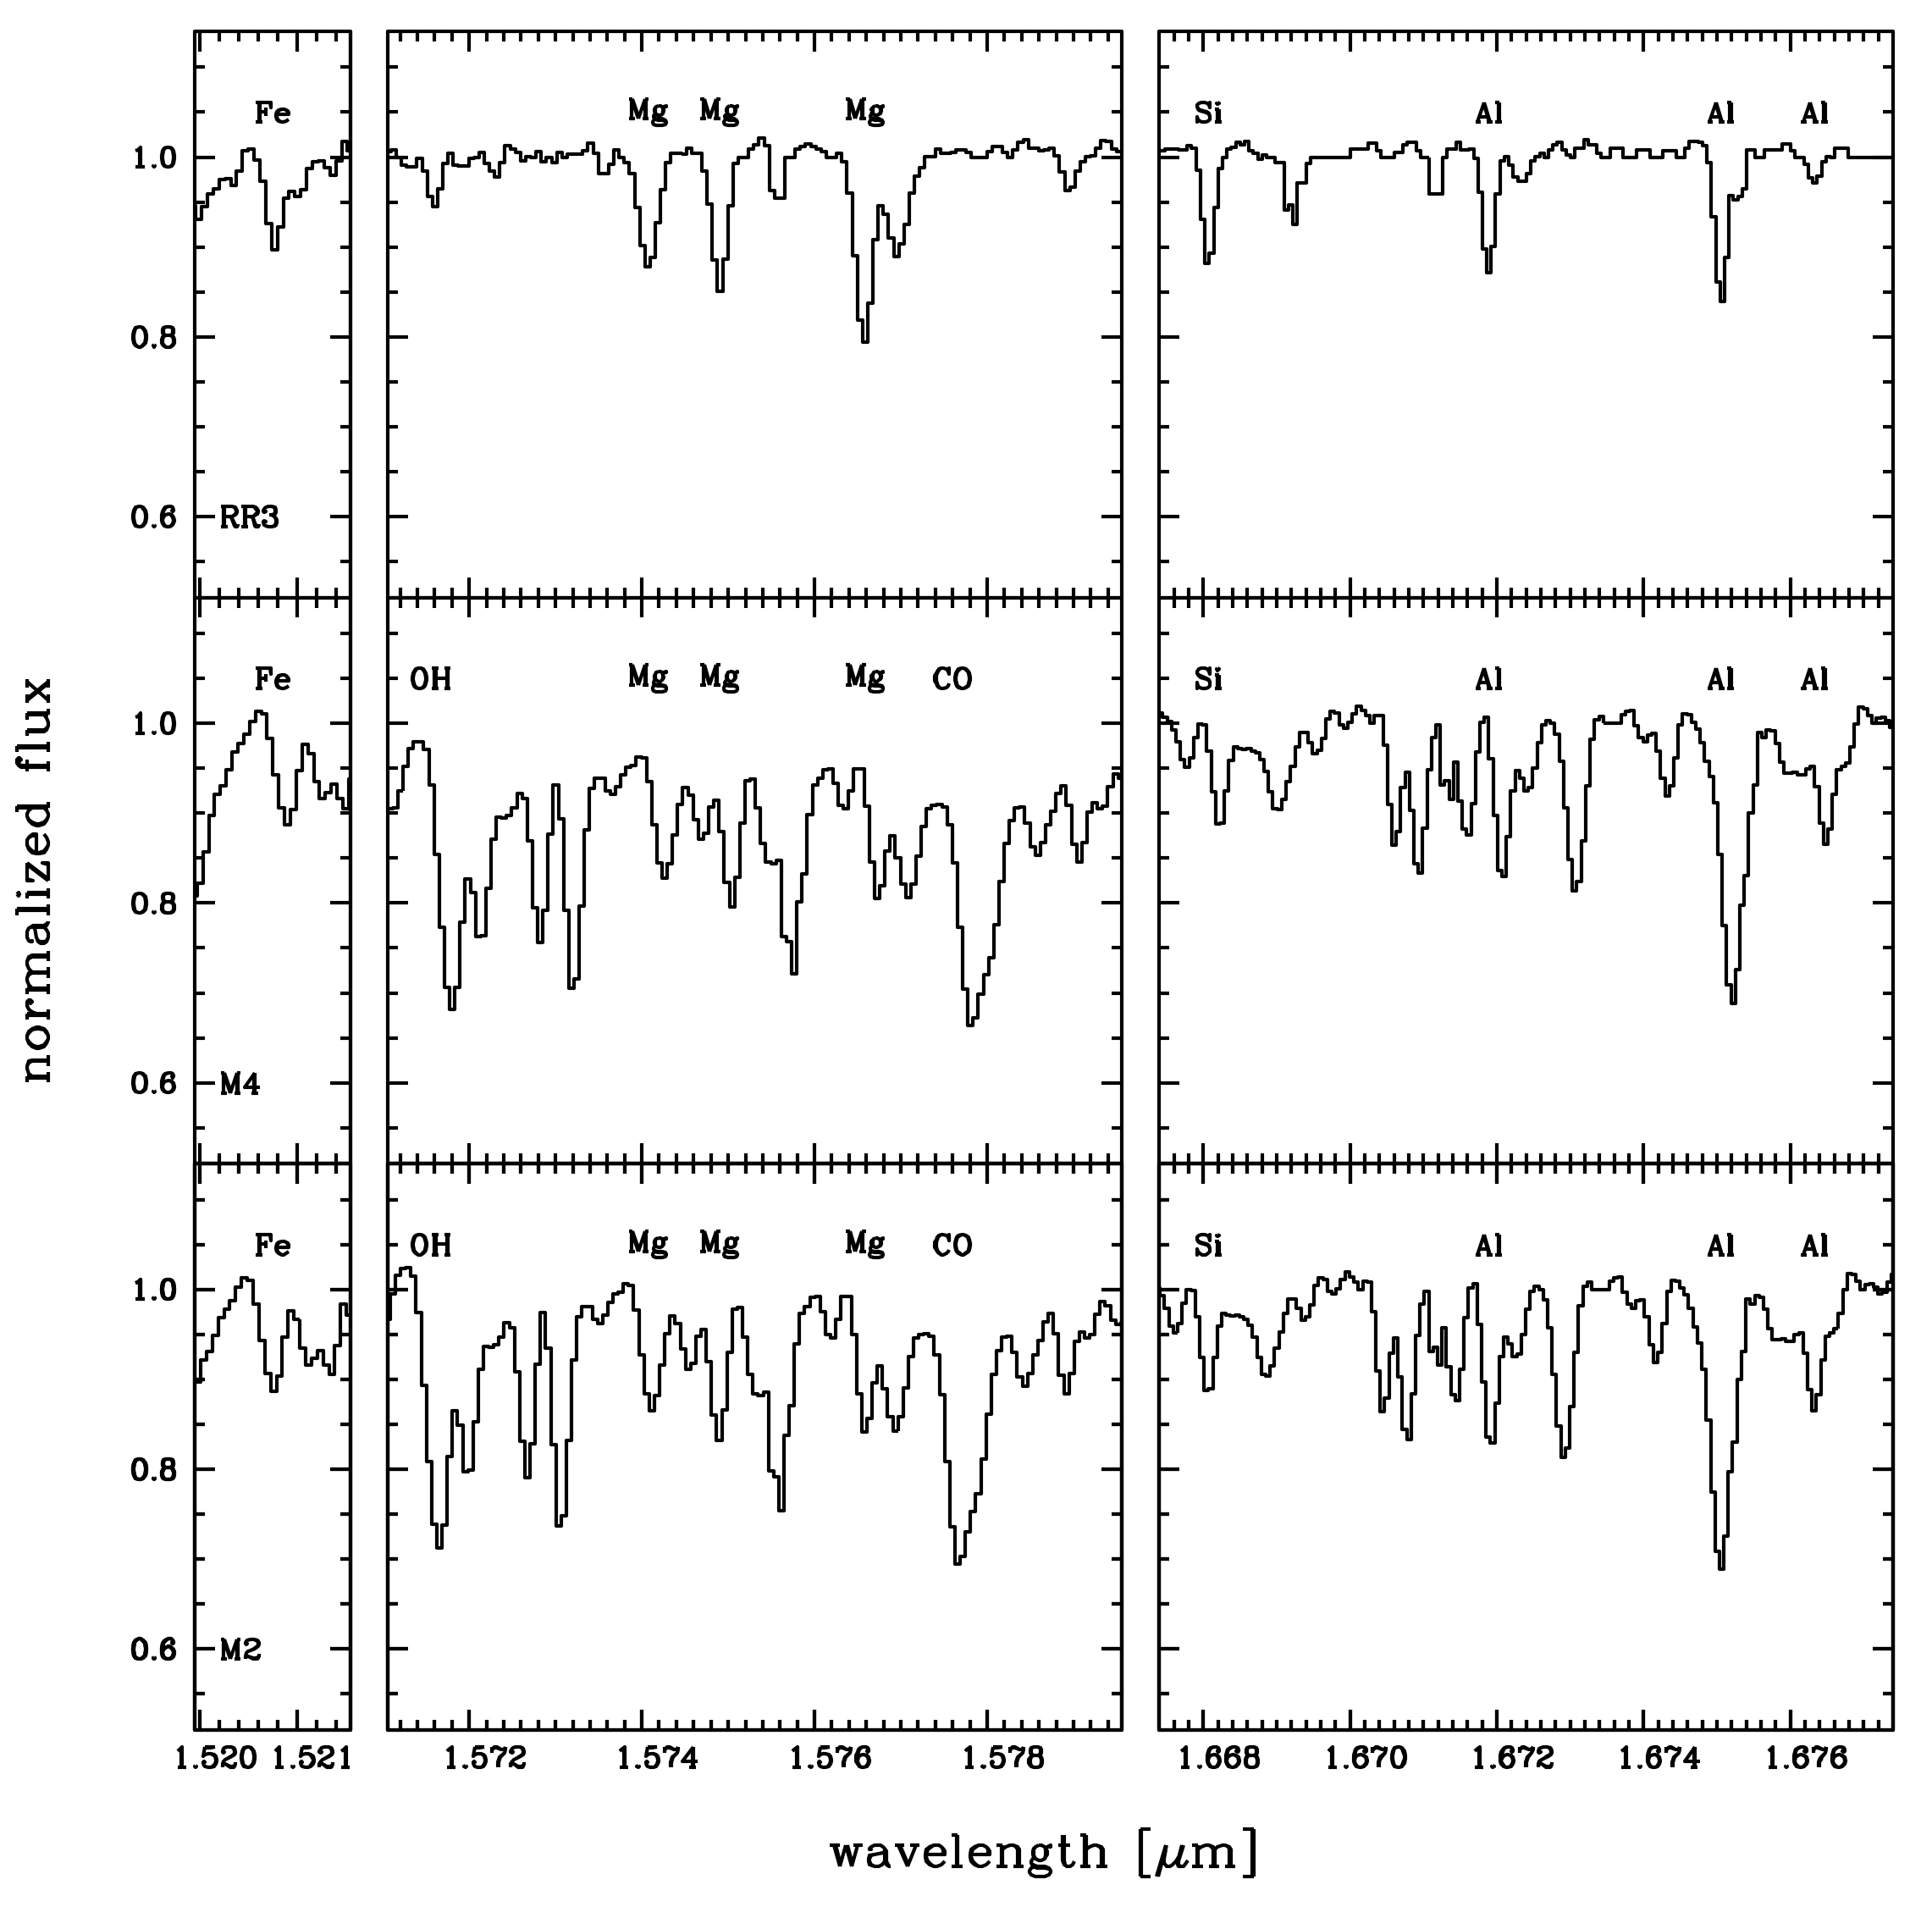
Neutral atomic lines in the H-band have been used to derive abundances of Fe, Ca, Si, Mg, Ti and Al. Additional atomic lines of Mg, Al, Na, K, and Mn in the J-band and of Ti, Al, and Na in the K-band have been also used to derive abundances for the corresponding metals. These lines have been also used to derive heliocentric RVs. OH lines in the spectra of the cool Miras have been used to derive abundances of O in those variables. Detailed information on the best-fit estimates of the stellar parameters, final RVs and chemical abundances for the observed variables are given in the next two sub-sections.
4.1 RR Lyrae variables
The three observed RR Lyrae stars have quite long periods. Although, these are typical of metal poor systems (Fiorentino et al., 2015), they may also be detected in systems with a red horizontal branch morphology, as it is observed in the metal rich SPs of the bulge and its globular clusters (e.g. Kunder et al., 2016, 2018, and references therein).
Given that the stellar parameters of the RR Lyrae stars vary with the pulsation period, we have computed theoretical models (see Marconi et al., 2013, for details) for the inferred long periods and for metallicities between solar and one tenth solar, and predict corresponding RV, effective temperature () and gravity (log g) variability curves. We have found maximum amplitudes of about km s-1 in RV with respect to the average one, 600 K in , and 0.5 dex in log g. These predictions, coupled with the spectroscopic observation epoch, allow us to provide first guess RV, and log g. We thus computed a grid of synthethic spectra with varying abundances and stellar parameters according to the variability curves. Best-fit estimates from spectral synthesis turned out to be in excellent agreement with those predicted by the variability curves at the epoch of the spectroscopic observation and fully consistent with those expected for stars in the instability strip.
An average microturbulence velocity of 2 km s-1 and log g of 3.0 dex have been assumed for all the stars, while the adopted temperatures ( 6000 K) are reported in Table 1. Systematic uncertainties of 200 K in , 0.5 in log g and km s-1 in microturbulence velocity have been considered, and their impact on individual abundances turns out to be 0.1 dex, while the abundance ratios are practically unaffected.
The systemic velocity of Ter5 is km s-1 and its velocity dispersion in the central region is km s-1 and its (Massari et al., 2014b). Hence. according to the measured RVs (see Table 1), all the three observed RR Lyrae are fully consistent with being Ter5 members.
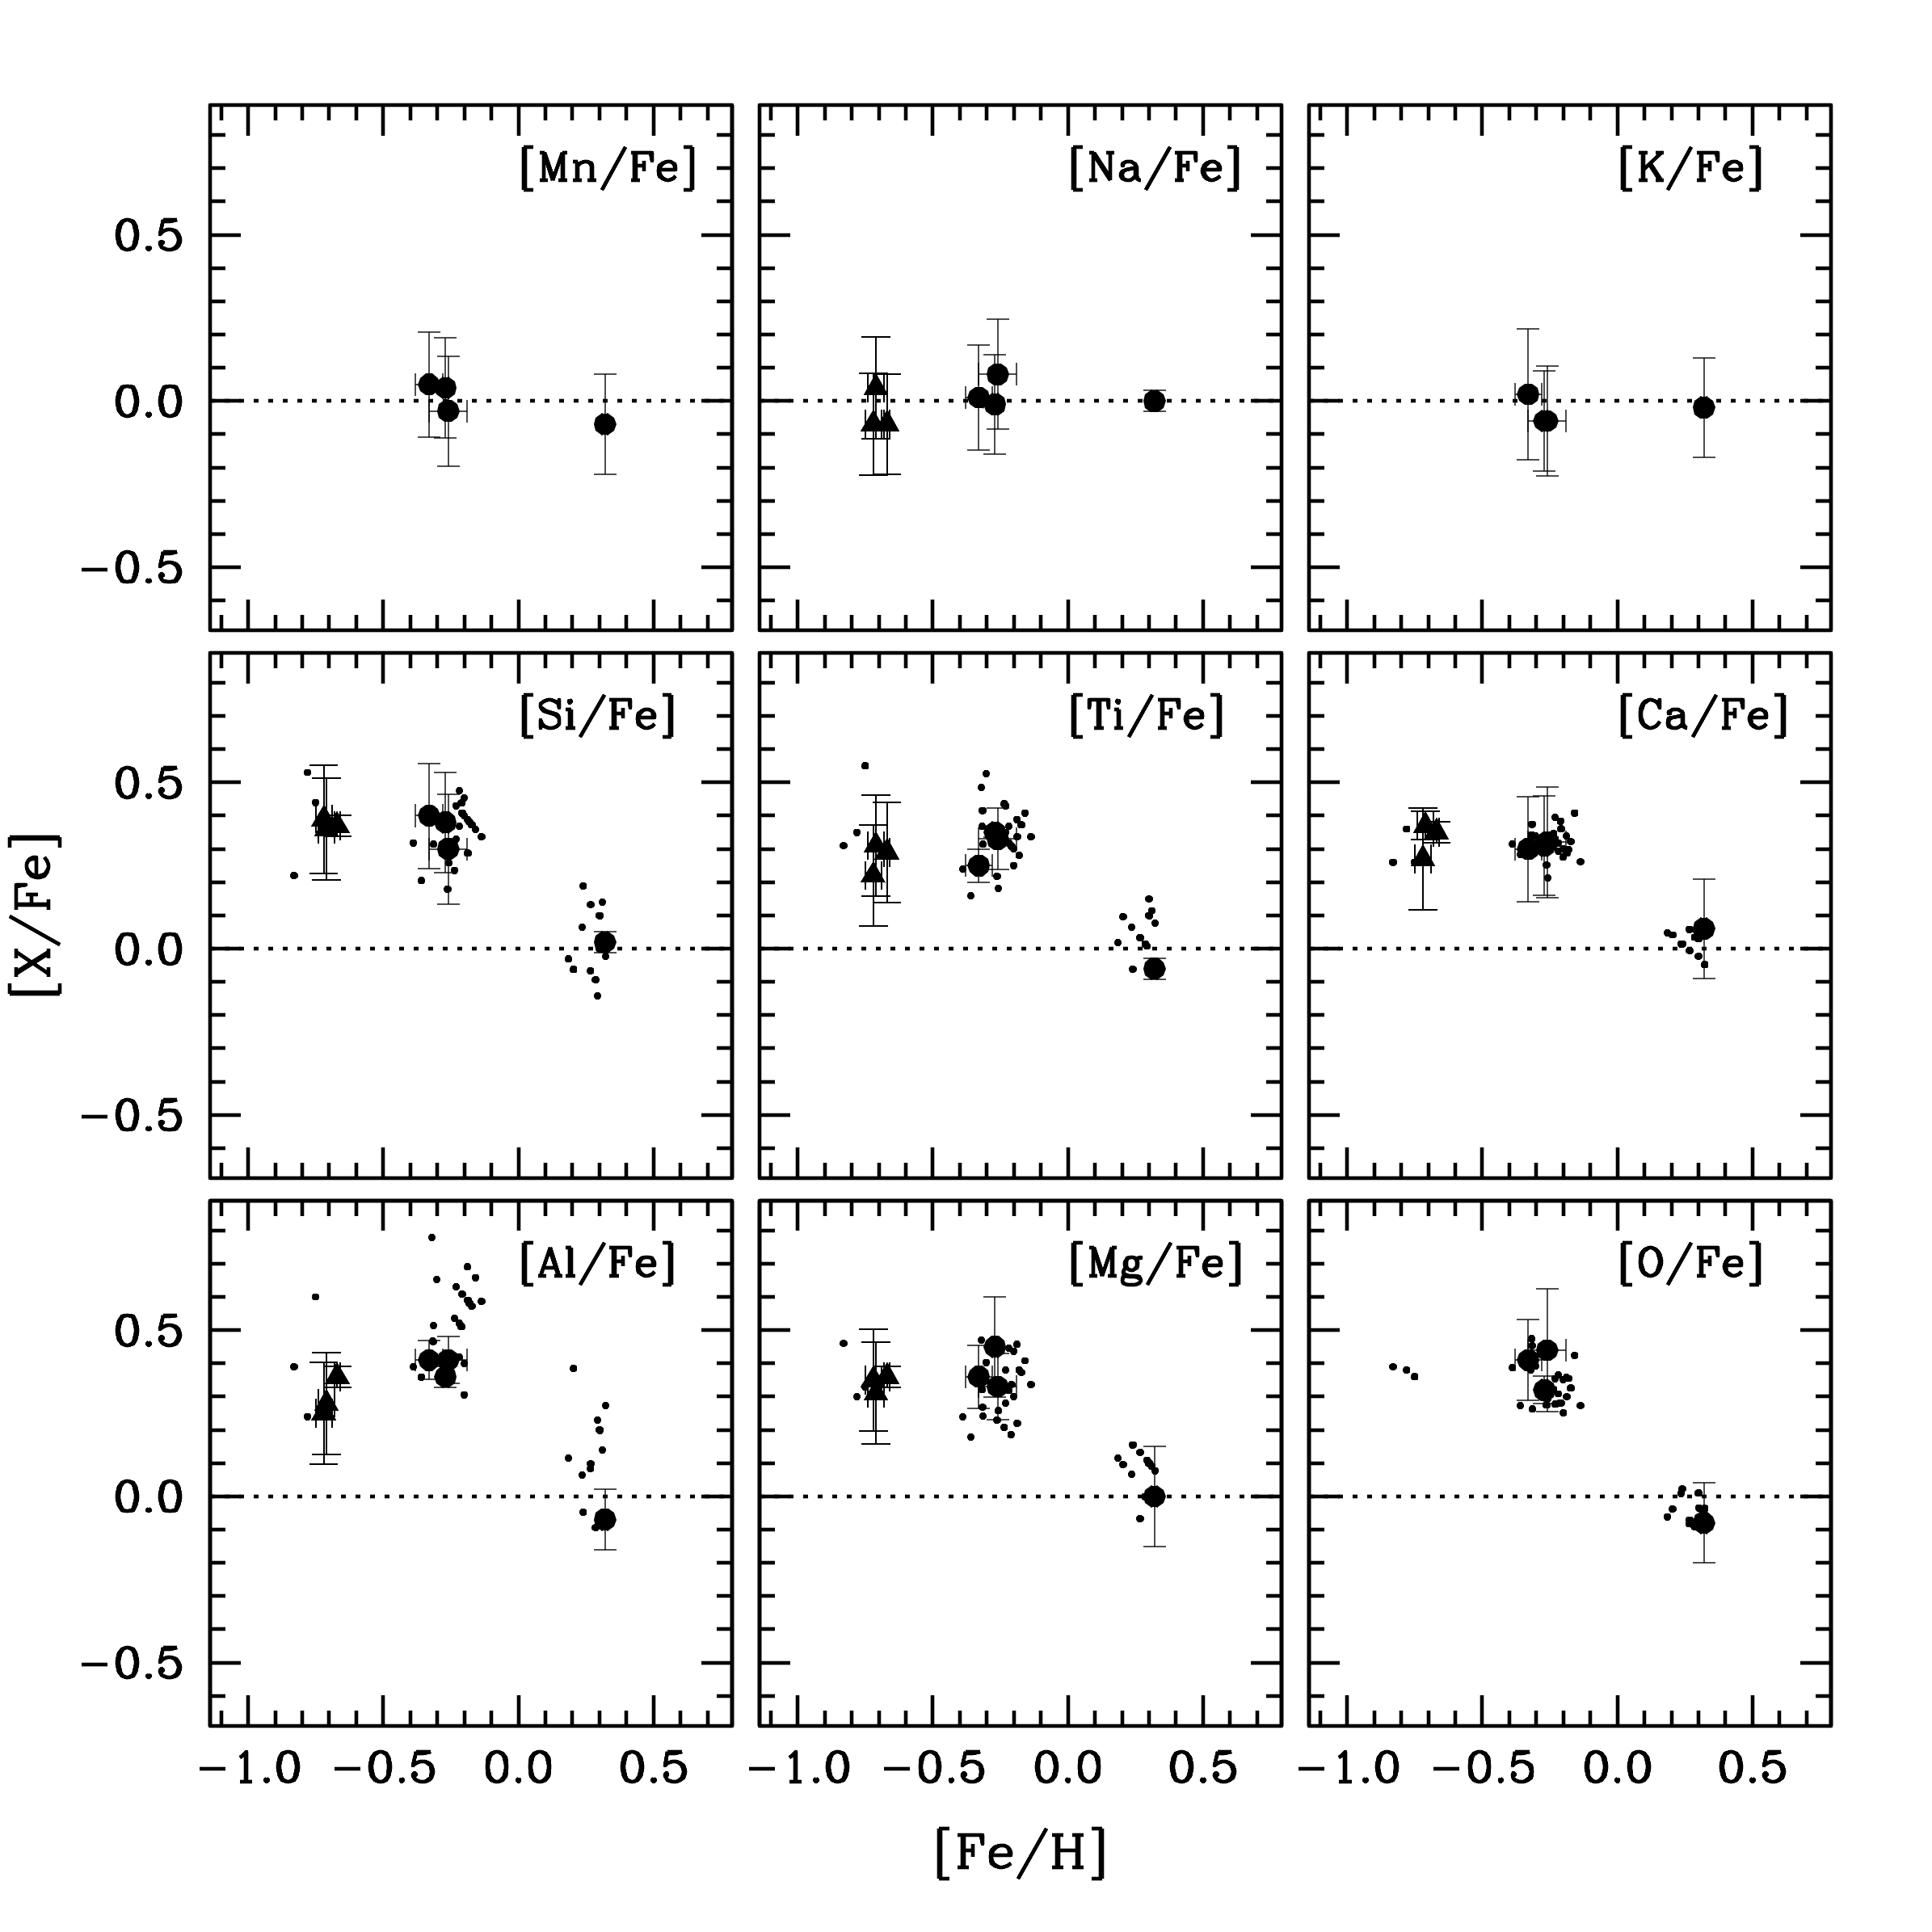
The derived chemical abundances and abundance ratios of Fe, Ca, Si, Mg, Ti, Al, and Na are listed in Table 1 and plotted in Fig.4. An iron abundance [Fe/H] dex, enhanced [/Fe] and [Al/Fe], and solar-scaled [Na/Fe] have been homogeneously inferred for the three RR Lyrae.
This metallicity, together with the best-fit periods and the average V magnitudes, can be also used to constrain the distance of Ter5, by means of the period-luminosity relation by Catelan et al. (2004). V magnitudes in the Johnson-Cousin system have been obtained from the mean magnitudes in the HST filters and photometric transformations computed by using the stars in common between the WFPC2 data-set used in the present work and the ACS catalog published by Ferraro et al. (2009). We found V magnitudes of 21.77, 22.59 and 21.83 for RR1, RR2 and RR3, respectively. The proper extinction value was then associated to each candidate RR Lyrae star by using the differential reddening map derived by Massari et al. (2012). We obtain a distance d= kpc, kpc and kpc for RR1, RR2 and RR3 respectively. The errors are obtained by assuming a uncertainty on the adopted E(B-V) values. The derived values well match the distance of 5.90.5 kpc obtained by Valenti et al. (2007) from IR photometry of the Red Giant Branch (RGB) of Ter5.
Interestingly, the period-metallicity distribution of the Ter5 RR Lyrae stars resembles that of the RR Lyrae in the bulge globular clusters NGC 6388 and NGC 6441 (see e.g. Pritzl et al., 2000, and references therein). However, the uncertainty in the amplitude estimates from the current light curves prevent us to use their period-amplitude distribution as a diagnostic tool for checking their possible association with a population of super-luminous, He-rich stars, as suggested for NGC 6388 and NGC 6441 (Rich et al., 1997; Pritzl et al., 2002; Busso et al., 2007; Brown et al., 2016; Tailo et al., 2017).
4.2 Mira variables
Very few spectroscopic studies exist on Mira variables in general, and most of them have been focused on the complex kinematics of their atmospheres (e.g. Hinkle, 1978; Hinkle, Hall, & Ridgway, 1982; Lebzelter et al., 2004; Wittkowski et al., 2011) and occasionally on the determination of C/O abundance ratios (e.g. Lebzelter et al., 2004; Hinkle, Lebzelter, & Straniero, 2016) from molecular CO and OH lines in near IR spectra. However, very recently and for the first time, some iron, -element and sodium abundances of a Mira star in the globular cluster NGC 5927 have been measured by D’Orazi et al. (2018), using J-band spectroscopy.
Mira variables have complex atmospheres, characterized by sub-structures with different [low] temperatures, gravities and velocity fields, that also change with the pulsational phase. A cool photosphere with temperatures as low as 3000 K is believed to be the source of the atomic lines, as well as of most of the molecular CO and OH features. However, especially near the maximum, a 1000 K gaseous component likely in the inner portion of a circumstellar shell, can contribute to low-excitation molecular absorption lines. Moreover, velocity gradients, departure from LTE in the outer layers and/or P Cygni type emission arising in a circumstellar shell might weaken some absorption lines. Although hydrostatic model atmospheres cannot satisfactory reproduce all the observed features, especially near the maximum, they can still be used to perform some chemical abundance analysis from high excitation atomic and molecular lines that originate in the innermost region of the Mira’s photosphere.
The six candidate Miras towards Ter5 have been observed at a random phase far from the maximum (see Table 1). Effective temperatures have been spectroscopically determined from X-SHOOTER spectra, by computing the CO indices in correspondence of the first-overtone (2-0) and (3-1) bandheads in the K-band and using the calibrations reported in Schultheis, Ryde & Nandakumar (2016). We find values in the 3000-3400 K range (see Table 1), consistent with an observation epoch far from the light curve maximum. A microturbulence velocity of 2 km s-1 and a surface gravity log g of 0.5 dex have been adopted, consistent with the typical values measured in Ter5 non-variable cool giants near the RGB tip (Origlia et al., 2011, 2013). Systematic uncertainties of 200 K in Teff, 0.5 in log g and km s-1 in microturbulence velocity imply abundance variations between 0.1 and 0.2 dex.
Second overtone molecular band-heads of 12CO have been routinely used to derive carbon abundances in normal RGB stars. However, in pulsating Miras, these band-heads can be affected by kinematics, thus making difficult to disentangle abundance from velocity gradient effects. Hence, we did not attempt to obtain any carbon abundance estimate from the spectral synthesis.
According to the measured RVs (see Table 1), only the innermost Miras (M1 to M4) are consistent with being Ter5 members, also in agreement with the proper motions measured by Gaia. M4 has been observed after its minimum of luminosity, hence its RV is expected to be negative with respect to the mean. The measured value of km s-1, although significantly more negative than the other Miras and the systemic velocity, is still consistent with a Ter5 membership at level. Interestingly, Matsunaga et al. (2005) detected SiO maser emission of M4 at V(LSR) km s-1, which corresponds to km s-1, giving an additional, strong support for the membership of this star.
The derived chemical abundances and abundance ratios of Fe, Ca, Si, Mg, Ti, Al, Na, Mn, K and O are listed in Table 1 and plotted in Fig.4. An iron abundance [Fe/H] dex, enhanced [/Fe] and [Al/Fe], and about solar-scaled [Mn/Fe], [Na/Fe] and K[Fe] have been inferred for the three Miras M1, M2, and M3 with P300 d, while M4 and the other two Miras with longer periods (P300 d) have super-solar iron ([Fe/H] dex) and about solar-scaled [/Fe], [Al/Fe], [Na/Fe], [Mn/Fe], and [K/Fe].
5 Discussion and Conclusions
The seven variables (three RR Lyrae and four Miras) that have been found to have RVs consistent with being members of Ter5 have very different metallicities and [/Fe] abundance ratios. The agreement with the earlier non-variable star studies of M giants in Ter5 (Origlia et al., 2011, 2013) is striking. The three RR Lyrae show [Fe/H] dex and enhanced [/Fe]+0.3 dex, nicely matching the values obtained for the most metal poor population detected in Ter5 (Origlia et al., 2013, see also Fig. 4). The three Miras with P300 d (namely, M1, M2, and M3) appear to be clumped at [Fe/H] dex and [/Fe]+0.3 dex, again nicely matching the values measured in the dominant sub-solar population of Ter5. The exceptionally long-period Mira M4 at [Fe/H]=+0.32 and solar-scaled [/Fe] is fully consistent with the super-solar component that Ferraro et al. (2016) found to be 7 Gyrs younger than the metal-poor SPs of Ter5. Consistently, the mass of the M4 Mira is expected to be significantly larger than the mass of the other Ter5 Miras (M1, M2 and M3) at lower metallicity and with significantly shorter periods. Indeed, we note that an increase in the He content and/or a super-solar metallicity alone are not sufficient to explain the long period of M4. By using equation (15) in Feast (1996) we obtain a current mass of for M1, M2 and M3 and for M4, that is a difference in mass of . This value is in nice agreement with the mass difference that Ferraro et al. (2016) measured at the main sequence Turn Off for the two sub-populations of Ter5 (i.e., for the 12 Gyr old and sub-solar metallicity component, and 1.32 for the 4.5 Gyr old and super-solar metallicity one).
Interestingly, the other two long period Miras, namely M5 and M6, which are likely bulge field stars, have abundances and abundance patterns similar to those of M4, providing an additional evidence of the connection between Ter5 and the bulge, and of young ages for some stars in both systems.
Finally, our finding that both the RR Lyrae and Mira variables in Ter5 have metallicities and ages consistent with those of non-variable stars, is a confirmation of the scenario proposed in Ferraro et al. (2016, and references therein), where Ter5 experienced a complex evolutionary history and is currently comprised of sub-populations with mutiple and discrete ages and metallicities.
References
- Barbuy et al. (1998) Barbuy, B., Bica, E., & Ortolani, S. 1998, A&A, 333, 117
- Barning (1963) Barning, F. J. M. 1963, Bull. Astron. Inst. Netherlands, 17, 22
- Bekki & Freeman (2003) Bekki, K., & Freeman, K. C. 2003, MNRAS, 346, L11
- Bekki & Norris (2006) Bekki, K., & Norris, J. E., 2006, ApJ, 637,109
- Bensby et al. (2013) Bensby, T. et al. 2013, A&A, 549, 147
- Behrendi, Burkert & Schartmann (2016) Behrendi,M., Burkert, A., & Schartmann, M., 2016, ApJ, 819, 2
- Bièmont & Grevesse (1973) Bièmont, E., & Grevesse, N. 1973, Atomic Data and Nuclear Data Tables, 12, 221
- Brown et al. (2016) Brown, T.M., et al., 2016, ApJ, 822, 44
- Busso et al. (2007) Busso, G., et al., 2007, A&A, 474, 105
- Cadelano et al. (2018) Cadelano, M., et al., 2018, ApJ, 855, 125
- Catchpole et al. (2016) Catchpole, R.M., Whitelock, P.A., Feast, M.W., Hughes, S.M.G., Irwin, M., Alard, C., 2016, MNRAS, 455, 2216
- Carollo et al. (2007) Carollo, C. M., Scarlata, C., Stiavelli, M., Wyse, R.F.G., & Mayer, L., 2007, ApJ, 658, 960
- Catelan et al. (2004) Catelan, M., Pritzl, B. J., & Smith, H. A. 2004, ApJS, 154, 633
- Clement et al. (2001) Clement, C.M., et al., 2001, AJ, 122, 2587
- Dalessandro et al. (2018) Dalessandro, E., et al., 2018a, ApJ, 859, 15
- Dolphin (2000) Dolphin, A. E. 2000, PASP, 112, 1397
- D’Orazi et al. (2018) D’Orazi, V, et al., 2018, ApJ, 855, 9
- Edmonds et al. (2001) Edmonds, P.D., Grindlay, J.E., Cohn, H., & Lugger, P., 2001, ApJ, 547, 829
- Elmegreen, Bournaud & Elmegreen (2008) Elmegreen, B.G., Bournaud, F., & Elmegreen, D.M., 2008, ApJ, 688, 77
- Feast (1996) Feast, M.W., 1996, MNRAS, 278,11
- Ferraro et al. (2009) Ferraro, F.R., et al., 2009, Nature, 462, 483
- Ferraro et al. (2015) Ferraro, F.R., Pallanca, C., Lanzoni, B., Cadelano, M., Massari, D., Dalessandro, E, Mucciarelli, A., 2015, ApJ, 807, L1
- Ferraro et al. (2016) Ferraro, F.R., Massari, D., Dalessandro, E., Lanzoni, B., Origlia, L., Rich, R.M., & Mucciarelli, A., 2016, ApJ, 828, 75
- Fiorentino et al. (2012) Fiorentino, G., Contreras Ramos, R., Tolstoy, E., Clementini, G., Saha, A., 2012, A&A, 539, 138
- Fiorentino et al. (2015) Fiorentino, G., et al., 2015, ApJ, 798, L12
- Gaia Collaboration et al. (2018) Gaia Collaboration, Brown, A. G. A., Vallenari, A., et al. 2018, A&A, 616, A1
- Genzel et al. (2011) Genzel, R., et al., 2011, ApJ, 733, 101
- Gonzalez et al. (2015) Gonzalez, O., et al., 2015, A&A, 584, 46
- Grevesse & Sauval (1998) Grevesse, N., & Sauval, A. J. 1998, Space Science Reviews, 85, 161
- Gustafsson et al. (2008) Gustafsson B., Edvardsson B., Eriksson K., Joergensen U.G., Nordlund A., Plez B., 2008, A&A, 486, 951
- Hill et al. (2011) Hill, V., Lecureur, A., Gomez, A., Zoccali, M., Schultheis, M., Babusiaux, C., Royer, F., Barbuy, B., Arenou, F., Minniti, D., & Ortolani, S. 2011, A&A, 535, 80
- Hinkle (1978) Hinkle, K.H., 1978, ApJ, 220, 210
- Hinkle, Hall, & Ridgway (1982) Hinkle, K.H., Hall, D.B., & Ridgway, S.T., 1982, ApJ, 252, 697
- Hinkle, Lebzelter, & Straniero (2016) Hinkle, K.H., Lebzelter, T., & Straniero, O., 2016, ApJ, 825, 38
- Holtzman et al. (1995) Holtzman, J. A., Burrows, C. J., Casertano, S., et al. 1995, PASP, 107, 1065
- Immeli et al. (2004) Immeli, A., Samland, M., Gerhard, O., & Westera, P. 2004, A&A, 413, 547
- Johnson et al. (2011) Johnson, C.I., Rich, R.M., Fulbright, J.P, Valenti, E., & McWilliam, A. 2011, ApJ, 732, 108
- Johnson et al. (2014) Johnson, C.I., Rich, R.M., Kobayashi, C., Kunder, A., & Kock, A., 2014, AJ, 148, 67
- Jönsson et al. (2017) Jönsson, H., Ryde, N., Schultheis, M., & Zoccali, M., 2017, A&A, 598, 101
- Kunder et al. (2016) Kunder, A., et al., 2016, ApJ, 821, 25
- Kunder et al. (2018) Kunder, A., et al., 2018, AJ, 155, 171
- Lanzoni et al. (2010) Lanzoni, B., et al., 2010, ApJ, 717, 653
- Lebzelter et al. (2004) Lebzelter, T., Wood,P.R., Hinkle, K.H., Joyce, R.R., & Fekel, F.C., 2005, A&A, 432, 207
- Lebzelter et al. (2004) Lebzelter, T., Wood,P.R., Nowotny, W., Hinkle, K.H., Höfner, S., & Aringer, B., 2014, A&A, 567, 143
- Lomb (1976) Lomb, N. R., 1976, Ap&SS, 39, 447
- Marconi et al. (2013) Marconi, M., Molinaro, R., Ripepi, V., Musella, I., Brocato, E., 2013, MNRAS, 428, 2185
- Massari et al. (2012) Massari, D., et al., 2012, ApJ, 755, 32
- Massari et al. (2014a) Massari, D., et al., 2014a, ApJ, 791, 101
- Massari et al. (2014b) Massari, D., et al., 2014b, ApJ, 795, 22
- Massari et al. (2015) Massari, D., et al., 2015, ApJ, 810, 69
- Matsunaga et al. (2005) Matsunaga, N., Deguchi, S., Ita, Y., Tanabe, T., & Nakada, Y., 2005, PASJ, 57, L1
- McKenzie & Bekki (2018) McKenzie, M., & Bekki, K., 2018, MNRAS, 479, 3126
- Meléndez & Barbuy (1999) Meléndez, J., & Barbuy, B. 1999, ApJS, 124, 527
- Ness et al. (2013a) Ness, M., Freeman, K., Athanassoula, E., Wylie-De-Boer, E., Bland-Hawthorn, J., Asplund, M., Lewis, G.F., Yong, D., Lane, R.R., & Kiss, L.L. 2013a, MNRAS, 430, 836
- Ness et al. (2013b) Ness, M., Freeman, K., Athanassoula, E., Wylie-De-Boer, E., Bland-Hawthorn, J., Asplund, M., Lewis, G.F., Yong, D., Lane, R.R., Kiss, L.L., & Ibata, R. 2013b, MNRAS, 432, 2092
- Origlia, Moorwood & Oliva (1993) Origlia, L., Moorwood, A. F. M., & Oliva, E. 1993, A&A, 280, 536
- Origlia et al. (1997) Origlia, L., Ferraro, F. R., Fusi Pecci, F., & Oliva, E. 1997, A&A, 321, 859
- Origlia, Rich & Castro (2002) Origlia, L., Rich, R. M., & Castro, S. 2002, AJ, 123, 1559
- Origlia & Rich (2004) Origlia, L., & Rich, R. M. 2004, AJ, 127, 3422
- Origlia et al. (2011) Origlia, L., et al., 2011, ApJ, 726, 20
- Origlia et al. (2013) Origlia, L., Massari, D., Rich, R.M., Mucciarelli, A., Ferraro, F.R., Dalessandro, E., Lanzoni, B., 2013, ApJ, 779, 5
- Ortolani, Barbuy, & Bica (1996) Ortolani, S., Barbuy, B., & Bica, E., 1996, A&A, 308, 733
- Pritzl et al. (2000) Pritzl, B., Smith, H. A., Catelan, M., & Sweigart, A.V., 2000, ApJ530, 41
- Pritzl et al. (2002) Pritzl, B.,J., Smith, H. A., Catelan, M., & Sweigart, A.V., 2002, AJ, 124, 949
- Ransom et al. (2005) Ransom, S. M., Hessels, J. W. T., Stairs, I. H., Freire, P. C. C., Camilo, F., Kaspi, V. M., & Kaplan, D. L. 2005, Science, 307, 892
- Rich et al. (1997) Rich, R.M., et al., 1997, ApJ, 484, 25
- Rich, Origlia & Valenti (2012) Rich, R.M., Origlia, L. & Valenti, E., 2012, ApJ, 746, 59
- Rojas-Arriagada et al. (2014) Rojas-Arriagada, A., et al., 2014, A&A, 569, 103
- Ryde et al. (2016) Ryde, N., Schultheis, M., Grieco, V., Matteucci, F., Rich, R. M., & Uttenthaler, S., 2016, ApJ, 831, 40
- Schultheis, Ryde & Nandakumar (2016) Schultheis, M., Ryde N., & Nandakumari, G., 2016, A&A, 590, 6
- Schultheis et al. (2017) Schultheis, M. et al., 2017, A&A, 600, 14
- Sloan et al. (2010) Sloan, G.C., et al., 2010, ApJ, 719, 1274
- Stetson (1987) Stetson, P. B. 1987, PASP, 99, 191
- Stetson (1994) Stetson, P. B. 1994, PASP, 106, 250
- Tacchella et al. (2015) Tacchella, S., et al., 2015, ApJ, 802, 101
- Tailo et al. (2017) Tailo, M., et al., 2017, MNRAS, 465, 1046
- Valenti et al. (2007) Valenti, E., Ferraro, F. R., & Origlia, L., 2007, AJ, 133, 1287
- Vernet et al. (2011) Vernet, J., et al., 2011, A&A, 536, 105
- Wittkowski et al. (2011) Wittkowski, M., et al., 2011, A&A, 532, 7
- Wood & Bessell (1983) Wood, P.R., & Bessell, M.S., 1983, ApJ, 265, 748
- Zoccali et al. (2008) Zoccali, M., Hill, V., Lecureur, A., Barbuy, B., Renzini, A., Minniti, D., Gómez, A., & Ortolani, S. 2008, A&A, 486, 177