The Disk Substructures at High Angular Resolution Project (DSHARP):
X. Multiple rings, a misaligned inner disk, and a bright arc in the disk around the T Tauri star HD 143006
Abstract
We present a detailed analysis of new ALMA observations of the disk around the T-Tauri star HD 143006, which at 46 mas (7.6 au) resolution reveal new substructures in the 1.25 mm continuum emission. The disk resolves into a series of concentric rings and gaps together with a bright arc exterior to the rings that resembles hydrodynamics simulations of a vortex, and a bridge-like feature connecting the two innermost rings. Although our 12CO observations at similar spatial resolution do not show obvious substructure, they reveal an inner disk depleted of CO emission. From the continuum emission and the CO velocity field we find that the innermost ring has a higher inclination than the outermost rings and the arc. This is evidence for either a small () or moderate () misalignment between the inner and outer disk, depending on the specific orientation of the near/far sides of the inner/outer disk. We compare the observed substructures in the ALMA observations with recent scattered light data from VLT/SPHERE of this object. In particular, the location of narrow shadow lanes in the SPHERE image combined with pressure scale height estimates, favor a large misalignment of about . We discuss our findings in the context of a dust-trapping vortex, planet-carved gaps, and a misaligned inner disk due to the presence of an inclined companion to HD 143006.
1 Introduction
High resolution observations of protoplanetary disks have shown that most, if not all, disks host substructures in the form of spiral arms, rings, or azimuthally asymmetric features. These features are imprints of the processes of disk evolution and planet formation, and can be observed from optical (in scattered light, e.g. Avenhaus et al., 2018) to millimeter wavelengths (e.g. Huang et al., 2018a, b). In the dust continuum, the most common substructures are multiple bright rings and dark gaps, possibly tracing over-densities and depletion of dust grains, respectively. Rings and gaps are a natural outcome of dynamical interactions with planets (e.g., Paardekooper & Mellema, 2004; Crida & Morbidelli, 2007; Zhu et al., 2011), but could also be tracing ice lines (e.g., Zhang et al., 2015; Okuzumi et al., 2016), or be a result of certain magneto-hydrodynamical processes (e.g., Johansen et al., 2009; Dittrich et al., 2013; Bai & Stone, 2014; Simon & Armitage, 2014; Béthune et al., 2017; Suriano et al., 2018).
These substructures could play a very important role in the process of planet formation, and in particular, in the first steps towards the growth of planetesimals. Alternatively, substructures may exhibit what is the outcome of planet-disk interaction, and serve as an important diagnostics of ongoing planet formation. Since dust particles experience aerodynamic drag from the gas, in a smooth disk they would rapidly lose angular momentum and drift towards the star before they can grow to the planetesimal size (Brauer et al., 2007; Birnstiel et al., 2010). However, dust grains can be maintained in localized particle traps (pressure maxima) which allow them to efficiently grow (Pinilla et al., 2012b). Observationally, these traps appear as a suite of bright and dark rings in the dust continuum (Pinilla et al., 2012a), reminiscent of continuum observations of multiple ringed systems (e.g., ALMA Partnership et al., 2015). In addition to concentric rings, azimuthal asymmetries have also been observed, in particular in protoplanetary disks with dust-depleted large cavities (transition disks; e.g., Casassus et al., 2013; Isella et al., 2013; Dong et al., 2018). They are interpreted as azimuthal dust trapping (Birnstiel et al., 2013; Lyra & Lin, 2013), possibly in a vortex due to the Rossby wave instability (e.g., Li et al., 2000; Meheut et al., 2012; Zhu & Stone, 2014). Such an instability can be generated at the edge of a gap created by a massive planet (e.g., Regály et al., 2012; Ataiee et al., 2013; Zhu & Baruteau, 2016), or at the edge of a dead zone (e.g., Kretke, & Lin, 2007; Flock et al., 2017).
Planet-disk interactions can also leave imprints on the disk gas kinematics (Perez et al., 2015) and observations of CO isotopologues have revealed non Keplerian velocities in various disks. Recently, Pinte et al. (2018) found a local deformation of the CO disk velocity field of the intermediate-mass young star HD 163296, consistent with the spiral wave induced by a 2 MJup planet located at 260 au. Teague et al. (2018) measured, in the same disk, local pressure gradients consistent with gaps carved by a 1 MJup planet at 83 au and 137 au. Other observations of non-Keplerian velocities were explained by the presence of radial flows (Rosenfeld et al., 2014), of a warp (Rosenfeld et al., 2012; Casassus et al., 2015; Walsh et al., 2017) or of free-falling gas connecting a strongly misaligned inner disk to the outer disk (Loomis et al., 2017). A misalignment between the inner and outer disk could be induced by a massive companion on an inclined orbit with respect to the plane of the disk (e.g. Bitsch et al., 2013; Owen, & Lai, 2017), or alternatively, by a misaligned stellar magnetic field (Bouvier et al., 2007) in which case the star should be periodically obscured (periodic dippers, see e.g., Cody et al., 2014). In the presence of a strongly misaligned inner disk, the outer disk illumination is drastically affected, as evidenced by shadows observed in scattered light images that trace the surface of the disk (e.g. Marino et al., 2015; Benisty et al., 2017, 2018; Casassus et al., 2018; Pinilla et al., 2018).
The focus of this paper is the T Tauri star HD 143006, a G-type star ( M⊙, 4-12 Myr old, Preibisch et al., 2002; Pecaut et al., 2012; Garufi et al., 2018; Andrews et al., 2018), located in Upper Sco at a distance of pc (Gaia Collaboration et al., 2018). Sub-millimeter continuum observations of the disk at moderate spatial resolution revealed an azimuthal asymmetry and a marginally-resolved cavity (Barenfeld et al., 2016), although it is not classified as a transition disk from its spectral energy distribution. A strong near-infrared excess and typical mass accretion rate ( yr-1; Rigliaco et al., 2015) indicate that the innermost regions retain dust and gas. Recent scattered light observations of HD 143006 show multiple brightness asymmetries: a shadow over half of the disk (the West side) and two additional narrow shadow lanes, both suggestive of a moderately-misaligned inner disk (Benisty et al., 2018, and §4.2).
In the following, we present new observations of HD 143006 obtained with ALMA as part of DSHARP in §2, we then present a characterization of its substructures in §3, that we further discuss in §4, and the conclusions of our work in §5.
2 Observations
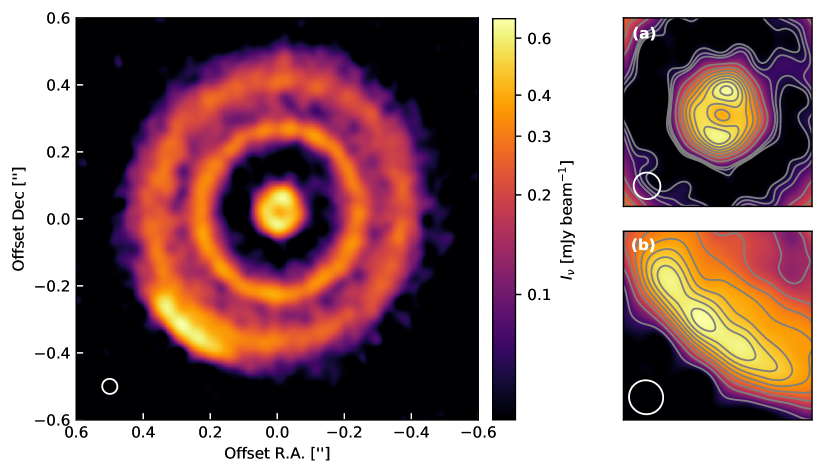
Dust continuum emission at 1.25 mm and 12CO emission in the transition were observed with long and short baselines in the ALMA Large Program 2016.1.00484.L. Additional short baselines observations (from project 2015.1.00964.S, P.I. Öberg) in the same dust and gas tracers were combined to increase uv-coverage on the short-spacings. Details on the calibration of visibilities can be found in Andrews et al. (2018). Observations were centered to R.A. (J2000) = 15h 58m 36.90s, Dec (J2000) = d 57m 15.603s, which are the coordinates of the phase center of the last execution of the long baseline observations. The continuum images presented here used the same imaging parameters as listed in Table 4 of Andrews et al. (2018), while the CO images were obtained using a robust parameter of 0.8 with a uv-tapering of mas, which was applied to the CO visibilities to enhance extended emission from the disk. The RMS noise in the continuum image is 14.3 Jy beam-1 for a mas beam with position angle (PA) of . In the CO spectral cube we measure an RMS noise of 1.04 mJy beam-1 km s-1, for a beam size of mas, PA of , and channel width of 0.32 km s-1. The continuum map is presented in Figure 1, and the full set of CO channel maps in Figure 5.9 of Andrews et al. (2018).
3 Results
3.1 Dust Continuum Emission
The continuum emission from HD 143006, presented in Figure 1, is observed close to face-on: the disk resolves into an inner depleted region, three bright rings at roughly (8 au), (40 au), (64 au) from the disk center, two dark annuli at roughly (22 au) and (51 au), and a bright south-east asymmetric feature just outside of the outermost ring at (74 au) from the disk center. This prominent arc is located at a position angle (PA, defined from North toward East) of and has an azimuthal extent of . From now on, we follow the convention of Huang et al. (2018a) and label the dark/bright annular features with a letter “D”/“B” followed by their radial location in au. Then, the innermost bright ring is labeled B8, the second bright ring as B40 and the outermost bright ring as B64. The dark annuli between B8 and B40, and between B40 and B64 are labeled D22 and D51, respectively.
The radial profile of the continuum emission presented in Huang et al. (2018a) indicates that B8 and B40 have a contrast of and with respect to the D22; these are one of the highest contrast ring-features of the DSHARP sample. However, these rings are not completely smooth: B8 has two peaks along a PA of (see panel (a) on Fig.1), but this is due to its inclination w.r.t. our line of sight (see §3.4). The outermost rings, B40 and B64, both peak close to a PA of (better seen in the residual maps of §3.4). The bright asymmetric feature outside of B64 (see panel (b) on Fig.1) is also uneven in the azimuthal direction: the arc resolves into three peaks along its azimuthal extent. The brightest peak at the center of the arc has a signal-to-noise ratio (SNR) of 48, while the flanking peaks have a SNR of 44 and are separated by au (60 mas) from the brightest peak of the arc. Finally, the dark annuli are not completely empty, in particular, inside D22 there is a bridge-like emission feature, with a SNR of 4.9, connecting the B8 and B40 rings (see emission between the rings at a PA of in panel (a) of Figure 1).
3.2 Gas emission traced by CO
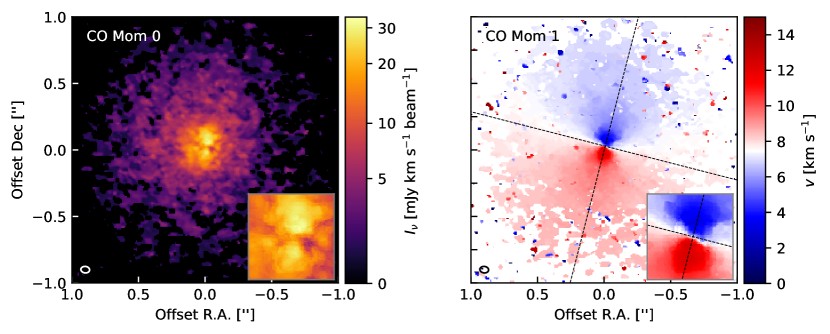
The overall emission from the gaseous component of the HD 143006 disk, as traced by the CO line, is presented in the middle and right panels of Figure 2 and extends out to in radius, twice larger in radial extent than the dust continuum emission. CO emission is detected above 3 from km s-1 to km s-1 in the LSRK reference frame, with a systemic velocity of km s-1. The integrated intensity of CO, also known as moment 0 map (left panel, Figure 2) is not centrally peaked. Since the continuum emission appears to be optically thin (, Huang et al., 2018a), the lack of CO emission in the inner disk cannot be fully explained by continuum subtraction of optically-thick dust emission, and rather indicates that some gas depletion occurs in the inner disk.
The intensity-weighted velocity of CO, also known as moment 1 map (right panel, Figure 2), shows a clear rotation pattern for a nearly face-on disk with a PA of (note that the moment 0 map has two maxima along a similar PA). However, the disk rotation is not perfectly described by a single geometry, as can be seen on the inset of Figure 2, right panel, where the velocity field in the inner disk appears different from the outer disk. This difference will be quantified in the next sections.
Given the low inclination of this system and the low SNR of the spectral cube (peak SNR of ), the front and back sides of the CO emitting layers are not clearly separated, a feature observed in other disks with higher line-of-sight inclinations (e.g., Rosenfeld et al., 2013; Isella et al., 2018). Nevertheless, of the two possibilities for the absolute disk geometry, we suggest that the West side of the disk is the one closest to us: at every channel, the West side of the disk appears shorter when projected onto the rotation axis of the disk than the East side (see Figure 5.9 in Andrews et al., 2018)
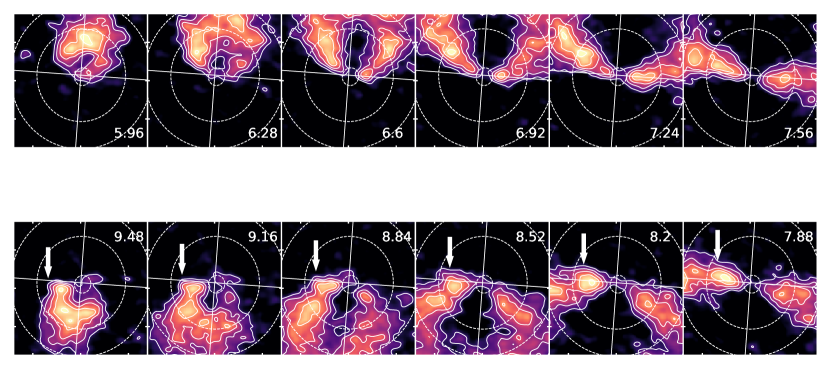
Finally, a close inspection of the channel maps revealed that redshifted emission close to the systemic velocity has a deviation or “kink” from the Keplerian iso-velocity curves that is not present in the blue-shifted channels. This kink is marked by an arrow on the bottom panels (redshifted channels) of Figure 7 (see Appendix) and appears at a PA of between .

3.3 Modeling CO kinematics
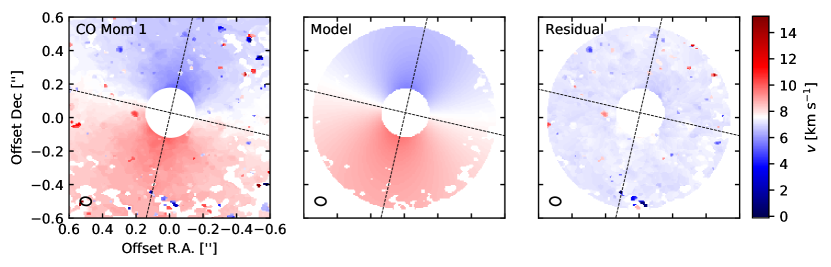
We model the Keplerian velocity field in HD 143006 using an analytical model of a razor-thin disk in Keplerian motion around a 1.8 M⊙ star, in order to constrain the global geometry of the disk. The model parameters are the inclination (), position angle (PA), systemic velocity (), as well as the right ascension and declination offsets () for the center of rotation. We fix the inner and outer radius of the disk to 0.3 and 250 au, respectively. For a given set of parameters we generate a velocity map that is convolved with the beam of our CO observations, which we then compare to the intensity-weighted velocity of CO (right panel of Figure 2) pixel by pixel. We perform our fit using an affine invariant MCMC sampler (, Foreman-Mackey et al., 2013), and sample the parameters with uniform priors in the following range: between [], PA between [], between [5 km s-1, 10 km s-1], and between [-0.2″, 0.2″]. The parameter space is explored with 80 walkers and for 4000 steps. From the last 2000 steps we compute the best-fit values, which correspond to the 50th percentile of the samples in the marginalized distributions, while the error bars correspond to the 16th and 84th percentiles. The best-fit parameters can be found on Table 1, while Figure 3 presents the velocity field of the observations, best-fit model, and residual (computed by subtracting the model from the observations). Although the best-fit model reproduces the velocity field of the outer disk, inwards of there are significant residuals that suggest gas moving at higher speeds than those in the model.
Note that if we separately fit the inner and outer disk kinematics, by masking the velocity field in Figure 3 inside and outside of (which corresponds to the mip-point separation between B8 and B40), we find two different disk geometries. First, a fit for the geometry of the outer disk while excluding the inner disk (i.e. masking those pixels inside of ), results in a PA consistent with the global fit in Table 1 but a slightly more face-on outer disk with an inclination of . On the other hand, when we only fit for the disk kinematics inside of (i.e. masking those pixels outside of ), we find and PA for the inner disk. Thus, we constrain a difference between the inner and outer disk geometry, in particular, the inclination of the disk changes from the inner to the outer disk (see Figure 8 on the Appendix, for the best-fit model and residuals when the inner or outer disk are masked).
| Parameter | Best-fit value | ||
|---|---|---|---|
| (mas) | |||
| (mas) | |||
| (∘) | |||
| PA | (∘) | ||
| km s-1 | |||
| Disk Geometry | Inner Disk | Outer Disk | |||||
|---|---|---|---|---|---|---|---|
| (∘) | |||||||
| (∘) | |||||||
| (mas) | |||||||
| (mas) | |||||||
| Ring or Arc Parameters | B8 | B40 | B64 | Arc | |||
| or | (Jy) | ||||||
| or | (au) | ||||||
| or | (au) | ||||||
| (au) | - | - | - | ||||
| (∘) | - | - | - | ||||
3.4 Modeling of continuum emission
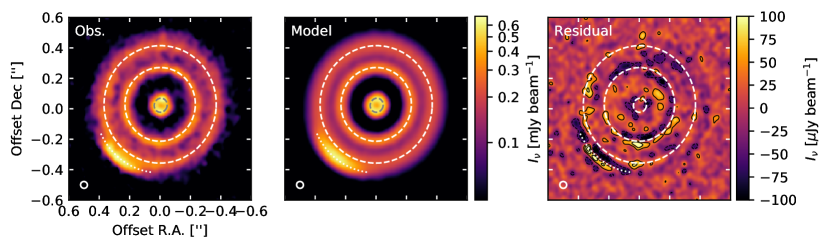
To constrain the observed substructure in this disk, we generate simple morphological models that describe the emission for the observed rings and the south-east arc. These models are constructed by combining the emission of three radially-Gaussian rings (that describe the B8, B40 and B64 features) and a two-dimensional Gaussian, in both the radial and azimuthal direction (that describes the outermost arc feature).
For every ring, its intensity is given by:
| (1) |
where is the peak intensity at radius , is the ring width, and the ring is assumed to be symmetric along the azimuthal direction. For the asymmetric arc feature, its intensity is given by:
| (2) |
where is the peak intensity at radius and azimuthal location , and , are the width of the 2D-Gaussian in the radial and azimuthal direction, respectively. The model adopted for the arc corresponds to the distribution of material in a steady-state vortex (Lyra & Lin, 2013).
Additional parameters of importance are any offset () that the rings may have from the phase center of the observations defined in §2, and the inclination () of each feature along a particular position angle (PA) on the sky. Given the evidence for a misalignment between the inner disk and outer disk presented in Benisty et al. (2018), as well as the evidence from modeling its velocity field (§3.3), we assume that the features found in the outer disk (i.e. B40, B64, and the arc) share the same center, inclination, and PA, while the innermost ring (B8) may have a different geometry due to the misalignment (i.e. different center, inclination, and PA). This results in a total of 22 free parameters that are constrained with over million visibilities. For a given set of parameters we produce a model image of the disk that is Fourier-transformed and sampled at the same locations in the uv-plane as the observed visibilities; for this we use the publicly available code Galario (Tazzari et al., 2018). To sample the PDF of our model parameters, we use the MCMC sampler (Foreman-Mackey et al., 2013) with 120 walkers that we ran for 25000 steps. Convergence was checked by measuring the autocorrelation time, which was under 3000 iterations. For each parameter we compute the posterior PDF by marginalizing over all but the parameter of interest over the last 15000 steps.
The best-fit values of the continuum emission model, chosen as the 50th percentile of the PDF, as well as the 1- uncertainty of each parameter from the 16th and 84th percentile of the PDF, are shown in Table 2. From the best-fit we construct model visibilities (sampled at the same locations in uv-space as the observed visibilities) and we compute residual visibilities by subtracting the model visibilities from the observations. Images of the best-fit model and residual, obtained with the same imaging parameters as the observations (see §2), are presented in Figure 4.
The morphological models employed here can reproduce the observed emission reasonably well, as can be seen in the residual map of Figure 4 where leftover emission is minimal and the largest residual is at . Huang et al. (2018a) find the rings locations directly on the image, resulting in differences of only 2-3% for the outermost, well-resolved, rings and a 30% difference in the radial location of B8, which due to its small angular size will have much less independent measurements on the image. The radial width of the rings increases as a function of distance from the star: our model constrains radial extents of 6, 10, and 22 au (in FWHM) for B8, B40, and B64. When fitting width of each ring directly on the image, Dullemond et al. (2018) find a similar but narrower ring widths for B40 and B64, 7% and 30% narrower, respectively.
As the rings are not completely symmetric in the azimuthal direction, for both B40 and B64 the radially-Gaussian rings cannot reproduce the excess of emission seen in the South of each ring. For the south-east arc, our model constrains a narrow extent in the radial direction with a factor of wider extent in the azimuthal direction, similar to that observed in other disks with arcs observed at lower angular resolution (e.g. Pérez et al., 2014). There are significant residuals at the arc location, in particular, the 2D-Gaussian prescription cannot properly describe the multiple peaks observed along the arc (Fig. 1, panel (b)), which appear also in the residual map at the level.
4 Discussion
4.1 Substructures in the ALMA images
The distribution of larger solids, as traced by the ALMA dust continuum observations, reveals a wealth of substructure in the HD 143006 disk (§3.4), while the distribution of CO emission exhibits little substructure (only in the innermost disk regions, §3.3). This difference may arise from the fact that the 1.25 mm dust emission is optically thin throughout the disk (Huang et al., 2018a), while the observed CO emission is optically thick and traces the surface layers of the disk.
Bright rings and dark annuli. For the dark annuli D22 and D51, there is not a corresponding decrement of CO emission in either the channel maps (Figure 5.9 Andrews et al., 2018) or the integrated CO emission map (Figure 2, right panel). Assuming that the dust depletion observed in the outermost dark annulus originates from dynamical clearing by objects embedded in the disk, Zhang et al. (2018) infer masses of and , for planets inside D22 and D51, respectively.
On the other hand, there is a decrement of both CO and dust emission inside B8. In particular, CO emission does not appear to be centrally-peaked, either on the integrated emission map (moment 0 map, left panel of Figure 2) or in the peak emission map (moment 8 map, right panel of Figure 5). Although both these maps are susceptible to beam dilution effects (Weaver et al., 2018), which may cause an “false” inner cavity in the gas, the lack of CO emission inside B8 is also observed in the channel maps away from the systemic velocity (see appendix Figure 7, and Figure 5.9 in Andrews et al., 2018), meaning that there is some depletion of the CO column density inside of 15 au ( mas). We note that the lack of gas emission inside B8 cannot be explained by absorption from optically thick dust in the inner disk, since we also observe a dust emission deficit inside B8 and the emission from dust is optically thin throughout (Huang et al., 2018a). Most likely, the depletion of CO inside B8 is quite large, for example, in transition disk cavities with centrally-peaked CO emission, the depletion has been measured to be more than an order of magnitude (van der Marel et al., 2015), and in the case of HD 143006 we do not observe a centrally peaked CO.
A possible origin for the depleted inner disk is photoevaporation, however, the star is accreting at a moderate rate ( yr-1, Rigliaco et al., 2015) and the near infrared excess points to a dust-rich inner disk, making this possibility less likely. A perturber inside B8 could deplete both gas and dust, and even misalign the inner disk, a possibility that will be discussed in §4.3.
Bright arc in the south-east. Vortices are regions of higher gas pressure that can very efficiently trap solids (e.g., Barge & Sommeria, 1995; Klahr & Henning, 1997; Baruteau & Zhu, 2016). We model the arc emission with a prescription for the distribution of dust in a vortex that has reached steady-state (Lyra & Lin, 2013), and which should be smooth in the radial and azimuthal direction. However, the prominent arc in the 1.25 mm continuum images has further substructure: three separate peaks that are unresolved in the radial direction (see residual map in Figure 4), with a separation of au from the central peak. During their lifetime, vortices may never reach a stable equilibrium. For example, simulations have shown that when the back-reaction of the dust onto the gas is taken into account, vortices may trap particles not in a single but in multiple structures, and it is this dust feedback that would eventually lead to the destruction of the vortex (see, e.g., Fu et al., 2014). Thus, it is not surprising that the observed arc has internal substructure.
The radial and azimuthal extent of the arc constrained by our model is about 5 by 21 au. From the midplane temperature profile () assumed in Huang et al. (2018a), we estimate that at the vortex location ( au), the pressure scale height corresponds to au (assuming a local sound speed of , and ). Thus, the vortex is radially as wide as and it extends azimuthally over a few pressure scale heights, still consistent with the vortex scenario. In particular, the au azimuthal extent is consistent with that of vortices formed at the edge of a gap/cavity, as it has a much smaller width than the -wide vortices expected due to instabilities at the dead zone (Regály et al., 2017). However, the arc is outside of the millimeter dust disk, rather than at the edge of a dark annulus, and it is radially separated from B64 by au. Such a configuration is similar to that of the disk in HD 135344B, which resolves into a narrow ring with an asymmetric arc outside of the ring (Cazzoletti et al., 2018). Simulations by Lobo Gomes et al. (2015) show that after a vortex forms at the edge of a planet-induced gap, the surface density can be enhanced further out in the disk than at the initial vortex location. Such density enhancement triggers again the Rossby wave instability and a second generation vortex may form beyond the primary, leaving only the outermost vortex once the first one is damped. Thus, a second-generation vortex may explain the location of the observed arc in the outer disk of HD 143006.
We note that the vortex-like structure is not associated to spiral arms in scattered light (Benisty et al., 2018), unlike the well-studied cases of MWC 758 (Dong et al., 2018), HD 142527 (Avenhaus et al., 2014) and HD 135344B (Stolker et al., 2016), which in addition are classified as transition disks from their spectral energy distribution and whose central stars are Herbig ABe objects.
4.2 Substructures seen in scattered light
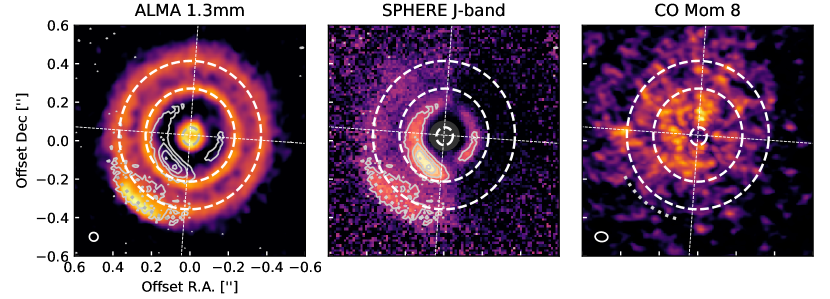
Figure 5 presents our continuum image (left), the polarized scattered light coronagraphic image of HD 143006 obtained with VLT/SPHERE111We note that the SPHERE infrared (1.2 m) image has a resolution of 37 mas, comparable to the spatial resolution of the ALMA observations (Benisty et al., 2018). (middle), and the peak intensity of the CO line at each velocity, also known as moment 8 map (right). The scattered light image is a good tracer of small micron-sized dust grains located in tenuous disk surface layers, while the ALMA continuum image traces the millimeter-sized dust grains at the midplane. The peak intensity of the (optically thick) gas emission from CO (moment 8 image) also traces the upper disk layers.
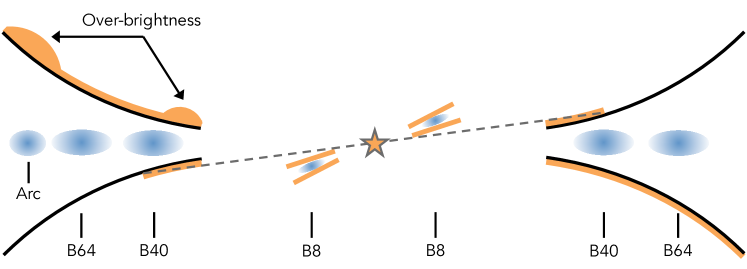
Each pixel of the scattered-light image (middle panel, Figure 5) was scaled by , where is the distance to the central star, to compensate for the drop off in stellar illumination and allow a better detection of faint outer disk features. In this image, a broad shadow in the West, covering half of the disk, is present. In addition, the SPHERE image shows from inside out: a gap/cavity beyond the coronagraph radius (80 mas, 13 au), a non-symmetric ring with two narrow shadow lanes aligned along the North-South direction, a gap not completely devoid of emission, and a non-symmetric outer disk. Both the outer disk and the inner ring present an over-brightness along a small range of position angles (PA100-170∘, see contours in Figure 5).
4.2.1 Comparison with CO emission
As the CO line is optically thick, its intensity probes the temperature of the emitting gas, which, in turn, depends on the amount of starlight received at the disk surface. In scattered light, the outer part of the disk is not detected in the West, indicating a drop of irradiation. To first approximation, the temperature of the CO emitting layer should scale as the received luminosity to the power, thus, we should also expect an East-West brightness asymmetry in the peak intensity CO map (left panel, Figure 5). We measure a East-West contrast in the CO peak intensity map of roughly . The difference between the level of asymmetry in the scattered-light image and in the moment 8 map is likely related to the different depths of the 1 layers in the two tracers. We note however that no substructure in the CO channel maps or moment maps is found to coincide with the narrow shadow lanes in the inner ring of the scattered light image.
The absence of an over-brightness in the CO peak intensity map at the location of the millimeter arc suggests that the over-brightness observed in scattered light does not only originate from an effect of a stronger irradiation. And since the continuum emission in the arc is not optically thick ( at the peak) this is unlikely an issue of continuum subtraction of optically thick emission on the CO line. As the inner disk is not probed by the SPHERE data, we cannot further compare the observed depletion of the CO column density inside of 15 au ( mas) discussed in §4.1. Interestingly, the “kink” seen in the channel maps (§3.2, also see Figure 7 in the appendix) roughly coincides in radius and azimuthal extent with the over-brightness seen in scattered light along the inner ring.
4.2.2 Comparison with dust continuum
The comparison between the ALMA continuum and the SPHERE scattered light images indicates striking differences. Apart from the bright prominent arc in the outer disk, none of the features appear co-radial and none of the azimuthal asymmetries seen in scattered light have counterparts in the continuum image. Such differences are expected, as the two images trace distinct layers of the disk and different dust particles. The scattered light image shows the regions of the disk that are directly lit by the star and its appearance strongly depends on the shape of the disk surface, while the 1.25 mm continuum image shows the midplane features, whose brightness depend on the dust density, temperature, and opacity. An schematic of the features observed in the HD 143006 disk is presented in Figure 6 and will be discussed here.
Radial distribution. While B8 is masked by the SPHERE coronagraph, the inner ring in scattered light appears located inside B40 (see middle panel of Figure 5), indicating that micron-sized grains are extending further in than the mm-sized grains. Such a spatial segregation by particle size is a natural outcome of dust trapping by a massive planet (Rice et al., 2006; Zhu et al., 2012; de Juan Ovelar et al., 2013; Pinilla et al., 2015) and has already been observed in transition disks (e.g., Garufi et al., 2013). If the inner scattered-light ring traces the edge of the gap, it would be directly illuminated by the star and “puff-up”. We propose that B40 lies in its shadow, which is supported by a darker region seen just beyond the scattered-light inner ring (on the East side of the disk), and that the outer disk re-emerges from the shadow at a larger distance from the star (e.g., Dullemond & Dominik, 2004; Isella & Turner, 2018).
We note that a projected radial offset between the features seen in scattered light and in the millimeter could be expected due to the disk inclination and position angle, the opening angle of the scattering surface, and the vertical structure of the ring (Dong et al., 2018). However, such an effect is considerable only for high disk inclinations. In that case, on the near side of the disk the scattered-light ring should appear inside B40, while on the far side, it should appear outside of it. That is not what we observe: the inner scattered-light ring is inside B40 at all position angles at which it is detected.
It is possible that a companion between B8 and B40 is shaping the disk, leading to the observed radial segregation and to a dust-depleted gap in both tracers of small and large dust grains. In this paper series, Zhang et al. (2018) constrain a planet mass of based solely on the deep gap observed in ALMA images between B8 and B40. Such a high mass companion is consistent with the hydrodynamic simulations coupled with dust evolution from de Juan Ovelar et al. (2013), which require a planet more massive than to be responsible for the observed radial segregation by particle size. Although we find a strong depletion in small grains that are well coupled to the gas, we do not detect clear depletion in CO emission between B8 and B40, suggesting that dust grains are filtered and that gas can still flow through the gap, similar to what is often seen in transition disks (Pinilla et al., 2015).
Azimuthal asymmetries. The large East/West shadow (and the additional two narrow shadow lanes) observed in the SPHERE image can be explained by a moderate misalignment of 20-30∘ between the inner and outer disk (Benisty et al., 2018, see also schematics in Figure 6). As shown in the residual map of Figure 4, B40 and B64 are symmetric, and we find no evidence for a counterpart of the East/West shadow in the continuum observations that would indicate inhomogeneities in the dust temperature. This supports the finding of Huang et al. (2018a), where the rings in HD 143006 are optically thin. Indeed, a configuration in which the inner and outer disks are moderately misaligned (see Figure 6) would lead to e.g. the West side of the disk in the shadow while the East side is irradiated, for the front side of the disk that is facing us. On the backward-facing side of the disk (not seen by the observer) the opposite happens: the East side is in the shadow while the West is irradiated. If the disk is vertically optically thin, and the continuum emission traces the full vertical extent of the disk, the asymmetry will cancel out between the two sides, and the continuum emission would appear symmetric. We note however the presence of residuals (up to 7) in the south (PA180∘) at the location where the East/West shadow starts. As in the CO data, there is no evidence for counterparts to the narrow shadow lanes in the continuum observations, unlike what is observed in two transition disks so far (DoAr 44, J1604; Casassus et al., 2018; Pinilla et al., 2018).
The bright arc in the ALMA image coincides with the over-brightness seen in the outer disk of the SPHERE image (see contours in Figure 5 and diagram in Figure 6). If the arc traces an over-density in large grains, we also expect an enhancement of small particles due to fragmentation, and if turbulent mixing over the vertical height of the disk allows it, a small-particle enhancement should be seen from the surface layers as well. Additionally, the small grains seem to extend further, and over a wider range of position angles, than the larger particles, which is one of the predictions of dust trapping in a vortex (Baruteau & Zhu, 2016). Future observations at shorter/longer ALMA wavelengths can test this idea by measuring the spread/concentration of particles over the arc location.
The inner ring from the scattered-light image shows a strong over-brightness that has no counterpart in the ALMA continuum image (see contours inside B40 in Figure 5), and that is likely due to an irradiation effect and local change in scale height. Interestingly, it lies over a range of position angles similar to the one over which the arc extends in the ALMA continuum image. If the line-up is not coincidental, it must be related to a radiative effect as any physical structure at such different radii would shear away the alignment quickly due to different angular rotation velocities. However, it is possible that the over-brightness along the first scattered-light ring further extends to the West (in the shadowed region), and that it covers a much broader range of position angles. In that case, the line-up could be coincidental.
In general, such differences likely mean that the small grains in the surface layers are only marginally affected by dynamical processes (while large grains in the midplane are), but are instead very much affected by irradiation processes.
4.3 A misalignment between inner and outer disk
Our continuum emission modeling indicates that the inner and outer disk do not share the same geometry, which is expected based on the shadows observed in the SPHERE image (Benisty et al., 2018). The inner disk appears inclined by 24∘ with a PA of 164∘, while the outer disk has a lower inclination of 17∘ with a PA of 176∘, this difference in geometry is of high statistical significance (see Table 2). Based on these values, we can estimate the misalignment angle between the inner and outer disks, defined as the angle between the normal vectors to the disks. Assuming the values above, we find a small misalignment of 8∘. However, this assumes that the inner and outer disks share the same near side of the disk (the side closer to us), which cannot be determined with the continuum data alone. If instead, the near sides do not coincide (e.g., the near side of the outer disk is in the East, while the near side of the inner disk is in the West), the misalignment would be much larger, of 41∘ (computed using for the inner disk, the rest of the parameters being the same as above). In this case, once projected onto the plane of the sky, the inner disk rotation would appear as counter-rotating with respect to the outer disk. This is not something seen in the CO data (at an angular resolution of 6649 mas, au), in particular at the highest velocities. Nevertheless, the fit of the intensity-weighted velocity map with a Keplerian disk model shows residuals inside , supporting a different geometry than the one of the outer disk.
The location of the shadows seen in scattered light depend on the inner and outer disk geometry, and on the height of the scattering surface () of the disk where the shadows are seen. Using the equations developed in Min et al. (2017), we find a of 0.03 and 0.16 at 18 au (the location of the inner scattered light ring), for misalignment angles of and , respectively. Since the pressure scale height of the disk, , should be smaller than the scattering surface (by a factor of 2-4), we expect and 0.08 at 18 au, for misalignment angles of and , respectively. From the standard temperature profile assumed in Huang et al. (2018a), we estimate that at 18 au . Given the small expected for a misalignment and the larger value of the pressure scale height as estimated above from standard assumptions, we favor the larger misalignment value of .
The overall morphology of the shadows in the scattered light image were reproduced by a circumbinary disk that is broken and misaligned by 30∘ (Benisty et al., 2018), due to an inclined equal-mass binary (see the hydrodynamical simulations by Facchini et al., 2018). We note however, that the value of the misalignment needed to reproduce the scattered light image is model-dependent, and depends on the exact geometry of the inner disk as well as on the shape of the outer disk rim considered in the model.
The presence of an equal mass binary companion, as well as of any companion with a mass ratio larger than q=0.2 (corresponding to 0.3 M⊙), can be ruled out as it would have been detected by imaging and interferometric surveys (Kraus et al., 2008; Benisty et al., 2018). However, an inclined low-mass stellar companion, as the one detected in the wide gap of HD 142527 (with a mass 0.13 M⊙), could be responsible for the misalignment (Price et al., 2018), and secular precession resonances can result in large misalignments for companions with mass ratio of 0.01-0.1 (Owen, & Lai, 2017). A massive planet could in principle also lead to a misaligned inner disk as long as its angular momentum is larger than that of the inner disk (e.g. Xiang-Gruess & Papaloizou, 2013; Bitsch et al., 2013; Matsakos & Königl, 2017), i.e., in cases where the inner disk is depleted.
In any case, it is not clear whether the putative companion responsible for the misalignment in HD 143006 should be located in the gap between B8 and B40, or between B8 and the dust sublimation edge. The spectral energy distribution indicates the presence of hot dust close to the sublimation radius, which was spatially resolved by near-infrared interferometry (Lazareff et al., 2017), suggestive of the presence of (at least) another ring of small dust in the innermost au where mm-sized grains are depleted.
5 Conclusions
From the DSHARP ALMA observations of the HD 143006 protoplanetary disk that reach au in spatial resolution, and its comparison with existing scattered-light observations at similar spatial resolution, we conclude the following:
-
•
In terms of substructure, the dust continuum emission from HD 143006 reveals three bright rings, two dark gaps, and an arc at the edge of the dusty disk. The CO observations at similar angular resolution exhibit a depletion of gas emission in the inner disk with no significant features, except for a deviation or “kink” from the Keplerian rotation pattern over a few red-shifted channels close to the systemic velocity.
-
•
From different tracers of the disk structure we find further evidence for a misalignment between the inner and outer disk: a fit to the disk Keplerian velocities with a global/single disk geometry does not account well for the inner disk kinematics, while modeling of dust continuum emission results in a more inclined inner disk (as traced by B8) than the outer disk (as traced by B40, B64, and the south-east arc). These findings are in agreement with existing VLT/SPHERE images that suggest a disk misalignment from the presence of shadows.
-
•
The prominent south-east arc in the ALMA 1.25 mm image resolves into three peaks along its azimuthal extent. The counterpart to this arc in the scattered-light image shows a broader radial and azimuthal extent, indicative of segregation by particle size as would be expected for a dust-trapping vortex at this location. Future observations at longer wavelengths should be able to test this scenario.
-
•
The bright rings have increasingly larger radial widths with increasing distance from the star. We find evidence for radial segregation by particle size at the outer edge of the gap between B8 and B40, and a strong depletion of small and large grains in the gap. These are consistent with a companion carving the gap. However, no dark annulus is observed in CO emission at this radius, suggesting that dust grains are filtered but gas can still flow through the gap.
Future observations at longer millimeter wavelengths will allow us to determine if there is efficient trapping of dust at the substructures location, if these are due to localized pressure maxima, and in particular to understand if the arc traces a vortex. Observing gas tracers at high spectral resolution will also be fundamental to elucidate the absolute misalignment of the inner disk and to determine the velocity structure at the arc location.
Appendix A Additional Figures
Here we present additional supporting figures. First, a zoom-in to the channel maps near the systemic velocity that show a “kink” on the red-shifted channels (bottom panels of Figure 7) that is not present on the blue-shifted channels (top panels of Figure 7). Second, Figure 8 shows how the Keplerian velocity fit differs when the intensity-weighted velocity field map has been masked inside 0.15′′ (top panels, Figure 8) and masked outside of (bottom panels, Figure 8).

References
- ALMA Partnership et al. (2015) ALMA Partnership, Brogan, C. L., Pérez, L. M., et al. 2015, ApJ, 808, L3.
- Andrews et al. (2018) Andrews, S. M., Huang, J., Pérez, L. M., et al. 2018, ApJ, in press.
- Ataiee et al. (2013) Ataiee, S., Pinilla, P., Zsom, A., et al. 2013, A&A, 553, L3.
- Avenhaus et al. (2014) Avenhaus, H., Quanz, S. P., Schmid, H. M., et al. 2014, ApJ, 781, 87.
- Avenhaus et al. (2018) Avenhaus, H., Quanz, S. P., Garufi, A., et al. 2018, ApJ, 863, 44.
- Bai & Stone (2014) Bai, X.-N., & Stone, J. M. 2014, ApJ, 796, 31
- Barenfeld et al. (2016) Barenfeld, S. A., Carpenter, J. M., Ricci, L., et al. 2016, ApJ, 827, 142.
- Barge & Sommeria (1995) Barge, P., & Sommeria, J. 1995, A&A, 295, L1
- Baruteau & Zhu (2016) Baruteau, C., & Zhu, Z. 2016, MNRAS, 458, 3927
- Benisty et al. (2017) Benisty, M., Stolker, T., Pohl, A., et al. 2017, A&A, 597, A42.
- Benisty et al. (2018) Benisty, M., Juhász, A., Facchini, S., et al. 2018, A&A, 619, A171
- Béthune et al. (2017) Béthune, W., Lesur, G., & Ferreira, J. 2017, A&A, 600, A75
- Birnstiel et al. (2010) Birnstiel, T., Dullemond, C. P., & Brauer, F. 2010, A&A, 513, A79.
- Birnstiel et al. (2013) Birnstiel, T., Dullemond, C. P., & Pinilla, P. 2013, A&A, 550, L8.
- Bitsch et al. (2013) Bitsch, B., Crida, A., Libert, A.-S., et al. 2013, A&A, 555, A124.
- Bouvier et al. (2007) Bouvier, J., Alencar, S. H. P., Boutelier, T., et al. 2007, A&A, 463, 1017.
- Brauer et al. (2007) Brauer, F., Dullemond, C. P., Johansen, A., et al. 2007, A&A, 469, 1169.
- Casassus et al. (2013) Casassus, S., van der Plas, G., M, S. P., et al. 2013, Nature, 493, 191.
- Casassus et al. (2015) Casassus, S., Marino, S., Pérez, S., et al. 2015, ApJ, 811, 92.
- Casassus et al. (2018) Casassus, S., Avenhaus, H., Pérez, S., et al. 2018, MNRAS, 477, 5104.
- Cazzoletti et al. (2018) Cazzoletti, P., van Dishoeck, E. F., Pinilla, P., et al. 2018, A&A, 619, A161
- Cody et al. (2014) Cody, A. M., Stauffer, J., Baglin, A., et al. 2014, AJ, 147, 82.
- Crida & Morbidelli (2007) Crida, A., & Morbidelli, A. 2007, MNRAS, 377, 1324.
- de Juan Ovelar et al. (2013) de Juan Ovelar, M., Min, M., Dominik, C., et al. 2013, A&A, 560, A111.
- Dittrich et al. (2013) Dittrich, K., Klahr, H., & Johansen, A. 2013, ApJ, 763, 117
- Dong et al. (2018) Dong, R., Liu, S.-. yuan ., Eisner, J., et al. 2018, ApJ, 860, 124.
- Dullemond & Dominik (2004) Dullemond, C. P., & Dominik, C. 2004, A&A, 417, 159
- Dullemond et al. (2018) Dullemond, C.-P., et al. 2018, ApJ, in press.
- Facchini et al. (2018) Facchini, S., Juhász, A., & Lodato, G. 2018, MNRAS, 473, 4459.
- Flock et al. (2017) Flock, M., Fromang, S., Turner, N. J., et al. 2017, ApJ, 835, 230.
- Foreman-Mackey et al. (2013) Foreman-Mackey, D., Hogg, D. W., Lang, D., & Goodman, J. 2013, PASP, 125, 306
- Fu et al. (2014) Fu, W., Li, H., Lubow, S., Li, S., & Liang, E. 2014, ApJ, 795, L39
- Gaia Collaboration et al. (2018) Gaia Collaboration, Brown, A. G. A., Vallenari, A., et al. 2018, A&A, 616, A1
- Garufi et al. (2013) Garufi, A., Quanz, S. P., Avenhaus, H., et al. 2013, A&A, 560, A105.
- Garufi et al. (2018) Garufi, A., Benisty, M., Pinilla, P., et al. 2018, A&A, 620, A94
- Huang et al. (2018a) Huang, J., Andrews, S. M., Dullemond, C. P., et al. 2018, ApJ, in press.
- Huang et al. (2018b) Huang, J., Andrews, S. M., Pérez, L. M., et al. 2018, ApJ, submitted.
- Isella et al. (2013) Isella, A., Pérez, L. M., Carpenter, J. M., et al. 2013, ApJ, 775, 30.
- Isella & Turner (2018) Isella A., & Turner, N. J. 2018, ApJ, 860, 27.
- Isella et al. (2018) Isella, A., Huang, J., Andrews, S. M., et al. 2018, ApJ, in press.
- Johansen et al. (2009) Johansen, A., Youdin, A., & Klahr, H. 2009, ApJ, 697, 1269
- Klahr & Henning (1997) Klahr, H. H., & Henning, T. 1997, Icarus, 128, 213
- Kraus et al. (2008) Kraus, A. L., Ireland, M. J., Martinache, F., et al. 2008, ApJ, 679, 762.
- Kretke, & Lin (2007) Kretke, K. A., & Lin, D. N. C. 2007, ApJ, 664, L55.
- Lazareff et al. (2017) Lazareff, B., Berger, J.-P., Kluska, J., et al. 2017, A&A, 599, A85
- Li et al. (2000) Li, H., Finn, J. M., Lovelace, R. V. E., et al. 2000, ApJ, 533, 1023.
- Lobo Gomes et al. (2015) Lobo Gomes, A., Klahr, H., Uribe, A. L., et al. 2015, ApJ, 810, 94.
- Lyra & Lin (2013) Lyra, W., & Lin, M.-K. 2013, ApJ, 775, 17
- Loomis et al. (2017) Loomis, R. A., Öberg, K. I., Andrews, S. M., et al. 2017, ApJ, 840, 23.
- Marino et al. (2015) Marino, S., Perez, S., & Casassus, S. 2015, ApJ, 798, L44.
- Matsakos & Königl (2017) Matsakos, T., & Königl, A. 2017, AJ, 153, 60.
- Meheut et al. (2012) Meheut, H., Meliani, Z., Varniere, P., et al. 2012, A&A, 545, A134.
- Min et al. (2017) Min, M., Stolker, T., Dominik, C., et al. 2017, A&A, 604, L10.
- Okuzumi et al. (2016) Okuzumi, S., Momose, M., Sirono, S.-. iti ., et al. 2016, ApJ, 821, 82.
- Owen, & Lai (2017) Owen, J. E., & Lai, D. 2017, MNRAS, 469, 2834.
- Paardekooper & Mellema (2004) Paardekooper, S.-J., & Mellema, G. 2004, A&A, 425, L9
- Pecaut et al. (2012) Pecaut, M. J., Mamajek, E. E., & Bubar, E. J. 2012, ApJ, 746, 154
- Pérez et al. (2014) Pérez, L. M., Isella, A., Carpenter, J. M., & Chandler, C. J. 2014, ApJ, 783, L13
- Perez et al. (2015) Perez, S., Dunhill, A., Casassus, S., et al. 2015, ApJ, 811, L5
- Pinilla et al. (2012a) Pinilla, P., Birnstiel, T., Ricci, L., et al. 2012, A&A, 538, A114.
- Pinilla et al. (2012b) Pinilla, P., Benisty, M., & Birnstiel, T. 2012, A&A, 545, A81.
- Pinilla et al. (2015) Pinilla, P., de Juan Ovelar, M., Ataiee, S., et al. 2015, A&A, 573, A9.
- Pinilla et al. (2015) Pinilla, P., de Boer, J., Benisty, M., et al. 2015, A&A, 584, L4
- Pinilla et al. (2018) Pinilla, P., Benisty, M., de Boer, J., et al. 2018, ApJ, 868, 85
- Pinte et al. (2018) Pinte, C., Price, D. J., Ménard, F., et al. 2018, ApJ, 860, L13.
- Preibisch et al. (2002) Preibisch, T., Brown, A. G. A., Bridges, T., Guenther, E., & Zinnecker, H. 2002, AJ, 124, 404
- Price et al. (2018) Price, D. J., Cuello, N., Pinte, C., et al. 2018, MNRAS, 477, 1270.
- Regály et al. (2012) Regály, Z., Juhász, A., Sándor, Z., et al. 2012, MNRAS, 419, 1701.
- Regály et al. (2017) Regály, Z., Juhász, A., & Nehéz, D. 2017, ApJ, 851, 89.
- Rice et al. (2006) Rice, W. K. M., Armitage, P. J., Wood, K., et al. 2006, MNRAS, 373, 1619.
- Rigliaco et al. (2015) Rigliaco, E., Pascucci, I., Duchene, G., et al. 2015, ApJ, 801, 31.
- Rosenfeld et al. (2012) Rosenfeld, K. A., Qi, C., Andrews, S. M., et al. 2012, ApJ, 757, 129.
- Rosenfeld et al. (2013) Rosenfeld, K. A., Andrews, S. M., Hughes, A. M., Wilner, D. J., & Qi, C. 2013, ApJ, 774, 16
- Rosenfeld et al. (2014) Rosenfeld, K. A., Chiang, E., & Andrews, S. M. 2014, ApJ, 782, 62.
- Simon & Armitage (2014) Simon, J. B., & Armitage, P. J. 2014, ApJ, 784, 15
- Stolker et al. (2016) Stolker, T., Dominik, C., Avenhaus, H., et al. 2016, A&A, 595, A113.
- Suriano et al. (2018) Suriano, S. S., Li, Z.-Y., Krasnopolsky, R., & Shang, H. 2018, MNRAS, 477, 1239
- Tazzari et al. (2018) Tazzari, M., Beaujean, F., & Testi, L. 2018, MNRAS, 476, 4527.
- Teague et al. (2018) Teague, R., Bae, J., Bergin, E. A., et al. 2018, ApJ, 860, L12.
- van der Marel et al. (2015) van der Marel, N., van Dishoeck, E. F., Bruderer, S., Pérez, L., & Isella, A. 2015, A&A, 579, A106
- Walsh et al. (2017) Walsh, C., Daley, C., Facchini, S., et al. 2017, A&A, 607, A114.
- Weaver et al. (2018) Weaver, E., Isella, A., & Boehler, Y. 2018, ApJ, 853, 113.
- Xiang-Gruess & Papaloizou (2013) Xiang-Gruess, M., & Papaloizou, J. C. B. 2013, MNRAS, 431, 1320.
- Zhang et al. (2018) Zhang, S., Zhu, Z., Huang, J., et al. 2018, ApJ, in press.
- Zhang et al. (2015) Zhang, K., Blake, G. A., & Bergin, E. A. 2015, ApJ, 806, L7
- Zhu et al. (2011) Zhu, Z., Nelson, R. P., Hartmann, L., et al. 2011, ApJ, 729, 47.
- Zhu et al. (2012) Zhu, Z., Nelson, R. P., Dong, R., Espaillat, C., & Hartmann, L. 2012, ApJ, 755, 6
- Zhu & Stone (2014) Zhu, Z., & Stone, J. M. 2014, ApJ, 795, 53.
- Zhu & Baruteau (2016) Zhu, Z., & Baruteau, C. 2016, MNRAS, 458, 3918.