Identifying the Mechanism of Continued Growth of the Solid-Electrolyte Interphase
Abstract
Continued growth of the solid electrolyte interphase (SEI) is the major reason for capacity fade in modern lithium-ion batteries. This growth is made possible by a yet unidentified transport mechanism that limits the passivating ability of the SEI towards electrolyte reduction. We, for the first time, differentiate the proposed mechanisms by analyzing their dependence on the electrode potential. Our calculations are compared to recent experimental capacity fade data. We show that the potential dependence of SEI growth facilitated by solvent diffusion, electron conduction, or electron tunneling qualitatively disagrees with the experimental observations. Only diffusion of Li-interstitials results in a potential dependence matching to the experiments. Therefore, we identify Li-interstitial diffusion as the cause of long-term SEI growth.
keywords:
SEI,Lithium-Ion,Battery[A-]appendix German Aerospace Center]German Aerospace Center (DLR), Institute of Engineering Thermodynamics, Pfaffenwaldring 38-40, 70569 Stuttgart, Germany \alsoaffiliation[Helmholtz Institute Ulm]Helmholtz Institute Ulm (HIU), Helmholtzstraße, 11, 89081 Ulm, Germany \alsoaffiliation[German Aerospace Center]German Aerospace Center (DLR), Institute of Engineering Thermodynamics, Pfaffenwaldring 38-40, 70569 Stuttgart, Germany \alsoaffiliation[Helmholtz Institute Ulm]Helmholtz Institute Ulm (HIU), Helmholtzstraße, 11, 89081 Ulm, Germany University of Ulm]University of Ulm, Institute of Electrochemistry, Albert-Einstein-Allee 47, 89069 Ulm, Germany German Aerospace Center]German Aerospace Center (DLR), Institute of Engineering Thermodynamics, Pfaffenwaldring 38-40, 70569 Stuttgart, Germany \alsoaffiliation[Helmholtz Institute Ulm]Helmholtz Institute Ulm (HIU), Helmholtzstraße, 11, 89081 Ulm, Germany \abbreviationsSEI
Despite all recent advances, lithium-ion batteries still suffer from continued capacity fade which ultimately limits battery lifetime. A multitude of processes contribute to the capacity fade. These mechanisms depend on operating conditions as well as on battery chemistry. However, generally, anodic side reactions are found to be the main contributor to capacity fade 1, 2. These reactions reduce electrolyte components, e.g., ethylene dicarbonate (EC), while irreversibly consuming cyclable lithium. They proceed rapidly on a pristine electrode until they are suppressed by the solid electrolyte interphase (SEI). SEI is a thin film which covers the electrode surface and consists of insoluble products of anodic reactions 3, 4, 5, 6, 7, 8.
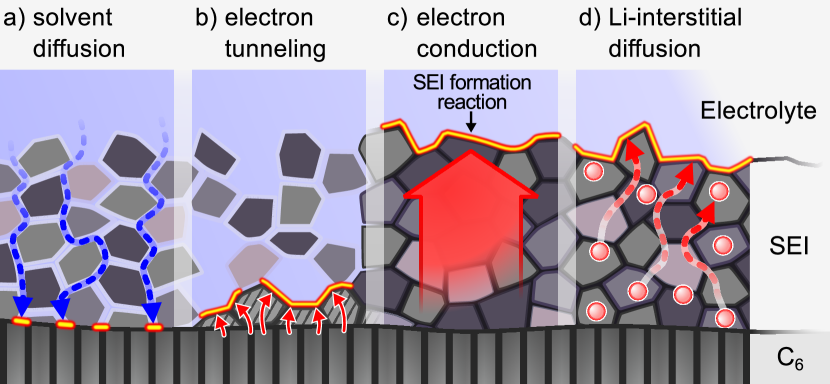
Atomistic simulation methods cover the short-term SEI formation occurring during the first few battery cycles (see Bedrov et al. 9). After this formation stage, the long-term SEI growth rate is limited by the rate at which SEI precursors traverse the SEI. The transport mechanism enabling this flux is referred to as the long-term growth mechanism (LTGM). Even though numerous publications discuss long-term SEI growth 10, 11, 12, 13, 14, 15, 16, 17, 18, 19, 20, 21 , the LTGM has not been identified. Several different LTGMs are suggested and studied with continuum models as depicted in fig. 1.
- a)
- b)
- c)
- d)
Importantly, these four mechanisms predict a similar evolution of long-term capacity fade. Besides electron tunneling, all mechanisms directly result in the experimentally observed dependence of capacity fade. Electron tunneling predicts a dependence which fits reasonably well to the behaviour if another contribution linear in time is added 14, 23. Such a term can be attributed to multiple processes which we discuss below.
Therefore, additional dependencies must be studied in order to identify the correct mechanism (or to rule out others). For this reason, we have introduced a SEI model predicting SEI morphology in previous studies 16, 17. If SEI porosity and thickness is measured, e.g., with neutron reflectometry 24, our model offers an alternative feature to compare and validate SEI theory with experiments. Furthermore, we used our models to compare different LTGMs and their response to small porosity fluctuations. Based on this comparison, we concluded that solvent diffusion is unlikely to be LTGM 17.
In this paper, we finally identify the LTGM by comparing the rate of SEI formation at different electrode potentials to experimental capacity fade data. This dependence has already been used by Tang et al.12 to rule out solvent diffusion as possible LTGM. We, however, perform a more comprehensive comparison with more recent experimental data provided by Keil et al. 1, 2
The capacity fade of commercial NCA cells has been measured during long-term open circuit storage. 1, 2 Individual cells were stored at one of 16 different states of charge (SoC), each corresponding to a specific anode potential. These cells were stored for 9.5 months at 50. As capacity fade during open circuit storage leads to self-discharge, checkup sequences were regularly performed. After these sequences, the SoC referenced to the current cell capacity reached its initial value. The complete measurements are presented in fig. 8 of ref. 2. They provide a unique opportunity to compare all plausible LTGMs with respect to the emerging potential dependence.
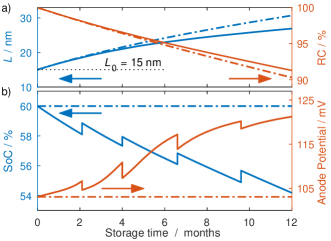
To this aim, we formulate a model and simulate the evolution of the irreversible capacity and the SoC of a single battery during the experiment. The full model is derived in the electronic supporting information (SI). An example simulation is presented in fig. 2. During storage, the SEI thickness increases while the relative capacity (RC) of the cell decreases, see fig. 2a. In fig. 2b we show the evolution of the SoC which decreases smoothly. Note that in this paper we reference the SoC to the capacity of a fresh cell. With this definition, the SoC increases during the periodically performed check-up sequences, but does not reach its initial value. Also shown is the corresponding potential of the negative electrode . We determine this potential for a given SoC with the OCV measured by Keil et al. 1, shown in fig. 3a.
In our model we assume that capacity fade is the sum of two distinct contributions, . The former part includes the amount of lithium that is irreversibly consumed by SEI formation during the storage experiment. It is directly coupled to the SEI thickness and the rate can have a strong dependence on the anode potential, depending on the LTGM assumed. For the latter part we assume no such dependence. This contribution is assumed to increase at a constant rate in time and factors in various mechanisms, e.g., rapid reformation of SEI due to cracks and delamination of the existing film. Cracks and delamination of SEI occur during the periodic checkup sequences. Such physical stress also causes electrode particles to loose contact to the current collector which causes an irreversible loss of lithium.
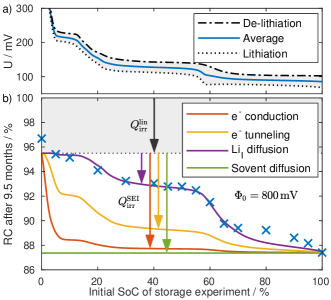
We now simulate the storage experiment using different initial SoCs with each of the SEI formation mechanism mentioned above. The capacity fade from these simulations is compared to the experimentally measured one in fig. 3b. The SoC dependence of the relative capacity is evident and a correlation to the potential of the negative electrode (shown above) can be made out with the naked eye. Capacity fade experiences a significant increase at SoCs larger than 60% which correlates to the potential step of the OCV. Furthermore, capacity fade remains nearly constant in SoC regions which correspond to the voltage plateaus of graphite.
As elaborated above, we split capacity fade into two contributions. During storage every cell looses the same amount of charge to processes summarized in . This contribution is independent of the SoC and serves as a baseline for the relative capacity in fig. 3b (dotted line). In addition, , is lost to continued SEI formation. This contribution depends on the RTLM assumed and features a SoC dependence.
It is evident that SEI formation facilitated by solvent diffusion does not depend on the potential and cannot reproduce the experimental data. Both, electron conduction and electron tunneling lead to a potential dependence, but it does not agree with the experiment. These mechanisms fail to reproduce the pronounced change of the relative capacity at 60% SoC. Instead, they predict a high potential sensitivity at SoCs between 0 and 20%.
diffusion is the only LTGM that predicts capacity fade in excellent agreement with the experiment. This agreement is due to the exponential dependence of capacity fade on electrode potential, see eq. 6d. diffusion correctly describes the capacity fade increase between 10 and 30% SoC as well as the one between 50 and 70% SoC. Small deviations between this model and the experiment are only present at zero SoC and at high SoCs.
We attribute the deviation at zero SoC to the mismatch in electrode areas. Because the coated anode area is larger than the coated cathode area, an overhang area of the anode has no opposed cathode counterpart. The overhang anode acts as a lithium reservoir at small SoCs. We expect a capacity increase of 1% due to overhang anode at zero SoC as elaborated in the SI. Taking this into account results in a good agreement with the measured capacity at zero SoC. We attribute the high SoC mismatch to two effects. Because the overhang anode area accumulates lithium during battery storage at low anode potentials, cell capacity is reduced. Most importantly, high SoCs correspond to high cathode potentials which enable electrolyte oxidation reactions. These reactions increase the amount of cyclable lithium in the cell 25. Modeling these partially counteracting effects is beyond the scope of this work. Therefore, small deviations between our model and the experiment are to be expected at high SoCs.
Now, we evaluate if alternative parameter choices can improve the agreement between electron conduction / electron tunneling and the experiment shown in fig. 3b. The first option is to assign a potential dependence to one essential model parameter. For instance, the electron conductivity for electron conduction or the parameter for tunneling, see Li et al. 13. However, this seems highly speculative if no physical explanation is given. We choose another approach. Both mechanisms are highly sensitive to the SoC if the corresponding anode potential is close to , the onset potential of SEI formation. Therefore, it is possible to increase the sensitivity at 60% SoC by lowering . We explore this option in the SI, showing that, theoretically, both LTGMs are able to predict the pronounced relative capacity drop at 60%, see LABEL:A-fig:res2. However, in turn, they no longer predict a capacity drop at 30% SoC. Most importantly, the required values for are far below any value reported in literature 6, 26.
To conclude, we compare SEI growth based on four long-term growth mechanisms (LTGM) to an experimental study. Only diffusion results in a promising agreement with the experiment which makes it a very likely candidate for the LTGM. Solvent diffusion does not reproduce a SoC dependence and is very unlikely to be the LTGM. Both, electron conduction and electron tunneling predict a SoC dependence but it does not agree with the experiment for any reasonable choice of parameters.
Computational Methods We now derive a simplified capacity fade model which applies to neutral diffusing towards the SEI/electrolyte interface. Li-ions take up an electron at the electrode and release it at the SEI/electrolyte interface for electrolyte reduction. The following derivation applies to alternative carries of negative charge as well. The full model used to create the data in fig. 3b is presented in the SI. We assume that the SEI is a homogeneous film that spans from (electrode/SEI interface) to (SEI/electrolyte interface). SEI thickness is directly related to via
| (1) |
where is the mean partial molar volume of the SEI and is the mean stoichiometric coefficient of in the SEI formation reaction. is the SEI thickness at the start of the experiment and is the surface area of the negative electrode.
The diffusion flux in the SEI is given by Fick’s law (in units of A/m2),
| (2) |
The approximation in the second line is possible because SEI is homogeneous and reactions take place at the SEI/electrolyte interface only. This is also true if the SEI has nano-sized pores, as we have shown in previous works 16, 17. Note that we do not specify the diffusion pathway. Interstitials could diffuse through the bulk SEI, pass through a selected SEI compound, or move along nano-sized SEI pores. The flux directly induces capacity fade, i.e., . Together with eq. 1 and Identifying the Mechanism of Continued Growth of the Solid-Electrolyte Interphase, this yields a differential equation for
| (3) |
where is the capacity corresponding to .
Next, we determine the concentration at and . At the electrode/SEI interface, interstitials are injected into the SEI. We assume that injection is a fast process and that graphite is in thermodynamic equilibrium with the SEI across the interface
| (4) |
is the maximal interstitial concentration. is constant and can be determined with DFT methods. This has been done by Shi et al. 22 for a Li2CO3 host lattice. The electrochemical potential of Li in the electrode is equal to .27, 28 Thus, we can express the interstitial concentration at the interface as
| (5) |
where is the interstitial concentration at V. is a model parameter and absorbs all constant contributions in Identifying the Mechanism of Continued Growth of the Solid-Electrolyte Interphase. At the SEI/electrolyte interface lithium interstitials do not accumulate. Instead, they are consumed by the fast SEI formation reaction, i.e., . This is the assumption of transport limited growth.
Equation 3 can be solved analytically in the simplified case of constant electrode potential. We illustrate the accuracy of this assumption in fig. 2. Note that we solve our full model numerically without it. Similar equations are derived for electron conduction and solvent diffusion in LABEL:A-eq:dq and LABEL:A-eq:flux of the SI. The corresponding solutions in the order solvent diffusion, tunneling, conduction, and diffusion are
| (6a) | ||||
| (6b) | ||||
| (6c) | ||||
| (6d) | ||||
Here, equals and is determined by the initial SEI thickness through the requirement . Equation 6b is the electron tunneling model derived by Li et al., see eq. 30 in ref. 13. We list the model parameters in LABEL:A-tbl:param in the SI29, 30, 31, 32.
We want to highlight another way in which electron tunneling differs from the other LTGMs. It is the only mechanism for which time dependence and SoC dependence cannot be separated. This means that cannot be written in the form , see eq. 6. Therefore, for electron tunneling, the qualitative shape of the predicted RC in fig. 3b depends on the time it is evaluated at. This behavior is not observed in the experiment 1.
We thank Peter Keil for providing us with details and data of his experiments. This work is supported by the German Federal Ministry of Education and Research (BMBF) in the project Li-EcoSafe (03X4636A).
References
- Keil et al. 2016 Keil, P.; Schuster, S. F.; Wilhelm, J.; Travi, J.; Hauser, A.; Karl, R. C.; Jossen, A. Journal of The Electrochemical Society 2016, 163, A1872–A1880
- Keil and Jossen 2017 Keil, P.; Jossen, A. Journal of The Electrochemical Society 2017, 164, 6066–6074
- Peled 1979 Peled, E. Journal of The Electrochemical Society 1979, 126, 2047–2051
- Verma et al. 2010 Verma, P.; Maire, P.; Novák, P. Electrochimica Acta 2010, 55, 6332–6341
- Kang et al. 2008 Kang, S. H.; Abraham, D. P.; Xiao, a.; Lucht, B. L. Journal of Power Sources 2008, 175, 526–532
- Xiao et al. 2009 Xiao, A.; Yang, L.; Lucht, B. L.; Kang, S.-H.; Abraham, D. P. Journal of The Electrochemical Society 2009, 156, A318
- Nie et al. 2013 Nie, M.; Chalasani, D.; Abraham, D. P.; Chen, Y.; Bose, A.; Lucht, B. L. Journal of Physical Chemistry C 2013, 117, 1257–1267
- Nie et al. 2013 Nie, M.; Abraham, D. P.; Chen, Y.; Bose, A.; Lucht, B. L. The Journal of Physical Chemistry C 2013, 117, 13403–13412
- Bedrov et al. 2017 Bedrov, D.; Borodin, O.; Hooper, J. B. The Journal of Physical Chemistry C 2017, 121, 16098–16109
- Ploehn et al. 2004 Ploehn, H. J.; Ramadass, P.; White, R. E. Journal of The Electrochemical Society 2004, 151, A456
- Pinson and Bazant 2012 Pinson, M. B.; Bazant, M. Z. Journal of the Electrochemical Society 2012, 160, A243–A250
- Tang et al. 2012 Tang, M.; Lu, S.; Newman, J. Journal of The Electrochemical Society 2012, 159, A1775–A1785
- Li et al. 2015 Li, D.; Danilov, D.; Zhang, Z.; Chen, H.; Yang, Y.; Notten, P. H. L. Journal of the Electrochemical Society 2015, 162, A858–A869
- Broussely et al. 2001 Broussely, M.; Herreyre, S.; Biensan, P.; Kasztejna, P.; Nechev, K.; Staniewicz, R. J. Journal of Power Sources 2001, 97-98, 13–21
- Christensen and Newman 2004 Christensen, J.; Newman, J. Journal of The Electrochemical Society 2004, 151, A1977
- Single et al. 2016 Single, F.; Horstmann, B.; Latz, A. Phys. Chem. Chem. Phys. 2016, 18, 17810–17814
- Single et al. 2017 Single, F.; Horstmann, B.; Latz, A. Journal of The Electrochemical Society 2017, 164, E3132–E3145
- Röder et al. 2017 Röder, F.; Braatz, R. D.; Krewer, U. Journal of The Electrochemical Society 2017, 164, E3335–E3344
- Colclasure et al. 2011 Colclasure, A. M.; Smith, K. A.; Kee, R. J. Electrochimica Acta 2011, 58, 33–43
- Röder et al. 2016 Röder, F.; Braatz, R.; Krewer, U. Computer Aided Chemical Engineering 2016, 38, 157
- Hao et al. 2017 Hao, F.; Liu, Z.; Balbuena, P. B.; Mukherjee, P. P. The Journal of Physical Chemistry C 2017, 121, 26233–26240
- Shi et al. 2012 Shi, S.; Lu, P.; Liu, Z.; Qi, Y.; Hector, L. G.; Li, H.; Harris, S. J. Journal of the American Chemical Society 2012, 134, 15476–15487
- Smith et al. 2011 Smith, a. J.; Burns, J. C.; Zhao, X.; Xiong, D.; Dahn, J. R. Journal of The Electrochemical Society 2011, 158, S23
- Steinhauer et al. 2017 Steinhauer, M.; Stich, M.; Kurniawan, M.; Seidlhofer, B.-K.; Trapp, M.; Bund, A.; Wagner, N.; Friedrich, K. A. ACS Applied Materials & Interfaces 2017, 9, 35794–35801
- Deshpande et al. 2015 Deshpande, R. D.; Ridgway, P.; Fu, Y.; Zhang, W.; Cai, J.; Battaglia, V. Journal of The Electrochemical Society 2015, 162, A330–A338
- Borodin et al. 2015 Borodin, O.; Olguin, M.; Spear, C. E.; Leiter, K. W.; Knap, J. Nanotechnology 2015, 26, 354003
- Latz and Zausch 2011 Latz, A.; Zausch, J. Journal of Power Sources 2011, 196, 3296–3302
- Latz and Zausch 2013 Latz, A.; Zausch, J. Electrochimica Acta 2013, 110, 358–362
- Borodin et al. 2006 Borodin, O.; Smith, G. D.; Fan, P. The Journal of Physical Chemistry B 2006, 110, 22773–22779
- Zhuang et al. 2005 Zhuang, G. V.; Xu, K.; Yang, H.; Jow, T. R.; Ross, P. N. The Journal of Physical Chemistry B 2005, 109, 17567–17573
- Edström et al. 2006 Edström, K.; Herstedt, M.; Abraham, D. P. Journal of Power Sources 2006, 153, 380–384
- Kulova et al. 2006 Kulova, T.; Skundin, A.; Nizhnikovskii, E.; Fesenko, A. Russian Journal of Electrochemistry 2006, 42, 259–262