ATL-PHYS-PROC-2018-
Top-quark pair production in association with a or boson with the ATLAS experiment
Sebastian Heer111Supported by European Research Council grant ERC-CoG-617185., on behalf of the ATLAS Collaboration11footnotetext: Copyright 2018 CERN for the benefit of the ATLAS Collaboration. CC-BY-4.0 license.
Physikalisches Institut
Universität Bonn, 53115 Bonn, Germany
The cross section of the and processes are measured in a simultaneous fit using 36.1 of proton-proton collisions at a centre of mass energy of recorded by the ATLAS detector at the LHC. The result is found to be and and compatible with the Standard Model.
PRESENTED AT
International Workshop on Top Quark Physics
Bad Neuenahr, Germany, September 16–21, 2018
1 Introduction
The and processes provide direct access to the weak couplings of the top quark. In addition, the two processes are often found to be a relevant background in searches involving final states with multiple leptons and -quarks. Measurements of and can be used to set constraints on the weak couplings of the quarks, as well as impose limits on possible beyond the Standard Model (BSM) effects. Previous measurements by the ATLAS and CMS experiments [1, 2] indicate agreement with the Standard Model [3, 4].
The dataset of 36.1 of proton-proton collisions at a centre of mass energy of , collected in 2015 and 2016 by the ATLAS detector is analysed. Final states with two, three or four isolated prompt leptons are considered in the analysis. More details about the analysis can be found in Reference [5].
2 Analysis Overview
Separate analysis channels are defined to target the and processes. Each channel is divided into multiple regions in order to enhance the sensitivity to the signal. Table 1 lists the analysis channels and the targeted decay modes of the and processes.
| Process | decay | Boson decay | Channel |
| 2 SS | |||
| Trilepton | |||
| OS | |||
| Trilepton | |||
| Tetralepton |
The 2-OS channel targets the process and is affected by large backgrounds from +jets or production. In order to separate the signal from background in the most efficient way, Boosted Decision Trees (BDTs) are used. Three BDTs are constructed and trained in regions requiring at least 5 jets. The number of input variables varies between 14 and 17. The most important input variables are found to be the pseudorapidity of the dilepton system and the transverse momenta of all jets divided by the sum of their energies. Each signal region is divided into 19 equal sized bins of the BDT discriminator. The normalization factors of the +jets background with one or two heavy flavour jets, labeled as Z+1HF and Z+2HF, are determined in the fit to data.
The 2-SS channel targets the process and uses a total of 12 signal and control regions, classified by information about the lepton flavour, total charge and -jet multiplicity. The dominant background arises from fake leptons, which are estimated by the matrix method [6] and charge-flip leptons. The control regions are used in a fit to measure fake and real lepton efficiencies, as well as in the final fit to determine the signal cross sections, anticorrelating the fake lepton background with the signal process.
The regions in the 3 channel are divided into two groups, depending on whether a pair of OSSF leptons whose invariant mass is within of the boson mass is present. The signal regions are further categorized based on jet and -jet multiplicities. Four signal regions for each signal process are defined. The dominant backgrounds for the regions targeting arise from diboson production and the production of single top quarks in association with a boson. A control region is used to determine the normalization of the background in the fit to data. The dominant background for the regions targeting arises from fake leptons, which is estimated by the matrix method.
The 4 channel targets the process and uses four signal regions depending on the -jet multiplicity and the flavour of the leptons from the system. In addition, a control region is used to determine the normalization of the background in the fit to data. The dominant backgrounds arise from the diboson production, the production of a single top quark in association with a and a boson, as well as fake leptons. The fake lepton background is estimated from simulation, applying scale factors obtained from a fit in control regions enriched by fake leptons.
3 Results
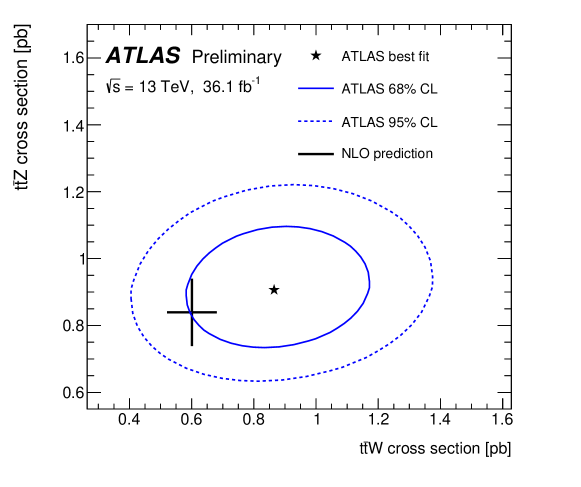
The and cross sections are simultaneously extracted using a binned maximum-likelihood fit to the numbers of events in the dilepton, trilepton and tetralepton signal and control regions. In total, the fit includes 11 signal plus 2 control regions from the , and 16 signal plus 12 control regions from the analysis. In all regions, good agreement between observed values and the expectation is observed. The normalization corrections for the and backgrounds with respect to the predictions are obtained from the fit and found to be compatible with unity: for the background and for the background. The normalizations of the +1HF and +2HF backgrounds are mainly constrained in the low BDT output bins of the opposite-sign dilepton channel signal regions, where the signal contamination is low. Their values are found to be and , respectively. The measured values of the cross sections from the combined fit are and , assuming the SM value for the other cross section, respectively. Figure 1 shows a comparison of the fit results with theoretical expectations, pb and pb [7], demonstrating good agreement between the measured and predicted cross sections. For the process, both the observed and the expected significances are found to be much larger than 5 standard deviations. For the process, an excess of events over the expected Standard Model background-only hypothesis is found with an observed (expected) significance of () standard deviations. Table 2 shows the uncertainties in the measured and cross sections, grouped in categories, along with the total uncertainties. For both processes, the precision of the measurement is affected by statistical and systematic uncertainties in similar proportions. For the determination, the dominant systematic uncertainty sources are the modelling of the backgrounds and of the signal. For the determination, the dominant systematic uncertainty sources are the modelling of the signal and the limited amount of data available in the control regions and simulated samples.
| Uncertainty | ||
| Luminosity | 2.9 | 4.5 |
| Simulated sample statistics | 2.0 | 5.3 |
| Data-driven background statistics | 2.5 | 6.3 |
| JES/JER | 1.9 | 4.1 |
| Flavor tagging | 4.2 | 3.7 |
| Other object-related | 3.7 | 2.5 |
| Data-driven background normalization | 3.2 | 3.9 |
| Modeling of backgrounds from simulation | 5.3 | 2.6 |
| Background cross sections | 2.3 | 4.9 |
| Fake leptons and charge misID | 1.8 | 5.7 |
| modelling | 4.9 | 0.7 |
| modelling | 0.3 | 8.5 |
| Total systematic | 10 | 16 |
| Statistical | 8.4 | 15 |
| Total | 13 | 22 |
ACKNOWLEDGEMENTS
The work of the author is currently funded by the European Research Council under the European Union’s Seventh Framework Programme ERC Grant Agreement n. 617185.
References
- [1] ATLAS Collaboration, JINST 3 (2008) S08003.
- [2] CMS Collaboration, JINST 3 (2008) S08004.
- [3] ATLAS Collaboration, Eur. Phys. J. C 77 (2017), 40, arXiv:1609.01599 [hep-ex].
- [4] CMS Collaboration, JHEP 08 (2018) 011, arXiv:1711.02547 [hep-ex].
-
[5]
ATLAS Collaboration, ATLAS-CONF-2018-047,
http://cds.cern.ch/record/2639674. -
[6]
ATLAS Collaboration,
Eur. Phys. J. C 71 (2011) 1577,
arXiv:1012.1792 [hep-ex]. - [7] J. Alwall et al., JHEP 07 (2014) 079, arXiv:1405.0301 [hep-ex].