Vela as the Source of Galactic Cosmic Rays above 100 TeV
Abstract
We model the contribution of the nearest young supernova remannt Vela to the local cosmic ray flux taking into account both the influence of the Local Superbubble and the effect of anisotropic diffusion. The dominant contribution of this source in the energy region around the cosmic ray knee can naturally explain the observed fluxes of individual groups of nuclei and their total flux. Adding the CR flux from a 2–3 Myr old local CR source suggested earlier, the CR spectra in the whole energy range between 200 GeV and the transition to extragalactic CRs are described well by the combined fluxes from these two local Galactic sources.
1 Introduction
The measured energy spectrum of cosmic rays (CRs) extends smoothly over more than 11 decades as a nearly featureless power law, . One of its most prominent features is the knee, a break in the all-particle energy spectrum at the energy PeV, which was discovered by Kulikov and Khristiansen in the data of the MSU experiment already in 1958 [1]. The second knee corresponds to a change in the spectral slope of the all-particle energy spectrum at eV where the slope hardens by . There is a general consensus that the knee in the total CR spectrum at PeV coincides with a suppression of the primary proton and/or helium flux, and that the composition becomes increasingly heavier in the energy range between the knee and eV [2, 3, 4, 5].
Explanations for the origin of the knee fall in two main categories, connecting it either with a change in the propagation or the injection of CRs. In the first case, the knee energy may either corresponds to the rigidity at which the CR Larmor radius is of the order of the coherence length of the turbulent magnetic field in the Galactic disk [6, 7]. Alternatively, the knee corresponds to a transition between the dominance of pitch angle scattering to Hall diffusion or drift along the regular field [8, 9, 10]. In both cases, the energy dependence of the confinement time changes which in turn induces a steepening of the CR spectrum [11, 8, 9, 10, 6, 7]. In the second class of models, the knee is connected to properties in the injection spectrum of the Galactic CR sources. For instance, the knee might correspond to the maximal rigidity to which CRs can be accelerated by the population of Galactic CR sources dominating the CR flux below PeV [12, 13, 14]. Alternatively, the knee may be caused by a break in the source CR energy spectrum at this rigidity [15, 16]. A variant of this model is the suggestion that the spectrum below the knee is dominated by a single, nearby source and that the knee correspond to the maximal energy of this specific source [17, 18]. All these models lead to a sequence of knees at , a behaviour first suggested by Peters [19].
In the isotropic diffusion approximation one defines a scalar diffusion coefficient which depends on energy as . Measurements of the Boron and Carbon fluxes especially by the AMS-02 experiment are consistent with Kolmogorov turbulence, i.e. , at rigidities above GV [20]. The normalisation is only weakly constrained using measurements of stable nuclei, but can be restricted considering the ratio of radioactive isotopes as, e.g., 10Be/9Be: Fitting successfully these ratios requires values of the normalisation constant in the range cm2/s at GeV [21, 22, 23]. For typical magnetic field strengths of order G and maximal length scales of fluctuations in the turbulent field of order 10 pc, numerically calculated diffusion coefficients are two orders of magnitude below this value for . Since scales for Kolmogorov turbulence as , the magnetic field strengths would have to be scaled down by a factor to obtain agreement between the two approaches. This discrepancy can be resolved, if the diffusion is sufficiently anisotropic and the magnetic field contains a non-zero component perpendicular to the Galactic disk [24]. As a result, the number of sources contributing to the locally observed flux is reduced by two orders of magnitude. Thus only few sources contribute to the local CR flux at energies above 200 GeV.
In the energy range between 200 GeV and 100 TeV a 2–3 Myr old local supernova (SN) can dominate the local CR flux, as shown in Refs. [25, 26, 27]. A local SN event of the same age was deduced from 60Fe found in sediments in the ocean crust of the Earth [28, 29, 30] and on the Moon [31]. Such a local SN is able to to resolve the anomalies which were found recently by CR experiments. This includes the energy dependence of the proton to helium ratio, the breaks in the energy spectrum of primary nuclei at the rigidity 200 GV, the positron excess, and the ratio of positron to antiproton fluxes, see Refs. [25, 26, 27] for details.
The phase of the CR dipole amplitude is constant between TeV and 100 PeV, except for abrupt flip by at TeV. Similarly, the dipole amplitude is approximately constant above and below 200 TeV. This behaviour of the dipole anisotropy suggests that two CR sources located in the two opposite hemispheres relative to the local magnetic field line dominate the CR flux below and above this energy [32]. We suggest in this work that Vela, a 11 kyr old supernova remnant (SNR)at the distance 270 pc, is the source dominating the local CR flux above 200 TeV. We study the expected CR flux from Vela, which is connected with the Solar system by a magnetic field line in models of the global Galactic magnetic field as, e.g., the Jansson–Farrar model [33]. If this source would be indeed directly connected to the Solar system by a magnetic field line, its flux would however overshoot the locally measured one by 3 orders of magnitude in case of anisotropic diffusion. Such an excess is avoided, if one takes into account that the Earth is located inside the Local Superbubble. We use a simplified model for the structure of the magnetic field inside the Local Superbubble similar to the one of Refs. [34, 35], and follow individual CR trajectories solving the Lorentz equation. Despite of using a simplified model for the Local Superbubble we obtain a good description of the fluxes of individual groups of CR nuclei in the knee region and above. Adding additionally the CR flux from the 2–3 Myr old source, the CR spectra in the whole energy range between 200 GeV and the transition to extragalactic CRs are described well combining the fluxes from only these two local sources.
2 Theoretical framework
2.1 Local Bubble and the geometry of the local magnetic field
The Sun resides in a low-density region of the interstellar medium (ISM) called the Local Bubble (LB). The LB extends roughly 200 pc in the Galactic plane, and 600 pc perpendicular to it, with an inclination of about [36]. Observations and simulations [37, 38] show that the bubble walls are fragmented and twisted. Moreover, outflows away from the Galactic plane may open up the bubble [37]. In view of this complicated geometry, we idealise the LB in our numerical simulation as follows [35]: We assume for the magnetic field profile parallel to the Galactic plane a cylindrical symmetry, i.e. we imply that the changes as function of the Galactic height are small compared on the considered length scales. Then is only a function of . We use as a base radius of the bubble pc and set the wall thickness to pc. We assume inside the bubble and the wall a clockwise oriented magnetic field for and an anticlockwise one for . The strength of the regular magnetic field depends only on the radius and is set to inside the bubble, in the wall, and outside the bubble. The Sun is assumed to be at the centre of the LB, while Vela is situated at the distance 270 pc from the Sun at .
We interpolate the transition between different magnetic field regimes by logistic functions , with a transition width parameter pc. For the inside region , we set
| (2.1) |
For , the regular magnetic field is given by
| (2.2) | ||||
| (2.3) |
while for it is
| (2.4) | ||||
| (2.5) |
For the outside region , we set
| (2.6) |
and
| (2.7) | ||||
| (2.8) |
The turbulent magnetic field is taken to be randomly directed with a strength equal to . The field modes were distributed between AU and pc according to an isotropic Kolmogorov power spectrum. In the actual simulations, only field modes above pc were included.
2.2 Injection spectrum
We use as CR injection spectrum for Vela a broken power law in rigidity with an exponential cut off at the rigidity V,
| (2.9) |
The normalisation of the spectra for different groups of CR nuclei will be fixed such that the propagated fluxes at Earth agree with observations.
The injection spectrum steepens at PV by . Such a steepening is motivated e.g. by the analysis of Ref. [15]: Including strong field amplification as suggested by Bell and Lucek [39, 40] into a toy acceleration model, these authors found a break in the energy spectrum of accelerated protons, coinciding for typical values SNR parameters with the knee region. The strength of the steepening depends among others on the injection history, and in a typical test particle ansatz was found.
2.3 Calculation of the flux
In order to compute the flux, we injected protons per energy at the position of Vela and propagated them for 12.000 yr. We calculated the CR density in three regions of interest averaging the CR densities between 8 to 12 kyr: Around the source, on the bubble wall, and inside the bubble. The CR flux was then computed from the CR densities in the considered volumes. For energies below 100 TeV we deduced the flux from earlier times and higher energies using the scaling relation .
We defined the flux around the source considering the - plan centred on the source with a thickness of pc and pc, and pc form -50 pc to +50 pc on each side. For the flux inside the bubble wall, we considered a ring of 1 pc thickness at the shell, and computed the flux from pc to pc. Finally, we computed the flux at the position of the Earth from the CR density inside a cube of 100 pc side length centred at the Sun.
3 Cosmic ray flux from Vela
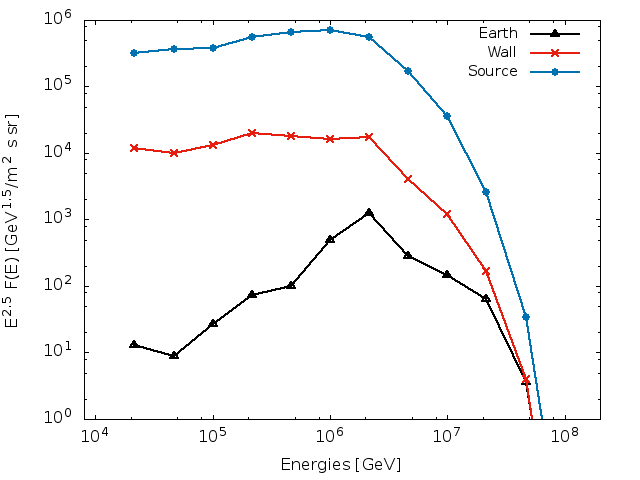
In Fig. 1, we show the normalised proton flux in the bubble wall, inside the bubble and around the source. We can see that for high energies ( eV) the bubble is transparent, since the Larmor radius ( pc) of such protons is large compared to the thickness of the bubble wall. For energies below 1 PeV, particles start to be trapped in the wall and the flux inside the bubble is increasingly suppressed.
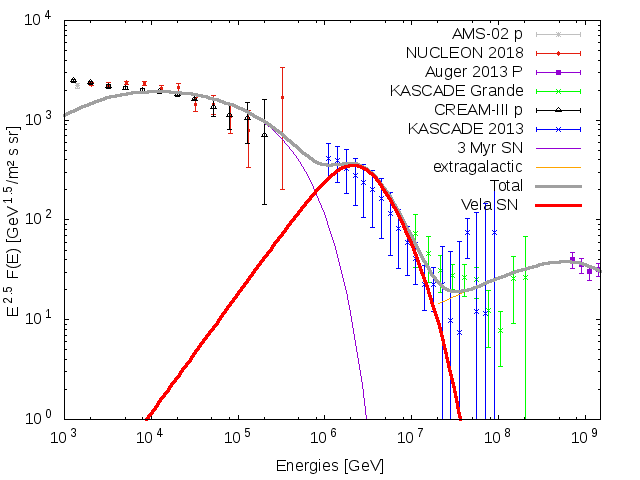
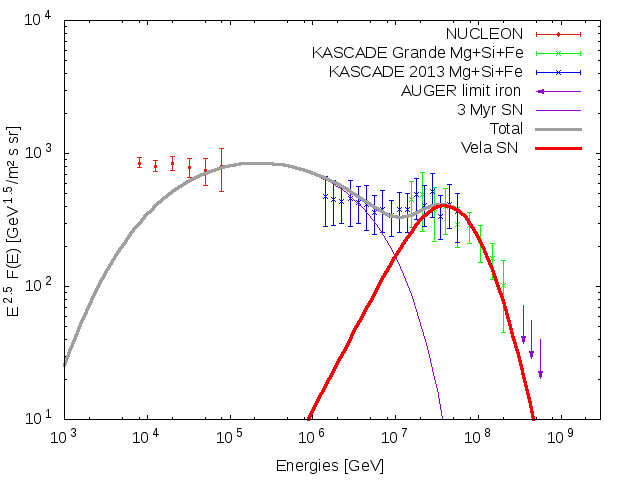
In Fig. 2(a), we show the proton flux received at Earth from Vela together with the proton flux from a 2–3 Myr old SN in the model of Refs. [25, 27]. The combined flux of these two sources covers the energy range from 200 GeV up to the extragalactic transition region, fitting well the experimental data. Additionally, we show the extragalactic proton flux which we obtained from a fit to the AUGER data as
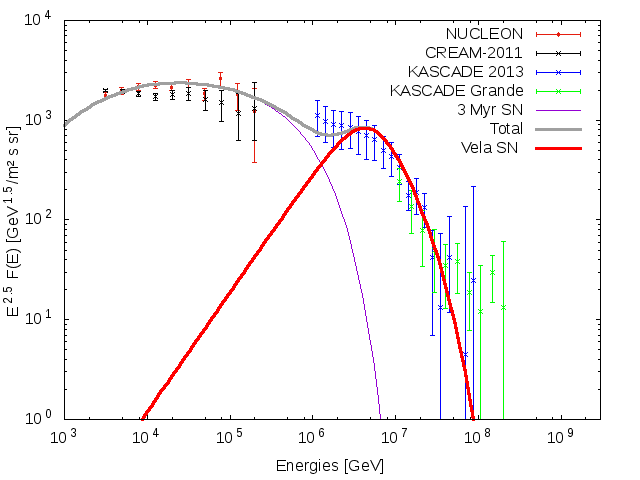
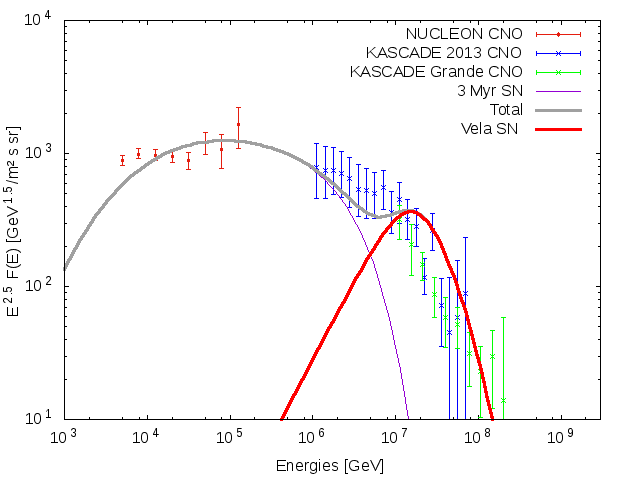
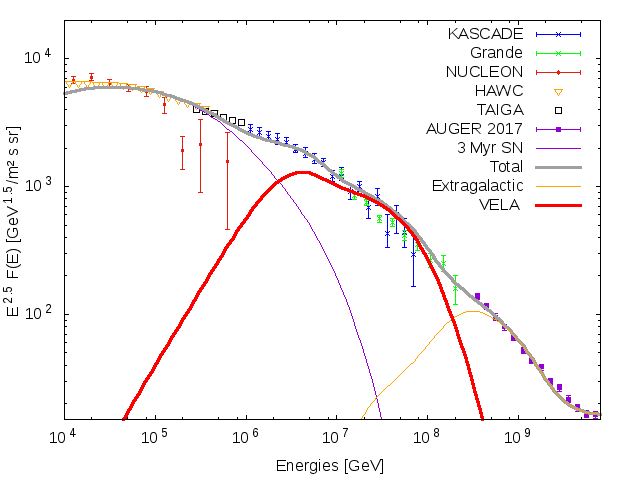
We also compute the flux for other nuclei: the flux of helium is shown in Fig. 2(b), of the CNO group in Fig. 3(a) and of the SiMgFe group in Fig. 3(b), respectively. From Fig. 4, we see that the all-particles flux fits well the experimental data up to eV. In the energy range above eV, the extragalactic contribution becomes important which we model following Ref. [44]. We also remark that the iron flux shown in Fig. 3(b) is consistent with the latest Anger composition data which limit the iron flux to of the all-particles flux [48].
We computed the total energy output of Vela from the normalisation of the simulated data to the experimental ones: The relative energy fraction in protons found is 0.3, the one of helium 0.5, of carbon 0.04 and of iron 0.04, respectively. For the other nuclei, we calculated the flux ratios of the different nuclei using data from the NUCLEON experiment, taking for each nuclei three points with same energy and with the smallest error-bars. Averaging then the ratios, we obtain , , , , and . We obtain then as total energy output in CRs erg. The total kinetic energy of the Vela supernova calculated in Ref. [49] is erg. We note also that the CR acceleration efficiency of Vela should be high, as it is expected in the scenario of strong magnetic field amplification of Refs. [39, 40]. Since the dependence of on the exact numerical values of the parameters (like e.g. the width and the magnetic field strength of the bubble wall) in our model is rather large, we conclude that the two values are in good agreement.
4 Conclusions
In the standard diffusion picture it is assumed that Galactic CRs form a smooth, stationary “sea” around the Galactic disk. Evidence for this assumption comes from -ray observations, which indicate a rather small variation of the parent CR populations below GeV throughout the Galaxy outside of several kpc from the Galactic center [50]. Going to higher energies, CRs escape faster and thus the number of CR sources contributing to the local flux diminishes. In order to match the required diffusion coefficient with micro-gauss magnetic fields observed in the local Galaxy the CR propagation should be strongly anisotropic [24]. Then the number of CR sources decreases by a factor 100 relative to the case of isotropic diffusion. As a result, the CR flux should be dominated by few local CR sources except for the lowest energies.
In this work, we have examined the suggestion put forward in Refs. [17, 18] that the spectrum below the knee is dominated by CRs accelerated in the Vela SNR and that the knee corresponds to the maximal energy of this source. As an important improvement compared to these earlier studies, we have taken into account that the Sun is located inside the Local Superbubble and that CRs propagate anisotropically. Without the influence of the Local Superbubble, the CR flux from Vela at the position of the Sun would overshot the observed one by 3 order of magnitude, because the Sun and Vela are connected by field lines of the regular magnetic field. Using a CR injection spectrum with a break at PeV as motivated by studies of Ref. [15], we have obtained a good description of the flux of individual groups of CR nuclei both in the knee region and above. Adding additionally the CR flux from the 2–3 Myr old source suggested in Ref. [25, 26, 27], the CR spectra in the whole energy range between 200 GV and the transition to extragalactic CRs are described well combining the fluxes from only these two Galactic sources.
Finally, we stress that, while including the effect of the Local Superbubble is an important improvement, the uncertainties connected to the strength and shape of the magnetic field in the bubble are large. In a future study, we plan therefore to study in depth the dependence of the spectrum and amplitude of the CR flux from Vela received on Earth on the parameters and the geometry of the Local Superbubble. Another important question to be addressed is how strong the dipole anisotropy from Vela will be decreased, since the CR flux is effectively emitted not by a point source but the bubble wall. Last but not least, we note that the suggestion from Ref. [35] that the Galactic soft neutrino component [51] in the ICeCube data is produced by CRs interacting in the wall of a superbubble fits well in the scenario presented here.
Acknowledgments
MK would like to thank APC and Université Paris Diderot for hospitality and financial support.
References
- [1] G. V. Kulikov and G. B. Khristiansen, On the Size Spectrum of Extensive Air Showers, J. Exp. Theor. Phys. 35 (1958) 8.
- [2] EAS-TOP collaboration, M. Aglietta et al., The cosmic ray primary composition in the ’knee’ region through the EAS electromagnetic and muon measurements at EAS-TOP, Astropart. Phys. 21 (2004) 583.
- [3] KASCADE collaboration, T. Antoni et al., KASCADE measurements of energy spectra for elemental groups of cosmic rays: Results and open problems, Astropart. Phys. 24 (2005) 1 [astro-ph/0505413].
- [4] IceCube collaboration, R. Abbasi et al., Cosmic Ray Composition and Energy Spectrum from 1-30 PeV Using the 40-String Configuration of IceTop and IceCube, Astropart. Phys. 42 (2013) 15 [1207.3455].
- [5] W. D. Apel et al., KASCADE-Grande measurements of energy spectra for elemental groups of cosmic rays, Astropart. Phys. 47 (2013) 54 [1306.6283].
- [6] G. Giacinti, M. Kachelrieß and D. V. Semikoz, Explaining the Spectra of Cosmic Ray Groups above the Knee by Escape from the Galaxy, Phys. Rev. D90 (2014) 041302 [1403.3380].
- [7] G. Giacinti, M. Kachelrieß and D. V. Semikoz, Escape model for Galactic cosmic rays and an early extragalactic transition, Phys. Rev. D91 (2015) 083009 [1502.01608].
- [8] V. S. Ptuskin, S. I. Rogovaya, V. N. Zirakashvili, L. G. Chuvilgin, G. B. Khristiansen, E. G. Klepach et al., Diffusion and drift of very high energy cosmic rays in galactic magnetic fields, Astron. Astrophys. 268 (1993) 726.
- [9] J. Candia, E. Roulet and L. N. Epele, Turbulent diffusion and drift in galactic magnetic fields and the explanation of the knee in the cosmic ray spectrum, JHEP 12 (2002) 033 [astro-ph/0206336].
- [10] J. Candia, S. Mollerach and E. Roulet, Cosmic ray spectrum and anisotropies from the knee to the second knee, JCAP 0305 (2003) 003 [astro-ph/0302082].
- [11] S. I. Syrovatskii, Cosmic Rays of Ultra-High Energy, Comments on Astrophysics and Space Physics 3 (1971) 155.
- [12] T. Stanev, P. L. Biermann and T. K. Gaisser, Cosmic rays. 4. The Spectrum and chemical composition above GeV, Astron. Astrophys. 274 (1993) 902 [astro-ph/9303006].
- [13] K. Kobayakawa, Y. Sato and T. Samura, Acceleration of particles by oblique shocks and cosmic ray spectra around the knee region, Phys. Rev. D66 (2002) 083004 [astro-ph/0008209].
- [14] A. M. Hillas, Can diffusive shock acceleration in supernova remnants account for high-energy galactic cosmic rays?, J. Phys. G31 (2005) R95.
- [15] L. O. Drury, E. van der Swaluw and O. Carroll, Particle acceleration in supernova remnants, the Bell - Lucek hypothesis and the cosmic ray knee, Submitted to: Astron. Astrophys. (2003) [astro-ph/0309820].
- [16] M. Cardillo, E. Amato and P. Blasi, On the cosmic ray spectrum from type II Supernovae expanding in their red giant presupernova wind, Astropart. Phys. 69 (2015) 1 [1503.03001].
- [17] A. D. Erlykin and A. W. Wolfendale, A single source of cosmic rays in the range eV to eV, J. Phys. G23 (1997) 979.
- [18] A. D. Erlykin and A. W. Wolfendale, Models for the origin of the knee in the cosmic ray spectrum, Adv. Space Res. 27 (2001) 803 [astro-ph/0011057].
- [19] B. Peters, Primary Cosmic Radiation and Extensive Air Showers, Nuovo Cim. 22 (1961) 800.
- [20] AMS collaboration, M. Aguilar et al., Precision Measurement of the Boron to Carbon Flux Ratio in Cosmic Rays from 1.9 GV to 2.6 TV with the Alpha Magnetic Spectrometer on the International Space Station, Phys. Rev. Lett. 117 (2016) 231102.
- [21] V. S. Ptuskin and A. Soutoul, Decaying cosmic ray nuclei in the local interstellar medium, Astron. Astrophys. 337 (1998) 859.
- [22] C. Evoli, D. Gaggero, D. Grasso and L. Maccione, Cosmic-Ray Nuclei, Antiprotons and Gamma-rays in the Galaxy: a New Diffusion Model, JCAP 0810 (2008) 018 [0807.4730].
- [23] G. Jóhannesson et al., Bayesian analysis of cosmic-ray propagation: evidence against homogeneous diffusion, Astrophys. J. 824 (2016) 16 [1602.02243].
- [24] G. Giacinti, M. Kachelrieß and D. V. Semikoz, Reconciling cosmic ray diffusion with Galactic magnetic field models, JCAP 1807 (2018) 051 [1710.08205].
- [25] M. Kachelrieß, A. Neronov and D. V. Semikoz, Signatures of a two million year old supernova in the spectra of cosmic ray protons, antiprotons and positrons, Phys. Rev. Lett. 115 (2015) 181103 [1504.06472].
- [26] V. Savchenko, M. Kachelrieß and D. V. Semikoz, Imprint of a 2 Million Year Old Source on the Cosmic-Ray Anisotropy, Astrophys. J. Lett. 809 (2015) L23 [1505.02720].
- [27] M. Kachelrieß, A. Neronov and D. V. Semikoz, Cosmic ray signatures of a 2-3 Myr old local supernova, Phys. Rev. D97 (2018) 063011 [1710.02321].
- [28] K. Knie, G. Korschinek, T. Faestermann, C. Wallner, J. Scholten et al., Indication for Supernova Produced Fe-60 Activity on Earth, Phys.Rev.Lett. 83 (1999) 18.
- [29] C. Fitoussi et al., Search for supernova-produced Fe-60 in a marine sediment, Phys. Rev. Lett. 101 (2008) 121101 [0709.4197].
- [30] A. Wallner, J. Feige, N. Kinoshita, M. Paul, L. K. Fifield, R. Golser et al., Recent near-Earth supernovae probed by global deposition of interstellar radioactive 60Fe, Nature 532 (2016) 69.
- [31] L. Fimiani, D. L. Cook, T. Faestermann, J. M. Gómez-Guzmán, K. Hain, G. Herzog et al., Interstellar 60Fe on the Surface of the Moon, Phys. Rev. Lett. 116 (2016) 151104.
- [32] M. Kachelriess, Anisotropic diffusion and the cosmic ray anisotropy, 2018, 1811.02419.
- [33] R. Jansson and G. R. Farrar, The Galactic Magnetic Field, Astrophys.J. 761 (2012) L11 [1210.7820].
- [34] K. J. Andersen, Charged Particle Trajectories in the Local Superbubble, Master’s thesis, NTNU Trondheim, available at http://hdl.handle.net/11250/2456366, 2016.
- [35] K. J. Andersen, M. Kachelrieß and D. V. Semikoz, High-energy Neutrinos from Galactic Superbubbles, Astrophys. J. 861 (2018) L19 [1712.03153].
- [36] R. Lallement, B. Y. Welsh, J. L. Vergely, F. Crifo and D. Sfeir, 3D mapping of the dense interstellar gas around the Local Bubble, Astron. Astrophys. 411 (2003) 447.
- [37] D. Breitschwerdt and S. Komossa, Galactic fountains and galactic winds, Astrophys. Space Sci. 272 (2000) 3 [astro-ph/9908003].
- [38] M. M. Schulreich, D. Breitschwerdt, J. Feige and C. Dettbarn, Numerical studies on the link between radioisotopic signatures on Earth and the formation of the Local Bubble - I. 60Fe transport to the solar system by turbulent mixing of ejecta from nearby supernovae into a locally homogeneous interstellar medium, Astron. Astrophys. 604 (2017) A81 [1704.08221].
- [39] A. R. Bell and S. G. Lucek, Cosmic ray acceleration to very high energy through the non-linear amplification by cosmic rays of the seed magnetic field, Mon. Not. Roy. Astron. Soc. 321 (2001) 433.
- [40] A. R. Bell, Turbulent amplification of magnetic field and diffusive shock acceleration of cosmic rays, Mon. Not. Roy. Astron. Soc. 353 (2004) 550.
- [41] N. Gorbunov et al., Energy spectra of abundant cosmic-ray nuclei in the NUCLEON experiment, 1809.05333.
- [42] Y. S. Yoon et al., Cosmic-ray Proton and Helium Spectra from the First CREAM Flight, Astrophys. J. 728 (2011) 8 [1602.04710].
- [43] Pierre Auger collaboration, J. Bellido, Depth of maximum of air-shower profiles at the Pierre Auger Observatory: Measurements above eV and Composition Implications, PoS ICRC2017 (2018) 506.
- [44] M. Kachelrieß, O. Kalashev, S. Ostapchenko and D. V. Semikoz, Minimal model for extragalactic cosmic rays and neutrinos, Phys. Rev. D96 (2017) 083006 [1704.06893].
- [45] HAWC collaboration, R. Alfaro et al., All-particle cosmic ray energy spectrum measured by the HAWC experiment from 10 to 500 TeV, Phys. Rev. D96 (2017) 122001 [1710.00890].
- [46] S. F. Berezhnev et al., First results from the operation of the prototype Tunka-HiSCORE array, Bull. Russ. Acad. Sci. Phys. 79 (2015) 348.
- [47] Pierre Auger collaboration, F. Fenu, The cosmic ray energy spectrum measured using the Pierre Auger Observatory, .
- [48] Pierre Auger collaboration, M. Unger, Highlights from the Pierre Auger Observatory : Contributions to ICRC 2017, 1710.09478v1.
- [49] I. Sushch, B. Hnatyk and A. Neronov, Modeling of the Vela complex including the Vela supernova remnant, the binary system Velorum, and the Gum nebula, Astron. Astrophys. 525 (2011) A154 [1011.1177].
- [50] F. Aharonian, G. Peron, R. Yang, S. Casanova and R. Zanin, Probing the ”Sea” of Galactic Cosmic Rays with Fermi-LAT, 1811.12118.
- [51] A. Neronov, M. Kachelrieß and D. V. Semikoz, Multimessenger gamma-ray counterpart of the IceCube neutrino signal, Phys. Rev. D98 (2018) 023004 [1802.09983].