Evidence of absorption dominating over scattering in light attenuation by nanodiamonds
Abstract
We show an experimental evidence of the domination of absorption over scattering in absorbance spectra of detonation nanodiamonds. We perform the absorbance measurements on the UV-Vis spectrophotometer equipped with integrating sphere and compare them with conventional absorbance spectra. Additionally, we measure the scattering light intensity at the cuvette side wall (scattering at 90 degrees angle). The obtained experimental data were interpreted using the simulations of photon random walk in turbid media and Kubelka-Munk approach. The scattering cross sections and indicatrices were obtained by Mie theory.
We discover that despite being very close to power law (like Rayleigh scattering) the light extinction by the primary 4 nm diamond crystallites is due to absorption only and scattering can be neglected. That is the reason why previously absorption and scattering contributions were confused. The scattering is governed only by the agglomerates of 100 nm and larger in size remaining in the hydrosols and their fraction can be effectively controlled by centrifugation. Only Mie theory reproduces correctly the close to scattering by the agglomerates accounting for the weird interplay between their size, fractal dimension, and dielectric properties. Finally, using the obtained absorbance spectra we estimate the fraction of non diamond phase in nanodiamonds and their agglomerates.
I Introduction
Nanodiamonds are one of the most unique nanoparticles being currently investigated due to their exceptional mechanical, heatь and optical properties inherited from the bulk diamondHui et al. (2010); Ho (2010); Schrand et al. (2009); Mochalin et al. (2012); Arnault (2017). Nanodiamonds exhibit high thermal conductivity Kidalov et al. (2007) and mechanical strength, can contain bright, long-lived and controllable color centersBoudou et al. (2009); Chen et al. (2017); Stacey et al. (2012); Fujiwara et al. (2019); Tisler et al. (2009). Current and future applications of nanodiamonds include NV defects-based quantum computing Neumann et al. (2008); Robledo et al. (2011); Bernien et al. (2012), composite materials creation Behler et al. (2009); Maitra et al. (2009); Chen et al. (2018); Kidalov et al. (2007); Kurkin et al. (2016); Guillevic et al. (2019), sustainable energyTafti and Sadeghzadeh (2016); Hejazi and Mohandesi (2018), bioimagingFaklaris et al. (2009); Nunn et al. (2018), and drug deliveryZhu et al. (2017). Along with manufacturing, modifying, and investigating the high-pressure high-temperature Boudou et al. (2013); Stehlik et al. (2015); Nunn et al. (2018), bead millingBoudou et al. (2009), laser synthesis Baidakova et al. (2013), and even extraterrestrialShiryaev et al. (2011) nanodiamonds, among the most promising are the detonation nanodiamonds (DND)Mochalin et al. (2012); Shenderova and Vul’ (2014). Besides the powders, the most important form for DND and other nanodiamonds are the water suspensions (hydrosols), easy-to-handle and native for chemistry and biology. Despite the serious progress that was achieved in the nanodiamond size control and fractionationStehlik et al. (2015, 2016); Dideikin et al. (2017), the hydrosols contain both individual primary crystallites and their agglomerates. Moreover, individual DND particles tend to form chains in hydrosols Kuznetsov et al. (2018).
To better understand the size distribution, structure, and phase composition of nanodiamonds, the optical experiments including measuring Absorbance (Abs) spectra are widely used Tomita et al. (2002); Vul et al. (2011); Aleksenskii et al. (2012a); Usoltseva et al. (2018); Volkov et al. (2012); Klemeshev et al. (2016). One of the most conventional and widely applied methods of nanodiamond characterization is dynamic light scattering (DLS) Osawa (2007); Ōsawa (2008); Koniakhin et al. (2015); Aleksenskii et al. (2012b), which requires precise knowledge of the optical parameters of the materials. This makes the deeper understanding of nanodiamond hydrosols optical properties highly desired. The surface effects closely connected with optical absorption are important for the manifestation of NV defects and for the quenching of their luminescence Hauf et al. (2011); Ofori-Okai et al. (2012); Loretz et al. (2014).
Abs spectra (also referred as UV-vis spectra or Optical density spectra) of detonation nanodiamond hydrosols can be described as a superposition of light scattering and absorption Vul et al. (2011); Aleksenskii et al. (2012a). The peculiar shape of the optical density spectra is thought to be defined by the interplay between these two effects, with the domination of scattering. For calculating the scattering cross section, the Rayleigh and Mie theories are used. Calculating the absorption cross section requires a model where nanoparticle electric polarization contains the imaginary part. Usually, the nanoparticle core-shell models with the presence of diamond-like core and graphite-like phase on the surface Lucas et al. (1994); Tomita et al. (2002); Vul et al. (2011) are used, where the dielectric constant of graphite-like phase contains significant imaginary part giving the absorption. Numerical values of graphite-like dielectric constant are approximated with data for bulk graphiteDraine and Lee (1984). The calculations predict that the scattering dominates the absorption by a factor of 10 at shorter wavelengths (lower than 500 nm), whereas in red and near-IR regions the contribution of scattering and absorption becomes comparable Vul et al. (2011).
Another approach for the determination of nanodiamond optical properties is based on ab-initio calculation of the nanodiamond electronic structure and derivation of the corresponding light absorption Vantarakis et al. (2009). These calculations allow accounting for such effects as surface reconstruction, presence of amorphous phase and carbon atoms with intermediate between sp2 and sp3 hybridization.
Here, we present an experimental evidence that 4 nm nanodiamonds dominantly absorb light in all visible range, including near-UV and near-IR, which differs from the previous models suggesting that Abs spectra of DND hydrosols are mainly governed by the scattering. This picture generally remains valid even for agglomerates, where the absorption is determined to be comparable with the scattering. These results lead to a global change of the paradigm of the DND hydrosols Abs spectra interpretation.
The paper is organized as follows. In section II.1, we describe the preparation of the samples. The main quantity about which the present paper is composed is light intensity , scattered by nanodiamonds in the hydrosol and thus gone away from the cuvette. At a qualitative level, it is obvious that positively correlates with the scattering cross section of the nanoparticles in hydrosol and negatively correlates with the absorption cross section. can be addressed in three ways:
-
•
Calculated via the difference between the Abs spectra measured with integrating sphere (IS) and without it (section II.2).
-
•
Detected straightly as the light intensity scattered at 90 degree angle through the cuvette side wall (section II.3).
-
•
Via the numerical simulation of the photon random walks in the medium where scattering and absorption takes place (section III).
In section IV we describe the obtained experimental and theoretical results and in section V we discuss them and establish a relation between all three approaches mentioned above. We will show that from the experimental results one can quantitatively conclude on the absorption and scattering contributions. The comparison of the experimental data and results of the simulation provides the quantitative level of extracting contributions to DND absorbance from scattering and absorption.
II Experiment
II.1 Samples
Preparation and physical-chemical characterization of the samples is described in details in Ref. Dideikin et al. (2017). In brief, the preparation and purification protocol reads as follows. As an initial DND, the powder of an industrial DND was taken and an additional purification with the mixture of HF and HBr from inorganic impurities was done to obtain Z0 sample. DND Z0 powder was annealed in hydrogen at 600o C for 3 hours for producing DND Z+ sample. DND Z- was obtained after annealing Z0 powder in air at 450o C for 6 hours. Thus, three DND powders (Z0, Z+, and Z-) were obtained their names of the samples originate from the results of their Zeta-potential measurements Dideikin et al. (2017). The difference in deagglomeration procedure was a reason of a difference in surface chemistry of the samples. According to the reported in Ref. Dideikin et al. (2017) XPS, XAS and FTIR data, DND Z- and Z+ are both grafted with CH and -COOH/-C(O)O- groups, however in different relations. DND Z- surface contains mainly carboxyls and lactones Schmidlin et al. (2012), while Z+ is hydrogenated. This picture correlates with the values of Zeta-potential. The important feature of the studied samples Dideikin et al. (2017), as well as significant number of other nanodiamonds Stehlik et al. (2015); Yoshikawa et al. (1995); Mermoux et al. (2018), is presence of the non-diamond phase giving the strong Raman signal in the wide band around 1580 cm-1. The non-diamond carbon is typically ”black” and strongly absorbing, and as it will be seen later such absorption is an essential component of the nanodiamond optical properties.
The additional centrifugation-based fractionation for tuning the fraction of the agglomerates was performed as follows. All three powders were dispersed in demineralized (deionized) water by ultrasonic treatment. The initial concentration of nanodiamond in water was ca. 1 wt. %. After dispergation, the resulting hydrosols were centrifuged at 18000g for 40 minutes (Sigma 3-30KS centrifuge). In each capsule for centrifugation, a hydrosol has a volume of approx. 6 ml. Thus, primary 4 nm crystallites that did not settle during the centrifugation process and larger particles (agglomerates) were separated. The supernatants recovered after centrifugation are referred as DND Z01 (0.08 wt%), Z+1 (0.44 wt%) and Z-1 (0.35 wt%) hydrosols. The precipitates diluted with demineralized water and ultrasonically treated are DND Z02 (0.58% by weight), Z+2 (1.07% by weight) and Z-2 (1.28% by weight). Their concentrations (WT1) were measured by drying 10 g of each hydrosol, followed by measuring the mass of the sediment on an analytical scale SartoGosm CE-124C. Finally, the additional dilution of the hydrosols was done to achieve the abosrbance values of 0.3, most suitable for optical measurements due to lowering the effects of multiple scattering and reabsorption. The weight fractions after dilution are designated as WT2. The corresponding data is listed in Table 1. Size distributions were obtained using the Malvern ZetaSizer device.
| Sample | WT1, % | WT2, % | , cm-3 | , cm-3 | , cm-3 |
|---|---|---|---|---|---|
| Z+1 | 0.44 | 0.029 | |||
| Z+2 | 1.07 | 0.0048 | |||
| Z-1 | 0.35 | 0.023 | |||
| Z-2 | 1.28 | 0.0074 | |||
| Z01 | 0.08 | 0.019 | |||
| Z02 | 0.58 | 0.0059 |
II.2 Measurements of absorbance spectra without IS and with IS
The standard measurements of Abs spectra without IS were conducted with the single beam UV-Vis spectrophotometer Unico SQ2800. For measurements with IS, the double beam UV-Vis spectrophotometer Shimadzu-2450 was used (with ISR-3100 IS Attachment).
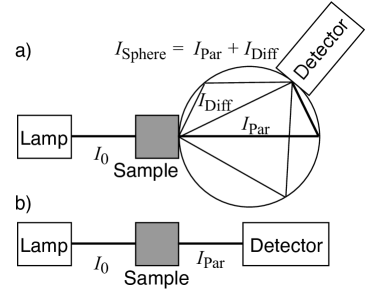
According to Fig. 1, one can write the following relations for light intensities and values of absorbance without and with sphere:
| (1) | |||
| (2) |
where and are the Abs spectra measured normally (without integrating sphere) and with the integrating sphere, respectively. is the intensity of the incident beam. is the residue of the incident parallel beam measured in normal experiments without integrating sphere and is the diffuse light fraction gone to the sphere through the front of the cuvette.
To compare the Abs measurements with the 90 angle scattering experiment described below, let us introduce the light scattering effectiveness as:
| (3) |
It is denoted with because it is defined similar to the transmission coefficient. So, has the meaning of a light fraction gone out of the cuvette apart the main optical axis and collected by IS. From Eqs. (1) and (2) one obtains as:
| (4) |
II.3 Scattering at 90 degree angle
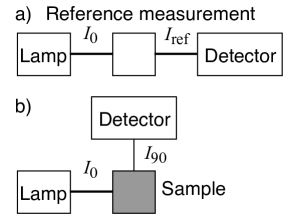
The Applied Photophysics Chirascan specrophotometer allows setting the photomultiplier tube detector at the angles of 0 and 90 degrees with respect to the incident light direction (see Fig. 2). At 0 degrees, the reference intensity was measured. Setting the detector at 90 degrees allowed measurements of the relative light intensity, scattered and gone out of the cuvette through its side wall. The experiment yields the 90 degree scattering in terms of effective transmission
| (5) |
Both and are generally proportional to the scattering in the hydrosol. The difference is in the scattering direction (scattering indicatrix should be taken into account) and in the detector solid angle. and can be plotted in the same figure for comparison.
III Theory and simulation
To deeper understand the roles of absorption and scattering and separate their contributions to the nanodiamond hydrosols Abs spectra at a qualitative level, a simulation of the photon random walk in the cuvette was performed. This simulation allows establishing the interconnection between the scattering and the absorption cross sections, the DND concentrations, the Abs spectra without and with the IS, and the intensity of scattering at 90 degrees.
III.1 Size distribution, dielectric permittivity, and fractal structure of nanodiamonds
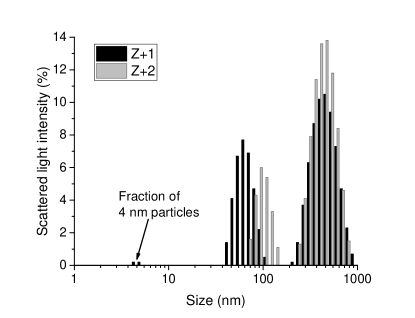
Here, we describe how the cross sections and the scattering indicatrices were obtained for the simulations. We have used the trimodal size distribution for nanoparticles in the hydrosol (three typical sizes of the diamond nanoparticles) lying in agreement with the results of DLS measurements (see Figs. 3 and S1).
First, the primary crystallites of the size nm with the particles per volume concentration exist in the hydrosol. Then, we consider the medium agglomerates of the size nm and concentration . The third type of nanoparticles is the large agglomerates of the size nm (concentration ). The adopted size of the primary nanodiamond crystallites nm is reported in numerous papers on the detonation nanodiamonds structural properties Osswald et al. (2009); Vul et al. (2006); Aleksenskii et al. (1997, 1999); Shenderova et al. (2011); Ozerin et al. (2008). The fraction of 4 nm nanodiamonds is hardly visible in the DLS data because the scattering cross section is proportional to the sixth power of nanoparticle size. Only centrifugation in very hard conditions can make the scattering from single diamond nanoparticles dominantKoniakhin et al. (2018a).
The dielectric permittivity of the primary crystallites was taken in the form
| (6) |
where nm was chosen for natural normalization and , and are the adjustment parameters (these values give the best fit of the experimental data). Their values were obtained preeminently by fitting the Abs spectra of Z+1 and other supernatants, see section V for more details. The first two terms of the equation above with sufficient accuracy fit the dielectric constant of the bulk diamond, given in Fig. 1 of Ref. Edwards and Ochoa (1981). The value of the diamond dielectric constant is also given in Ref. Bhagavantam and RAO (1948). The third term gives the imaginary part that is essential for absorption. Due to the fact that we interpret the experimental data in the range between 250 nm and 650 nm, Eq. (6) should be considered as a local approximation and thus Kramers-Kronig relation Landau et al. (2013) is not applicable to it.
The dielectric permittivity of the agglomerates does not match with one of the primary crystallites because they have a sparse fractal-like structure and contain the extensive voids filled with the medium (water). We have used the following mixing rule for calculating the agglomerate dielectric function:
| (7) |
where is the filling factor, is the dielectric constant of water, and
| (8) |
where and . The detailed analysis of calculating dielectric functions of mixtures is given in Refs. Reynolds and Hough (1957); Karkkainen et al. (2000).
The filling factor can be obtained on the basis of the agglomerate size and the size of a primary crystallite via the formulaSorensen (2001):
| (9) |
where is the fractal dimension of agglomerates. The used fractal dimension coincides with the neutron scattering data on the spatial structure of the DND agglomerates listed in Table 1. in Ref. Tomchuk et al. (2014). was an adjustment parameter. See also Ref. Baidakova et al. (1999) for the data on DND fractal structure. While these studies give the fractal dimension only for the agglomerates of the size of approximately 100 nm, the self similarity allows us to extend these values to the large agglomerates of the employed trimodal model.
The difference in the imaginary part of the dielectric permittivity for the primary crystallites and agglomerates should not be surprising. As discussed below, the absorption (defined by the imaginary part of ) in the primary particles and in the agglomerates can take place in the carbon phases of various nature. Moreover, Refs. Draine and Lee (1984); Gioti and Logothetidis (2003); Vantarakis et al. (2009); Edwards and Ochoa (1981) show that the dielectric properties of various carbon allotrope forms differ dramatically and thus some arbitrariness in the choice of is allowed.
The total diamond mass fraction in the hydrosol (WT2 column of Table 1) writes as
| (10) |
III.2 Theory of light extinction in nanodiamond hydrosols
The Mie theory Mie (1908); Hulst and van de Hulst (1957); Bohren and Huffman (1983) was used to obtain the absorption and scattering cross sections. The calculations performed in the Wolfram Mathematica package Mathematica (2009) code exaclty reproduce the results of the Matzler Matlab code Mätzler (2002).
The absorption and scattering cross sections of the primary crystallites are and , respectively. The input parameters for the Mie theory were the size , nanoparticle dielectric permittivity , medium dielectric permittivity and wavelength . For the medium agglomerates, the input parameters for the Mie theory were the size nm, dielectric permittivity , mean dielectric permittivity , and the wavelength . The yield is the absorption and scattering cross sections and , respectively. For the large agglomerates, the input parameters were nm, , and , and the yield was and . The Mie theory also gives the scattering indicatrix used in the next section. The example of such indicatrices is plotted in Fig. S2.
The attenuation coefficient in the hydrosol due to the scattering can be written as
| (11) |
and the attenuation coefficient due to absorption can be written as
| (12) |
Finally, the conventional absorbance (or total extinction) of the hydrosol can be written using the attenuation coefficients given by Eqs. (11) and (12):
| (13) |
where is the optical path in the cuvette.
The described model provides the best balance between the amount of free parameter (which should be kept as low as possible) and the quality of the fit of the experimental data. Using 3 different sizes is a minimal model for the description of the optical properties of nanodiamonds. 4 nm primary crystallites are the basic nanodiamond ”bricks”. Agglomerates of the characteristic size 90 nm are important for relatively isotropic part of scattering, evident from the measurements. The presence of the nm agglomerates leads to the effect of forward scattering and thus they affect the measurements with the integrating sphere.
As an alternative to Eq. (7) for deriving the agglomerates dielectric permittivity, one can use the Maxwell-Garnet formula, one of the Hashin-Shtrikman bounds or Wiener bounds, see Ref.Karkkainen et al. (2000). However, it will not affect significantly the decomposition of total absorbance into absorption and scattering. The same is valid for varying the sizes , fractal dimension, and . The appropriate values of , , and can be found to reproduce Abs spectra, and .
III.3 Photon random walk simulation
It is impossible to interpret the spectra obtained with the IS using only Eqs. (11) and (12) or similar simple equations. To study the light propagation in the cuvette with the hydrosol which strongly scatters and absorbs light, more complicated approaches are required. First, the photon random walk simulations can be performed. The approach based on random walks simulation is also essential for theoretical interpretation of the experiments in terms of . Second, the theory of light propagation in turbid media can be used. Currently the family of such theories is known as Kubelka-Munk theory Kubelka and Munk (1931); Kubelka (1948, 1954). In the straightforward implementation such theory can describe the , but not and thus to interpret all experimental data, the photon random walk simulations are necessary.
Figures S3 and S4 present the geometry of simulations. During the simulation, the photon starts in the center of the left wall of the cuvette. The propagation direction is along the optical axis (normal to the left cuvette wall). With the probability , the photon is scattered by the medium agglomerates and changes its propagation direction according to the scattering indicatrix calculated with the Mie theory. The same is for large agglomerates (index 2). The indicatrices are given in the supplementary materials sup . Has the photon been scattered or not, it is moved by the small distance mm along its actual propagation direction. Also, at each step the photon can be absorbed with a probability . In this case the simulation stops and goes to the next photon. The total amount of photons simulated for each wavelength was . If the photon reaches the cuvette wall, the simulation stops and also goes to the next photon.
Some areas at the walls correspond to detectors. So at the side wall (parallel to the optical axis) there was a ”Chirascan detector” area of the size 0.64 cm. Taking an amount of photons fallen onto the ”Chirascan detector” areas , one can write , where was an adjustment parameter related with the actual solid angle of the detector.
The simulation allows obtaining as , where is amount of photons fallen at the right side (the side opposite to the entrance point). The conventional absorbance was obtained as , where is the amount of photons fallen onto a ”normal detector” area, opposite to the entrance point. The forward scattering efficiency is .
It is important to note that the Abs spectra can be either calculated analytically using Eq. (13) or obtained with photon random walk simulation. The results of analytical calculations and photon random walk simulations coincide with sufficient accuracy (see the supplementary sup , Fig S5). In Figs. 6, S6, and S9, we plot the Abs spectra using the random walk simulations.
III.4 Theory of light propagation in turbid media
Here we use the theory of light propagation in turbid media given by Ryde in Refs. Ryde (1931); Ryde and Cooper (1931). It was originally written for the single type of nanoparticles, and here we extended it to the case of trimodal particle size distribution. To keep the clarity, we keep the designations from Ref. Ryde (1931) and than express them via the ones used in this paper.
The light transmitted through the cuvette, including both the diffuse light fraction and the residue of the incident parallel beam writes as
| (14) |
where is the total attenuation coefficient and other designations are
| (15) |
| (16) |
| (17) |
In the equations above is the absorption coefficient of the medium: and is the concentration of the particles. The quantities and are the forward and backward scattering cross sections. Their definition assumes the collimated illumination of the nanoparticle and integrating the light scattered to the forward and backward semi-spheres, respectively. The quantities and are defined as follows. is the total quantity of light which is scattered to the backward semi-sphere when the particle is illuminated equally from all directions from the backward semi-sphere. is the total quantity of light which is scattered to the forward semi-sphere when the particle is illuminated equally from all directions from the backward semi-sphere. Here, , , , and were calculated based on the Monte Carlo integration of the scattering indicatrices obtained with the Mie theory. By the definition . In the Rayleigh limit (particle size is much smaller than the wavelength) the scattering intensity is symmetric with respect to the plane perpendicular to the incident beam and one writes . In the case of nanoparticles comparable by size with the wavelength (Mie limit), one has strong dominating of forward scattering .
As mentioned above, this approach can be naturally used for the hydrosol with several types of particles. So, for the designations used in our paper, to derive e.g. one should perform the following replacement in Eqs. (15), (16) and (17):
| (18) |
where and are the forward scattering cross sections for medium and large agglomerates, respectively. The same substitutions are to be done for , , and .
IV Results
IV.1 Experimental results
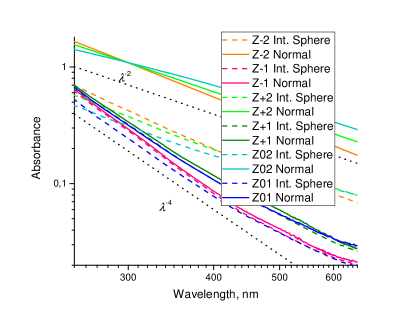
The results of the size measurements for supernatants and precipitates of all samples obtained with DLS are shown in Figs. 3 and Fig. S1 in the supplementary datasup . Fig. 4 shows the Abs spectra of all samples measured without and with IS. Fig. 5 shows the scattering efficiency in terms of obtained from the Abs spectra measurements using Eq. (4) and from the 90 degree scattering experiment on Chirascan.
One sees that for supernatant deagglomerated diamond types (DND Z+1, Z-1), the Abs spectra without and with IS nearly coincide. It means that the scattered light intensity is small and the main contribution arises from the absorption. On the contrary, for all precipitates (samples Z+2, Z-2, Z02) the difference with and without the sphere is significant. The difference is also tangible for the Z01 sample, because it lacks the deagglomeration procedure and intensively scattering agglomerates remain in the hydrosol. Thus, the centrifugation process leads to separation and manifestation (due to absorption) of fraction smaller than 100 nm.
The spectra of ans correlate with the Abs spectra without and with the sphere. Again, the scattering (both forward and at 90 degree angle ) from the supernatants (the samples with the index 1) is very low and the scattering from the precipitates (the samples with the index 2) is at least one order higher. Z01 exhibits an intermediate case.
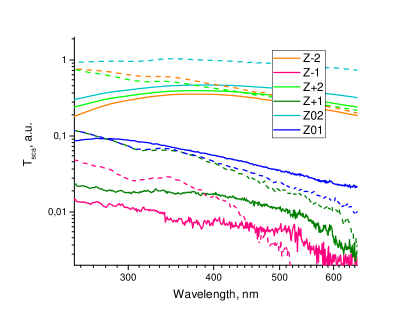
Above 600 nm, the signal (and especially scattering) from the supernatants becomes too weak and comparable with the device sensitivity for both used VU-vis spectrophotometers and Chirascan.
The described analysis of Abs spectra without and with IS and the scattering efficiency ( and ) provides the possibility to estimate the contributions of absorption and scattering to the light extinction in nanodiamond hydrosols only qualitatively. The same data accompanied with the theory and random walk simulations allow more precise quantitative approach for the separation of absorption and scattering contributions. Additional information can be obtained on the nanoparticle size, the agglomerates fraction, and the dielectric properties of primary crystallites and agglomerates.
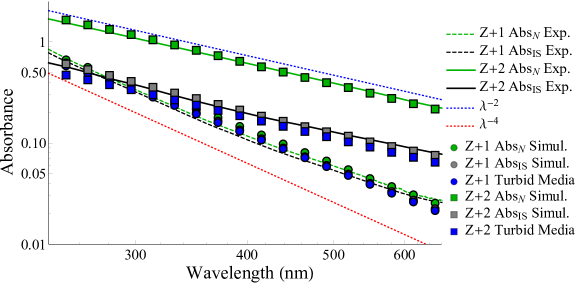
IV.2 Comparison of experimental data with the results of photon random walk simulation
Fig. 6 shows the and spectra of Z+1 and Z+2 samples, calculated on the basis of photon random walks simulations with the best set of adjustment parameters compared to experimental data (see Fig. S6 and S9 for Z- ans Z0 samples, respectively). The results obtained by the theory of light propagation in turbid media are also given. Fig. 7 shows the scattering efficiency in terms of and (see Fig. S7 and S10 for Z- ans Z0 samples, respectively). The parameters (fractal dimension), , , , and (constants in dielectric permittivity), as well as the sizes , , and were the same for all samples (DND Z+1, Z+2, Z-1, Z-2, Z01, and Z02). For each sample , , and were adjusted separately.
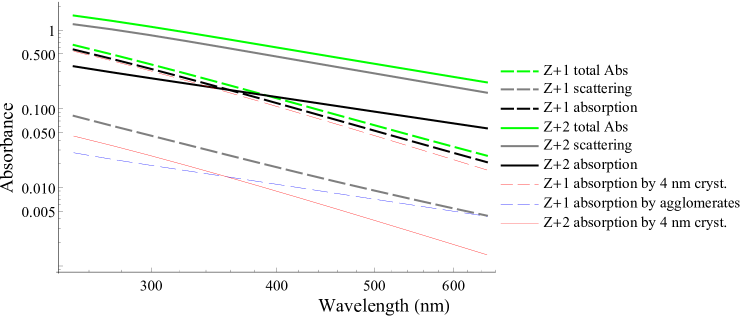
Fig. 8 is the main result of present paper. It shows the Abs spectra decomposition into scattering and absorption contributions. Namely, Fig. 8 shows the Abs spectra of absorption and scattering obtained using Eqs. (12) and (11), respectively for Z+1 and Z+2 samples. The concentrations were adjusted and the cross sections were obtained by the Mie approach as described below. The figures plotting the similar decomposition for Z- and Z0 samples are given in supplementary (Figs. S8 and S11, respectively).
V Discussion
V.1 Quantifying absorption and scattering contributions
One sees a good agreement between the predictions of the the photon random walk simulations, theory of light propagation in turbid media, and the experimental results. For the supernatant Z+1, the scattering is one order smaller than the absorption. The scattering in governed by the agglomerates remained in the hydrosol only. The absorption is predominantly due to primary crystallites (it is approximately 3 times higher than the absorption from the agglomerates). For the precipitate Z+2, the scattering dominates and it is several times larger than the absorption. The scattering is obviously governed by the agglomerates. The absorption is also due to agglomerates (typically it is 10 times higher than the absorption from the primary crystallites). Thus, the optical properties of precipitates are completely defined by the agglomerates.
Interestingly, the absorption in the Z+1 sample and other supernatants is accidentally closer by its slope to the Rayleigh scattering (giving the famous for the scattering cross section) than the true scattering in Z+2 sample and other precipitates in the Mie limit. That is the reason why previouslyVul et al. (2011); Aleksenskii et al. (2012a); Konyakhin et al. (2013) the nanodiamonds Abs spectra were treated as follows: first, was subtracted from the spectra as some presumable scattering background, then the remaining signal was attributed to the absorption on amorphous or sp2-like phase. From the present results, one sees that this algorithm is not correct for both precipitates and supernatants (and also for the suspension before centrifugation). Even for precipitates, the scattering contribution never overcomes 90%. PreviouslyVul et al. (2011), the agglomerates were considered as solid objects, whereas in the present approach we account for their fractal sparse structure. Nevertheless, the conclusion that the scattering in DND hydrosols is due to the agglomerates (and not due to 4 nm fraction) given in previous works Vul et al. (2011); Aleksenskii et al. (2012a); Konyakhin et al. (2013) stays intact. However, one sees that the scattering contribution to OD spectra is much smaller than thought previously.
A very similar picture takes place for the Z-1 and Z-2 samples. For Z01 sample (supernatant) the scattering is one order higher than for Z+1 and Z-1 samples (but it is still several times smaller than absorption). This picture agrees with the fact that Z0 diamond is an initial specie for Z+ and Z- preparation by means of annealing and chemical deagglomeration. According to Table 1, the Z01 sample contains larger fraction of agglomerates than Z+1 and Z-1. Z02 sample is a precipitate of non deagglomerated diamond and it should contain a lot of large agglomerates. Thus, the trimodal model with the fixed sizes, suitable for all other samples, works worse for the Z02 sample. One can conclude that centrifugation is indeed a very effective way to control the optical properties of nanodiamonds Koniakhin et al. (2018a); Trofimuk et al. (2018); Usoltseva et al. (2018).
From Fig. 6 one sees that the slopes of the scattering and the absorption for Z+2 sample are the same. It can be explained by the transition to the geometric optics limit caught by Mie theory. In this limit, both scattering and absorption cross sections do not depend on wavelength and they are proportional to the surface of the geometric shadow . Importantly, the light wavelength is effectively decreased by the high value of the water refraction index, which helps to approach the limit of geometric optics. For the higher values of agglomerate size and higher fractal dimension , one reaches completely the geometrical optics limit with no wavelength dependence in OD spectra (flat spectra), and an agreement of simulation and experiment can not be achieved.
From the results described above, one unambiguously concludes that the accounting for scattering in nanodiamond hydrosols absolutely requires the use of the Mie theory, because it is due to the agglomerates of the size of hundreds nanometers remaining in the solution. Due to the specific interplay between the wavelength, particle size, and dielectric properties of agglomerates (possessing the fractal structure with extensive voids), one observes the rather weird scattering slope indistinguishable from for Z+2 samples. For Z-2 and Z02 the slope is slightly different from , see Figs. S6 and S9. The Rayleigh approximation is clearly not enough for the description of such structures. For 4 nm fraction, the scattering is vanishing with respect to the absorption and can be neglected. This is one of the main outcomes of the present study. The fact that the absorption always dominates or at least gives a significant contribution (dozens of percents) to absorbance, allows measuring the nanodiamond weight concentration directly, as a quantity straightly proportional to the absorbance in UV-vis range (except in the case of large agglomerates presenting specifically in precipitates).
Due to the strong absorption as well as to multimodal and broadened size distribution, the studied hydrosols were a complicated case for investigation by the DLS technique, see e.g. Ref. Aleksenskii et al. (2012b). Nevertheless, the Abs spectra measurements ascertained the predictions of DLS. The given by DLS trimodal size distribution was indeed the minimal model to describe the Abs spectra of the studied hydrosols. The large agglomerates have the strongest forward scattering while the medium agglomerates (with the characteristic size of nm) have more isotropic scattering indicatrix. It means that the experimental data from the IS are mostly affected by larger agglomerates and for the 90 degree scattering measured at Chirascan device, the contribution of medium agglomerates is more important.
Additional information about absoprtion and scattering in DND hydrosols can be obtained e.g. using the angle resolved scattering. However, even the single wave length MADLS (multi-angle dynamic light scattering) devices are not so widespread as common DLS devices. The same picture is actual for such advanced methods as laser calorimetry, photoacoustic or photothermal spectroscopy. The very perspective will be the simultaneous usage of these methods and Abs measurements with integrating sphere to directly compare the main results. In present paper we make an effort to get as much as possible information related to the DND optical properties using the easily accessible and common equipment and thus we restrict ourselves to the usage of integrating sphere. The essential role in our approach is played by the consequential processing of the results using Mie theory followed by either photon random walks simulations or Kubelka-Munk theory. The employed 90 degree scattering configuration is not so common and it was used to supply the main conclusions coming from the analysis of the Abs spectra obtained with the integrating sphere. We show that the usage of the described above mixture of experimental and theoretical approaches is sufficient to fully solve the addressed problem, namely quantifying the scattering and absorption in nanodiamond hydrosols. Finally, photoacoustic method (see e.g. Fig. 2 from Ref. Usoltseva et al. (2018)) shows the close by magnitude contribution to Abs spectra from light absorption.
V.2 Structural properties of nanodiamonds and role of functional groups
In addition to justification the fact that the absorption is a dominant light extinction mechanism in the nanodiamond hydrosols, present results also allow some general conclusions about the structure and the dielectric properties of nanodimonds and their agglomerates. First, fitting the experimental data requires the assumption that the agglomerates are not solid and that they contain extensive voids. The fractal dimension 2.4 agrees both with recent SANS data Tomchuk et al. (2014) and with obtained experimental data.
It is known that absorption bands in the UV area in nanocarbon structures can arise from the presence of oxygen-containing moieties. For instance, absorption feature at 300 nm in graphene oxide is commonly attributed to n-* transitions in C=O bonds of carbonyl and caboxyl groups Kumar et al. (2014). However, comparison of the DND Z+ and DND Z- absorption spectra demonstrates that functionalization parameters do not affect the absorption in nanodiamonds. DND Z+ particles are covered mostly with carbohydrate (CH2, CH3) moities with little content of hydroxyls (-OH). On the other hand, DND Z- if predominantly fucntionalized by carboxyls (-COOH) and aldehydes (-COH). The detailed results on the surface chemistry of the studied samples can be found in the Ref.Dideikin et al. (2017). Despite such a strong difference in the functionalization parameters, DND Z+ and DND Z- exhibit almost equal absorbance spectra both as individual particles and as aggregates (see Fig. 4). Furthermore, the optical properties of all samples (Z+,Z-,Z0) can be theoretically reproduced on the basis of the same dielectric permittivity for primary particles P and agglomerates A. Based on these facts, one can formulate the hypothesis that absorption in detonation nanodiamonds is an intrinsic property of nanoparticle lattice (diamond core or reconstructed surface) and supervenient electronic structure.
The agreement between experiment and theory can be achieved only if the imaginary parts of the dielectric permittivities of the agglomerates and the primary crystallites do not coincide: and . This fact supports the hypothesis that the absorption takes place in the carbon phases of different nature in primary crystallites and in agglomerates. More specifically, Ref. Dideikin et al. (2017) shows that sp2 phase forms the linkages between primary DND crystallites in the agglomerates and the deagglomeration is due to removing these linkages. Thus, one can conclude that the sp2 phase can give a significant contribution to absorption in agglomerates. From the value of and the typical magnitude of the black carbon dielectric permittivity imaginary part (see Fig. 2 in Ref. Draine and Lee (1984)) one can estimate the fraction of the non-diamond phase in the agglomerates as .
For the primary crystallites, the absorption potentially could arise from the Urbach tail in the electron density of states (due to the disorder) near the band gap edge. However, this hypothesis implies the exponential wavelength dependence of imaginary part Vantarakis et al. (2009). But we did not manage to fit in the exponential form for explaining absorption in the DND Z+1, Z-1, and Z01 samples. The power function with the best fit quality corresponds to . The second hypothesis explains the absorption by the non-diamond phase (sp3-x or even graphite-like) shell evidenced by UV-vis and Raman spectroscopy Tomita et al. (2002); Korepanov et al. (2017); Mermoux et al. (2018) and by the means of X-ray diffraction and electron diffraction Kulakova et al. (2010); Hawelek et al. (2008); Yur’ev and Dolmatov (2010). Fig. 2 from Ref. Gioti and Logothetidis (2003) shows the dielectric permittivities of various types of amorphous carbon differ dramatically, which allows certain arbitrariness when tuning the dielectric permittivity. E.g. approximating with the power function the dependence for ta-C in Ref. Gioti and Logothetidis (2003) one obtains . Using the adjusted value of one can estimate the effective fraction of graphite-like phase in the primary crystallites as . Noteworthy, the latter quantity is an essential input parameter for modelling the disorder effects and line width in the nanodiamonds Raman spectra using microscopic DMM-BPM Koniakhin et al. (2018b) or continuous EKFG Utesov et al. (2018) models. The diffraction studies Kulakova et al. (2010); Hawelek et al. (2008); Yur’ev and Dolmatov (2010) indicate thickness of such disordered shell up to 1 nm, which gives drastic volume fraction for 4-5 nm particles. However the shell phase can not be considered as purely sp2 and thus contains smaller effective fraction of sp2 carbon. The extraction of non-diamond phase fraction from Raman measurements does not provide absolute accuracy due to differing scattering cross sections for diamond and graphite components.
VI Conclusion
As a net result, it is demonstrated that the preeminent part of the individual DND particles optical spectra is governed by the absorption of light, and not by its scattering. The scattering begins to dominate only for the DND agglomerates with the lateral size of several hundreds of nanometers. Although the exact mechanism underlying the absorption process remains unclear, the obtained results give a deeper understanding of the DND optical properties and allow to clarify the calculations involved in the analysis of the DND fluorescence spectra and particle size using dynamic light scattering. Normal Abs measurements supported by the measurements with IS or by measurements of side scattering allow distinguishing the contributions of scattering and absorption to nanodiamond spectra and can provide a deeper insight into the properties of their surface and phase composition. Clarification of the absorption mechanism in the primary DND crystallites and creation of an appropriate theoretical model is a bright challenge for the future studies of nanodiamonds.
Acknowledgements.
Theoretical and computational contributions, a part of optical experiments as well as developing the general idea of the study were conducted by S.V.K. and funded by RFBR according to the research project 18-32-00069. We acknowledge the project ”Quantum Fluids of Light” (ANR-16-CE30-0021). A.V.S. acknowledges RFBR (project 18-29-19125 MK) for sample preparation and DLS measurements. Thanks to A.Ya. Vul for his support. We are gratefully indebted to O. Bleu and D.D. Solnyshkov for useful criticism.References
- Hui et al. (2010) Y. Y. Hui, C.-L. Cheng, and H.-C. Chang, Journal of Physics D: Applied Physics 43, 374021 (2010).
- Ho (2010) D. N. Ho, Springer US) 10, 978 (2010).
- Schrand et al. (2009) A. M. Schrand, S. A. C. Hens, and O. A. Shenderova, Critical reviews in solid state and materials sciences 34, 18 (2009).
- Mochalin et al. (2012) V. N. Mochalin, O. Shenderova, D. Ho, and Y. Gogotsi, Nature nanotechnology 7, 11 (2012).
- Arnault (2017) J.-C. Arnault, Nanodiamonds: Advanced Material Analysis, Properties and Applications (William Andrew, 2017).
- Kidalov et al. (2007) S. Kidalov, F. Shakhov, and A. Y. Vul, Diamond and Related Materials 16, 2063 (2007).
- Boudou et al. (2009) J.-P. Boudou, P. A. Curmi, F. Jelezko, J. Wrachtrup, P. Aubert, M. Sennour, G. Balasubramanian, R. Reuter, A. Thorel, and E. Gaffet, Nanotechnology 20, 235602 (2009).
- Chen et al. (2017) Y.-C. Chen, P. S. Salter, S. Knauer, L. Weng, A. C. Frangeskou, C. J. Stephen, S. N. Ishmael, P. R. Dolan, S. Johnson, B. L. Green, G. W. Morley, M. E. Newton, J. G. Rarity, M. J. Booth, and J. M. Smith, Nat Photon 11, 77 (2017), letter.
- Stacey et al. (2012) A. Stacey, T. Karle, L. McGuinness, B. Gibson, K. Ganesan, S. Tomljenovic-Hanic, A. Greentree, A. Hoffman, R. Beausoleil, and S. Prawer, Applied Physics Letters 100, 071902 (2012).
- Fujiwara et al. (2019) M. Fujiwara, R. Tsukahara, Y. Sera, H. Yukawa, Y. Baba, S. Shikata, and H. Hashimoto, RSC Advances 9, 12606 (2019).
- Tisler et al. (2009) J. Tisler, G. Balasubramanian, B. Naydenov, R. Kolesov, B. Grotz, R. Reuter, J.-P. Boudou, P. A. Curmi, M. Sennour, A. Thorel, M. Borsch, K. Aulenbacher, R. Erdmann, P. R. Hemmer, F. Jelezko, and J. Wrachtrup, ACS nano 3, 1959 (2009).
- Neumann et al. (2008) P. Neumann, N. Mizuochi, F. Rempp, P. Hemmer, H. Watanabe, S. Yamasaki, V. Jacques, T. Gaebel, F. Jelezko, and J. Wrachtrup, Science 320, 1326 (2008).
- Robledo et al. (2011) L. Robledo, L. Childress, H. Bernien, B. Hensen, P. F. Alkemade, and R. Hanson, Nature 477, 574 (2011).
- Bernien et al. (2012) H. Bernien, L. Childress, L. Robledo, M. Markham, D. Twitchen, and R. Hanson, Physical Review Letters 108, 043604 (2012).
- Behler et al. (2009) K. D. Behler, A. Stravato, V. Mochalin, G. Korneva, G. Yushin, and Y. Gogotsi, ACS nano 3, 363 (2009).
- Maitra et al. (2009) U. Maitra, K. E. Prasad, U. Ramamurty, and C. Rao, Solid State Communications 149, 1693 (2009).
- Chen et al. (2018) X. Chen, B. Zhang, Y. Gong, P. Zhou, and H. Li, Applied Surface Science 439, 60 (2018).
- Kurkin et al. (2016) T. Kurkin, E. Tikunova, A. Solopchenko, M. Y. Yablokova, and A. Ozerin, Polymer Science Series C 58, 50 (2016).
- Guillevic et al. (2019) M. Guillevic, V. Pichot, P. Fioux, F. Schnell, and D. Spitzer, Diamond and Related Materials (2019).
- Tafti and Sadeghzadeh (2016) M. H. K. Tafti and S. M. Sadeghzadeh, Journal of Materials Science: Materials in Electronics 27, 5225 (2016).
- Hejazi and Mohandesi (2018) S. M. H. Hejazi and J. A. Mohandesi, Micro & Nano Letters 13, 154 (2018).
- Faklaris et al. (2009) O. Faklaris, V. Joshi, T. Irinopoulou, P. Tauc, M. Sennour, H. Girard, C. Gesset, J.-C. Arnault, A. Thorel, J.-P. Boudou, P. A. Curmi, and F. Treussart, ACS nano 3, 3955 (2009).
- Nunn et al. (2018) N. Nunn, M. d’Amora, N. Prabhakar, A. M. Panich, N. Froumin, M. D. Torelli, I. Vlasov, P. Reineck, B. Gibson, and J. M. Rosenholm, Methods and applications in fluorescence 6, 035010 (2018).
- Zhu et al. (2017) H. Zhu, Y. Wang, A. Hussain, Z. Zhang, Y. Shen, and S. Guo, Journal of Materials Chemistry B 5, 3531 (2017).
- Boudou et al. (2013) J.-P. Boudou, J. Tisler, R. Reuter, A. Thorel, P. A. Curmi, F. Jelezko, and J. Wrachtrup, Diamond and Related Materials 37, 80 (2013).
- Stehlik et al. (2015) S. Stehlik, M. Varga, M. Ledinsky, V. Jirasek, A. Artemenko, H. Kozak, L. Ondic, V. Skakalova, G. Argentero, T. Pennycook, J. C. Meyer, A. Feyfar, A. Kromka, and B. Rezek, The Journal of Physical Chemistry C 119, 27708 (2015).
- Baidakova et al. (2013) M. Baidakova, Y. A. Kukushkina, A. Sitnikova, M. Yagovkina, D. Kirilenko, V. Sokolov, M. Shestakov, A. Y. Vul, B. Zousman, and O. Levinson, Physics of the Solid State 55, 1747 (2013).
- Shiryaev et al. (2011) A. Shiryaev, A. Fisenko, I. Vlasov, L. Semjonova, P. Nagel, and S. Schuppler, Geochimica et Cosmochimica Acta 75, 3155 (2011).
- Shenderova and Vul’ (2014) O. Shenderova and A. Vul’, Detonation nanodiamonds: science and applications (CRC Press, 2014).
- Stehlik et al. (2016) S. Stehlik, M. Varga, M. Ledinsky, D. Miliaieva, H. Kozak, V. Skakalova, C. Mangler, T. J. Pennycook, J. C. Meyer, A. Kromka, and B. Rezek, Scientific reports 6, 38419 (2016).
- Dideikin et al. (2017) A. Dideikin, A. Aleksenskii, M. Baidakova, P. Brunkov, M. Brzhezinskaya, V. Y. Davydov, V. Levitskii, S. Kidalov, Y. A. Kukushkina, D. Kirilenko, V. V. Shnitov, A. V. Shvidchenko, B. V. Senkovsky, M. S. Shestakov, and A. Y. Vul’, Carbon 122, 737 (2017).
- Kuznetsov et al. (2018) N. Kuznetsov, S. Belousov, D. Y. Stolyarova, A. Bakirov, S. Chvalun, A. Shvidchenko, E. Eidelman, and A. Y. Vul, Diamond and Related Materials 83, 141 (2018).
- Tomita et al. (2002) S. Tomita, M. Fujii, and S. Hayashi, Physical Review B 66, 245424 (2002).
- Vul et al. (2011) A. Y. Vul, E. Eydelman, L. Sharonova, A. Aleksenskiy, and S. Konyakhin, Diamond and Related Materials 20, 279 (2011).
- Aleksenskii et al. (2012a) A. Aleksenskii, A. Y. Vul, S. Konyakhin, K. Reich, L. Sharonova, and E. Eidel’man, Physics of the Solid State 54, 578 (2012a).
- Usoltseva et al. (2018) L. Usoltseva, D. Volkov, D. Nedosekin, M. Korobov, M. Proskurnin, and V. Zharov, Photoacoustics (2018).
- Volkov et al. (2012) D. Volkov, P. Semenyuk, M. Korobov, and M. Proskurnin, Journal of analytical chemistry 67, 842 (2012).
- Klemeshev et al. (2016) S. Klemeshev, M. Petrov, V. Rolich, A. Trusov, A. Voitylov, and V. Vojtylov, Diamond and Related Materials 69, 177 (2016).
- Osawa (2007) E. Osawa, NCRI Technical Bulletin 2, 1365 (2007).
- Ōsawa (2008) E. Ōsawa, Pure and Applied Chemistry 80, 1365 (2008).
- Koniakhin et al. (2015) S. Koniakhin, I. Eliseev, I. Terterov, A. Shvidchenko, E. Eidelman, and M. Dubina, Microfluidics and Nanofluidics 18, 1189 (2015).
- Aleksenskii et al. (2012b) A. Aleksenskii, A. Shvidchenko, and E. Eidel’man, Technical Physics Letters 38, 1049 (2012b).
- Hauf et al. (2011) M. Hauf, B. Grotz, B. Naydenov, M. Dankerl, S. Pezzagna, J. Meijer, F. Jelezko, J. Wrachtrup, M. Stutzmann, F. Reinhard, and J. Garrido, Physical Review B 83, 081304 (2011).
- Ofori-Okai et al. (2012) B. Ofori-Okai, S. Pezzagna, K. Chang, M. Loretz, R. Schirhagl, Y. Tao, B. Moores, K. Groot-Berning, J. Meijer, and C. Degen, Physical Review B 86, 081406 (2012).
- Loretz et al. (2014) M. Loretz, S. Pezzagna, J. Meijer, and C. Degen, Applied Physics Letters 104, 033102 (2014).
- Lucas et al. (1994) A. A. Lucas, L. Henrard, and P. Lambin, Phys. Rev. B 49, 2888 (1994).
- Draine and Lee (1984) B. Draine and H. M. Lee, The Astrophysical Journal 285, 89 (1984).
- Vantarakis et al. (2009) G. Vantarakis, C. Mathioudakis, G. Kopidakis, C. Wang, K. Ho, and P. Kelires, Physical Review B 80, 045307 (2009).
- Schmidlin et al. (2012) L. Schmidlin, V. Pichot, M. Comet, S. Josset, P. Rabu, and D. Spitzer, Diamond and Related Materials 22, 113 (2012).
- Yoshikawa et al. (1995) M. Yoshikawa, Y. Mori, H. Obata, M. Maegawa, G. Katagiri, H. Ishida, and A. Ishitani, Applied Physics Letters 67, 694 (1995).
- Mermoux et al. (2018) M. Mermoux, S. Chang, H. A. Girard, and J.-C. Arnault, Diamond and Related Materials (2018).
- Osswald et al. (2009) S. Osswald, V. Mochalin, M. Havel, G. Yushin, and Y. Gogotsi, Physical Review B 80, 075419 (2009).
- Vul et al. (2006) A. Y. Vul, A. Dideikin, Z. Tsareva, M. Korytov, P. Brunkov, B. Zhukov, and S. Rozov, Technical physics letters 32, 561 (2006).
- Aleksenskii et al. (1997) A. Aleksenskii, M. Baidakova, A. Y. Vul, V. Y. Davydov, and Y. A. Pevtsova, Physics of the Solid State 39, 1007 (1997).
- Aleksenskii et al. (1999) A. Aleksenskii, M. Baidakova, A. Y. Vul, and V. Siklitskii, Physics of the Solid State 41, 668 (1999).
- Shenderova et al. (2011) O. A. Shenderova, I. I. Vlasov, S. Turner, G. Van Tendeloo, S. B. Orlinskii, A. A. Shiryaev, A. A. Khomich, S. N. Sulyanov, F. Jelezko, and J. Wrachtrup, The Journal of Physical Chemistry C 115, 14014 (2011).
- Ozerin et al. (2008) A. Ozerin, T. Kurkin, L. Ozerina, and V. Y. Dolmatov, Crystallography Reports 53, 60 (2008).
- Koniakhin et al. (2018a) S. Koniakhin, N. Besedina, D. Kirilenko, A. Shvidchenko, and E. Eidelman, Superlattices and Microstructures 113, 204 (2018a).
- Edwards and Ochoa (1981) D. F. Edwards and E. Ochoa, JOSA 71, 607 (1981).
- Bhagavantam and RAO (1948) S. Bhagavantam and D. N. RAO, Nature 161, 729 (1948).
- Landau et al. (2013) L. D. Landau, J. Bell, M. Kearsley, L. Pitaevskii, E. Lifshitz, and J. Sykes, Electrodynamics of continuous media, Vol. 8 (elsevier, 2013).
- Reynolds and Hough (1957) J. Reynolds and J. Hough, Proceedings of the Physical Society. Section B 70, 769 (1957).
- Karkkainen et al. (2000) K. K. Karkkainen, A. H. Sihvola, and K. I. Nikoskinen, IEEE Transactions on Geoscience and Remote Sensing 38, 1303 (2000).
- Sorensen (2001) C. Sorensen, Aerosol Science & Technology 35, 648 (2001).
- Tomchuk et al. (2014) O. V. Tomchuk, D. S. Volkov, L. A. Bulavin, A. V. Rogachev, M. A. Proskurnin, M. V. Korobov, and M. V. Avdeev, The Journal of Physical Chemistry C 119, 794 (2014).
- Baidakova et al. (1999) M. Baidakova, V. Siklitsky, and A. Y. Vul, Chaos, Solitons & Fractals 10, 2153 (1999).
- Gioti and Logothetidis (2003) M. Gioti and S. Logothetidis, Diamond and related materials 12, 957 (2003).
- Mie (1908) G. Mie, Annalen der physik 330, 377 (1908).
- Hulst and van de Hulst (1957) H. C. Hulst and H. C. van de Hulst, Light scattering by small particles (Courier Corporation, 1957).
- Bohren and Huffman (1983) C. F. Bohren and D. R. Huffman, Absorption and scattering by a sphere (Wiley Online Library, 1983).
- Mathematica (2009) W. Mathematica, Inc., Champaign, Illinois (2009).
- Mätzler (2002) C. Mätzler, IAP Res. Rep 8, 1 (2002).
- Kubelka and Munk (1931) P. Kubelka and F. Munk, Physik 12, 593 (1931).
- Kubelka (1948) P. Kubelka, Josa 38, 448 (1948).
- Kubelka (1954) P. Kubelka, JOSA 44, 330 (1954).
- (76) See Supplemental Material at [URL will be inserted by publisher].
- Ryde (1931) J. W. Ryde, Proceedings of the Royal Society of London. Series A, Containing Papers of a Mathematical and Physical Character 131, 451 (1931).
- Ryde and Cooper (1931) J. W. Ryde and B. Cooper, Proceedings of the Royal Society of London. Series A, Containing Papers of a Mathematical and Physical Character 131, 464 (1931).
- Konyakhin et al. (2013) S. Konyakhin, L. Sharonova, and E. Eidelman, Technical Physics Letters 39, 244 (2013).
- Trofimuk et al. (2018) A. Trofimuk, D. Muravijova, D. Kirilenko, and A. Shvidchenko, Materials 11, 1285 (2018).
- Kumar et al. (2014) P. V. Kumar, N. M. Bardhan, S. Tongay, J. Wu, A. M. Belcher, and J. C. Grossman, Nature chemistry 6, 151 (2014).
- Korepanov et al. (2017) V. I. Korepanov, H.-o. Hamaguchi, E. Osawa, V. Ermolenkov, I. K. Lednev, B. J. Etzold, O. Levinson, B. Zousman, C. P. Epperla, and H.-C. Chang, Carbon 121, 322 (2017).
- Kulakova et al. (2010) I. Kulakova, V. Korol’kov, R. Y. Yakovlev, and G. Lisichkin, Nanotechnologies in Russia 5, 474 (2010).
- Hawelek et al. (2008) L. Hawelek, A. Brodka, J. C. Dore, V. Honkimaki, S. Tomita, and A. Burian, Diamond and Related Materials 17, 1186 (2008).
- Yur’ev and Dolmatov (2010) G. Yur’ev and V. Y. Dolmatov, Journal of Superhard Materials 32, 311 (2010).
- Koniakhin et al. (2018b) S. V. Koniakhin, O. I. Utesov, I. N. Terterov, A. V. Siklitskaya, A. G. Yashenkin, and D. Solnyshkov, The Journal of Physical Chemistry C 122, 19219 (2018b).
- Utesov et al. (2018) O. I. Utesov, A. G. Yashenkin, and S. V. Koniakhin, The Journal of Physical Chemistry C 122, 22738 (2018).