Observation of Atom Number Fluctuations in a Bose-Einstein Condensate
Abstract
Fluctuations are a key property of both classical and quantum systems. While the fluctuations are well understood for many quantum systems at zero temperature, the case of an interacting quantum system at finite temperature still poses numerous challenges. Despite intense theoretical investigations of atom number fluctuations in Bose-Einstein condensates, their amplitude in experimentally relevant interacting systems is still not fully understood. Moreover, technical limitations have prevented their experimental investigation to date. Here we report the observation of these fluctuations. Our experiments are based on a stabilization technique, which allows for the preparation of ultracold thermal clouds at the shot noise level, thereby eliminating numerous technical noise sources. Furthermore, we make use of the correlations established by the evaporative cooling process to precisely determine the fluctuations and the sample temperature. This allows us to observe a telltale signature: the sudden increase in fluctuations of the condensate atom number close to the critical temperature.
The experimental realization of weakly interacting Bose-Einstein condensates (BECs) created a new experimental paradigm for understanding many particle quantum systems Bloch2008. However, the population statistics of BECs has not been investigated experimentally beyond its first moment, since all higher moments, such as the BEC number fluctuations, were inaccessible due to technical noise. Furthermore, the theoretical description of these higher moments of weakly interacting trapped gases poses considerable challenges Kocharovsky2006, and to date no exact prediction is available at the typical experimental atom numbers.
Historically, the theory of Bose-Einstein condensation for noninteracting bosons was developed within the grand canonical ensemble Dalfovo1999. However, the grand canonical description is inadequate to describe atomic Bose gases of fixed atom numbers below the critical temperature for condensation Ziff1977. In particular, as the ground state becomes macroscopically occupied, grand canonical theory predicts unphysically large fluctuations of the total atom number , which contradicts particle conservation. This observation is at times referred to as the grand canonical catastrophe Grossmann1996; Holthaus1998. Any description of the system must therefore be based on the canonical or microcanonical ensemble.
Renewed theoretical interest in the number fluctuations in a BEC was inspired by the experimental realization of Bose-Einstein condensation in dilute gases Ketterle1999. The asymptotic expression for the variance of the condensate population in a canonical ensemble was first derived by Politzer Politzer1996 for an ideal gas
| (1) |
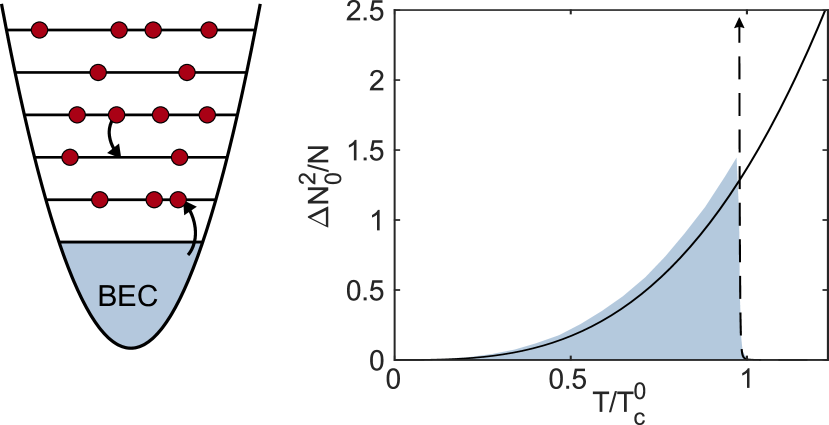
where is the ideal gas critical temperature for Bose-Einstein condensation and is the Riemann zeta function. This was quickly followed by the introduction of the Maxwell demon ensemble Navez1997 that enabled the derivation of the asymptotic expression in the microcanonical ensemble. In parallel, numerical techniques were introduced for exact calculations for a finite number of particles Weiss1997, and a master equation approach based on the laser phase transition analogy was developed Scully1999. Figure 1 illustrates the breakdown of the grand canonical ensemble and the behavior of the fluctuations for an ideal Bose gas.
In general, an ensemble description is physically meaningful only in the presence of interactions. Despite numerous attempts Giorgini1998; Idziaszek1999; Kocharovsky2000; Kocharovsky2006; Svidzinsky2006; Bhattacharyya2016, no exact results are known for interacting bosons, especially close to the critical temperature. An experimental investigation of this fundamental feature is therefore of paramount importance. In recent experiments fluctuations in photon BECs were studied under grand canonical conditions where the particle number conservation does not apply Schmitt2014; Wurff2014. However, for atomic BECs only the statistics of the total number of particles has been studied Chuu2005.
In this letter, we observe the fundamental fluctuations of the ground state occupation of harmonically trapped interacting BECs. Despite the considerable theoretical attention outlined above, the fluctuations have to date eluded experimental observation because fluctuations on the order of are typically hidden in the technical fluctuations of BEC experiments. We have recently implemented a stabilization technique that permits the preparation of ultracold thermal clouds at the shot noise level Gajdacz2016, which eliminates numerous technical noise sources. A final evaporative cooling step from this starting point thus allows for the production of BECs in a precisely controlled range of atom numbers. We find that both the BEC occupation and the temperature are strongly correlated with the total atom number. Based on this correlation, both the fluctuations and the temperature can be precisely determined, thereby allowing the observation of BEC fluctuations.
The experimental challenges for the observation of fluctuations are illustrated in Fig. 1. The variance of the peak number fluctuations of a BEC in a typical realization is . For a total atom number of , this implies that the standard deviation of the BEC atom number must be measured at a level of . Thus, the relative precision of the atom number determination must be better than 111In principle this can also be achieved in a system with large shot-to-shot fluctuations. If , and can be determined sufficiently well, the data can be binned according to and to obtain . In practice however, the determination of from individual fits to the experimental data is typically not sufficiently precise. Moreover this approach would require a very large number of realizations, due to the variation of and by in typical experiments. In the following, we describe how this precision is achieved in our experimental realization.
The experimental apparatus used to produce BECs has been described in detail previously Park2012. Briefly, 87Rb atoms are initially captured in a magneto-optical trap and transported into a Ioffe-Pritchard-type magnetic trap where they are cooled by radio-frequency (RF) evaporation. To stabilize the production of ultracold clouds, the cooling process is interrupted when the clouds contain atoms at a temperature of K. The stabilization technique was presented in Gajdacz2016 and here we describe only the improvements to the procedure relevant for the current experiment. We probe the clouds using minimally destructive Faraday imaging Gajdacz2013; *Kristensen2017 by acquiring 50 images that are analyzed in real time. Based on the outcome, the atom number is corrected by spilling excess atoms using a weak RF-pulse of controllable duration. The RF-pulse is resonant with atoms at the mean energy of the sample and thus does not affect the temperature of the sample. Subsequently, the magnetic trap is decompressed by increasing the bias field in the axial direction leading to radial and axial trapping frequencies of and 222The decompression lowers the trap anisotropy and thus reduces the probability for the excitation of phase fluctuations. Thus the occurrence of the density modulations after time-of-flight expansion is avoided, which can be detrimental for the evaluation of atom numbers and temperatures. and an aspect ratio of . At this point, the clouds are probed by a second set of 20 Faraday images to ensure that the stabilization was successful. Finally, BECs are produced by applying a last RF sweep that ends at a frequency corresponding to the desired average BEC occupation. To ensure that the clouds are in thermal equilibrium, they are first held in the trap for a further 3 seconds at the final radio frequency and without RF before the trap is extinguished. Finally, the clouds are probed using resonant absorption imaging after a time of flight.
To accurately detect the density distribution of dense clouds we use saturating light at an intensity , and calibrate the imaging system following Ref. Reinaudi2007. Off-resonant light in the imaging beam limits the maximal observable optical density and must be minimized. This is achieved by using a volume Bragg grating, which removes the broad background of spontaneous emission typically emitted by diode lasers. Vibrations of optical components in the imaging system degrade the ability to normalize the absorption image with a background image, and thus deteriorate the result of absorption imaging. To mitigate this effect, the separation between the images is minimized. By applying an optical pumping pulse on the to transition after the absorption image, all atoms are transferred to the state. The cloud thus becomes transparent to the background imaging pulse and allows us to reduce the image separation to , which is limited by the camera readout speed.
The atom number and temperature are extracted from the time-of-flight images as follows. The optical density is integrated by summation in a region of interest (ROI) containing the entire cloud to obtain the total atom number . Then the optical density is fitted with a Bose-enhanced thermal distribution in a ring-shaped ROI, which excludes the condensate, to obtain the temperature of the sample. This thermal distribution is subtracted from the total optical density, and the condensate atom number is obtained by summation of the remaining optical density in the central ROI. The high quality of the absorption imaging thus allows for a precise determination of the atom numbers and . However, the fitting procedure typically results in a larger uncertainty of the temperature, which prevents a direct evaluation of the fluctuations at a given temperature.
This difficulty is overcome due to the stabilization technique in combination with the inherent properties of evaporative cooling. When an evaporative cooling step is applied to an atomic cloud of well-known initial atom number and temperature, the final atom number and temperature are strongly correlated Ketterle1996. In typical experiments the initial atom number is not well controlled, and this correlation is washed out. In our case, however, the stabilization provides a well-known initial atom number and after evaporation and can be regarded as a function of the total atom number, reducing the problem dimensionality to a single parameter .
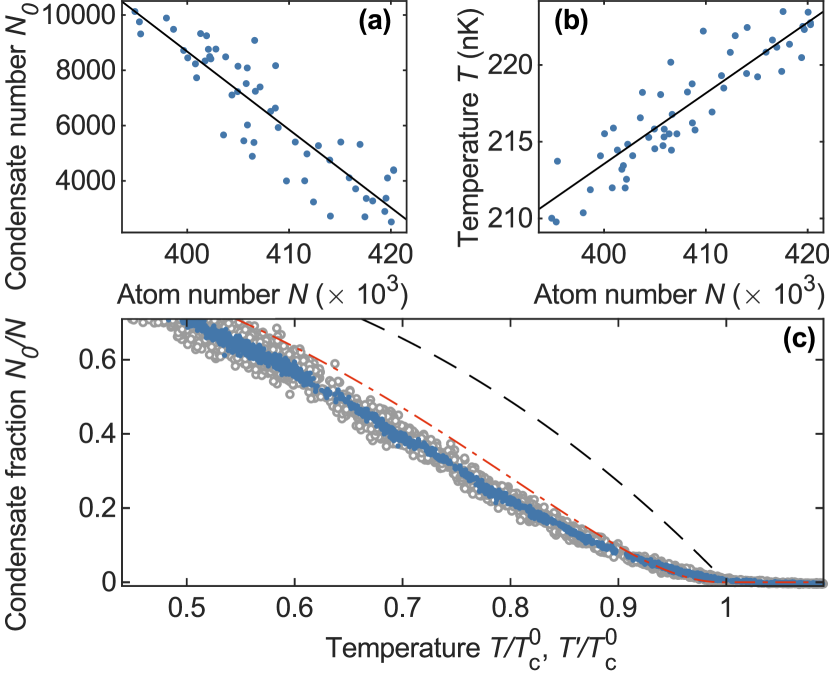
Figures 2(a) and 2(b) show the BEC atom number and temperature as a function of the total atom number for a chosen final radio frequency. The remaining variation of the total atom number is primarily due to small drifts of the trap’s magnetic offset field, causing minor variations of and . Note that this corresponds to a narrow interval in , and . To extract the variance of the BEC number in such an interval we linearly fit 333A linear fit is the most conservative choice on a small interval and avoids over interpretation of the data. and obtain by evaluating the variance with respect to the fit.
In addition, the correlation between and over the entire data set allows us to extract a precise temperature for each realization. Similar to the BEC atom number, we linearly fit as shown in Fig. 2(b). Based on this fit we obtain a corrected temperature for each realization. This method reduces the uncertainty of individual temperatures by using all temperature information within a narrow interval and by using the high precision of atom number determination to obtain the best estimate for the temperature in a particular realization.
Figure 2(c) shows the condensate fraction as a function of the corrected temperature where the ideal gas critical temperature was calculated individually for each point. The data clearly illustrate the high precision obtained with this method. The deviation from the ideal gas prediction is primarily caused by repulsive interactions Giorgini1996. The semi-ideal model captures the smooth onset of condensation and the observed condensate fraction very well. The remaining disagreement is due to the noninteracting thermal approximation of the model and systematic errors of the temperature determination Gerbier2004; SupplementaryMaterial.
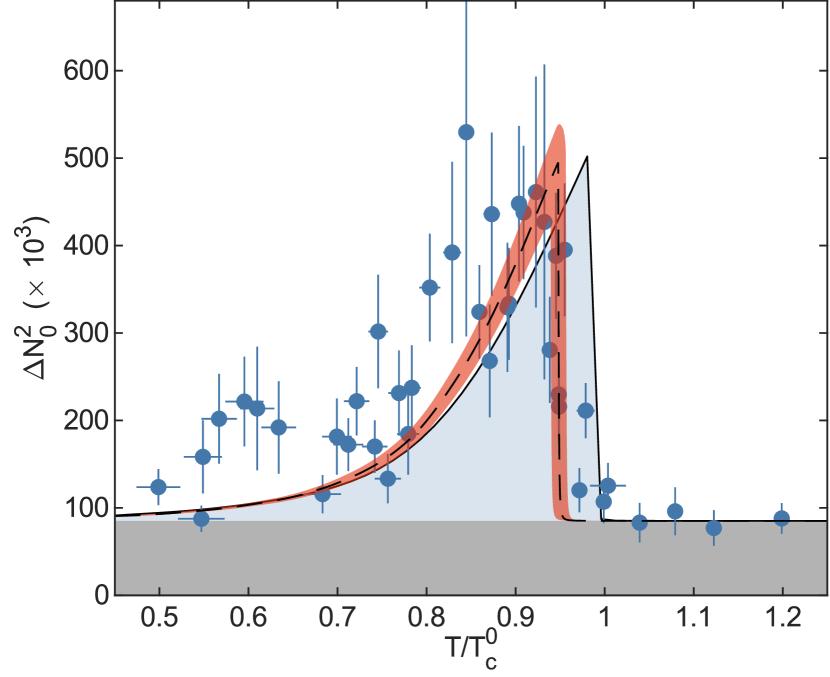
Figure 3 shows our main result, the variance of the condensate number as a function of the reduced temperature , where is the mean temperature. Just below , the data show a clear onset of fluctuations, as expected from Fig. 1. The observed fluctuations grow rapidly as the critical temperature is crossed, and well below they decay due to decreasing and . To verify this result the experiment was conducted for different trap aspect ratios and rethermalization conditions SupplementaryMaterial. Additionally, different fitting models of the absorption images were tested SupplementaryMaterial.
Each data point in Fig. 3 is based on at least 45 experimental realizations. The number varies slightly, since a small number of realizations where the stabilization failed were excluded. Above the data are evaluated with the exact same method despite the absence of a BEC. The observed variance therefore corresponds to an offset arising from technical fluctuations. Based on the average variance of the data points at we obtain an offset variance of . This confirms that atom number variations at the level of atoms can be detected.
Because of the theoretical challenges posed by this interacting quantum system, a full comparison with a theoretical prediction is not possible at the atom numbers in our experiments. However, in the following we estimate the most relevant contributions beyond the canonical solution due to the geometry of the trap and the effect of interactions.
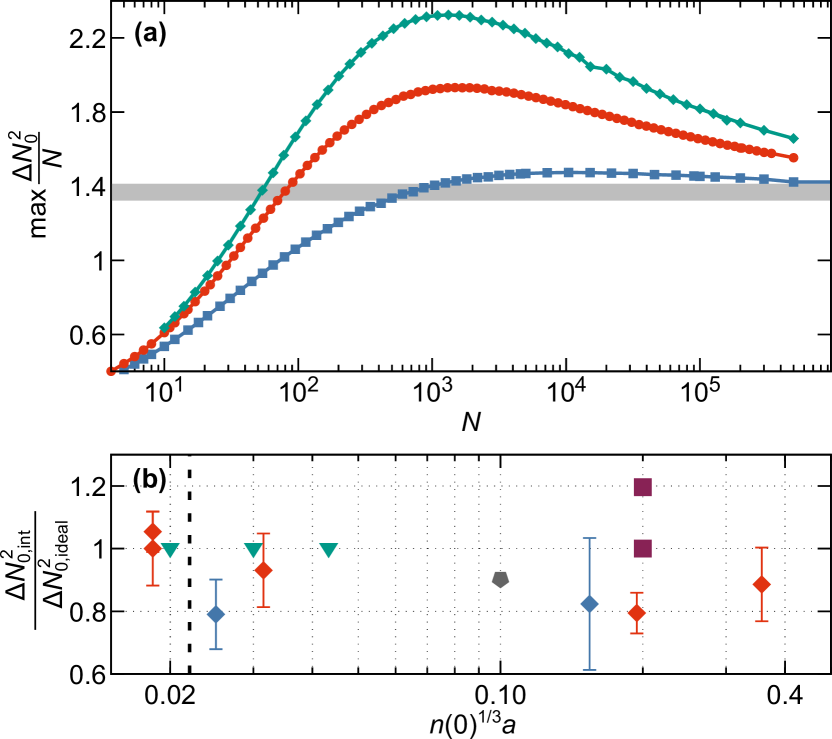
First the dependence of the fluctuations on the geometry of the trapping potential is analyzed. We calculated the fluctuations for a noninteracting Bose gas in the canonical ensemble using exact particle number counting statistics Weiss1997. Figure 4(a) shows the maximum relative variance of the fluctuations for a spherical trap and for our elongated trapping geometry as a function of the total atom number. For large atom numbers, the limiting value corresponds to the result of Eq. (1) at which yields . We attribute the behavior in the elongated trap at intermediate atom numbers to the reduced dimensionality of the system at these parameters, which leads to increased fluctuations. The asymmetry of the trapping potential thus plays a crucial role for the expected maximal fluctuations. For our case these fluctuations are enhanced by 15% compared to a spherical trap.
Secondly we discuss the effect of interactions on the fluctuations. Despite considerable theoretical effort Kocharovsky2006, there is currently no model offering an exact prediction for a trapped, interacting BEC for large number of atoms close to the phase transition. We therefore estimate the effect of interaction using a classical fields approach (CFA) for smaller samples of up to atoms, but adjust the interaction strength to mimic the experiment. The CFA has been described in detail in Brewczyk2007. Briefly, we map the quantum field operator to a classical field decomposed into harmonic oscillator (HO) eigenfunctions of the trap. Thus we map the quantum problem to a classical one described by the complex HO amplitudes. To avoid an ultraviolet catastrophe, we use an appropriate cutoff for the high energy modes Witkowska2009. Finally, we sample the phase space in thermal equilibrium by using the Metropolis algorithm Bienias2011; SupplementaryMaterial. Figure 4(b) shows our result in terms of the ratio between the maximal fluctuations of an interacting and a noninteracting BEC as a function of the interaction strength . Additionally, appropriately scaled results from all other available simulations for interacting harmonically trapped BECs are displayed. These calculations indicate that the interactions play only a minor role, and thus a comparison with the ideal gas result is sufficient to analyze the present experimental result.
Based on this understanding we compare our experimental results to noninteracting canonical theories in two ways. First we compare our result with an exact canonical calculation Weiss1997, shown as a blue shaded region in Fig. 3 for our trapping geometry and atom number at each . To account for technical fluctuations we have added the constant offset to the theory. The striking increase in fluctuations just below the ideal gas critical temperature is well reproduced in this comparison. The increase is consistent with our data, which shows the same feature, thus demonstrating that we have observed the onset of fluctuations in a BEC.
Secondly, we compare our results with the limiting noninteracting theoretical cases presented in Fig. 1 Politzer1996. Inspired by these results, we choose the fitting function
| (2) |
where the free parameters are the amplitude of the fluctuations, , and the shift of the reduced temperature, . The result of the fit is shown in Fig. 3 providing and . The amplitude is slightly larger than the limiting value for the noninteracting case Eq. (1). This is consistent with an expected enhancement of the fluctuations due to the asymmetry of the trap as shown in Fig. 4(a), and hence the agreement with the non-interacting calculation taking trapping geometry into account is very good. Additionally, we observe a small shift in the reduced temperature of , which is expected due to a shift of the critical temperature caused by interactions Giorgini1996; SupplementaryMaterial. The fit also allows us to extract the maximal fluctuations at a reduced temperature and atom number .
In conclusion, we have observed the atom number fluctuations in a trapped interacting BEC indicated by a telltale increase of the fluctuations at the critical temperature. The observed fluctuations are well described by a noninteracting theory including the asymmetry of the harmonic trap. At the present signal-to-noise level, it is not possible to discriminate between different theoretical predictions for the fluctuations in interacting BECs. In future experiments we plan to investigate the scaling of the fluctuations with the atom number at fixed temperature, which has been theoretically debated Giorgini1998; Idziaszek1999; Yukalov2004; Zwerger2004.