On Neutron Star Mergers as the Source of r-process Enhanced Metal Poor Stars in the Milky Way
Abstract
We model the history of Galactic r-process enrichment using high-redshift, high-resolution zoom cosmological simulations of a Milky Way (MW) type halo. We assume that all r-process sources are neutron star mergers (NSMs) with a power law delay time distribution. We model the time to mix pollutants at subgrid scales, which allows us to to better compute the properties of metal poor (MP) and carbon enhanced metal poor (CEMP) stars, along with statistics of their r-process enhanced subclasses. Our simulations underpredict the cumulative ratios of r-process enhanced MP and CEMP stars (MP-r ,CEMP-r ) over MP and CEMP stars by about one order of magnitude, even when the minimum coalescence time of the double neutron stars () is set to 1 Myr. No r-process enhanced stars form if Myr. Our results show that even when we adopt the r-process yield estimates observed in GW170817, NSMs by themselves can only explain the observed frequency of r-process enhanced stars if the birth rate of double neutron stars per unit mass of stars is boosted to .
1. Introduction
The recent aLIGO/aVirgo detection of gravitational waves from the merger of two neutron stars (GW170817; Abbott et al., 2017a), and the subsequent kilonova observed across the entire electromagnetic spectrum (Abbott et al., 2017b; Coulter et al., 2017) have confirmed that r-process elements are made in copious amounts in neutron star mergers (NSMs; Abbott et al., 2017c; Kasen et al., 2017). This discovery could be the sine qua non for showing that NSMs are the primary source of r-process elements in the Milky Way (Côté et al., 2018b).
On the other hand, while it is clear that NSMs are one of the sources of r-process enrichment, it remains an open question if they are the most important source. To address this question, several theoretical studies have modeled r-process enrichment of a Milky Way (MW) type halo and its ultra faint dwarf (UFD) satellites by NSMs. van de Voort et al. (2015a) carried out a zoom simulation of a MW type halo to and concluded that NSM events can explain the observed [r-process /Fe] abundance ratios assuming r-process mass is ejected into the ISM in each NSM event. Shen et al. (2015) studied the sites of r-process production by post-processing “Eris” zoom simulations, and found that r-process elements can be incorporated into stars at very early times, a result that is insensitive to modest variations in the delay distribution and merger rates. Separately, Safarzadeh & Scannapieco (2017) studied r-process enrichment in the context of UFDs and concluded that natal kicks can affect the r-process enhancement of subsequent stellar generations.
In each of these studies, it is observations of metal poor (MP) and carbon enhanced metal poor (CEMP) stars that are most constraining. Such stars encode a wealth of information about the formation of the first stars in the universe (Beers & Christlieb, 2005; Frebel & Norris, 2015), and similarly their r-process enhanced subclasses (MP-r and CEMP-r ), provide insight into the earliest r-process sources. Therefore, a successful theory for the source of the r-process should be able to explain the observed statistics of MP-r and CEMP-r stars in the MW’s halo (Barklem et al., 2005; Abate et al., 2016).
In fact, the very existence of CEMP-r stars poses new challenges for the origin of r-process elements in the early universe. These stars are believed to form at high redshifts and in low mass halos where Population III (Pop. III) stars have polluted the halo with their carbon rich ejecta. In such low mass halos, for a CEMP-r star to form, an r-process source that acts on a timescale similar to Pop. III stars (i.e., 10 Myr) is needed (Ramirez-Ruiz et al., 2015).
Could the observed statistics of different classes of r-process enhanced stars be explained by NSMs as the sole source of r-process in the early universe? In this study, we address this question, by carrying out a set of zoom cosmological simulations of a MW type halo and modeling NSMs as the sources of the r-process material. We improve on crucial aspects of previous such simulations on three fronts: (i) Modeling the coalescence timescales of double neutron stars (DNSs) as drawn from distributions motivated by population synthesis analyses (Fryer et al., 1998; Dominik et al., 2012; Behroozi et al., 2014). (ii) Identifying Pop. III stars by following the evolution of pristine gas in each simulation cell with a subgrid model of turbulent mixing that is crucial for properly identifying Pop. III stars whose ejecta are the precursor to the formation of CEMP stars (Sarmento et al., 2017; Naiman et al., 2018); (iii) Adopting a high dark matter particle mass resolution in order to resolve halos where the MP and CEMP stars form in the early universe.
The structure of this work is as follows: In §2 we describe our method in detail. In §3 we present our results and compare them to observations of MW halo stars. In §4 we discuss our results and conclusions. Throughout this paper, we adopt the Planck 2015 cosmological parameters (Planck Collaboration et al., 2016) where , , are total matter, vacuum, and baryonic densities, in units of the critical density , is the Hubble constant in units of 100 km/s/Mpc, is the variance of linear fluctuations on the 8 Mpc scale, is the tilt of the primordial power spectrum, and is the primordial helium fraction.
2. method
We used ramses (Teyssier, 2002), a cosmological adaptive mesh refinement (AMR) code, which implements an unsplit second-order Godunov scheme for evolving the Euler equations. ramses variables are cell-centered and interpolated to the cell faces for flux calculations, these are then used by a Harten-Lax-van Leer-Contact Riemann solver (Toro et al., 1994).
We performed a set of zoom cosmological simulations of a MW type halo in order to address if NSMs can be considered the primary source of r-process enrichment in the early universe. We adopted three different minimum timescales for the coalescence of the DNSs: , 10, and Myrs. We also adopted three different energy for the NS merger event and run simulations: , , and ergs. In all cases, we stopped the simulations at when reionization is complete and the formation of the metal poor stars largely diminishes. The statistics of different classes of stars displaying a high abundance of r-process elements are then compared against MW’s halo stars.
2.1. Simulation setup and Milky Way initial conditions
To initialize our simulations, we first ran a dark matter only simulation down to redshift zero in a periodic box with a comoving size of 50 Mpc h-1. Initial conditions (ICs) were generated from music (Hahn & Abel, 2011) for a Planck 2015 cosmology. The virial mass and radius of the halos are derived from the HOP halo finder (Eisenstein & Hut, 1998). We used a halo mass cut of to ensure we only identified halos with a mass similar to the MW. We found 275 such halos within the desired mass range in our simulation box. We further refined our MW-type halo candidates by requiring them to be isolated systems. We estimated this based on the tidal isolation parameter () approach (Grand et al., 2017). The isolation parameter for each halo is computed as:
| (1) |
where and are the virial mass and radius of the halo of interest, and and are the virial mass of and distance to the -th halo in the simulation, respectively. We computed for all halos with masses between , by searching within a distance of 10 Mpc h-1 centered on the location of each halo. The most isolated halos, i.e., those with lowest values of are our candidate MW-like halos.
Next, we traced the dark matter (DM) particles within , for the top five candidates with the lowest values for , back to the starting redshift. The locations of these DM particles determine the Lagrangian enclosing box. The halo with the smallest box, now our zoom region, was chosen for our simulations to reduce the computational costs.
For the full hydrodynamic simulations, this zoom region is refined to a base level of 12, and 13 for two different sets of simulations corresponding to a dark matter particle mass of and respectively. The zoom region has sides comoving Mpc h-1 .
2.2. Star formation and feedback
The stellar particle mass in the simulation is where is the best resolution cell size achievable and is drawn from a Poisson distribution
| (2) |
where
| (3) |
and the star formation efficiency was set to 0.01 (Krumholz & Tan, 2007) in our simulations. Setting , the maximum refinement in the simulation, to 24, together with H/cm3 as the threshold for star formation in the cells results in a stellar particle mass of . This is massive enough to host the two supernovae needed to create a double neutron star. is the maximum refinement level in the simulation. A further limitation on star particle formulation is that no more than 90% of the cell’s gas mass can be converted into stars.
In this study, we only modeled r-process elements production by NSMs and slow -process channels were not modeled. Consequently, we did not model elements such as barium that have both r-process and -process origin. Also, we did not model SN Ia because of their long average delay times of the order of 200-500 Myr (Raskin et al., 2009). Given the stellar particle mass (), 50% of all such particles were assumed to host one core-collapse supernova (CCSN), assigned stochastically. Therefore, half of the stellar particles generated a CCSN ejecting a total mass of with a kinetic energy of 10 Myr after the star was formed. The metallicity yield for each CCSN is set to meaning one solar mass of metals is ejected in each CCSN event.
For each newly formed star particle, the ejected mass and energy were deposited into all cells whose centers are within 20 pc of the particle, and if the size of the cell containing the particle is greater than 20 pc, the energy and ejecta are deposed into the adjacent cells (Dubois & Teyssier, 2008). Here the total mass of the ejecta is that of the stellar material plus an amount of the gas within the cell hosting the star particle (entrained gas) such that , and . Similarly, the mass in metals added to the simulation is taken to be 15% of the SN ejecta plus the metals in the entrained material, .
We separately tracked the metals generated by Pop III stars. These are dubbed ‘primordial metals’ and their mass is taken to be since the scalar captures the mass fraction of the star particle that represents Pop III stars. SN feedback is the dominant driver of turbulence in our simulation and we have modeled the feedback to be purely in kinetic form. Lastly, we note that we do not model black hole formation and its feedback because its impact is expected to be negligible at this redshift (Scannapieco & Oh, 2004; Scannapieco et al., 2005; Croton et al., 2006; Sijacki et al., 2007)
2.3. Cooling
We used CLOUDY (Ferland et al., 1998) to model cooling at temperatures K. Below this temperature we used Rosen & Bregman (1995) and allowed the gas to cool radiatively to 100 K. However, adiabatic cooling can result in gas falling below this temperature.
Additionally, we supplemented the cooling in the primordial gas with an cooling model based on Martin et al. (1996). We computed the cooling rate for each simulation cell based on its density, temperature, and H2 fraction, . We set the primordial fraction according to Reed et al. (2005) with .
Although we did not explicitly model radiative transfer, we modeled the Lyman-Werner flux from our star particles since these photons destroy H2. We used photons per stellar baryon (Greif & Bromm, 2006) and assumed optically thin gas throughout the simulation volume. The total number of stellar baryons, , was computed each step by totaling the mass in star particles assuming a near-primordial composition (=0.73, =0.25). The value of was then updated every simulation step:
| (4) |
where
| (5) |
We did not model the formation of H2 since subsequent cooling is dominated by metals shortly after the first stars are formed. Lastly, we included a UV background model based on Haardt & Madau (1996) model.
2.4. Turbulent mixing
We made use of the work described in Sarmento et al. (2017) to generate and track new metallicity-related quantities for both the gas and star particles. Specifically, for each cell in the simulation we tracked the average primordial metallicity, , which tracks the mass fraction of metals generated by Pop. III stars, and the pristine gas mass fraction, , which models the fraction of unpolluted gas within each simulation cell with . We briefly describe these scalars here, and a more thorough discussion is presented in Sarmento et al. (2017).
The primordial metallicity scalar, , tracked the metallicity arising from Pop. III stars. This scalar allowed us to track the fraction of Pop. III SN ejecta in subsequent stellar populations. Yields from Pop. III stars are likely to have non-solar elemental abundance ratios (Heger & Woosley, 2002; Umeda & Nomoto, 2003; Ishigaki et al., 2014) and contribute to the unusual abundances patterns seen in the halo and UFD CEMP stars. Knowing both and the overall metallicity of the gas, , allowed us to estimate the abundances of various elements, without having to track each one individually. Similarly, the elemental abundance pattern for regular metals, is accounted for by a single scalar . By tracking these values for each star particle in the simulations, and convolving them in post-processing, we can explore the composition of our star particles through cosmic time, by using a variety of yield models for both Pop. III and Pop. II SNe.
Our pristine mass fraction scalar, , modeled the mass-fraction of gas with in each simulation cell. Star formation took place at much smaller scales than the best resolution of typical cosmological simulations. Modeling allowed us to follow the process of metal mixing at subgrid scales by quantifying the amount of pristine gas within each cell as a function time.
Most simulations instantaneously update cells’ average metallicity once they are contaminated with SN ejecta. However, mixing pollutants typically takes several Eddy turnover times (Pan & Scannapieco, 2010; Pan et al., 2013; Ritter et al., 2015). By tracking the evolution of , we can model the formation of Pop. III stars in areas of the simulation that would normally be considered polluted above ; in effect increasing the chemical resolution of the simulation. Our model for the pristine fraction is based on accepted theoretical models (Pan & Scannapieco, 2010) and has been calibrated against numerical simulations that model the dynamical time required to mix pollutants, due to SN stirring, in an astrophysical context (Pan et al., 2013).
As stellar particles are formed within a cell, they inherit , and , from the gas. This allowed us to calculate the fraction of stellar mass in a given star particle that represents metal-free stars, , as well as the relative contributions that metals from Pop. III and Pop. II stars make to the stars that are enriched,
The ejecta composition for Pop. II and Pop. III stars are indicated in Table 1. Properly accounting for turbulent mixing enables us to identify the Pop. III stars whose stellar yields (carbon rich ejecta) are different than Pop. II stars and are responsible for the formation of CEMP stars. We express the abundance ratios of a star compared to that of the Sun as
| (6) |
The solar abundance of Eu () is assumed to be 0.52 (Asplund et al., 2009) in the notation of where and are the number densities of element X and hydrogen, respectively. Likewise for carbon we adopt and for iron .
| Element | 1 Gy | 60 Pop. III SNe |
|---|---|---|
| C | 1.68 | 7.11 |
| Fe | 5.39 | 2.64 |
We note that subgrid turbulent mixing is only modeled for the metals and not the r-process ejecta. However, due to the high resolution of these simulations, we observe a negligible difference in metal enrichment due to the computation of subgrid turbulent mixing. Therefore, we assume the same holds for r-process material as it is treated as another scalar field similar to the metals in the code.
2.5. Modeling neutron star mergers
We have modeled the formation of DNSs to take place for a tiny fraction () of stellar particles chosen to go SNe. This corresponds to one DNS per of stars, that translates into a neutron star merger rate of at (van de Voort et al., 2015b).
The particle chosen to host a DNS first undergoes two CCSN explosions, corresponding to the two progenitor stars. Afterwards, the particle was assigned a delay time distribution drawn from a power law (e.g. Dominik et al., 2012; Mennekens & Vanbeveren, 2016) with minimum of 1, 10, or 100 Myr (for three separate simulations) and maximum of 10 Gyr respectively. Note that this time is after the formation of the second neutron star in the binary. Once the merger time has elapsed we simulated the generation of r-process elements via a third explosion with erg in our fiducial run, while we explored , and erg cases separately.
2.5.1 Europium yield
We set the fiducial value of the europium yield in the NSM events in our simulations based on the NS-NS merger detected by aLIGO/Virgo (GW170817). We adopted the estimated Eu yield of for each NS merger event in our simulation. This number reflects the lanthanide-rich material ejected in the post-merger accretion disk outflow in a NS-NS merger event with the maximum value of 0.04 (Cowperthwaite et al., 2017) multiplied by the abundances pattern of the solar r-process residuals (Côté et al., 2018b). The disk wind ejecta could be lanthanide-rich depending on the lifetime of the hyper-massive neutron star prior to collapsing into a black hole (Metzger & Fernández, 2014; Siegel & Metzger, 2017). We adopted this value since in order to answer the question of whether NSMs could by themselves explain the statistics of the r-process enhanced stars in the MW’s halo, one needs to be conservative in the assigned yields.
2.6. Simulation parametrizations
We carried out five different simulations in this paper. We name the simulations as TE, where stands for the minimum time for coalescence of the NSMs, and stands for the energy for the NSM event in cgs unit. For example T10E51 stands for the simulation with minimum time for the merging of the NSMs set to 10 Myr with erg . The dark matter particle mass resolution is , and our stellar particle mass is fixed to be . We stopped the simulation at . All the five simulations are summarized in Table 2.
| (Myr) | |||
|---|---|---|---|
| T1E51 | 1 | 8.2 | |
| T10E50 | 10 | 8.9 | |
| T10E51 | 10 | 8.9 | |
| T10E52 | 10 | 8.9 | |
| T100E51 | 100 | 8.9 |
3. Results

We start by showing the overall star formation history of our MW type galaxy and its corresponding metallicity evolution. The top panel of Figure 1 shows the comoving star formation rate density (SFRD) of T1E51 simulation that we ran down to redshift . The cyclic SFR trend with overall increase towards lower redshift is characteristics of all simulations while the exact level of the SFR can vary depending on the overdensity which is re-simulated at higher resolution (Xu et al., 2016). The improved DM mass resolution in the Renaissance simulation allows it to track star formation in smaller over densities at earlier times. Hence we see a higher SFRD at early times for the normal case as compared to simulations with lower DM mass resolution. The Renaissance simulation has a comoving resolution of 19 pc as compared to our resolution of 5 pc, however their DM particle mass is as compared to our .
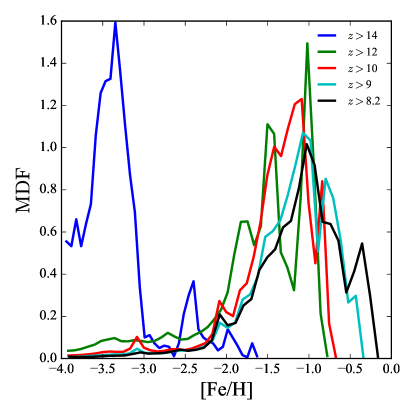
The bottom panel of Figure 1 shows the metallicity distribution function (MDF) for stars grouped based on their formation redshift. The MDF for stars formed at is shown in blue and those that are formed at shown in black. As expected the overall metallicity increases with time while the rate of change of the MDF slows down towards lower redshifts. These are all the stars in the simulation, not categorized per halo mass.
Figure 2 shows rendered images of the dark matter, hydrogen, r-process , and metals in the T10E51 simulation at . The fact that DNSs are born with delay time distributions causes some halos to be only enriched with metals and no r-process . We note that modeling DNSs’ kicks will pronounce this feature that we present in an upcoming work.

3.1. Formation of CEMP stars
Modern surveys of the Galactic halo, as well as UFDs, indicate that CEMP stars (defined as those with [C/Fe] and [Fe/H]) become more prevalent as overall metallicity decreases (Beers & Christlieb, 2005). In fact, these surveys indicate that the fraction of CEMP stars is as high as 25% for stars with (Komiya et al., 2007) and possibly as high as 40% for stars with (Lucatello et al., 2006). Hansen et al. (2016) found that only about 17% of all the CEMP-no stars (that display no enhancement to or r-process elements), exhibit binary orbits. Therefore, the dominant formation scenario of the CEMP stars is not through the mass transfer from a binary companion. Moreover, the discovery of damped Ly- systems with enhanced carbon: Cooke et al. (2011); Cooke et al. (2012) suggests that these stars are born in halos that are pre-enriched by carbon (Sharma et al., 2018).
Left panel of Figure 3 shows the distribution of the stars in plane. Each point is a star particle color coded given its age (i.e. the red shows the stars that formed at the highest redshift in the simulation). The adopted Fe and C yields from Pop. II and Pop. III SNe is listed in Table 1. Each star formation event traces a line with a negative slope in this plane. The oldest stars trace a line with more negative slope compared to the younger stars formed in the simulation. Since carbon is primarily generated from Pop. III stars, and Pop. III stars are formed in metal poor regions, naturally we see higher carbon enrichment towards lower metallicities. This is consistent with the observations of the CEMP stars where higher percentage of the stars show towards lower metallicities. The location of the stars in plane that defines a CEMP star is outlined with dashed blue line.
Right panel of Figure 3 shows the cumulative fraction of the MP stars that are CEMPs as a function of redshift. The black star indicates the observed cumulative ratio of (Lee et al., 2013) which is based on the SDSS/SEGUE data and consistent with other groups (Frebel et al., 2006; Carollo et al., 2011; Placco et al., 2014). The orange hexagon is the updated analysis from Yoon et al. (2018). We note that in this plot we have adopted for the definition for CEMP star to be consistent with the statistics presented in (Lee et al., 2013) and Yoon et al. (2018). The cumulative ratio of the CEMP stars to all the MP stars drops with redshift and reaches the observed ratio around .

3.2. Formation of metal poor r-process stars
Figure 4 shows the distribution of stars in in , , and planes in T10E51 at . Each data point indicates one star particle in the simulation and we show a random sample of 20% of all the stars in the simulation box. Each data point is color coded by the stellar age.
Close inspection of the distribution of stars in the plane shows that star formation events trace lines with different slopes, mostly from linear in the early times to vertical at later cosmic times. A horizontal line indicates a star formation event in a region where the gas has a dispersion in but europium is well mixed, while the opposite holds for a vertical line as we go to more metal rich stars. These are on average younger stars that have recently formed in halos enriched by iron. These halos are enough old for the iron to be well mixed, however, a recent NSM event explains the large dispersion along the axis. The correlation between and at high metallicities which are shown by young stars is an imprint of the fact that stars start to form in halos where there have been pre-enrichment by both SNe II and DNSs.
The middle panel of Figure 4 shows the distribution of the stars in plane. One can use the distribution of the stars in this plane to select CEMP-r stars. Each line traces one star formation event and as can be seen the lines have a positive slope, indicating that those stars that are carbon enriched, and therefore born in halos enriched with Pop. III ejecta, also show higher values. This is because Pop. III star formation results both in supernovae that eject large amounts of carbon into their surroundings, and DNSs that are strong sources of europium. This leads to the observed correlation for old stars. As can be seen, older stars are clustered towards the lower end of and do not show the strong correlation between and as is seen for the young stars. This is due to the fact that the metal production dominates over that of carbon in more massive halos, and in general as the formation of Pop III stars cease, the new stars in the halo are born with lower . In such systems, a single NSM event will leads to large dispersion along the axis, as is observed by how the old stellar particles are clustered towards the lower end of .
In the middle panel, we also show the 5 stars in the ultra-faint dwarf galaxy Reticulum II (Ji et al., 2016) that have measured abundances in both carbon and europium. The fact that there are practically no stars in our simulation that match Ret II abundances in both of these elements, potentially shows that the europium yield or NSM merger rate adopted as a fiducial value in our simulations needs to be boosted by a large factor. We return to this point in the next section.
The right panel of Figure 4 shows the distribution of the stellar particles in the plane. The location of the stars in this plane is used to define different category of metal poor r-process enhanced stars.
3.3. Comparison with observations of r-process enhanced metal poor stars
Metal poor stars encode a wealth of information about the conditions in the early universe when these stars were formed (Frebel & Norris, 2015). Such stars are divided into two categories, MP-rI and MP-rII , based on the r-process element abundance in their spectra. MP-rI stars are metal poor stars that show mild enhancement of r-process elements, namely and . MP-rII stars are defined as those with higher levels of r-process abundance, namely and . These two categories are outlined in the right panel of Figure 4. Based on the Hamburg/ESO r-process Enhanced Star survey (HERES; Barklem et al., 2005), out of 253 metal poor stars with , about 5% are MP-rII and another 15-20% are MP-rI stars. Separately, based on the SAGA database of stellar abundances, Abate et al. (2016) reported that out of 451 metal poor stars with Eu and Ba abundance, 26 (%) are found to belong to MP-rII class.
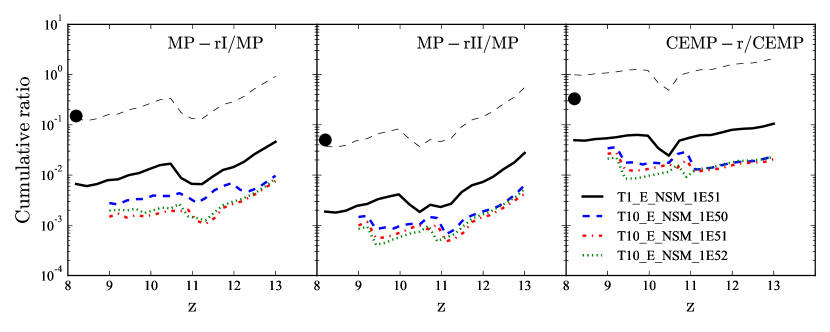
The left panel of Figure 5 shows the cumulative fraction of all the MP stars that are MP-rI . This is cumulative in the sense that it indicates the fraction of all the MP stars formed by redshift that belong to the MP-rI class. We show the results for T1E50 (solid-blue),T1E51 (dashed-green), T1E52 (dot-dashed red), and T1E51 in solid black respectively. T100E51 simulation results in zero MP-rI stars and is not shown in the plots. The black dot shows the ratio of MP-rI over MP stars from observations of the MW’s halo stars which is about 20% (Abate et al., 2016). Our simulations predict that the ratio is more than an order of magnitude below the level observed if the source of r-process is solely NSMs given the adopted rate of their formation and assigned r-process yield.
Our results should be thought of in the context of the imposed delay time distributions. When a minimum timescale of 1 Myr is considered for merging of the DNSs when they are formed, given the power law distribution, the median merging timescale of the DNSs is about 100 Myr. When the minimum timescale is changed to 0 or 10 Myr, the median timescale for merging changes from 3 to 300 Myr respectively. These median timescales matter in that they need to be compared to a typical phase of star formation that lasts in a given MW progenitor halo. Longer merging timescales relative to star formation timescale would lead to a NSM event that does not effectively enrich the medium such that r-process material gets recycled into the stars formed after the event. This is either because the star formation has ceased after the NSM event, or because a new phase of star formation occurs with a delay long enough to make the r-process material gets too diluted before getting recycled into the new stars. This is clearly shown in the simulation with a minimum merging timescale of 100 Myr, in that no MP-rI stars is born in that simulation.
The middle panel of Figure 5 shows the cumulative fraction of the MP stars that are categorized as MP-rII . The lines are the same as in the left panel. The ratio of MP-rII stars to MP stars predicted in the simulation is about an order of magnitude less than the observed level in the MW halo.
The right panel of Figure 5 shows the cumulative fraction of CEMP-r to all the CEMP stars. CEMP-r stars are defined as a subclass of CEMP stars with and , and there are a handful of theories regarding their formation (Abate et al., 2016). The location of this category of stars is outlined with dashed brown lines in the middle panel of Figure 4. Out of 56 CEMP stars with barium and europium abundances, Abate et al. (2016) found 5 to be CEMP-r stars and 26 to be CEMP-r /s stars. About a few percent of all the CEMP stars are CEMP-r in our simulation which is an order of magnitude less than the observed frequency of this class of stars.
The impact of the is understood in that lower energies tend to disperse the r-process material in a smaller volume and therefore the higher concentration of r-process leads to the formation of r-process enhanced stars. The impact of the is subdominant compared to the effect of the minimum time considered for the delay time distribution. Lower delay times (1 Myr, black line) leads to more NSM events in a halo, while large minimum times (as in T100E51 simulation) results in formation of no r-process enhanced stars.
In all three panels of Figure 5, the thin black dashed lines indicate an assumed NSM merger rate of or equivalently a europium yield of which matches the statistics of the r-process MP stars. This boosted NSM merger rate, however, overpredicts the same statistics for the CEMP star. The mismatch between what Eu yield is required to match the observations, either shows we need more robust statistical data for the CEMP stars, or the r-process MP stars have been enriched by a separate source in addition to the NSMs.
4. summary and discussion
While both core-collapse supernovae and neutron star mergers could explain the observed abundance of r-process elements in the Galaxy (Cowan et al., 1991; Woosley et al., 1994; Rosswog et al., 1999; Rosswog et al., 2000; Argast et al., 2004; Kuroda et al., 2008; Wanajo, 2013; Wehmeyer et al., 2015), only r-process production in NSMs has been measured directly, and therefore we model the production of r-process through NSMs.
We performed cosmological zoom simulations of a MW type halo with dark matter particle mass resolution that can resolve halos of mass with spatial resolution of pc. These high resolution zoom simulations are aimed at explaining the observed high frequency of r-process enriched stars in the MW’s halo. We assume that the only r-process sources are NSMs that are assigned delay time distribution drawn from a power law, as predicted in population synthesis codes (Dominik et al., 2012). We assign europium yield to the NSM events representative of assuming 0.04 wind ejecta with solar r-process pattern residual possible for GW170817 (Côté et al., 2018b).
We track the formation of MP and CEMP stars and their r-process enriched counterpart MP-rI , MP-rII and CEMP-r stars and we study the impact of two parameters in our study: (i) The minimum time scale for merging after the a DNS is formed, and (ii) the impact of on mixing the r-process material in a halo. Our simulations underpredict the observed ratio of r-process enhanced stars to their parent category by about an order of magnitude. We note that implementing the natal kicks would further reduce this enrichment level.
Our findings show that increasing the minimum timescale for merging of the DNSs results in a drop in the overall statistics of the r-process enhanced metal poor stars. This is due to the fact that a longer minimum timescale for merging of the DNSs leads to lower overall NSM events during a given timespan, while increasing the median merging timescale of the DNSs. For example, the median timescale for merging of DNSs is (3,100, 300) Myr if the minimum timescale is set to (0, 1, 10) Myr respectively. Similarly, the lower the energy of the NSM event, the r-process material experience less mixing in the halo and this actually leads to higher levels of r-process enhancement for the subsequent stars formed in the halo. The impact of the assumed is subdominant compared to the impact that the merging timescale has on the final level of r-process enrichment.
Given that with increasing the minimum time for merging from 1 Myr to 100 Myr, we are not able to form any MP-rI or CEMP-r stars, fast merging channels for the DNSs seems to be a requirement to make NSMs contribute modestly to r-process enrichment of the Galaxy at high redshifts.
In order to match the observed enrichment, we can think of two options: (i) adopting a higher Eu yield, and (ii) increasing the DNS birth rate. Regarding the first option, it is highly unlikely that higher Eu yields are possible from an NSM event. The adopted yield is estimated from GW170817 (Cowperthwaite et al., 2017; Côté et al., 2018b) with assuming a disk ejecta of mass . However, we note that in Naiman et al. (2018), the adopted yield is three times higher that what we have adopted in our study.
Regarding the second option, there is a large tension between the observed NS merger rates and the rates predicted from population synthesis models (Belczynski et al., 2017; Chruslinska et al., 2018). The value of one merger per of stars adopted in this work corresponds to MW rate of NSMs of (van de Voort et al., 2015b). This rate is on the assumption that the minimum time scale for merging of the binaries is 30 Myr and the final stellar mass of the MW is about . This rate corresponds to almost the maximum rate predicted in population synthesis models with various variations, and about an order of magnitude above the observational estimates based on galactic double pulsars (Kim et al., 2015). However, translating this rate into local rate, we would be similar to the LIGO/Virgo merger rate estimate of (Abbott et al., 2017a).
The NSM birth rate is subject to the details of the models implemented in the population synthesis codes (Belczynski et al., 2002; Belczynski et al., 2008; Dominik et al., 2012). In the standard model assumed in these models, which mostly concerns with the assumptions governing the common envelope (CE) phase during the formation of a compact binary system, we find that with the adopted Kroupa initial mass function (Kroupa & Weidner, 2003) the DNS birth rate is about 2.5 per of stellar mass modeled. However, this birth rate can be boosted by a factor of three in variation of their standard model (for example in variation 15 of Dominik et al., 2012), which translate into NSM birth rates of about 6 times of what we have assumed in this study. While increasing the r-process yield will not impact the star formation history of our galaxy and simply will shift the stellar particles up and down in or axis, we could not treat birth rates similar to the yields. Higher birth rates will affect the iron yield from the CCSN as their number density would be affected. In other words, while in our simulation there is one DNS born per 1000 CCSNe, changing that to one DNS per 100 CCSNe will significantly impact the metallicity trends in our halos.
Based on our results higher yields or higher birth rates with fast merging timescales are needed to match the observations of the MW halo’s metal poor r-process enhanced stars. Similar conclusions has been reached based on chemical evolution studies of the Galaxy (Côté et al., 2018a) and been suggested a second source of r-process is needed in order to explain the observed trends in MW’s disk. Moreover, the long delay between GW170817 and the star formation activity of its host galaxy, NGC 4993 (Levan et al., 2017), indicates that the merger rate at short delay times is different at high redshifts. Whether either of such choices would be consistent with the expected theoretical calculations of the r-process yield in NS merger events or the metallicity evolution at highest redshift remains to be explored. Upcoming data from the R-Process Alliance is projected to increase the detected number of MP-rII stars to 125, and over 500 new MP-rI stars in the next several years (Hansen et al., 2018; Sakari et al., 2018). Moreover, upcoming data on the frequency of CEMP-r stars from high-resolution observations of a sample of approximately 200 bright CEMP stars by Rasmussen et al. (in prep) is likely to provide a much improved estimate of the frequencies of CEMP subclasses.
5. Future work
We have not modeled the natal kicks of the DNSs in this work. However, their impact is expected to be significant specifically if natal kicks and delay times are not correlated for a DNS. DNSs are thought to be the precursors of the short gamma-ray bursts (sGRBs) and the location of sGRBs with respects to galaxies in the field can provide clues into the natal kick distribution of the DNSs. By studying host-less GRBs, Fong & Berger (2013) derived natal kick velocities in the range of 20-140 with a median value around 60.
From a theoretical perspective, population synthesis analysis of DNSs (Fryer et al., 1998) where binary systems with different initial masses for each star, initial eccentricity and orbital separation are simulated to merge and arrive at the outcome natal kick velocity after the second star goes off as a SNe. Such models arrive at natal kick distributions with an exponential profile and a median of (Behroozi et al., 2014). Safarzadeh & Côté (2017) studied the impact of DNS’s natal kick on the Galactic r-process enrichment and concluded that almost 50% of all the NSMs that have occurred in the star formation history of a MW type system do not contribute to the r-process enrichment as the DNSs merge well outside the galaxy’s effective radius.
For systems with shallow potential wells such as the Ultra Faint Dwarfs (UFDs, with halo mass of ; Simon et al., 2011), and their progenitors at high redshifts (Safarzadeh et al., 2018) small natal kicks on the order of 10-20 can make DNS escape their hosts (Kelley et al., 2010; Safarzadeh & Côté, 2017). This can severely impact the level of enrichment of the halos and should leave a clear mark on CEMP-r /CEMP ratio specifically since CEMP stars only formed early on before the halo is heavily enriched with metals, and would be almost impossible to make CEMP-r stars if the DNSs escape their host halo.
Another avenue to improve on the present work would be to model the -process enrichment of the stars so that comparisons could be made with the statistics of the CEMP- stars in the MW. For that we would need to model the formation of the AGB stars (Sharma et al., 2018). This work could be expanded to a whole suite of MW type halos in large simulations such as Auriga (Grand et al., 2017) and Caterpillar suite of simulations (Griffen et al., 2016) to achieve a reliable halo-to-halo scatter.
6. Acknowledgements
We are thankful to the referee for useful comments. We are also thankful to Enrico Ramirez-Ruiz, Tim Beers, Brian Metzger, Jeff Andrews, Daniel Siegel, and Tassos Fragos for valuable discussions. This work was supported in by the National Science Foundation under Grants AST-1715876 & PHY-1430152 (the Joint Institute for Nuclear Astrophysics - Center for the Evolution of the Elements), and NASA theory grant NNX15AK82G. We thank the Texas Advanced Computing Center (TACC) and the Extreme Science and Engineering Discovery Environment (XSEDE) for providing HPC resources.
References
- Abate et al. (2016) Abate C., Stancliffe R. J., Liu Z.-W., 2016, Astronomy & Astrophysics, 587, A50
- Abbott et al. (2017a) Abbott et al. B. P., 2017a, arXiv.org, p. 161101
- Abbott et al. (2017b) Abbott B. P., et al., 2017b, The Astrophysical Journal, 848, L12
- Abbott et al. (2017c) Abbott B. P., et al., 2017c, The Astrophysical Journal, 850, L39
- Argast et al. (2004) Argast D., Samland M., Thielemann F. K., Qian Y. Z., 2004, Astronomy & Astrophysics, 416, 997
- Asplund et al. (2009) Asplund M., Grevesse N., Sauval A. J., Scott P., 2009, Annual Review of Astronomy and Astrophysics, 47, 481
- Barai & de Gouveia Dal Pino (2018) Barai P., de Gouveia Dal Pino E. M., 2018, eprint arXiv:1807.04768
- Barklem et al. (2005) Barklem P. S., et al., 2005, Astronomy & Astrophysics, 439, 129
- Beers & Christlieb (2005) Beers T. C., Christlieb N., 2005, Annual Review of Astronomy and Astrophysics, 43, 531
- Behroozi et al. (2014) Behroozi P. S., Ramirez-Ruiz E., Fryer C. L., 2014, The Astrophysical Journal, 792, 123
- Belczynski et al. (2002) Belczynski K., Kalogera V., Bulik T., 2002, The Astrophysical Journal, 572, 407
- Belczynski et al. (2008) Belczynski K., Kalogera V., Rasio F. A., Taam R. E., Zezas A., Bulik T., Maccarone T. J., Ivanova N., 2008, The Astrophysical Journal Supplement Series, 174, 223
- Belczynski et al. (2017) Belczynski K., et al., 2017, arXiv.org, p. arXiv:1712.00632
- Carollo et al. (2011) Carollo D., et al., 2011, The Astrophysical Journal, 744, 195
- Chruslinska et al. (2018) Chruslinska M., Belczynski K., Klencki J., Benacquista M., 2018, Monthly Notices of the Royal Astronomical Society, 474, 2937
- Cooke et al. (2011) Cooke R., Pettini M., Steidel C. C., Rudie G. C., Nissen P. E., 2011, Monthly Notices of the Royal Astronomical Society, 417, 1534
- Cooke et al. (2012) Cooke R., Pettini M., Murphy M. T., 2012, Monthly Notices of the Royal Astronomical Society, 425, 347
- Côté et al. (2018a) Côté B., et al., 2018a, eprint arXiv:1809.03525
- Côté et al. (2018b) Côté B., et al., 2018b, The Astrophysical Journal, 855, 99
- Coulter et al. (2017) Coulter D. A., et al., 2017, Science, 358, 1556
- Cowan et al. (1991) Cowan J. J., Thielemann F.-K., Truran J. W., 1991, Physics Reports, 208, 267
- Cowperthwaite et al. (2017) Cowperthwaite P. S., et al., 2017, The Astrophysical Journal, 848, L17
- Croton et al. (2006) Croton D. J., et al., 2006, Monthly Notices of the Royal Astronomical Society, 365, 11
- Dominik et al. (2012) Dominik M., Belczynski K., Fryer C., Holz D. E., Berti E., Bulik T., Mandel I., O’Shaughnessy R., 2012, The Astrophysical Journal, 759, 52
- Dubois & Teyssier (2008) Dubois Y., Teyssier R., 2008, Astronomy & Astrophysics, 477, 79
- Eisenstein & Hut (1998) Eisenstein D. J., Hut P., 1998, The Astrophysical Journal, 498, 137
- Ferland et al. (1998) Ferland G. J., Korista K. T., Verner D. A., Ferguson J. W., Kingdon J. B., Verner E. M., 1998, Publications of the Astronomical Society of the Pacific, 110, 761
- Finkelstein (2016) Finkelstein S. L., 2016, Publications of the Astronomical Society of Australia, 33, 477
- Fong & Berger (2013) Fong W., Berger E., 2013, The Astrophysical Journal, 776, 18
- Frebel & Norris (2015) Frebel A., Norris J. E., 2015, Annual Review of Astronomy and Astrophysics, 53, 631
- Frebel et al. (2006) Frebel A., et al., 2006, The Astrophysical Journal, 652, 1585
- Fryer et al. (1998) Fryer C., Burrows A., Benz W., 1998, The Astrophysical Journal, 496, 333
- Grand et al. (2017) Grand R. J. J., et al., 2017, Monthly Notices of the Royal Astronomical Society, p. stx071
- Greif & Bromm (2006) Greif T. H., Bromm V., 2006, Monthly Notices of the Royal Astronomical Society, 373, 128
- Griffen et al. (2016) Griffen B. F., Ji A. P., Dooley G. A., Gómez F. A., Vogelsberger M., O’Shea B. W., Frebel A., 2016, The Astrophysical Journal, 818, 10
- Haardt & Madau (1996) Haardt F., Madau P., 1996, The Astrophysical Journal, 461, 20
- Hahn & Abel (2011) Hahn O., Abel T., 2011, Monthly Notices of the Royal Astronomical Society, 415, 2101
- Hansen et al. (2016) Hansen T. T., Andersen J., Nordström B., Beers T. C., Placco V. M., Yoon J., Buchhave L. A., 2016, Astronomy & Astrophysics, 586, A160
- Hansen et al. (2018) Hansen T. T., et al., 2018, ApJ, 858, 92
- Heger & Woosley (2002) Heger A., Woosley S. E., 2002, The Astrophysical Journal, 567, 532
- Ishigaki et al. (2014) Ishigaki M. N., Tominaga N., Kobayashi C., Nomoto K., 2014, The Astrophysical Journal, 792, L32
- Ji et al. (2016) Ji A. P., Frebel A., Simon J. D., Chiti A., 2016, The Astrophysical Journal, 830, 93
- Johnson et al. (2012) Johnson J. L., Dalla Vecchia C., Khochfar S., 2012, Monthly Notices of the Royal Astronomical Society, 428, 1857
- Kasen et al. (2017) Kasen D., Metzger B., Barnes J., Quataert E., Ramirez-Ruiz E., 2017, Nature, 551, 80
- Kelley et al. (2010) Kelley L. Z., Ramirez-Ruiz E., Zemp M., Diemand J., Mandel I., 2010, The Astrophysical Journal Letters, 725, L91
- Kim et al. (2015) Kim C., Perera B. B. P., McLaughlin M. A., 2015, Monthly Notices of the Royal Astronomical Society, 448, 928
- Komiya et al. (2007) Komiya Y., Suda T., Minaguchi H., Shigeyama T., Aoki W., Fujimoto M. Y., 2007, The Astrophysical Journal, 658, 367
- Kroupa & Weidner (2003) Kroupa P., Weidner C., 2003, The Astrophysical Journal, 598, 1076
- Krumholz & Tan (2007) Krumholz M. R., Tan J. C., 2007, The Astrophysical Journal, 654, 304
- Kuroda et al. (2008) Kuroda T., Wanajo S., Nomoto K., 2008, The Astrophysical Journal, 672, 1068
- Lee et al. (2013) Lee Y. S., et al., 2013, The Astronomical Journal, 146, 132
- Levan et al. (2017) Levan A. J., et al., 2017, The Astrophysical Journal, 848, L28
- Lucatello et al. (2006) Lucatello S., Beers T. C., Christlieb N., Barklem P. S., Rossi S., Marsteller B., Sivarani T., Lee Y. S., 2006, The Astrophysical Journal, 652, L37
- Madau & Dickinson (2014) Madau P., Dickinson M., 2014, Annual Review of Astronomy and Astrophysics, 52, 415
- Martin et al. (1996) Martin P. G., Schwarz D. H., Mandy M. E., 1996, The Astrophysical Journal, 461, 265
- Mennekens & Vanbeveren (2016) Mennekens N., Vanbeveren D., 2016, Astronomy & Astrophysics, 589, A64
- Metzger & Fernández (2014) Metzger B. D., Fernández R., 2014, Monthly Notices of the Royal Astronomical Society, 441, 3444
- Naiman et al. (2018) Naiman J. P., et al., 2018, Monthly Notices of the Royal Astronomical Society
- Pan & Scannapieco (2010) Pan L., Scannapieco E., 2010, The Astrophysical Journal, 721, 1765
- Pan et al. (2013) Pan L., Scannapieco E., Scalo J., 2013, The Astrophysical Journal, 775, 111
- Placco et al. (2014) Placco V. M., Frebel A., Beers T. C., Stancliffe R. J., 2014, The Astrophysical Journal, 797, 21
- Planck Collaboration et al. (2016) Planck Collaboration P., et al., 2016, Astronomy & Astrophysics, 594, A13
- Ramirez-Ruiz et al. (2015) Ramirez-Ruiz E., Trenti M., MacLeod M., Roberts L. F., Lee W. H., Saladino-Rosas M. I., 2015, The Astrophysical Journal Letters, 802, L22
- Raskin et al. (2009) Raskin C., Scannapieco E., Rhoads J., Della Valle M., 2009, The Astrophysical Journal, 707, 74
- Reed et al. (2005) Reed D. S., Bower R., Frenk C. S., Gao L., Jenkins A., Theuns T., White S. D. M., 2005, Monthly Notices of the Royal Astronomical Society, 363, 393
- Ritter et al. (2015) Ritter J. S., Sluder A., Safranek-Shrader C., Milosavljević M., Bromm V., 2015, Monthly Notices of the Royal Astronomical Society, 451, 5708
- Rosen & Bregman (1995) Rosen A., Bregman J. N., 1995, The Astrophysical Journal, 440, 634
- Rosswog et al. (1999) Rosswog S., Liebendörfer M., Thielemann F. K., Davies M. B., Benz W., Piran T., 1999, Astronomy & Astrophysics, 341, 499
- Rosswog et al. (2000) Rosswog S., Davies M. B., Thielemann F. K., Piran T., 2000, MNRAS, 360, 171
- Safarzadeh & Côté (2017) Safarzadeh M., Côté B., 2017, Monthly Notices of the Royal Astronomical Society, 471, 4488
- Safarzadeh & Scannapieco (2017) Safarzadeh M., Scannapieco E., 2017, Monthly Notices of the Royal Astronomical Society, 471, 2088
- Safarzadeh et al. (2018) Safarzadeh M., Ji A. P., Dooley G. A., Frebel A., Scannapieco E., Gómez F. A., O’Shea B. W., 2018, Monthly Notices of the Royal Astronomical Society, 476, 5006
- Sakari et al. (2018) Sakari C. M., et al., 2018, ApJ, 868, 110
- Sarmento et al. (2017) Sarmento R., Scannapieco E., Pan L., 2017, The Astrophysical Journal, 834, 23
- Scannapieco & Oh (2004) Scannapieco E., Oh S. P., 2004, The Astrophysical Journal, 608, 62
- Scannapieco et al. (2005) Scannapieco E., Silk J., Bouwens R., 2005, The Astrophysical Journal, 635, L13
- Sharma et al. (2018) Sharma M., Theuns T., Frenk C. S., Cooke R. J., 2018, Monthly Notices of the Royal Astronomical Society, 473, 984
- Shen et al. (2015) Shen S., Cooke R. J., Ramirez-Ruiz E., Madau P., Mayer L., Guedes J., 2015, The Astrophysical Journal, 807, 115
- Siegel & Metzger (2017) Siegel D. M., Metzger B. D., 2017, Physical Review Letters, 119, 143
- Sijacki et al. (2007) Sijacki D., Springel V., Di Matteo T., Hernquist L., 2007, Monthly Notices of the Royal Astronomical Society, 380, 877
- Simon et al. (2011) Simon J. D., et al., 2011, The Astrophysical Journal, 733, 46
- Teyssier (2002) Teyssier R., 2002, Astronomy & Astrophysics, 385, 337
- Toro et al. (1994) Toro E. F., Spruce M., Speares W., 1994, Shock Waves, 4, 25
- Umeda & Nomoto (2003) Umeda H., Nomoto K., 2003, Nature, 422, 871
- Wanajo (2013) Wanajo S., 2013, The Astrophysical Journal, 770, L22
- Wehmeyer et al. (2015) Wehmeyer B., Pignatari M., Thielemann F. K., 2015, Monthly Notices of the Royal Astronomical Society, 452, 1970
- Woosley et al. (1994) Woosley S. E., Wilson J. R., Mathews G. J., Hoffman R. D., Meyer B. S., 1994, Astrophysical Journal, 433, 229
- Xu et al. (2016) Xu H., Wise J. H., Norman M. L., Ahn K., O’Shea B. W., 2016, The Astrophysical Journal, 833, 84
- Yoon et al. (2018) Yoon J., et al., 2018, The Astrophysical Journal, 861, 146
- van de Voort et al. (2015a) van de Voort F., Quataert E., Hopkins P. F., Kereš D., Faucher-Giguère C.-A., 2015a, Monthly Notices of the Royal Astronomical Society, 447, 140
- van de Voort et al. (2015b) van de Voort F., Quataert E., Hopkins P. F., Kereš D., Faucher-Giguère C.-A., 2015b, Monthly Notices of the Royal Astronomical Society, 447, 140