Multi-Band Petahertz Currents Resolved via High Harmonic Generation Spectroscopy
Strong field driven electric currents in condensed matter systems open new frontiers in petahertz electronics. In this regime new challenges arise as the role of the band structure and the quantum nature of electron-hole dynamics have yet to be resolved. Here we reveal the underlying attosecond dynamics that dictates the temporal evolution of carriers in multi-band solid state systems, via high harmonic generation (HHG) spectroscopy. We demonstrate that when the electron-hole relative velocity approaches zero, enhanced quantum interference leads to the appearance of spectral caustics in the HHG spectrum. Introducing the role of the dynamical joint density of states (JDOS) we identify its direct mapping into the spectrum, exhibiting singularities at the spectral caustics. By probing these singularities, we visualize the structure of multiple unpopulated high conduction bands. Our results open a new path in the control and study of attosecond quasi-particle interactions within the field dressed band structure of crystals.
Induced by the strong field interaction, HHG provides a unique spectroscopic scheme to visualize the coherent evolution of petahertz currents inside solids. Since the first observation [1], solid HHG opened a door into the study of the electronic structure and dynamics in crystals [2, 3, 4, 5, 6, 7], multiple band dynamics [8, 9, 10, 11] and complex many-body phenomena [12] in crystalline and amorphous systems [9]. For a moderate field strength the electron-hole dynamics are often described semi-classicaly by a single valence and conduction band of the crystal. As we approach the strong field regime, new fundamental questions arise. What is the role of the band structure in such intense, ultrafast processes? How will electrons and holes interact on extremely short time scales, when they are still mutually quantum coherent? These questions pose some of the primary challenges in the emerging field of strong field interactions in solids.
In this paper we identify the quantum nature of the electron-hole wave-packet in solids, probing its strong-field attosecond dynamics over multiple bands. We observe enhanced quantum interference in the vicinity of Van Hove singularities [13, 14] and resolve the direct link between the dynamical JDOS and the HHG spectrum. Our study applies HHG spectroscopy in MgO, induced by a driving laser field. Adding a weak perturbative second harmonic (SH) field modulates the internal dynamics, in a close analogy to a lock-in measurement. This scheme allows us to isolate extremely weak signals and identify the contribution of multiple band excitations, covering a spectral range of up to 30 eV. Our results show unequivocally that the internal dynamics related to HHG are dominated by the interband emission [1, 3, 4, 7, 15, 16, 17, 18, 19, 20, 21], which remains the dominant mechanism even when higher conduction bands are involved. We identify the mapping between the dynamical JDOS at unique regions in the Brillouin zone (BZ) and the HHG spectrum. At Van Hove singularities, spectral caustics are induced, leading to a strong enhancement of the HHG signal. At these critical points, the semi-classical picture fails [22], imprinting the dynamical quantum nature of the strong field interaction on the HHG spectrum.
The interband HHG mechanism can be viewed as a generalized electron-hole recollision process [15, 19], described by a semi-classical analysis [22]. Around the peak of the laser field, an electron tunnels from the valence to the conduction band, forming an electron-hole pair. The laser field subsequently accelerates the pair, leading to their recombination and the emission of XUV radiation. This recollision model maps the semi-classical electron-hole trajectories into harmonic energies. The semi-classical analysis is not strictly limited to one conduction band – the strong laser field may excite the electron into higher bands, leading to the generation of complex spectral features in the HHG spectrum [8, 9, 10].
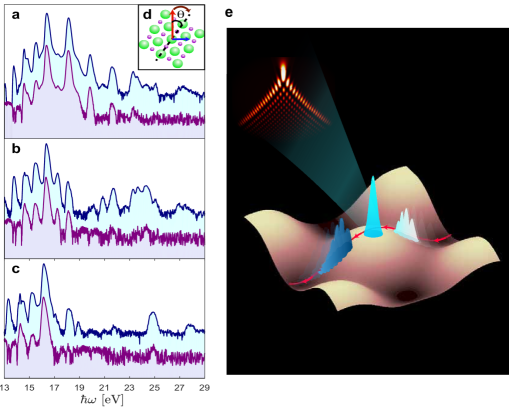
A fundamental aspect of strong-field induced tunneling is the localization of the excited electron-hole wave-packet in the BZ around the minimum band gap. As the wave-packet evolves under the influence of the laser field, it dynamically probes a narrow stripe of the BZ along the field’s polarization, as illustrated in figure 1e. Such localization is a key property of HHG spectroscopy – enabling the visualization of the band structure with unique angular resolution.
Resolving the angular dependence of the HHG spectrum is extremely challenging – the HHG signal drops rapidly when the polarization is rotated off the main axes of the MgO crystal [23]. Such suppression becomes even more significant when the harmonics are produced from higher conduction bands [24]. In order to fully reveal the electron-hole dynamics, both its angular dependence as well as the contribution of multiple bands, we introduce an advanced measurement scheme that enables us to resolve and isolate the weak HHG signals.
Enhancing the detectability of weak signals by subjecting them to a known temporal modulation is a common practice in a wide range of applications, also known as lock-in measurement. We induce such a modulation by adding a weak SH field polarized perpendicular to the fundamental field’s polarization. So far this scheme has been applied to probe the internal dynamics in gas phase HHG [25] (and references within) and interband currents in ZnO [15]. Scanning the two-color delay leads to a periodic modulation of the HHG spectrum with four times the fundamental laser’s frequency. Fourier analysis isolates the oscillating component, resolving the extremely weak HHG signals, buried in a large experimental background. In addition, XUV emission from higher conduction bands can be highly susceptible to the two-color delay [26], resulting in an enhanced signature in the oscillating component. Figures 1a, 1b and 1c compare the Fourier amplitudes of the modulated HHG signals and the spectra averaged over the two color delay for crystal orientations of , and , respectively (see figure 1d). Clearly, the averaged spectrum is accompanied by large background noise and is dominated by harmonic 17 (16.2 eV) for and and harmonics 17 and 19 (18.1 eV) for . Resolving the oscillating spectrum by Fourier analysis shows a dramatic enhancement of the signal over the noise. This measurement exhibits the appearance of new spectral components, which were so far hidden in the averaged spectrum.
The oscillating spectra reveal that for all crystal angles, the spectrum extends beyond the first band edge (18 eV), indicating the strong contribution of higher conduction bands. The most important observation is associated with the angular dependence of the measurement – the oscillating spectrum varies drastically and surprisingly for different angles exhibiting enhanced features and structures over a wide spectral range. We identify three distinct structures: enhanced harmonics around 16-17 eV extending to 18 eV at , an increased signal in the 20.5-22.5 eV region at and a clear spectral feature at 23.5-26 eV, narrowing at . These features can not be associated with the spectral response of the dipole coupling between the bands, due to their moderate variation with energy (see SI). What is the origin of the enhancement mechanism in these spectral regions and what information does it provide?
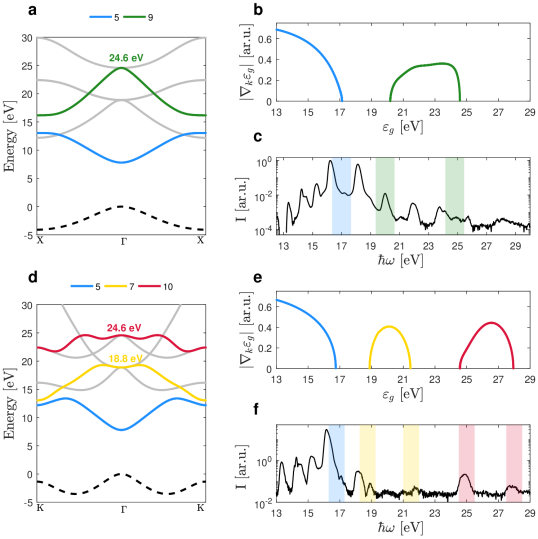
We start by analyzing the enhancement at 23.5-26 eV. This observation is striking – clearly, this spectral region originates from a high conduction band excitation associated with a low population transfer. Furthermore, while the oscillating spectrum changes dramatically with the crystal orientation, this feature remains robust. Such observation suggests that it originates from areas of the BZ which are orientation independent. These areas can be found around the point of the BZ which is common to all crystal orientations. Figures 2a and 2b describe the band structure for crystal orientations of and , respectively. Indeed, we find two high conduction bands intersecting the point at an energy of 24.57 eV. At the point these bands, as well as any band, have a critical point, , such that the gradient of the energy gap is zero as well:
| (1) |
where k is the lattice momentum, is the conduction band and is the valence band. At the critical points, where , the JDOS of a crystalline solid becomes singular. These singularities are known as Van Hove singularities and most commonly arise in the analysis of optical absorption and reflection spectra [27, 28]. In contrast to these measurements, performed over long time scales, HHG in bulk crystal is attributed to the sub-cycle electronic dynamics where the electron and hole wave-packets remain mutually coherent. In addition, these wave-packets, which are initiated by tunneling, are localized in the BZ. As a result, the harmonic emission can not be understood by merely counting the total number of available states throughout the BZ. Instead, the quantum nature of the singularity has to be considered at specific k regions. During such short time scales, we can view the singularities as points where the relative velocity of the electron and hole wave-packets is zero. This results in enhanced interference effects, encoding dynamical quantum information into the HHG spectrum.
| (2) | |||
| (3) |
where A is the vector potential and the harmonic energy. represents the slowly varying term compared to the fast oscillating exponential containing the semi-classical action, . Under these conditions we can use the stationary phase approximation (SPA) for which defines the semi-classical mapping between harmonic energy and recolliding electron and hole trajectories. The interband current for a single stationary solution as obtained from the SPA, is proportional to , where is the Hessian matrix of the function S(k,t’,t) at the stationary points. This derivation directly links the HHG spectrum and the band structure (for a detailed derivation see SI):
| (4) |
where is the energy difference between electron and hole at the time of recollision, which defines the harmonic energy, and accounts for all pre-exponential terms. The expression for the spectral intensity strongly resembles that of the JDOS, except it is weighted by the exponent of the semi-classical action, therefore, it is associated with a dynamical JDOS. This exponent gives the quantum phase and amplitude associated with each trajectory. Due to strong field tunneling, the quantum amplitude strongly attenuates with increasing , being the component of perpendicular to the laser’s polarization. Such attenuation expresses the fact that HHG indeed originates from a narrow stripe of the BZ, providing the significant angular dependence of the spectrum. Clearly this mapping becomes singular at the extrema of the energy gap as described by equation (1).
The singularity in the mapping between harmonic energy and electron-hole trajectories can be described within the framework of caustics [29]. Caustics are universal phenomena in nature that link processes observed in many different branches of physics. Previous studies identified the appearance of caustics in gas phase HHG [29, 30], where they reveal the quantum nature of the process in a regime where classical analysis fails. Figure 1e illustrates the origin of spectral caustics in condensed matter systems, when the electron-hole wave-packet has zero relative velocity at the extrema of the band gap. We find that spectral caustics reveal the rich, quantum, spatio-temporal nature of electronic dynamics in solids, dictated by the direct link between the band structure and strong field interaction.
The enhancement at 23.5-26 eV can be identified as a spectral caustic originating from the point. Figures 2a, 2d present the band structure for crystal orientations of and , respectively. Another energy band intersecting the point can be found at 18.8 eV (figure 2d), leading to a robust spectral feature near 18 eV as can be seen in figures 1a-c. While the crossing of energy bands at the point will always result in singularities, spectral caustics can be found at other points in the BZ as well. Along the high symmetry axes of the crystal, and , each band-gap consists of several critical points where . In figure 2 we show how these points are directly imprinted in the experimentally resolved HHG spectrum. Figures 2b, 2e describe the gradient of each band gap as a function of the band gap energy, for crystal orientations of and , respectively. Figures 2c, 2f present the measured oscillating spectra at these angles. The highlighted lines in figures 2c, 2f emphasize the energy points where the gradient is zero and the dynamical JDOS becomes singular according to equation (4) . Indeed, caustics dominate the brightest features in the HHG spectrum, leading to a dramatic spectral focusing and enhancement of the weak signal associated with higher conduction bands excitation.
While the singularities are observed along the high symmetry axes of the crystal, figure 3a shows that enhanced spectral features are observed at other angles as well . Their origin can be understood through the dynamical JDOS, by looking at the gradient of the different band gaps, . Figures 3b and 3c present 2D images of the gradients of bands 5 and 7. In both bands we can identify a pronounced valley at specific k values and across a large angular range. Along these valleys is small, leading, according to equation (4) to a local spectral enhancement in the HHG signal. Specifically, the gradient valley at band 5 is mapped to a pronounced spectral enhancement around 16-17 eV, while the valley in band 7 leads to the enhanced spectral feature in the 20.5-22.5 eV region, marked by the violet and cyan areas, respectively. Importantly, their observation is robust with the crystal orientation, mapping the angular variation of the gradient valleys.
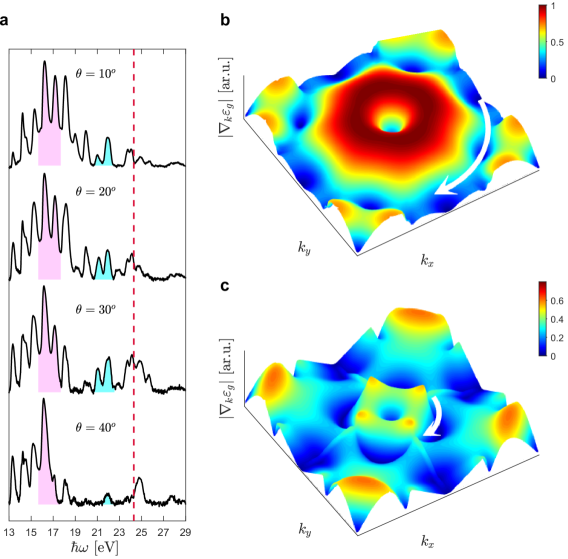
Understanding the mapping between the band structure and the HHG spectrum allows us to study the fundamental dynamical properties of strong field dressed phenomena in solids [11, 31]. Such effects play an important role when the band structure becomes degenerate. In the vicinity of these regions the intricate interplay between the strong field dressing and the orientation dependent band couplings can have a dramatic effect on the electronic dynamics. At the point of MgO there is a two band degeneracy at 24.6 eV (bands 9 and 10, plotted in green and in red), protected by the crystal symmetries. Taking a closer look at the associated caustic we find that our measurement encodes a signature of such a strong field mechanism. The enhancement observed at the high energy end of the spectrum, 23.5-26 eV, is robust with crystal orientation, as one would expect from a feature originating from the point. However, the spectral shape of this feature shows a striking angular dependence, where the peak shifts from harmonic 25 at to 26 at , exhibiting complex spectral structures at intermediate angles (see dashed line in figure 3a). By rotating the crystal we change the couplings and field dressing of these two bands, imprinting the intricate underlying strong field dynamics into the angular dependence of the HHG spectrum.
Our results establish the fundamental connection between the electronic structure of the crystal and the strong field process. This study reveals how strong field attosecond metrology serves as an extremely sensitive probe of ultrafast dynamical quantum interference between electron-hole wave-packets in solids. We identify the important role of the dynamical JDOS, dictated by the strong field nature of the interaction. As the dynamical JDOS becomes singular, the trajectory picture that governs the interband HHG process fails, giving rise to spectral caustics. These findings provide a unique insight into the dressing of the band structure by the strong laser field. The mapping between the HHG spectrum and the band gaps serves as unequivocal evidence to the dominant role of interband emission over numerous conduction bands. Looking forward, our study will form the framework for a large range of attosecond scale phenomena, opening a new path in the study of quasi-particle interactions within the field dressed band structure of crystals. It will allow the study of ultrafast dynamics such as electron-hole interactions, leading to the formation of excitons, or electron-electron-phonon interactions. Furthermore, the control over sub-cycle electronic currents will play a role in the establishment of compact solid state XUV sources, as well as in the field of petahertz electronics.
Data Avilability
The data that support the findings of this study are available from the corresponding author upon reasonable request.
References
- [1] Ghimire, S. et al. Observation of high-order harmonic generation in a bulk crystal. Nature physics 7, 138 (2011).
- [2] Vampa, G. et al. All-optical reconstruction of crystal band structure. Physical review letters 115, 193603 (2015).
- [3] Luu, T. T. et al. Extreme ultraviolet high-harmonic spectroscopy of solids. Nature 521, 498 (2015).
- [4] Garg, M. et al. Multi-petahertz electronic metrology. Nature 538, 359 (2016).
- [5] Liu, H. et al. High-harmonic generation from an atomically thin semiconductor. Nature Physics 13, 262 (2017).
- [6] Yoshikawa, N., Tamaya, T. & Tanaka, K. High-harmonic generation in graphene enhanced by elliptically polarized light excitation. Science 356, 736–738 (2017).
- [7] Hohenleutner, M. et al. Real-time observation of interfering crystal electrons in high-harmonic generation. Nature 523, 572 (2015).
- [8] Ndabashimiye, G. et al. Solid-state harmonics beyond the atomic limit. Nature 534, 520 (2016).
- [9] You, Y. S. et al. High-harmonic generation in amorphous solids. Nature communications 8, 724 (2017).
- [10] You, Y. S. et al. Laser waveform control of extreme ultraviolet high harmonics from solids. Optics letters 42, 1816–1819 (2017).
- [11] Hawkins, P. G., Ivanov, M. Y. & Yakovlev, V. S. Effect of multiple conduction bands on high-harmonic emission from dielectrics. Physical Review A 91, 013405 (2015).
- [12] Silva, R., Blinov, I. V., Rubtsov, A. N., Smirnova, O. & Ivanov, M. High-harmonic spectroscopy of ultrafast many-body dynamics in strongly correlated systems. Nature Photonics 1 (2018).
- [13] Ashcroft, N. W. & Mermin, N. D. Solid state physics (holt, rinehart and winston, new york, 1976) 144–145.
- [14] Van Hove, L. The occurrence of singularities in the elastic frequency distribution of a crystal. Physical Review 89, 1189 (1953).
- [15] Vampa, G. et al. Linking high harmonics from gases and solids. Nature 522, 462 (2015).
- [16] Schubert, O. et al. Sub-cycle control of terahertz high-harmonic generation by dynamical bloch oscillations. Nature Photonics 8, 119 (2014).
- [17] Kemper, A., Moritz, B., Freericks, J. & Devereaux, T. Theoretical description of high-order harmonic generation in solids. New Journal of Physics 15, 023003 (2013).
- [18] Higuchi, T., Stockman, M. I. & Hommelhoff, P. Strong-field perspective on high-harmonic radiation from bulk solids. Physical review letters 113, 213901 (2014).
- [19] Vampa, G. et al. Theoretical analysis of high-harmonic generation in solids. Physical review letters 113, 073901 (2014).
- [20] Golde, D., Meier, T. & Koch, S. High harmonics generated in semiconductor nanostructures by the coupled dynamics of optical inter-and intraband excitations. Physical Review B 77, 075330 (2008).
- [21] Tancogne-Dejean, N., Mücke, O. D., Kärtner, F. X. & Rubio, A. Impact of the electronic band structure in high-harmonic generation spectra of solids. Physical review letters 118, 087403 (2017).
- [22] Vampa, G., McDonald, C., Orlando, G., Corkum, P. & Brabec, T. Semiclassical analysis of high harmonic generation in bulk crystals. Physical Review B 91, 064302 (2015).
- [23] You, Y. S., Reis, D. A. & Ghimire, S. Anisotropic high-harmonic generation in bulk crystals. Nature Physics 13, 345 (2017).
- [24] Wu, M. et al. Orientation dependence of temporal and spectral properties of high-order harmonics in solids. Physical Review A 96, 063412 (2017).
- [25] Bruner, B. D. et al. Multidimensional high harmonic spectroscopy. Journal of Physics B: Atomic, Molecular and Optical Physics 48, 174006 (2015).
- [26] Li, J.-B. et al. Enhancement of the second plateau in solid high-order harmonic spectra by the two-color fields. Optics Express 25, 18603–18613 (2017).
- [27] Ehrenreich, H. & Philipp, H. Optical properties of ag and cu. Physical Review 128, 1622 (1962).
- [28] Roessler, D. & Walker, W. Electronic spectrum and ultraviolet optical properties of crystalline mgo. Physical Review 159, 733 (1967).
- [29] Raz, O., Pedatzur, O., Bruner, B. D. & Dudovich, N. Spectral caustics in attosecond science. Nature Photonics 6, 170 (2012).
- [30] Faccialà, D. et al. Probe of multielectron dynamics in xenon by caustics in high-order harmonic generation. Physical review letters 117, 093902 (2016).
- [31] McDonald, C., Vampa, G., Corkum, P. & Brabec, T. Intense-laser solid state physics: unraveling the difference between semiconductors and dielectrics. Physical review letters 118, 173601 (2017).