Precise measurements of CP violation in B decays at Belle II
Abstract:
We report expected sensitivities for the measurement of the three angles of the Unitarity Triangle in meson decays using 50 ab-1 of collisions recorded by the Belle II detector at the SuperKEKB asymmetric collider at KEK, Japan.
1 Introduction
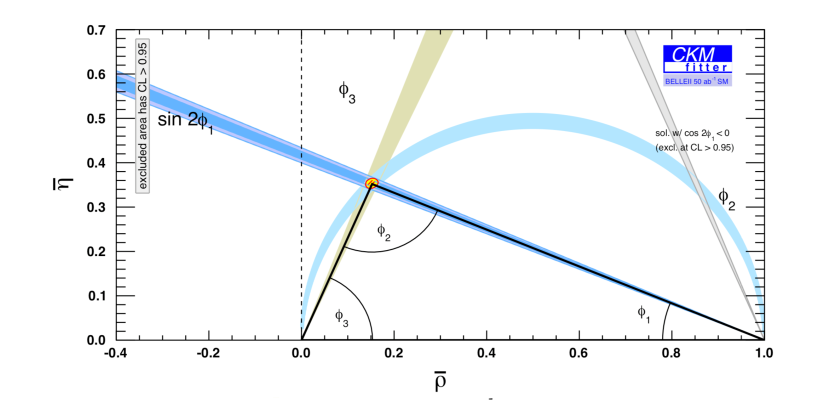
In the Standard Model (SM) flavor changing quark interactions are described by the unitary Cabibbo-Kobayashi-Maskawa (CKM) unitary matrix . The unitarity condition gives nine equations, six of which, corresponding to the off-diagonal elements of the identity matrix , can be represented as triangles in the complex plane. The most commonly used triangle at B-factories is the one given by the following equation
| (1) |
The branching fractions for decays are proportional to the sides of this triangle while the angles are proportional to the amount of CP-violation (CPV). Two different naming conventions are in use for the angles of this triangle , and and , and respectively. In the following we will use the latter one. The relations among the two conventions are =, = and =. All three angles can be measured at B-factories using different decay modes [2]. and can be measured in time-dependent CP-violation analysis (TDCPV): for in and , transitions, and for in , decays. finally can be accessed by the measurement of the interference in and amplitudes.
2 The Belle II experiment
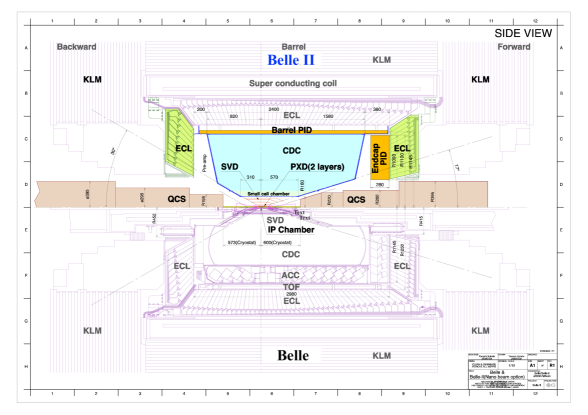
The Belle II experiment follows the path defined by the Belle and BaBar experiments, both of which started about 20 years ago at the B-factories KEKB (Tsukuba, Japan) and PEP-II (SLAC, USA) respectively. Until now all measurements made at B-factories are in agreement with the Standard Model; nowadays, however, there is compelling evidence for New Physics beyond the Standard Model from various sources (e.g. neutrino mixing, baryonic asymmetry in the universe). For this reason Japan has decided to upgrade the existing KEKB accelerator to deliver a 40 times higher instantaneous luminosity which will allow, in 5 years of data taking, to record a data sample 50 times larger than that recorded, jointly, by BaBar and Belle. The new machine, called SuperKEKB, has now been completed and commissioning has started. The design luminosity is cm with a projected integrated luminosity of 50 ab-1 in 5 years running at the center of mass energy of the . Because of the increased level of background, the Belle II detector has to cope with higher occupancy and radiation damage than the Belle detector. To be able to operate at the conditions of the SuperKEKB collider, the components of the Belle detector are either upgraded or replaced by new ones. A new vertex detector (VXD) is being built, a new drift chamber (CDC) with smaller cell size has been built, the particle identification system will include a new Time Of Propagation (TOP) detector. The barrel CsI crystals, thallium doped, EM calorimeter (ECL) will be provided with new readout; studies are being carried on for the end caps upgrade. In the and muon detector (KLM) only the outer barrel layers of glass RPCs will be re-used, the remaining will be substituted with scintillation counters. For a detailed description of the detector please refer to [1].
Commissioning (Phase 1) of the main ring (without final focus quadrupoles) has been successfully carried out between February and June 2016; instead of Belle II, a commissioning detector, BEAST II (Beam Exorcism for A STable experiment II), was used, in order to measure actual beam induced background rates at the Interaction Point (IP). The roll in of the Belle II detector without vertex detector, which will be replaced by a modified version of the BEAST II detector, has taken place in Early 2017 followed by a global cosmic run. The second phase of commissioning (Phase 2) and first physics runs has started in early 2018; during summer 2018 shutdown the vertex detector will be installed and Phase 3 data-taking, with full Belle II detector, is scheduled to start by the end of 2018.
3 Measurement of
The best way to measure at B-factories is the TDCPV analysis of and transitions. While the tree-level process results in a more precise measurement, especially using the golden mode , , being a loop process, is also sensitive to New Physics (NP) contributions. The general strategy is to take advantage of the entangled production of the meson pair trough the reaction . The meson pair evolves in a coherent state, with exactly one and one at any given time, until one of the mesons decays. When one of the mesons decays the other meson continues to propagate and oscillate between a and state until its own decay. The identification of one of the mesons, defined as tagging , as a or , defines the flavor of the other meson at the same time. The time dependent asymmetry for the decay of the other meson, the signal , to a CP eigenstates can be written as
| (2) |
where is the difference in decay time between the flavor of the meson is observed and the time where the meson decays into a CP eigenstate and is the mass difference. The difference in decay time can be calculated measuring the decay length through . The coefficients and which appear in 2 are proportional to different types of CP violation: accounts for “direct” CP violation while accounts for the “mixing induced” CP violation. For and transitions and . In this kind of measurement the main source of systematic uncertainty comes from the resolution on the vertex of the tagging meson and the performance of the flavor tagging algorithm. For the benchmark channels thanks to the improved vertex detector, even with the reduced CM boost of Belle II with respect to Belle, the resolution on is expected to improve from 0.92 ps to 0.77 ps. The simulation also shows that the new flavor tagging algorithm has an efficiency of 35.8% for Belle II which would represent a 20% improvement over Belle. Table 1 shows the comparison of the sensitivity for and for the sum over all modes for Belle with 1 ab-1 and Belle II with 50 ab-1 along with the values measured by Belle. The systematic error consists of two parts: a part which is reducible increasing statistics and a irreducible part. We quote the irreducible part in two different scenarios: one in which there is no improvement with respect to Belle and with the improvements expected due to better vertexing of Belle II.
| Belle (1 ab-1) | |||||||
| Decay Mode | Quantity | Value | Stat. () | Syst. (1) () | Syst. (2) () | ||
| Red. | Non-red. | Red. | Non-red. | ||||
| +0.67 | 29 | - | 13 | - | - | ||
| -0.015 | 21 | - | +45, -23 | - | - | ||
| +0.667 | 23 | - | 12 | - | - | ||
| +0.006 | 16 | - | 12 | - | - | ||
| Belle II (50 ab-1) | |||||||
| - | 3.5 | 1.2 | 8.3 | 1.2 | 4.4 | ||
| - | 2.5 | 0.7 | +43, -22 | 0.7 | +42, -11 | ||
| - | 2.7 | 2.6 | 7 | 2.6 | 3.6 | ||
| - | 1.9 | 1.4 | 10.6 | 1.4 | 8.7 | ||
We studied two different decays involving transitions: and . is reconstructed in and modes with and (only for ). The corresponding expected sensitivity is shown in table 2.
| Decay Mode | ||
|---|---|---|
| 0.025 | 0.017 | |
| 0.042 | 0.030 | |
| 0.048 | 0.036 | |
| modes inclusive | 0.019 | 0.014 |
| and modes inclusive | 0.015 | 0.011 |
For and where the main difficulty is the reconstruction of the s and the itself. Mis-reconstruction of the neutral candidates leads to signal cross-feed and potentially to a systematically limited resolution. Belle II expectations with 50 ab-1 are shown in 3.
| Decay Mode | ||
|---|---|---|
| 0.019 | 0.013 | |
| 0.035 | 0.025 | |
| modes inclusive | 0.009 | 0.007 |
| modes inclusive | 0.025 | 0.016 |
| and modes inclusive | 0.0085 | 0.0063 |
4 Measurement of
To extract from decays we apply an analysis strategy similar to the one used to extract to decays, where , .
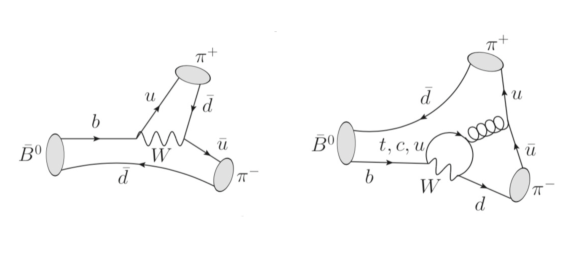
Differently from and , in which a single diagram gives the leading contribution, in the tree and penguin diagrams shown in Fig. 2 have comparable size. The different weak and strong phases lead to a shift in of the form where . Isospin analysis [3] offers the best way to disentangle the contribution of . To perform isospin analysis one has to measure separately the decays where , and , , . Up to date has never been measured and this leaves an eightfold ambiguity on in the channel. The main difficulty in measuring lies in the fact that to reconstruct the decay vertex one actually needs tracks; for this translates in the request that either one of the photons from the decay converts in the inner tracking detectors or that the the undergoes a Dalitz decay . According to Belle II simulation the number of decays in which one of the two previous conditions holds represents of all decays and hence very good reconstruction efficiency along with high statistics is needed. Table 4 lists Belle results and sensitivity and the expected sensitivity for Belle II for charged and neutral final states.
| Quantity | Value | Belle (0.8 ab-1) | Belle II (50 ab-1) |
| B() | |||
| B() | |||
| B() | 5.86 | ||
| - | - | 1.50 |
For thanks to the presence of at least two charged pions in the final state for both charged and neutral modes the full set , , and has been measured. Current measurements along with the expectations for Belle II are reported in table 5.
5 Measurement of
The third angle of the CKM matrix is the phase between and . The best methods to measure are based on the interference between and amplitudes with decaying to same final state. While these transitions are theoretically very clean, they are experimentally very challenging because of CKM and color suppression. The first Belle II sensitivity evaluation has been performed using the Dalitz-plot analysis of self-conjugate decays (GGSZ) in , . This analysis strategy requires the knowledge of the different strong phases which have to be measured separately at a charm factory. The expected sensitivity for this analysis alone at Belle II with 50 ab-1 is . Combining the GGSZ analysis with other analysis techniques previously used at Belle (ADS, GLW) the combined expected sensitivity is .
6 Outlook
The huge dataset of 50 ab-1 of collisions which is expected to be recorded by the Belle II detector in 5 years of data taking starting in 2019 together with substantial improvements in the detector, will allow to test the CKM paradigm at the % level. The parameter is expected to be measured with 1% a precision. The parameter will benefit from improved isospin analysis that will reduce ambiguities in the solution. The precision on will likely reach .
References
-
[1]
Belle II Technical Design Report, KEK Report 2010-1.
Available: http://www-superkekb.kek.jp/documents/B2TDR.pdf - [2] A. J. Bevan et al., Eur. Phys. J. C 74, 3026 (2014).
- [3] M. Gronau and D. London, PRL 65, 3381 (1990).
- [4] Y. T. Duh et al. (The Belle Collaboration), Phys. Rev. D 87, 031103 (2013).
- [5] J. Dalseno et al. (Belle Collaboration), Phys. Rev. D 88, 092003 (2013).
- [6] T. Julius et al. (Belle Collaboration), Phys. Rev. D 96, 032007 (2017).
- [7] B. Aubert et al. (BaBar Collaboration), Phys. Rev. D 78, 071104 (2008).
- [8] J. Zhang et al. (The Belle Collaboration), Phys. Rev. Lett. 91, 221801 (2003).
- [9] P. Vanhoefer et al. (Belle Collaboration), Phys. Rev. D 93, 032010; Erratum Phys. Rev. D 94, 099903 (2016).
- [10] A. Giri, Y. Grossman, A. Soffer, J. Zupan, Phys.Rev. D 68, 054018 (2003).