20XX Vol. X No. XX, 000–000
Received 20XX Month Day; accepted 20XX Month Day
Properties of filament in Solar cycle 20-23 from McIntosh database
Abstract
Filament is a cool, dense structure suspended in the solar corona. The eruption of a filament is often associated with coronal mass ejection (CME), which has an adverse effect on space weather. Hence, the study of filament has attracted much attention in the recent past. The tilt angle of active region (AR) magnetic bipoles is a crucial parameter in the context of the solar dynamo. It governs the conversion efficiency of the toroidal magnetic field to poloidal magnetic field. The filament always forms over the Polarity Inversion Lines (PILs). So the study of tilt angles of the filament can provide valuable information about generation of magnetic field in the Sun. We study the tilt angle of filaments and other properties of it using McIntosh archive data. We fit a straight line to each filament to estimate its tilt angle. We study the variation of mean tilt angle with time. The latitude distribution of positive tilt angle filaments and negative tilt angle filaments reveal that there is a dominance of positive tilt angle filaments in the southern hemisphere and negative tilt angle filaments dominate in the northern hemisphere. We study the variation of the mean tilt angle for low and high latitude separately. Study of temporal variation of filament number reveals that total filament number and low latitude filament number varies cyclically, in phase with the solar cycle. The number of filaments in high latitude is less, and they also show a cyclic pattern in temporal variation. We also study the north-south asymmetry of filament for different latitude criteria.
keywords:
Sun: filaments, prominences, Sun: magnetic fields, Sun: corona, Sun: activity, (Sun:) sunspots1 Introduction
Filaments are cool and dense structures suspended in the solar corona. They appear as dark filamentary structures when seen on disk of the Sun. The same feature appears bright when observed in the off limb region and are known as prominence for historical reasons. Filament always appears in the vicinity of Polarity Inversion Lines (PILs) (also known as neutral lines) (Martin, 1998). Filament eruption is often associated with coronal mass ejection (CME), which is hazardous for space weather. Hence, the study of the filament is important from the perspective of space weather research (Gopalswamy et al., 2003; Gilbert et al., 2000; Jing et al., 2004). Filaments are primarily observed in H line. Systematic H observations have started since 1915 at the Kodaikanal Observatory (India), 1919 at the Meudon Observatory (France) (spectroscopic observations), and 1959 at the Kislovodsk Mountain Astronomical Station of the Main (Pulkovo) Astronomical Observatory of Russian Academy of Sciences. Tlatov et al. (2016) has studied more than eight solar cycles’ data of filaments using Meudon observatory and Kislovodsk mountain station synoptic maps. Chatterjee et al. (2017) has studied filament properties using Kodaikanal Observatory (India) data for nine solar cycles. Hao et al. (2015) has studied properties of filaments using data from Big Bear Solar Observatory (BBSO) from 1988 to 2013 and Mazumder et al. (2018) has studied properties of filaments using McIntosh archive data from 1967 to 2009.
The filaments are distributed uniformly in longitude (Mazumder et al., 2018). However, the distribution of filaments in latitude is not uniform. A bimodal nature in latitudinal distribution of filaments is observed (Hao et al., 2015; Mazumder et al., 2018). Tlatov et al. (2016), Chatterjee et al. (2017), Hao et al. (2015), and Mazumder et al. (2018) have reported a butterfly structure in the temporal variation of the latitudinal distribution of filaments. The butterfly diagram is similar to that of sunspot except that the spread in latitude is broader in case of filaments. They have also reported the rush to the pole of filaments during the maxima of the solar cycle. The variation of filament number is found to be cyclic in close proximity to sunspot number variation (Hao et al., 2015; Li et al., 2010). The total filament length in the Carrington map is also found to vary cyclically with time (Tlatov et al., 2016; Mazumder et al., 2018). Mazumder et al. (2018) further classified the filaments as associated and unassociated to solar activity belt according to their position inside or outside the sunspot activity belt respectively. They have found the variation in total length of the filaments is correlated with variation in sunspot area. However, the temporal variation of length of filaments unassociated with solar activity belt is uncorrelated with variation of sunspot area.
The tilt angle of the active region (AR) is a very crucial parameter in the solar dynamo. The tilt angle of active region (AR) magnetic bipoles governs the conversion efficiency of the toroidal magnetic field to poloidal magnetic field (Tlatov et al., 2013). Filaments always form over PILs. So the analysis of the tilt angle of filaments can give us important insights into the mechanism of the generation of the magnetic field of the Sun. Average tilt angle of filaments are found to decrease from the equator towards the pole for both positive tilt and negative tilt (Tlatov et al., 2016; Mazumder et al., 2018) which is consistent with famous Joy’s law of sunspot pair (Hale et al., 1919). The tilt angle of filament was observed to be negative in the northern hemisphere and positive in the southern hemisphere for different length and sunspot belt association criteria by Mazumder et al. (2018). Following this observation, they concluded that the origin of most of the filaments are from large-scale magnetic field structure and not from the active region (AR). However, the geometry of the inter-AR filament as depicted by Martens & Zwaan (2001) can also contribute to this apparently unexpected tilt angle orientation in both hemispheres. The hemispheric asymmetry of the filament number was studied, and they were found to be asymmetric at different phases of the solar cycle (Mazumder et al., 2018; Hao et al., 2015; Kong et al., 2015; Li et al., 2010, 2003).
The mean tilt angle variation with time is observed to follow a solar cycle like variation (Tlatov et al., 2016). The latitudinal distribution of positive and negative tilt angles of filaments are found to behave differently (Tlatov et al., 2016). The time latitude distribution of the filaments’ tilt angle shows a positive tilt dominance in mid-latitude and a negative tilt dominance in higher latitude (Tlatov et al., 2016).
We have organized the paper as follows. In section 2, we describe the data used and discuss the methods implemented to analyze the data. In section 3, we analyze the results obtained. In section 4, we summarize our work.
2 Data and methods
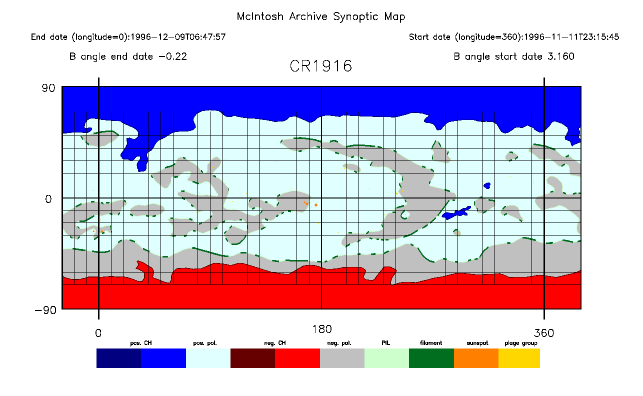
Patrick S McIntosh, a scientist of NOAA’s Space Environment Center in Boulder, had drawn the Carrington maps of the Sun using the various ground as well as space-based satellite data from April 1967 till July 2009. The hand-drawn maps are archived and digitized by McIntosh project (a Boston College/NOAA/NCAR collaboration, funded by the NSF) at NOAA/NCEI. The data are stored in both image and fits format and also have been made available online111\urlhttps://www2.hao.ucar.edu/mcIntosh-archive/four-cycles-solar-synoptic-maps. For our analysis, we have used level 3 fits file from McIntosh archive (Gibson et al., 2017; Webb et al., 2017).
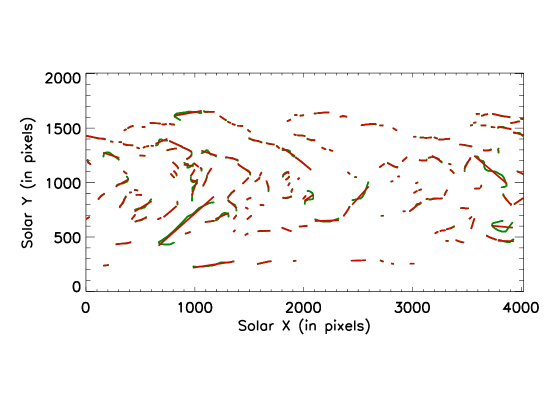
Level 3 image of the Carrington rotation number 1916 is presented in Figure 1. The Carrington maps contain spatial information of various solar features namely, sunspots, plages, filaments, coronal holes and Polarity Inversion Lines (PILs). In this work, we have studied different properties of filaments. There are three big gaps in the data, first from June 1974 to July 1978, second from October 1991 to January 1994, and the final from April 1994 to May 1996. We have reduced the level 3 fits files using Interactive Data Language (IDL) and obtained the spatial information of various solar features, namely, sunspots, plages, filaments, coronal holes, and Polarity Inversion Lines (PILs). In this study, we are interested in filaments alone. So we produce Carrington map that contains only the filament. In total available 442 Carrington maps during April 1967 to July 2009, we have detected 67373 filaments. We fit a straight line to each filament. The angle that the straight line makes with the equator is defined as the tilt angle of that particular filament. One sample image of Carrington map 1552 containing the only filament with the fitted straight line is shown in Figure 2. The filaments are represented by green lines, and the fitted straight lines are represented by red lines. We observe that the fitting is good except for a few cases which can be ignored for statistical analysis. We calculate filament length using the following formula
| (1) |
where L is filament’s length, is the solar radius, the symbols and represent the latitude and longitude of a particular pixel respectively, and is the total number of pixels associated with the filament’s structure. The quantities and are latitudinal and longitudinal differences between two adjacent pixels, respectively. We add the lengths of all the filaments in a Carrington map to get the total length of the all filaments in it. The sunspot data are taken from the Royal Greenwich Observatory (RGO) and US Air Force (USAF) - Solar Optical Observing Network (SOON) database.
3 Analysis and Results
Filament always appears in the vicinity of PILs (Martin, 1998).
Filament formation is closely related to generation of magnetic field in the Sun.
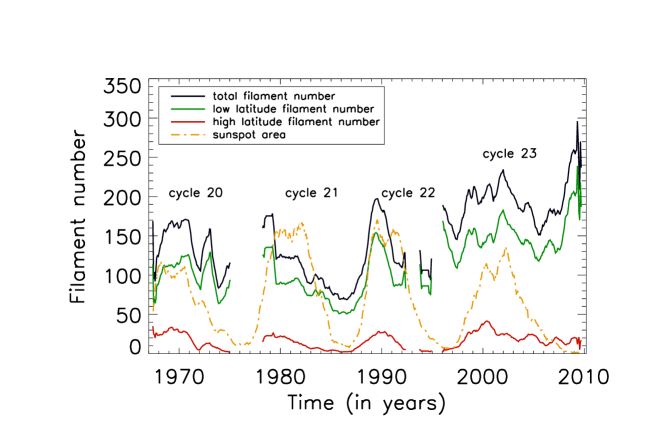
Figure 3 represents the variation of filament number with time. The black line shows the variation of the total filament number with time. The green line depicts the variation of low latitude filament number with time. The red line represents the variation of high latitude filament number with time. The variation of sunspot area is depicted by the orange dashed line.
We notice a cyclic variation of the total filament number and low latitude filament number which is in phase with the sunspot area variation. The number of high latitude filaments is less, but they also show a cyclic variation (Li et al., 2007).
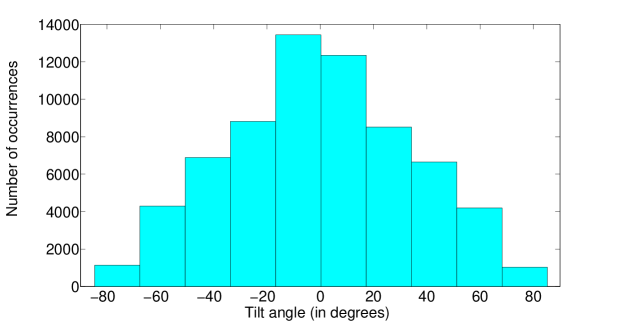
The tilt angle of the active region (AR) is a very crucial parameter in the solar dynamo. The tilt angle of active region (AR) magnetic bipoles governs the conversion efficiency of the toroidal magnetic field to poloidal magnetic field (Tlatov et al., 2013). Filaments always form over PILs. Thus, the analysis of the tilt angle of filaments can give us important insights into the magnetic field generation mechanism inside the Sun. Here, we carry out a detailed analysis of the filaments’ tilt angle. Figure 4 represents the histogram of the filament tilt angle. Out of a total 67373 filaments, 33415 filaments have positive tilt angle, and 33622 filaments have negative tilt angle.
So, in our database, there are 207 more filaments which have a negative tilt angle, when compared to filaments which have positive tilt angle.
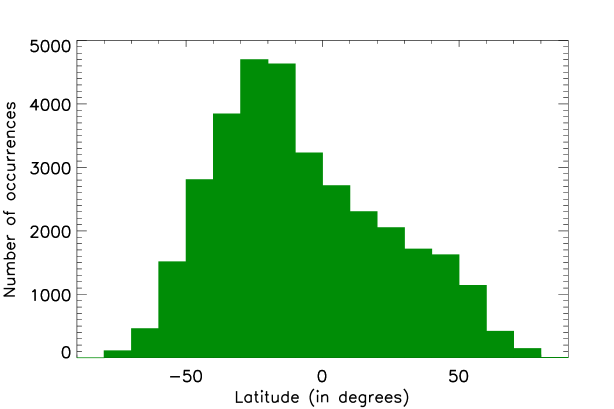
Figure 5 shows the latitudinal distribution of positive tilt angle filaments. Out of total
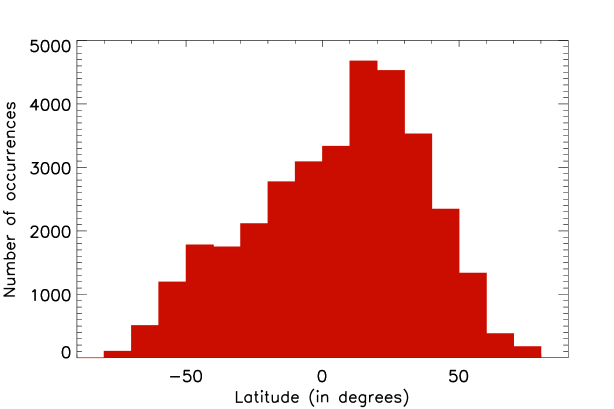
33415 positive tilt angle filaments, 12113 filaments are in the northern hemisphere, and 21297 filaments are in the southern hemisphere. Figure 6 shows the latitudinal distribution of negative tilt angle. Out of 33622 total negative tilt angle filaments, 20305 filaments are in the northern hemisphere, and 13315 filaments are in the southern hemisphere. So there exists a dominance of negative tilt angle in the northern hemisphere while positive tilt angle dominates in the southern hemisphere. The findings are consistent with earlier findings by Mazumder et al. (2018).
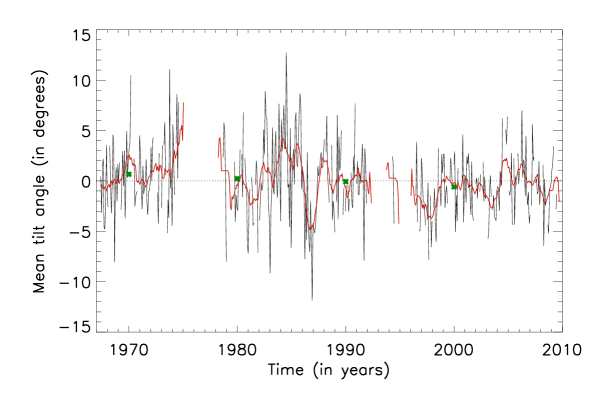
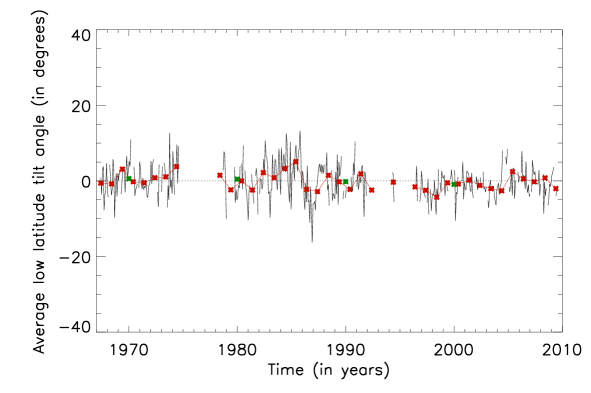
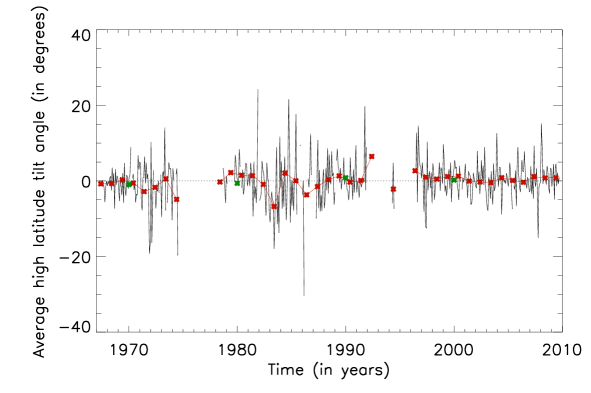
Figure 7 depicts the variation of the mean tilt angle with time. We calculate mean of all tilt angles present in a particular Carrington map and get the mean tilt angle. The black curve in Figure 7 represents the variation of the mean tilt angle with time. The red line depicts the temporal variation of the mean tilt angle averaged over 13 Carrington rotations. We further calculate the average tilt angle in each solar cycle. The green cross represents solar cycle average mean tilt angle. We further investigate the lower latitude and higher latitude filaments’ mean tilt angle separately. We define lower latitude filaments to be filaments situated within latitude ( ) and we define higher latitude filament as filaments having latitude either greater than or filaments having latitude less than (). The total number of low latitude filaments is 51210, and the total number of high latitude filaments is 7564. Figure 8 depicts the variation of low latitude mean tilt angle with time. The black line shows the low latitude mean tilt angle variation with time. The red line shows the temporal variation of low latitude tilt angle averaged over 13 Carrington rotations. The green cross represents solar cycle average mean tilt angle in low latitude. Figure 9 depicts the variation of high latitude mean tilt angle with time. The black line shows high latitude mean tilt angle variation with time. The red line shows the temporal variation of high latitude tilt angle averaged over 13 Carrington rotations. The green cross represents solar cycle average mean tilt angle in high latitude.
Filament formation is not symmetric in two hemispheres of the Sun. Earlier studies reported the north-south asymmetry of filament number (Hao et al., 2015; Kong et al., 2015; Li et al., 2010, 2003), but we believe that total filament length captures the magnetic field generation information in the Sun better than the filament number (Mazumder et al., 2018). So we use the total filament length in each Carrington rotation to calculate the north-south asymmetry of the filament. We define north-south asymmetry of sunspot area as
| (2) |
where and are the total area of the sunspots in the northern and the southern hemispheres, respectively. If , the total sunspot area in the northern hemisphere dominates than that in the southern hemisphere and if , the total sunspot area in the southern hemisphere dominates than that in the northern hemisphere. We define north-south asymmetry of the filament () as
| (3) |
where and are the total filament length in northern and southern hemisphere, respectively. If , the total filament length in the northern hemisphere dominates than that in the southern hemisphere and if , the total filament length in the southern hemisphere dominates than that in the northern hemisphere.
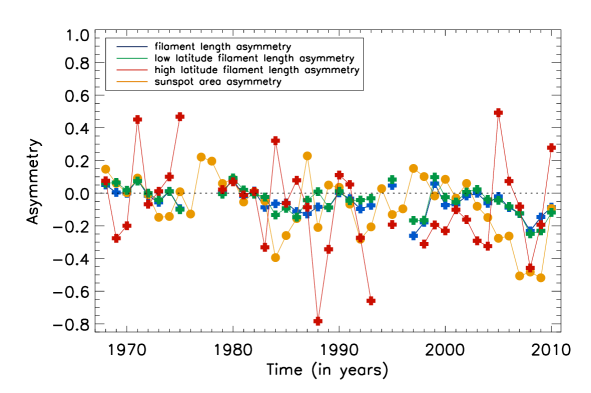
Figure 10 depicts north-south asymmetry of the filament length and sunspot area for different latitude criteria. The blue cross represents the north-south asymmetry of all filaments. The green cross represents the north-south asymmetry of low latitude filaments. The red cross represents the north-south asymmetry of high latitude filaments. The north-south asymmetry of sunspot area is shown by filled orange circles. The temporal variation of north-south asymmetry of the total filaments and low latitude filaments show a sunspot area north-south asymmetry like behaviour. The north-south asymmetry of high latitude filament fluctuates and does not show any correspondence to sunspot area north-south asymmetry. However, the north-south asymmetry of high latitude filaments shows dominance of northern hemisphere in solar cycle 20 whereas, in the solar cycles 21, 22 and 23, the southern hemisphere shows a dominant character (Li et al. 2009).
4 Summary and Conclusion
We have analyzed 442 Carrington maps from MacIntosh database and detected 67373 filaments. Each filament is fitted with a straight line, and the tilt angle (angle which the straight line makes with equator) is estimated. We have noticed a cyclic variation of the total filament number as well as in low latitude and high latitude filament numbers (see Figure 3). A detailed analysis of tilt angles of the filament is carried out in this work. Figure 2 shows the example of fitting of the filament (depicted by green lines) with the straight line (depicted by red straight lines) for the Carrington map 1552. The histogram of the tilt angle of all filaments are plotted (see Figure 4), and we have found an excess of 207 negative tilt angle filaments as compared to the positive tilt angle filaments. Histogram of the latitude of positive tilt angle filament reveals that positive tilt angle is dominant in the southern hemisphere (see Figure 5). Histogram of the latitude of negative tilt angle filament reveals that negative tilt angle is dominant in the northern hemisphere (see Figure 6). The findings are consistent with an earlier report (Mazumder et al., 2018) and contradict our expectation of positive tilt angle dominance in the northern hemisphere and negative tilt angle dominance in the southern hemisphere according to Hale’s polarity law in the two hemispheres (Hale et al., 1919). It can happen due to the contribution of inter-AR filament formation geometry explained by (Martens & Zwaan, 2001). Another possible explanation is that more filaments are formed from large-scale magnetic field structure than from the intra-AR filament (Mazumder et al., 2018). We examined the variation of mean tilt angle (mean of the tilt angle of all filaments in a Carrington map) and cycle-averaged tilt angle (see Figure 7). We also studied mean tilt angle variation in low latitude () and high latitude () (see Figure 8 and Figure 9). Similar analysis carried out by Tlatov et al. (2016) (from different database) had more extended and continuous data. So we are skeptical about comparing our result to their findings. The north-south asymmetry of the total filament, low latitude filament, and high latitude filament reveals a sunspot area north-south asymmetry like behaviour in case of the total filament and low latitude filament (see Figure 10). The north-south asymmetry of high latitude filament fluctuates and does not show any correspondence to sunspot area north-south asymmetry. However, the north-south asymmetry of high latitude filaments shows a dominance of northern hemisphere in solar cycle 20 whereas in the solar cycles 21, 22 and 23 the southern hemisphere shows a dominant character (Li et al., 2009).
Acknowledgement
We are thankful to Patrick S. McIntosh, from NOAA’s Space Environment Center in Boulder
for developing the archive of hand-drawn Carrington maps using both ground-based and satellite observations. We are also grateful to the team of McIntosh
archive project (a Boston College/NOAA/NCAR collaboration, funded by the NSF), NOAA National Centers for Environmental Information for creating a digital archive of McIntosh Carrington maps and make it available online. R.M. acknowledges the grant from the University Grant Commission, Government of India and CESSI, IISER Kolkata, India.
References
- Chatterjee et al. (2017) Chatterjee, S., Hegde, M., Banerjee, D., & Ravindra, B. 2017, ApJ, 849, 44
- Gibson et al. (2017) Gibson, S. E., Webb, D., Hewins, I. M., et al. 2017, in IAU Symposium, Vol. 328, Living Around Active Stars, ed. D. Nandy, A. Valio, & P. Petit, 93
- Gilbert et al. (2000) Gilbert, H. R., Holzer, T. E., Burkepile, J. T., & Hundhausen, A. J. 2000, ApJ, 537, 503
- Gopalswamy et al. (2003) Gopalswamy, N., Shimojo, M., Lu, W., et al. 2003, ApJ, 586, 562
- Hale et al. (1919) Hale, G. E., Ellerman, F., Nicholson, S. B., & Joy, A. H. 1919, ApJ, 49, 153
- Hao et al. (2015) Hao, Q., Fang, C., Cao, W., & Chen, P. F. 2015, ApJS, 221, 33
- Jing et al. (2004) Jing, J., Yurchyshyn, V. B., Yang, G., Xu, Y., & Wang, H. 2004, ApJ, 614, 1054
- Kong et al. (2015) Kong, D.-F., Qu, Z.-N., & Guo, Q.-L. 2015, Research in Astronomy and Astrophysics, 15, 77
- Li et al. (2009) Li, K. J., Gao, P. X., Zhan, L. S., Shi, X. J., & Zhu, W. W. 2009, MNRAS, 394, 231
- Li et al. (2010) Li, K. J., Liu, X. H., Gao, P. X., & Zhan, L. S. 2010, New A, 15, 346
- Li et al. (2003) Li, K. J., Liu, X. H., Zhan, L. S., et al. 2003, New A, 8, 655
- Li et al. (2007) Li, K. J., Mu, J., & Li, Q. X. 2007, MNRAS, 376, L39
- Martens & Zwaan (2001) Martens, P. C., & Zwaan, C. 2001, ApJ, 558, 872
- Martin (1998) Martin, S. F. 1998, Sol. Phys., 182, 107
- Mazumder et al. (2018) Mazumder, R., Bhowmik, P., & Nandy, D. 2018, ApJ, 868, 52
- Tlatov et al. (2016) Tlatov, A. G., Kuzanyan, K. M., & Vasil’yeva, V. V. 2016, Sol. Phys., 291, 1115
- Tlatov et al. (2013) Tlatov, A., Illarionov, E., Sokoloff, D., & Pipin, V. 2013, MNRAS, 432, 2975
- Webb et al. (2017) Webb, D. F., Gibson, S. E., Hewins, I. M., et al. 2017, Space Weather, n/a, 2017SW001740