11email: zakharenko@ph1.uni-koeln.de, hspm@ph1.uni-koeln.de 22institutetext: Institute of Radio Astronomy of NASU, Mystetstv 4, 61002 Kharkiv, Ukraine 33institutetext: Quantum Radiophysics Department, V.N. Karazin Kharkiv National University, Svobody Square 4, 61022 Kharkov, Ukraine 44institutetext: Center for Space and Habitability, Universität Bern, Sidlerstrasse 5, 3012 Bern, Switzerland 55institutetext: Centre for Star and Planet Formation, Natural History Museum of Denmark, University of Copenhagen, Øster Voldgade 57, 1350 Copenhagen K, Denmark
Deuterated methyl mercaptan (CH3SD): Laboratory rotational spectroscopy and search toward IRAS 162932422 B††thanks: The input and output files of the fit are available as text files at CDS via anonymous ftp to cdsarc.u-strasbg.fr (130.79.128.5) or via http://cdsweb.u-strasbg.fr/cgi-bin/qcat?J/A+A/621/A114
Methyl mercaptan (also known as methanethiol), \ceCH3SH, has been found in the warm and dense parts of high- as well as low- mass star-forming regions. The aim of the present study is to obtain accurate spectroscopic parameters of the S-deuterated methyl mercaptan \ceCH3SD to facilitate astronomical observations by radio telescope arrays at (sub)millimeter wavelengths. We have measured the rotational spectrum associated with the large-amplitude internal rotation of the methyl group of methyl mercaptan using an isotopically enriched sample in the 150510 GHz frequency range using the Köln millimeter wave spectrometer. The analysis of the spectra has been performed up to the second excited torsional state. We present modeling results of these data with the RAM36 program. \ceCH3SD was searched for, but not detected, in data from the Atacama Large Millimeter/submillimeter Array (ALMA) Protostellar Interferometric Line Survey (PILS) of the deeply embedded protostar IRAS 162932422. The derived upper limit corresponds to a degree of deuteration of at most 18%.
Key Words.:
Methods: laboratory: molecular – Techniques: spectroscopic – ISM: molecules – Astrochemistry – ISM: abundances – Radio lines: ISM1 Introduction
Sulfur(S)-bearing molecules are of great astrophysical importance since they are excellent tracers of early protostellar evolution (Charnley 1997; Buckle & Fuller 2003; van der Tak et al. 2003; Herpin et al. 2009). Moreover, their abundance is particularly sensitive to physical and chemical evolution in hot cores, thus sulfur has been proposed to be a chemical clock in these regions (Charnley 1997; Hatchell et al. 1998a, b; Wakelam et al. 2011). But the systematic understanding of sulfur chemistry in massive star-forming regions is not yet complete, namely because of the sulfur depletion problem (Ruffle et al. 1999). Therefore, more observations of S-bearing species are needed to test the chemical models for a better understanding of the star formation process. Methyl mercaptan, also known as methanetiol, \ceCH3SH, was among the molecules detected early in space by means of radio-astronomy, first tentatively by Turner (1977) and confirmed subsequently by Linke et al. (1979). Both observations were made toward the prolific high-mass star-forming region Sagittarius (Sgr) B2 close to the Galactic center. The molecule was observed later toward the G327.30.6 hot core, the warm and dense part of a high-mass star-forming region (Gibb et al. 2000), the cold core B1 (Cernicharo et al. 2012), the Orion KL hot core (Kolesniková et al. 2014), the low-mass star-forming region IRAS 162932422 (Majumdar et al. 2016), and the prestellar core L1544 (Vastel et al. 2018). There is also evidence for the presence of \ceCH3SH toward the protostellar object HH212 (Lee et al. 2017). Unbiased molecular line surveys carried out with the Atacama Large Millimeter/submillimeter Array (ALMA) toward Sgr B2(N) (Müller et al. 2016) and IRAS 162932422 (Drozdovskaya et al. 2018) detected methanethiol at levels that make detection of minor isotopic species plausible. Studying the isotopic abundance ratios can improve our understanding of the chemical and physical evolution of the different parts of the interstellar medium.
The enrichment of deuterium in dense molecular clouds has been of considerable interest for many years (Millar et al. 1989). The degree of deuteration has been viewed as an evolutionary tracer in low-mass star-forming regions (Crapsi et al. 2005; Ceccarelli et al. 2007; Chantzos et al. 2018), and this may even apply to high-mass star-forming regions (Fontani et al. 2011). Jørgensen et al. (2016) carried out the Protostellar Interferometric Line Survey (PILS) of the low-mass protostellar binary IRAS 162932422 with ALMA covering 329363 GHz. The survey is particularly suitable to probe the chemical content of the hot corinos, the warm and dense parts of the molecular cloud surrounding the protostars, because of the high spatial resolution of 0.5”. Several deuterated species were detected for the first time, among them the mono-deuterated isotopomers of glycolaldehyde (Jørgensen et al. 2016), DNCO and the mono-deuterated isotopomers of formamide (Coutens et al. 2016), HD34S (Drozdovskaya et al. 2018), DCO (Persson et al. 2018), HDNCN (Coutens et al. 2018), \ceCHD2CN (Calcutt et al. 2018), as well as numerous additional deuterated species (Jørgensen et al. 2018). The degree of deuteration differs from about one to a few percent per H atom in the molecule which was explained as potentially being caused by different timescales on which the molecules and possibly the specific isotopologs were formed. Other recent detections of deuterated molecules, mostly in other sources, include \ceCH3OCH2D (Richard et al. 2013), \cec-C3D2 (Spezzano et al. 2013), NH3D+ (Cernicharo et al. 2013), \cel-C3HD (Spezzano et al. 2016), DOCO+ (Fuente et al. 2016), DCS+ (Fuente et al. 2016; Potapov et al. 2016), and \ceDC7N (Burkhardt et al. 2018).
Thus, laboratory spectroscopy of deuterated methyl mercaptan, \ceCH3SD, and its potential detection will enable astrophysicists and astrochemists to measure the D/H abundance ratios and study deuteration of so far little explored sulfur-bearing species. \ceCH3SD as well as \ceCH3SH are also of fundamental interest because of the large amplitude internal rotation of the \ceCH3 group against its framework \ceSD or \ceSH, respectively.
The \ceCH3SH main isotopic species was subjected to numerous studies. Early investigations into its rotational spectrum were carried out more than 50 years ago (Solimene & Dailey 1955; Kojima & Nishikawa 1957; Kojima 1960). The investigations were extended later into the millimeter and lower submillimeter regions (Lees & Mohammadi 1980; Sastry et al. 1986; Bettens et al. 1999) and into the terahertz (1.11.5 THz) and far-infrared regions (50550 cm-1) (Xu et al. 2012). The last study also initiated several high-resolution infrared spectroscopic investigations, for example, (Lees et al. 2018) and references therein.
The deuterated methyl mercaptan has been studied by infrared spectroscopy in the gas, liquid, and solid state, as well as by Raman spectroscopy, with the purpose of eliminating some discrepancies in the fundamental frequency assignments of \ceCH3SH (May & Pace 1968). The microwave spectrum of \ceCH3SD has been measured in the frequency range 8168 GHz. The rotational transitions have been analyzed in the ground and first excited torsional states using a fourth-order effective torsion-rotation Hamiltonian (Tsunekawa et al. 1989a). The rms deviation of the fit of 0.6 MHz as well as the coverage of the quantum numbers up to ten are not sufficient for the search of this molecule in the dense spectra of astronomical objects. The aim of the present investigation is to provide reliable predictions for the astronomical observations at millimeter and submillimeter wavelengths. We can achieve this by improving the rms error of the fit and by extending the quantum number and frequency ranges, which will result in a refined set of spectroscopic parameters. Subsequently, we carried out a first search for \ceCH3SD toward IRAS 162932422 B in the PILS data.
2 Laboratory spectroscopic details
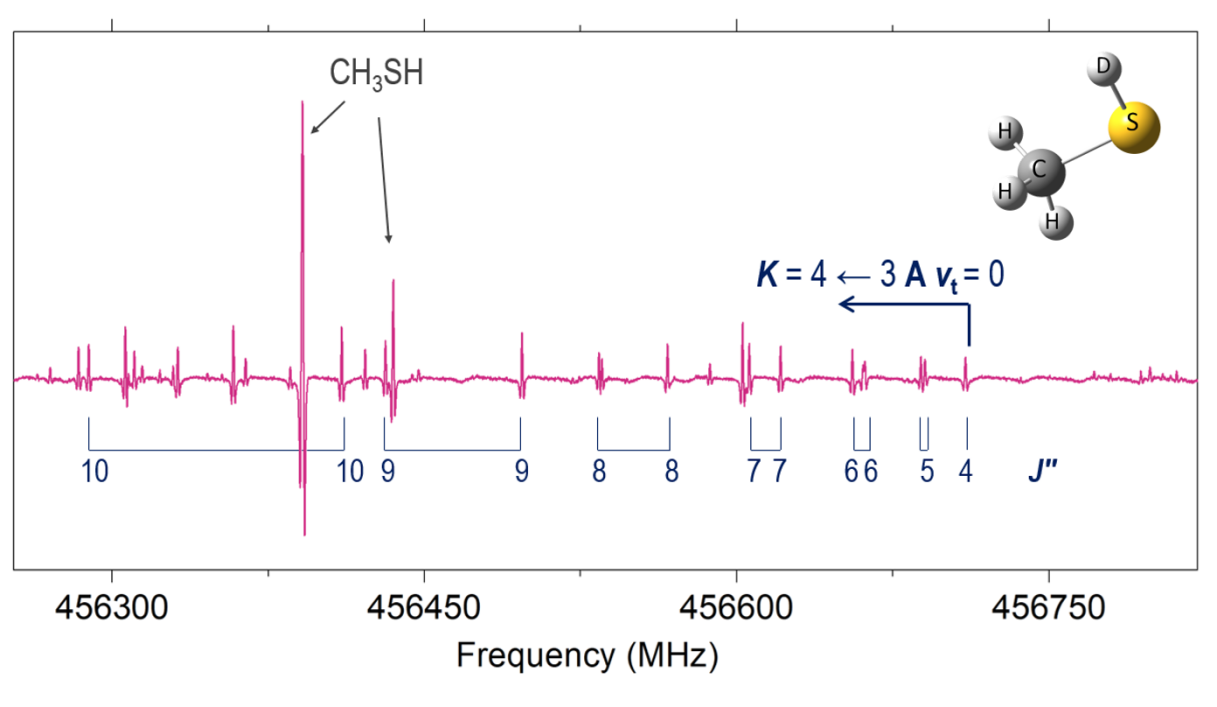
The sample of \ceCH3SD (98% atom D) has been purchased from Sigma Aldrich. Despite conditioning of the cell with \ceD2O, we had D/H exchange during the measurements, and strong lines of the normal methyl mercaptan were observed in the spectrum (see Fig. 1). The measurements were done at room temperature at a pressure of about 2 Pa. The rotational spectra have been measured in the frequency range from 150 up to 510 GHz using the Cologne mm/submm wave spectrometer. The synthesizer Agilent E8257D followed by the VDI (Virginia Diodes, Inc.) frequency multiplication chain has been used as a source of the signal. The RF input frequency has been modulated at a frequency kHz. The modulation amplitude and frequency step have been adjusted to optimize the S/N ratio. Schottky diode detectors have been used to detect the output frequencies. The output signal from the detectors has been detected by a lock-in amplifier in mode, resulting in approximately second-derivative line-shapes, with a time constant 2050 ms. A detailed description of the spectrometers may be found in Bossa et al. (2014); Xu et al. (2012). The estimated frequency uncertainties were 30, 50, and 100 kHz depending on the S/N ratio and the profile of the line shape.
3 Spectroscopic results
For the analysis of the spectra the rho-axis-method and the RAM36 code Ilyushin et al. (2010) were chosen, which had already successfully been applied for molecules with a top attached to a molecular frame of symmetry (Ilyushin et al. 2013; Smirnov et al. 2014). The barrier to methyl group internal rotation was determined to be intermediate, 440.9 cm-1 (Tsunekawa et al. 1989b), therefore, the rotational spectrum is complicated by splitting of the torsional energy levels into and substates. The RAM Hamiltonian allows to perform a joint fit of rotational stacks of levels associated with several torsional states (interactions with non-torsional vibrational modes are not included in the model) and its general expression may be written as
where the \ce_ are fitting parameters; is the angular momentum conjugate to the internal rotation angle ; , , and are projections on the , , and axes of the total angular momentum . A more detailed description of the RAM36 code can be found in Ilyushin et al. (2013, 2010).
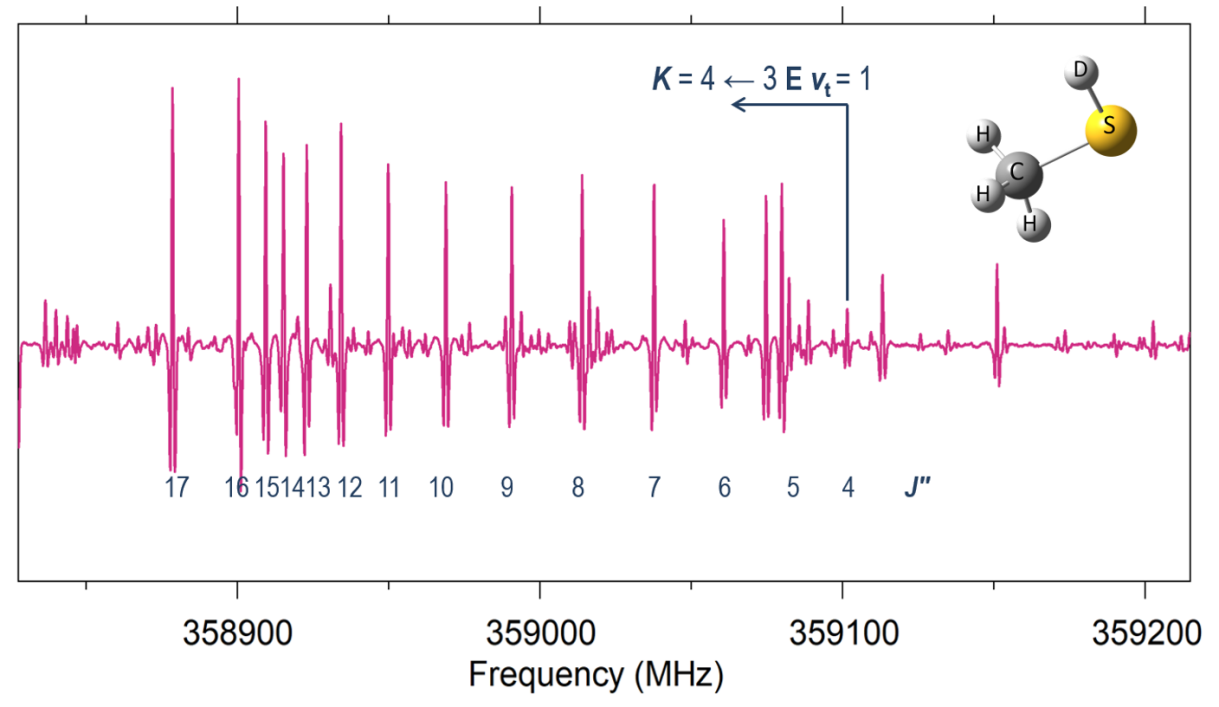
Deuterated methyl mercaptan has two components of the electric dipole moment, D and D (Tsunekawa et al. 1989b), so that both -type and -type transitions can be observed in the spectra. At the first step of our analysis, we fit the data from Tsunekawa et al. (1989a) with the RAM36 code. The dipole moment components were recalculated in the RAM system. As it was already discussed in the literature (e.g., Ilyushin et al. (2003)) in the molecules with large amplitude torsional motion the relative signs of the dipole moment components are important for obtaining correct intensity calculations. This choice should match the sign of parameter, which cannot be determined from the energy level positions only. The correctness of the adopted sign choice was verified experimentally by comparing the relative intensities for a number of transitions which intensities are significantly affected by the change in relative sign of dipole moment components. Whereas in general there are two relative sign choices that match our experimental data, we finally adopted the choice with positive value and relative signs of dipole moments that coincide with those in the main isotopologue of methyl mercaptan D and D. The predictions calculated from the initial fit allowed us to assign the -branch rotational transitions with low quantum numbers of deuterated methyl mercaptan in the ground and first excited torsional states. Newly assigned transitions were gradually added to the dataset and a number of refinement cycles for the parameters were performed. The improved values of the Hamiltonian parameters provided reliable predictions for the higher values of the quantum numbers. The second excited torsional state has been assigned in a similar manner. At the next step to extend the coverage of quantum number the -, -branches and b-type rotational transitions have been carefully searched for and assignments have been made. Examples of spectral recordings showing two -branches are presented in Figs. 1 and 2. Asymmetry splittings in Fig. 1 become larger as values increase. The separation between the lines in the -branch in Fig. 2 decreases as values increase up to 15 and then increases. This effect results from the interplay of contributions of rotation and torsion motions within this torsional state. Finally 4905 rotational transitions have been assigned for the ground, first and second excited torsional states of \ceCH3SD, which, due to blending, correspond to 4434 fitted line frequencies. Some statistical information on the final fit is presented in Table 1. The full dataset has been fit using 78 parameters with overall weighted standard deviation 0.9. In Table LABEL:tbl:ParametersTable, the final set of parameters is presented. The fits of \ceCH3SD and \ceCH3SH employ different sets of high order torsion-rotational parameters. Therefore, we focus our comparison on parameters of low order, which are given in Table LABEL:tbl:ParametersComparison. Deuterium substitution leads to a decrease in the F, , and parameters as well in the rotational constant . A similar change in these parameters is traced in deuterated methanol by Walsh et al. (2000). One can notice as well a change in sign of the parameter. As discussed earlier, the sign of parameter cannot be determined from the energy level positions, and in our work we adopted the sign choice which matches the relative signs of dipole moment components used for the main isotopologue of methyl mercaptan. The experimental check of relative intensities of a number of transitions showed that D and D sign choice corresponds to positive value in the case of \ceCH3SD and to negative value in the case of \ceCH3SH. Further comparison of low-order parameters shows that we use two fewer fourth-order parameters than in (Xu et al. 2012). Our number of fourth-order parameters (22) is consistent with the total number of determinable parameters for the fourth-order as calculated from the difference between the total number of symmetry-allowed fourth-order Hamiltonian terms and symmetry-allowed third-order contact transformation terms (Nakagawa et al. (1987)). The input and output files of the global fit are included in the supplementary data.
| c | d | |||
|---|---|---|---|---|
| 0 | 1004 | 18 | 53 | 54 |
| 1 | 1072 | 18 | 51 | 47 |
| 3 | 848 | 17 | 42 | 53 |
| 2 | 944 | 16 | 43 | 47 |
| 3 | 514 | 14 | 36 | 57 |
| 4 | 523 | 15 | 35 | 55 |
4 Observational results
The Protostellar Interferometric Line Survey (PILS; project-id: 2013.1.00278.S, PI: Jes K. Jørgensen222http://youngstars.nbi.dk/PILS/) is an unbiased molecular line survey of the Class 0 protostellar binary IRAS 162932422 carried out in Band 7 of ALMA and covering 329.15362.90 GHz at 0.244 MHz spectral resolution. Details of the survey have been presented by Jørgensen et al. (2016). The binary is close-by at a distance of 141 pc (Dzib et al. 2018); source A and source B are clearly distinguished at the high spatial resolution of the survey of 0.5 and their separation of 5.3. The spectral sensitivity is also very high, 710 mJy beam-1 channel-1 or 45 mJy beam-1 km s-1 such that line confusion is reached in parts of the survey. This high sensitivity is very important for searching for less abundant molecules or for minor isotopic species of somewhat more abundant molecules. Many of our analyses focused on source B because of its smaller lines widths of 1 km s-1 compared to around 3 km s-1 for source A. Among the most exciting results is the detection of methyl chloride toward both sources as the first interstellar organohalogen compound (Fayolle et al. 2017) in addition to the numerous deuterated molecules mentioned in Section 1.
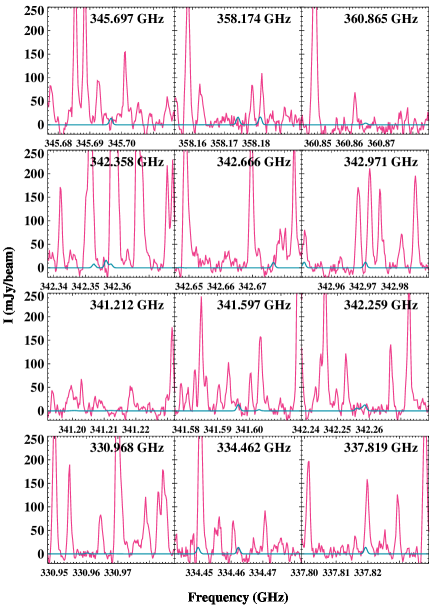
Drozdovskaya et al. (2018) analyze column densities of several sulfur-containing molecules in the vicinity of source B and compared these with data for comet 67P/Churyumov-Gerasimenko. A position offset by 0.5 from source B in the SW direction was used in the analysis, as in most of our studies of source B. There, the effects of absorption and high line opacities are reduced, which could make the analyses more complicated. We analyzed the PILS data for lines of \ceCH3SD similarly to what Drozdovskaya et al. (2018) did for \ceCH3SH. We adopted an excitation temperature K, a source size of 0.5, and a full line width at half maximum (FWHM) of 1 km s-1. We did not detect \ceCH3SD, but we derived an upper limit on its column density of cm-2 (). The 12 most constraining lines are shown in Fig. 3. Drozdovskaya et al. (2018) determined a column density of cm-2 () for \ceCH3SH 333The value differs from Drozdovskaya et al. (2018) because the correction factor of 1.14 for the higher dust background temperature (21K) was not included in the paper.. Our upper limit corresponds thus to a D/H ratio of less than ; the uncertainty was estimated as previously (Drozdovskaya et al. 2018). This value is probably not particularly constraining compared with the deuteration of \ceH2CS per H atom of (Drozdovskaya et al. 2018). Deeper interferometric observations are required in order to conclusively verify whether the level of deuteration of \ceH2CS is lower, higher, or preserved at the next level of chemical complexity into \ceCH3SH.
5 Conclusion and outlook
In the present work, the rotational spectrum of \ceCH3SD has been investigated in the frequency range 150510 GHz in order to provide accurate predictions for astronomical searches. Extensive assignments have been made for the ground, first, and second excited torsional states up to high and quantum numbers (see Table 1). The detailed modeling of the absorption spectra of the \ceCH3SD has been performed in a global fit of a dataset of 4905 rotational transitions to the RAM Hamiltonian containing 78 parameters. The overall weighted standard deviation of the global fit is 0.9 in the range 150 to 510 GHz, indicating that our set of parameters reproduces the assigned lines within experimental uncertainties. Transition frequencies calculated from these parameters should be reliable for astronomical observations. A first attempt to search for \ceCH3SD in the PILS data turned out to be negative. The upper limit, though not unreasonable, is not very constraining either. Future, even more sensitive observations may provide insight into the deuteration of \ceCH3SH. A search for the potentially more abundant \ceCH2DSH was hampered by insufficient laboratory data reported for this isotopolog.
Calculations of the rotational spectrum of \ceCH3SD will be available in the catalog section of the Cologne Database for Molecular Spectroscopy, CDMS, (Endres et al. 2016). The input and output files of the fit as well as auxiliary files are available in the data section of the CDMS444https://cdms.astro.uni-koeln.de/classic/predictions/daten/Methanethiol/.
Acknowledgements.
The work in Cologne was supported by the Deutsche Forschungsgemeinschaft (DFG) in the framework of the collaborative research grant SFB 956, project B3. O.Z. is funded by the DFG via the Gerätezentrum “Cologne Center for Terahertz Spectroscopy”. The work in Kharkiv was done under support of the Volkswagen foundation. The assistance of the Science and Technology Center in the Ukraine is acknowledged (STCU partner project P686). M.N.D. acknowledges the financial support of the Center for Space and Habitability (CSH) Fellowship and the IAU Gruber Foundation Fellowship. J.K.J. acknowledges support from the European Research Council (ERC) under the European Union’s Horizon 2020 research and innovation program through ERC Consolidator Grant “S4F” (grant agreement No 646908). This paper makes use of the following ALMA data: ADS/JAO.ALMA#2013.1.00278.S. ALMA is a partnership of ESO (representing its member states), NSF (USA) and NINS (Japan), together with NRC (Canada) and NSC and ASIAA (Taiwan), in cooperation with the Republic of Chile. The Joint ALMA Observatory is operated by ESO, AUI/NRAO and NAOJ.References
- Bettens et al. (1999) Bettens, F. L., Sastry, K. V. L. N., Herbst, E., et al. 1999, The Astrophysical Journal, 510, 789
- Bossa et al. (2014) Bossa, J.-B., Ordu, M. H., Müller, H. S. P., Lewen, F., & Schlemmer, S. 2014, A&A, 570, A12
- Buckle & Fuller (2003) Buckle, J. V. & Fuller, G. A. 2003, A&A, 399, 567
- Burkhardt et al. (2018) Burkhardt, A. M., Herbst, E., Kalenskii, S. V., et al. 2018, MNRAS, 474, 5068
- Calcutt et al. (2018) Calcutt, H., Jørgensen, J. K., Müller, H. S. P., et al. 2018, ArXiv e-prints [arXiv:1804.09210]
- Ceccarelli et al. (2007) Ceccarelli, C., Caselli, P., Herbst, E., Tielens, A. G. G. M., & Caux, E. 2007, Protostars and Planets V, 47
- Cernicharo et al. (2012) Cernicharo, J., Marcelino, N., Roueff, E., et al. 2012, ApJ, 759, L43
- Cernicharo et al. (2013) Cernicharo, J., Tercero, B., Fuente, A., et al. 2013, ApJ, 771, L10
- Chantzos et al. (2018) Chantzos, J., Spezzano, S., Caselli, P., et al. 2018, ApJ, 863, 126
- Charnley (1997) Charnley, S. B. 1997, The Astrophysical Journal, 481, 396
- Coutens et al. (2016) Coutens, A., Jørgensen, J. K., van der Wiel, M. H. D., et al. 2016, A&A, 590, L6
- Coutens et al. (2018) Coutens, A., Willis, E. R., Garrod, R. T., et al. 2018, A&A, 612, A107
- Crapsi et al. (2005) Crapsi, A., Caselli, P., Walmsley, C. M., et al. 2005, ApJ, 619, 379
- Drozdovskaya et al. (2018) Drozdovskaya, M. N., van Dishoeck, E. F., Jørgensen, J. K., et al. 2018, Monthly Notices of the Royal Astronomical Society, 476, 4949
- Dzib et al. (2018) Dzib, S. A., Ortiz-León, G. N., Hernández-Gómez, A., et al. 2018, A&A, 614, A20
- Endres et al. (2016) Endres, C. P., Schlemmer, S., Schilke, P., Stutzki, J., & Müller, H. S. P. 2016, Journal of Molecular Spectroscopy, 327, 95
- Fayolle et al. (2017) Fayolle, E. C., Öberg, K. I., Jørgensen, J. K., et al. 2017, Nature Astronomy, 1, 703
- Fontani et al. (2011) Fontani, F., Palau, A., Caselli, P., et al. 2011, A&A, 529, L7
- Fuente et al. (2016) Fuente, A., Cernicharo, J., Roueff, E., et al. 2016, A&A, 593, A94
- Gibb et al. (2000) Gibb, E., Nummelin, A., Irvine, W. M., Whittet, D. C. B., & Bergman, P. 2000, The Astrophysical Journal, 545, 309
- Hatchell et al. (1998a) Hatchell, J., Thompson, M. A., Millar, T. J., & MacDonald, G. H. 1998a, A&AS, 133, 29
- Hatchell et al. (1998b) Hatchell, J., Thompson, M. A., Millar, T. J., & MacDonald, G. H. 1998b, A&A, 338, 713
- Herpin et al. (2009) Herpin, F., Marseille, M., Wakelam, V., Bontemps, S., & Lis, D. C. 2009, A&A, 504, 853
- Ilyushin et al. (2003) Ilyushin, V., Alekseev, E., Dyubko, S., & Kleiner, I. 2003, Journal of Molecular Spectroscopy, 220, 170
- Ilyushin et al. (2013) Ilyushin, V. V., Endres, C. P., Lewen, F., Schlemmer, S., & Drouin, B. J. 2013, Journal of Molecular Spectroscopy, 290, 31
- Ilyushin et al. (2010) Ilyushin, V. V., Kisiel, Z., Pszczókowski, L., Mäder, H., & Hougen, J. T. 2010, Journal of Molecular Spectroscopy, 259, 26
- Jørgensen et al. (2018) Jørgensen, J. K., Müller, H. S. P., Calcutt, H., et al. 2018, ArXiv e-prints [arXiv:1808.08753]
- Jørgensen et al. (2016) Jørgensen, J. K., van der Wiel, M. H. D., Coutens, A., et al. 2016, A&A, 595, A117
- Kojima (1960) Kojima, T. 1960, Journal of the Physical Society of Japan, 15, 1284
- Kojima & Nishikawa (1957) Kojima, T. & Nishikawa, T. 1957, Journal of the Physical Society of Japan, 12, 680
- Kolesniková et al. (2014) Kolesniková, L., Tercero, B., Cernicharo, J., et al. 2014, ApJ, 784, L7
- Lee et al. (2017) Lee, C.-F., Li, Z.-Y., Ho, P. T. P., et al. 2017, ApJ, 843, 27
- Lees & Mohammadi (1980) Lees, R. M. & Mohammadi, M. A. 1980, Canadian Journal of Physics, 58, 1640
- Lees et al. (2018) Lees, R. M., Xu, L.-H., Guislain, B. G., et al. 2018, Journal of Molecular Spectroscopy, 343, 18
- Linke et al. (1979) Linke, R. A., Frerking, M. A., & Thaddeus, P. 1979, ApJ, 234, L139
- Majumdar et al. (2016) Majumdar, L., Gratier, P., Vidal, T., et al. 2016, MNRAS, 458, 1859
- May & Pace (1968) May, I. W. & Pace, E. 1968, Spectrochimica Acta Part A: Molecular Spectroscopy, 24, 1605
- Millar et al. (1989) Millar, T. J., Bennett, A., & Herbst, E. 1989, ApJ, 340, 906
- Müller et al. (2016) Müller, H. S. P., Belloche, A., Xu, L.-H., et al. 2016, A&A, 587, A92
- Nakagawa et al. (1987) Nakagawa, K., Tsunekawa, S., & Kojima, T. 1987, Journal of Molecular Spectroscopy, 126, 329
- Persson et al. (2018) Persson, M. V., Jørgensen, J. K., Müller, H. S. P., et al. 2018, A&A, 610, A54
- Potapov et al. (2016) Potapov, A., Sánchez-Monge, Á., Schilke, P., et al. 2016, A&A, 594, A117
- Richard et al. (2013) Richard, C., Margulès, L., Caux, E., et al. 2013, A&A, 552, A117
- Ruffle et al. (1999) Ruffle, D. P., Hartquist, T. W., Caselli, P., & Williams, D. A. 1999, Monthly Notices of the Royal Astronomical Society, 306, 691
- Sastry et al. (1986) Sastry, K., herbst, E., Booker, R. A., & Lucia, F. C. D. 1986, Journal of Molecular Spectroscopy, 116, 120
- Smirnov et al. (2014) Smirnov, I. A., Alekseev, E. A., Ilyushin, V. V., et al. 2014, Journal of Molecular Spectroscopy, 295, 44
- Solimene & Dailey (1955) Solimene, N. & Dailey, B. P. 1955, The Journal of Chemical Physics, 23, 124
- Spezzano et al. (2013) Spezzano, S., Brünken, S., Schilke, P., et al. 2013, ApJ, 769, L19
- Spezzano et al. (2016) Spezzano, S., Gupta, H., Brünken, S., et al. 2016, A&A, 586, A110
- Tsunekawa et al. (1989a) Tsunekawa, S., Taniguchi, I., Tambo, A., et al. 1989a, Journal of Molecular Spectroscopy, 134, 63
- Tsunekawa et al. (1989b) Tsunekawa, S., Taniguchi, I., Tambo, A., et al. 1989b, Journal of Molecular Spectroscopy, 134, 63
- Turner (1977) Turner, B. E. 1977, Astrophysical Journal, 213, L75
- van der Tak et al. (2003) van der Tak, F. F. S., Boonman, A. M. S., Braakman, R., & van Dishoeck, E. F. 2003, A&A, 412, 133
- Vastel et al. (2018) Vastel, C., Quénard, D., Le Gal, R., et al. 2018, MNRAS, 478, 5514
- Wakelam et al. (2011) Wakelam, V., Hersant, F., & Herpin, F. 2011, A&A, 529, A112
- Walsh et al. (2000) Walsh, M., Xu, L.-H., Lees, R., et al. 2000, Journal of Molecular Spectroscopy, 204, 60
- Xu et al. (2008) Xu, L.-H., Fisher, J., Lees, R., et al. 2008, Journal of Molecular Spectroscopy, 251, 305
- Xu et al. (2012) Xu, L.-H., Lees, R. M., Crabbe, G. T., et al. 2012, The Journal of Chemical Physics, 137, 104313