Generalizability of predictive models for intensive care unit patients
Abstract
A large volume of research has considered the creation of predictive models for clinical data; however, much existing literature reports results using only a single source of data. In this work, we evaluate the performance of models trained on the publicly-available eICU Collaborative Research Database. We show that cross-validation using many distinct centers provides a reasonable estimate of model performance in new centers. We further show that a single model trained across centers transfers well to distinct hospitals, even compared to a model retrained using hospital-specific data. Our results motivate the use of multi-center datasets for model development and highlight the need for data sharing among hospitals to maximize model performance.
1 Introduction
The intensive care unit (ICU) admits severely ill patients in order to provide radical, life-saving treatment. ICUs frequently have high staff to patient ratio in order to facilitate continuous monitoring of all patients and to ensure that deterioration in patient condition is detected, and corrected, before it becomes fatal. This approach is demonstrated to improve patient outcomes [12]. As a result, the ICU is a data-rich environment.
Major efforts have been placed in utilizing this data to quantify patient health and to predict future outcomes. One of the most immediately relevant outcomes to the ICU is patient mortality. The APACHE system, first published in [15], provides predictions for patient mortality based upon data collected in the ICU. While the initial system was based off expert rules, later updates used data driven methods [30]. Numerous other prediction systems have also been developed [14, 17, 16, 28, 18, 7]; for a review of severity illness scores in the ICU, see [26] and [13].
With recent advances in both machine learning and hardware for data archiving, research has begun to return to building better prediction models using more detailed granular data. The use of mortality prediction models to evaluate ICUs as a whole has found great success, both for capturing patient severity of illness and for risk-adjustment of patient populations [6, 25, 9, 2, 27, 21, 22, 19, 3, 4, 1, 20].
We hypothesize that a model trained on ICU data from one institution will perform considerably worse when assessed at other ICUs, even when those institutions use the same vendor for collection of data. This expectation of model generalizability reflects known distributional differences in data that result from differing care and data-recording practices among ICUs. Such distributional differences complicate model generalizability in the absence of specialized approaches [29, 5]. We further investigate a learning approach for deploying a prediction model, comparing a transferred model to one that is developed using only local data. We hypothesize that the local model will initially have poor performance, but with sufficient sample size will outperform the transferred model.
2 Data
We utilize the eICU Collaborative Research Database (eICU-CRD) v2.0 [11], a publicly available multi-center database sourced from the Philips eICU programme, a tele-medicine initiative where healthcare workers remotely monitor acutely ill patients. All data in eICU-CRD has been de-identified. The eICU-CRD contains 200,859 distinct unit stays, from which we exclude non-ICU stays and ICU stays for which an APACHE IVa score is not available. The last exclusion criteria implicitly applies APACHE IVa exclusion criteria in order to mitigate issues around repeated sampling, ensure sufficient support, and remove admissions which appear in the database for administrative purproses [30]. After applying these exclusions, we removed hospitals which had less than 500 stays, as we aimed to evaluate performance hospital-wise. The final cohort contained 50,106 ICU stays across 46 hospitals. Details of this cohort can be found in Appendix A, which contains demographic data generated using tableone [24].
Feature Extraction
For each ICU stay, we extracted data from a fixed window of length (hours) starting on ICU admission. Features extracted from the window of fixed size are detailed in Appendix B. The features were extracted from a number of physiologic and laboratory measurements. Notably, no explicit data regarding treatment was extracted (e.g. use of vasopressors, mechanical ventilation, dialysis, etc). In addition to those listed in Appendix 2, we extracted gender, age, race, and whether the hospital admission was for an elective surgery (binary covariate). A total of 82 features were extracted.
3 Methods
We evaluated logistic regression (LR) models trained using L2 regularization, created using scikit-learn v0.20.0 [23]. The outcome evaluated was in-hospital mortality. The area under the receiver operator characteristic curve (AUROC) was used to evaluate discrimination of models, while the Standardized Mortality Ratio (SMR)111Standardized Mortality Ratio (SMR) is the observed proportion of patients who died divided by the expected proportion of patient death (given probabilistic risks of patient mortality). was used to evaluate the calibration of models.
Experiments
We split our cohort evenly into training and test sets hospital-wise. We train a single LR model on the training data and evaluate it on each hospital separately via the AUROC and the SMR. We experimented with domain transfer but it did not noticably impact model performance (Appendix C).
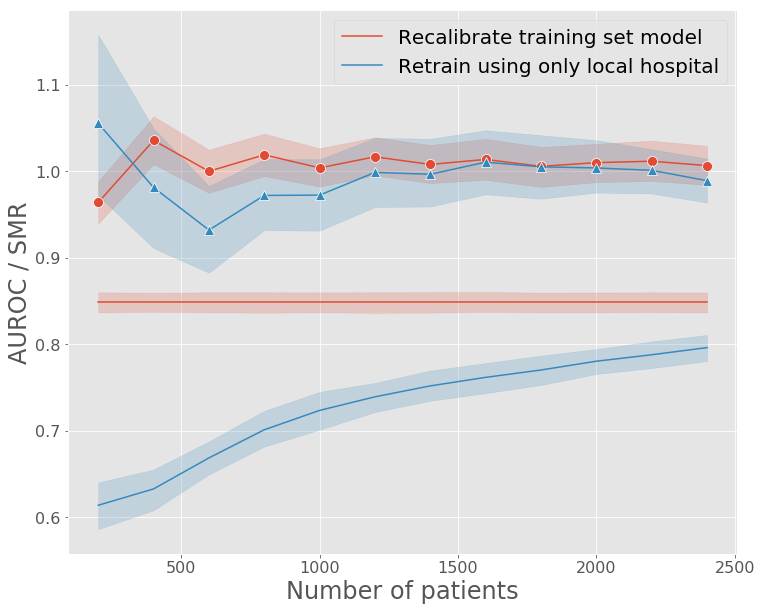
For our second experiment, we select a single hospital and set aside 500 patients. We then iteratively sample sets of 200 patients without replacement as our recalibration dataset, i.e. we increase the size of this recalibration set by 200 patients each iteration. At all iterations, we (i) recalibrate222Recalibration involves training a univariable logistic regression with hospital mortality as the outcome, effectively shifting and scaling model predictions. the previous model developed using all hospitals in the training set (“transferred“ model), and (ii) develop a new model using only data available at the current iteration (“local” model). We evaluate models on the 500 patients initially held out. To ensure stability of estimates we repeat this procedure 50 times after randomly reshuffling data and subsequently plot average performance for the transferred and local models.
We recognize that it can be difficult to fully specify cohort definitions and analyses approaches in critical care [10], and as such we have made our code available for closer study [8].333https://github.com/alistairewj/icu-model-transfer
4 Results
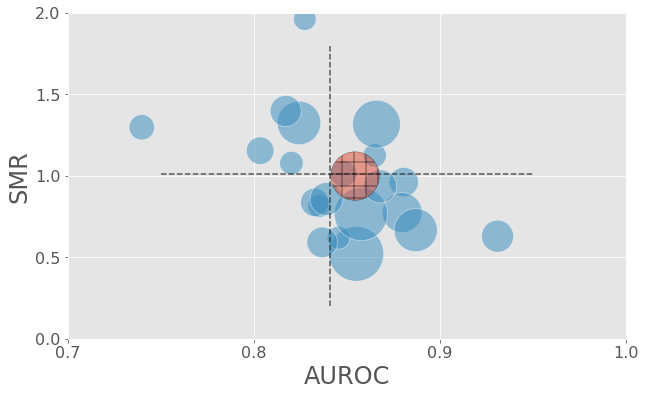
The AUROC across 5-fold CV on eICU-CRD was 0.854 and the SMR was 0.998. Figure 1 shows AUROC and SMR on held-out hospitals were distributed around the cross-validation performance. The AUROC ranged from 0.688 to 0.933, and the SMR ranged from 0.560 to 1.43.
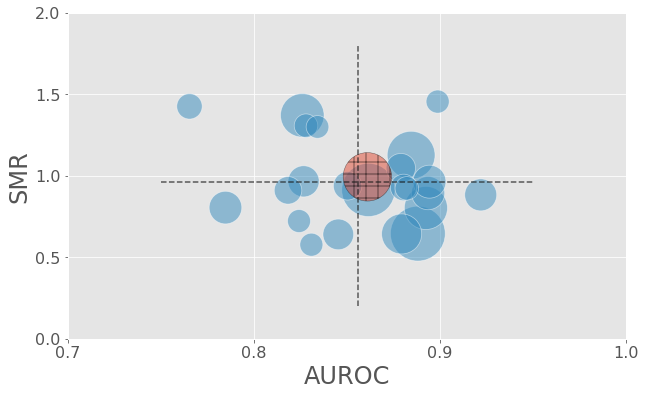
Figure 2 shows the performance of the recalibration experiment on hospital 73, the largest hospital in the test set. SMRs for both models are reasonable, with the local model initially overpredicting mortality (SMR 1.0), and eventually converging to the ideal value (1.0). The AUROC of the transferred model is constant at 0.849, which is expected as the recalibration procedure is a monotonic transform which cannot improve pairwise measures such as AUROC. The AUROC of the local model is initially poor (0.614), and after 2,400 patients has significantly improved to 0.796, but is still below the transferred model’s AUROC. Other hospitals assessed in this way exhibited similar patterns (two other hospitals are shown in Appendix D).
5 Discussion and Related Work
We have evaluated the performance of a model trained using data from many centers and applied to held out hospitals from the continental United States. We found that the cross-validation estimate of performance consistently over-estimated performance on the external hospitals but not by an impractical amount. Notable was the large variance in hospital performance, and there was no consistent pattern of degradation in performance.
Our recalibration experiment assessed how well models transfer to held out hospitals as compared to locally developed models. Local models tended to be well calibrated after reasonable numbers of patients. In terms of discrimination, the local model would likely continue to improve if more data were available in eICU-CRD, but it is noteworthy that even after large sample sizes these models still had inferior discrimination to the transferred models. An extremely common approach in healthcare is for hospitals to quarantine their data, often citing reasonable privacy concerns, and develop models internally. While the amount of data archived from healthcare institutions has dramatically increased in the past decade, many prediction problems of interest require specialized cohorts which results in low sample sizes. Isolating model development to individual hospitals appears to be detrimental to overall model performance, and significant gains are available when data from multiple hospitals is pooled for model development. Our results indicate that research into safe and secure ways of sharing patient data may be a good avenue for improving performance of predictive models.
There are limitations to our study. We only evaluated mortality prediction models, and did not assess other types of predictive models. However, we believe our results will hold for other predictive models in the ICU. Our feature set was also a small subset of what is available in eICU-CRD. Specifically, we did not utilize any data regarding patient treatment, high granularity vital signs, or patient intake. The incorporation of information from these sources may improve model performance and generalizability. Finally, our results only assess logistic regression as a modelling methodology, though we have found similar results for non-linear approaches such as gradient boosting.
6 Conclusion
We have shown that classic in-hospital mortality models trained on publicly-accessible data exhibit varying degrees of decreased performance when applied to external hospital data, both with and without hospital-specific normalization. The results agree with common intuition about relative model performance decreasing on external datasets, but provide empirical assessment of the magnitude of this effect. We further showed that large sample sizes are needed from individual hospitals before performance is close to that achieved by a transfered model from a pooled collection of distinct training data. This result highlights the importance of data sharing in the development of high performance predictive models.
Acknowledgements
This research was funded in part by grants from the National Institutes of Health (NIH): NIH-R01-EB017205, NIH-R01-EB001659, and NIH-R01-GM104987.
References
- [1] Karla L Caballero Barajas and Ram Akella. Dynamically modeling patient’s health state from electronic medical records: A time series approach. In Proceedings of the 21th ACM SIGKDD International Conference on Knowledge Discovery and Data Mining, pages 69–78. ACM, 2015.
- [2] Luca Citi and Riccardo Barbieri. Physionet 2012 challenge: Predicting mortality of icu patients using a cascaded svm-glm paradigm. In Computing in Cardiology (CinC), 2012, pages 257–260. IEEE, 2012.
- [3] Marzyeh Ghassemi, Tristan Naumann, Finale Doshi-Velez, Nicole Brimmer, Rohit Joshi, Anna Rumshisky, and Peter Szolovits. Unfolding physiological state: Mortality modelling in intensive care units. In Proceedings of the 20th ACM SIGKDD international conference on Knowledge discovery and data mining, pages 75–84. ACM, 2014.
- [4] Marzyeh Ghassemi, Marco A F Pimentel, Tristan Naumann, Thomas Brennan, David A Clifton, Peter Szolovits, and Mengling Feng. A multivariate timeseries modeling approach to severity of illness assessment and forecasting in icu with sparse, heterogeneous clinical data. In Proceedings of the… AAAI Conference on Artificial Intelligence. AAAI Conference on Artificial Intelligence, volume 2015, page 446. NIH Public Access, 2015.
- [5] Jen J Gong, Thoralf M Sundt, James D Rawn, and John V Guttag. Instance weighting for patient-specific risk stratification models. In Proceedings of the 21th ACM SIGKDD International Conference on Knowledge Discovery and Data Mining, pages 369–378. ACM, 2015.
- [6] Caleb W Hug and Peter Szolovits. Icu acuity: Real-time models versus daily models. In AMIA, 2009.
- [7] A. E. W. Johnson, Andrew A Kramer, and Gari D Clifford. A new severity of illness scale using a subset of acute physiology and chronic health evaluation data elements shows comparable predictive accuracy. Critical Care Medicine, 41(7):1711–1718, 2013.
- [8] Alistair Johnson. alistairewj/icu-model-transfer: ICU Model Transfer v1.0, December 2018.
- [9] Alistair E W Johnson, Nic Dunkley, Louis Mayaud, Athanasios Tsanas, Andrew A Kramer, and Gari D Clifford. Patient specific predictions in the intensive care unit using a bayesian ensemble. In Computing in Cardiology (CinC), 2012, pages 249–252. IEEE, 2012.
- [10] Alistair E. W. Johnson, Tom J. Pollard, and Roger G. Mark. Reproducibility in critical care: a mortality prediction case study. In Finale Doshi-Velez, Jim Fackler, David Kale, Rajesh Ranganath, Byron Wallace, and Jenna Wiens, editors, Proceedings of the 2nd Machine Learning for Healthcare Conference, volume 68 of Proceedings of Machine Learning Research, pages 361–376, Boston, Massachusetts, 18–19 Aug 2017. PMLR.
- [11] Alistair EW Johnson, Tom J Pollard, and Roger G Mark. eicu collaborative research database, 2017.
- [12] R L Kane, T A Shamliyan, C Mueller, S Duval, and T J Wilt. The association of registered nurse staffing levels and patient outcomes: Systematic review and meta-analysis. Medical Care, 45(12):1195–1204, December 2007.
- [13] Mark T Keegan, Ognjen Gajic, and Bekele Afessa. Severity of illness scoring systems in the intensive care unit. Critical care medicine, 39(1):163–169, 2011.
- [14] W A Knaus, D P Wagner, E A Draper, J E Zimmerman, M Bergner, C A Bastos, P G snd Sirio, D J Murphy, T Lotring, A Damiano, and F E Harrell Jr. The APACHE III prognostic system: Risk prediction of hospital mortality for critically ill hospitalized adults. Chest, 100(6):1619–1636, 1991.
- [15] W A Knaus, J E Zimmerman, D P Wagner, E A Draper, and D E Lawrence. APACHE-acute physiology and chronic health evaluation: A physiologically based classification system. Critical Care Medicine, 9:591–597, 1981.
- [16] J R Le Gall, S Lemeshow, and F Saulnier. A new Simplified Acute Physiology Score (SAPS-II) based on a European/North American multicenter study. JAMA, 270(24):2957–63, 1993.
- [17] J R Le Gall, P Loirat, F Nicolas, C Granthil, F Wattel, R Thomas, P Glaser, P Mercier, J Latournerie, P Candau, et al. Use of a severity index in 8 multidisciplinary resuscitation centers. Presse medicale (Paris, France: 1983), 12(28):1757–1761, 1983.
- [18] Jean Roger Le Gall, Janelle Klar, Stanley Lemeshow, Fabienne Saulnier, Corinne Alberti, Antonio Artigas, and Daniel Teres. The logistic organ dysfunction system: a new way to assess organ dysfunction in the intensive care unit. Jama, 276(10):802–810, 1996.
- [19] Li-Wei H Lehman, Mohammed Saeed, William J Long, Joon Lee, and Roger G Mark. Risk stratification of icu patients using topic models inferred from unstructured progress notes. In AMIA. Citeseer, 2012.
- [20] Yuan Luo, Yu Xin, Rohit Joshi, Leo Celi, and Peter Szolovits. Predicting icu mortality risk by grouping temporal trends from a multivariate panel of physiologic measurements. In AAAI, pages 42–50, 2016.
- [21] Martin Macaš, Jakub Kuzilek, Tadeáš Odstrčilík, and Michal Huptych. Linear bayes classification for mortality prediction. In Computing in Cardiology (CinC), 2012, pages 473–476. IEEE, 2012.
- [22] Sean McMillan, Chih-Chun Chia, Alexander Van Esbroeck, Ilan Rubinfeld, and Zeeshan Syed. Icu mortality prediction using time series motifs. In Computing in Cardiology (CinC), 2012, pages 265–268. IEEE, 2012.
- [23] Fabian Pedregosa, Gaël Varoquaux, Alexandre Gramfort, Vincent Michel, Bertrand Thirion, Olivier Grisel, Mathieu Blondel, Peter Prettenhofer, Ron Weiss, Vincent Dubourg, et al. Scikit-learn: Machine learning in python. Journal of Machine Learning Research, 12(Oct):2825–2830, 2011.
- [24] Tom J Pollard, Alistair EW Johnson, Jesse D Raffa, and Roger G Mark. tableone: An open source python package for producing summary statistics for research papers. JAMIA Open, 2018.
- [25] Ikaro Silva, George Moody, Daniel J Scott, Leo A Celi, and Roger G Mark. Predicting in-hospital mortality of icu patients: The physionet/computing in cardiology challenge 2012. In Computing in Cardiology (CinC), 2012, pages 245–248. IEEE, 2012.
- [26] K Strand and H Flaatten. Severity scoring in the icu: A review. Acta Anaesthesiologica Scandinavica, 52(4):467–478, 2008.
- [27] Srinivasan Vairavan, Larry Eshelman, Syed Haider, Abigail Flower, and Adam Seiver. Prediction of mortality in an intensive care unit using logistic regression and a hidden markov model. In Computing in Cardiology (CinC), 2012, pages 393–396. IEEE, 2012.
- [28] J-L Vincent, R Moreno, J Takala, S Willats, A De Mendoca, H Bruining, C K Reinhart, P M Suter, and L G Thijs. The SOFA (Sepsis-related Organ Failure Assessment) score to describe organ dysfunction/failure. Intensive Care Medicine, 22:707–710, 1996.
- [29] Jenna Wiens, John Guttag, and Eric Horvitz. A study in transfer learning: Leveraging data from multiple hospitals to enhance hospital-specific predictions. Journal of the American Medical Informatics Association, 21(4):699–706, 2014.
- [30] J E Zimmerman and A A Kramer. Outcome prediction in critical care: the Acute Physiology and Chronic Health Evaluation models. Current Opinion in Critical Care, 14:491–497, 2008.
Appendix A Demographics for eICU-CRD
Demographics for the cohort are shown in Table 1.
| Demographic | Value |
|---|---|
| Number of ICU stays | 50106 |
| Hospital LOS (days) | 5.53 [3.27,9.13] |
| Male | 27833 (55.55) |
| Female | 22273 (44.45) |
| Age (years) | 63.00 [52.00,74.00] |
| Elective Surgery | 11348 (22.65) |
| Race | |
| White | 40998 (81.82) |
| African Americans | 6720 (13.41) |
| Asian | 631 (1.26) |
| Hispanic | 1757 (3.51) |
Appendix B Full list of features and window sizes
| Time window | Feature extracted | Variables |
|---|---|---|
| First, Last | Heart rate, Systolic/Diastolic/Mean blood pressure, Respiratory rate, Temperature, Oxygen Saturation, Glasgow coma scale | |
| First, last | Base excess, Calcium, Partial pressure of oxygen in arterial blood, Partial pressure of carbon dioxide in arterial blood, pH, Ratio of partial pressure of oxygen to fraction of oxygen inspired, Total carbon dioxide concentration | |
| First, last | Albumin, Blood urea nitrogen, Immature band forms, Bicarbonate, Bilirubin, Creatinine, Hematocrit, Hemoglobin, Lactate, Platelet, Potassium, International Normalized Ratio, Sodium, White blood cell count | |
| Sum | Urine output |
Features extracted used consistent functional forms: the first, last, or sum (in the case of urine output) value was extracted from all measurements of the variable made within first 24 hours. As laboratory values are less frequently sampled, this window was extended 24 hours backward for these measurements.
Appendix C Domain transfer for improving model performance
For each hospital in the test set of eICU-CRD, we rescaled the data using means and standard deviations as calculated on the test set hospital. We compare this to our standard approach which uses the mean and standard deviation of the entire training set to rescale the data. Figure 3 shows the performance across test hospitals as measured by the AUROC and SMR. We found no noticably difference between the two methods.
Appendix D Transfer performance in other hospitals
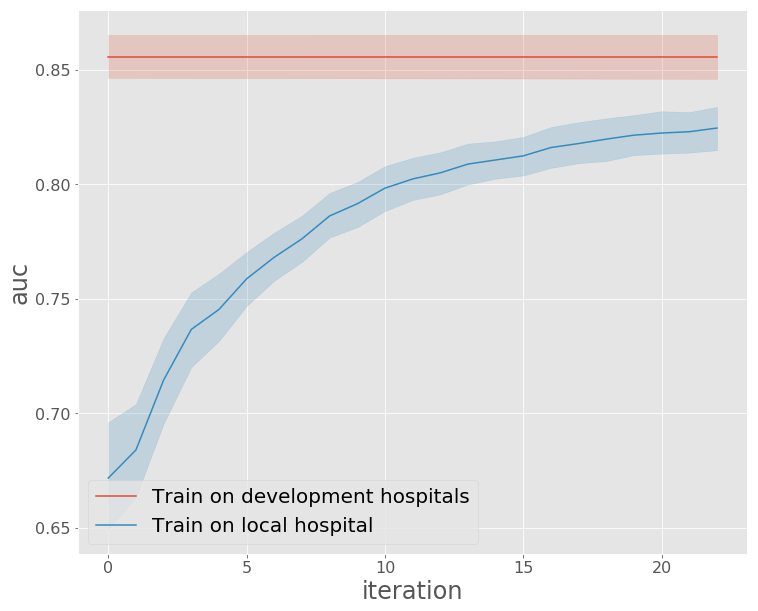
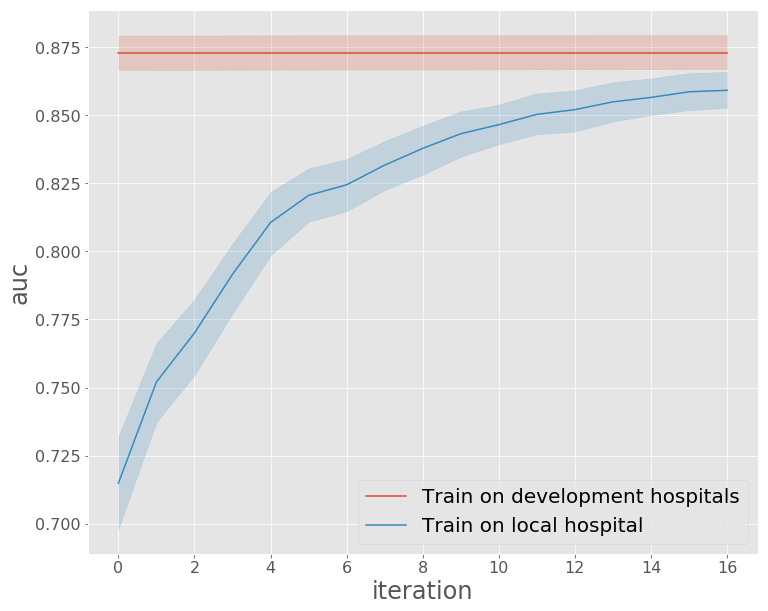
Figure 4 shows AUROC performance of a model developed on the eICU-CRD training set and recalibrated iteratively to a held-out hospital dataset as described in the paper. Figure 5 shows the same results for a distinct hospital.
