∎
22email: abadawy@usc.edu 33institutetext: Aseel Addawood 44institutetext: University of Illinois at Urbana-Champaign
44email: aaddaw2@illinois.edu 55institutetext: Kristina Lerman 66institutetext: USC Information Sciences Institute
66email: lerman@isi.edu 77institutetext: Emilio Ferrara 88institutetext: USC Information Sciences Institute
88email: emiliofe@usc.edu
Characterizing the 2016 Russian IRA Influence Campaign
Abstract
Until recently, social media were seen to promote democratic discourse on social and political issues. However, this powerful communication ecosystem has come under scrutiny for allowing hostile actors to exploit online discussions in an attempt to manipulate public opinion. A case in point is the ongoing U.S. Congress investigation of Russian interference in the 2016 U.S. election campaign, with Russia accused of, among other things, using trolls (malicious accounts created for the purpose of manipulation) and bots (automated accounts) to spread propaganda and politically biased information. In this study, we explore the effects of this manipulation campaign, taking a closer look at users who re-shared the posts produced on Twitter by the Russian troll accounts publicly disclosed by U.S. Congress investigation. We collected a dataset of 13 million election-related posts shared on Twitter in the year of 2016 by over a million distinct users. This dataset includes accounts associated with the identified Russian trolls as well as users sharing posts in the same time period on a variety of topics around the 2016 elections. We use label propagation to infer the users’ ideology based on the news sources they share. We are able to classify a large number of the users as liberal or conservative with precision and recall above 84%. Conservative users who retweet Russian trolls produced significantly more tweets than liberal ones, about 8 times as many in terms of tweets. Additionally, trolls’ position in the retweet network is stable overtime, unlike users who retweet them who form the core of the election-related retweet network by the end of 2016. Using state-of-the-art bot detection techniques, we estimate that about 5% and 11% of liberal and conservative users are bots, respectively. Text analysis on the content shared by trolls reveal that conservative trolls talk about refugees, terrorism, and Islam; while liberal trolls talk more about school shootings and the police. Although an ideologically broad swath of Twitter users were exposed to Russian trolls in the period leading up to the 2016 U.S. Presidential election, it is mainly conservatives who help amplify their message.
Keywords:
Social media manipulation Russian trolls Bots Influence campaignsAcknowledgements.
The authors gratefully acknowledge support by the Air Force Office of Scientific Research (award #FA9550-17-1-0327). The views and conclusions contained herein are those of the authors and should not be interpreted as necessarily representing the official policies or endorsements, either expressed or implied, of AFOSR or the U.S. Government.1 Introduction
Social media have helped foster democratic conversation about social and political issues: from the Arab Spring González-Bailón et al. (2011), to Occupy Wall Street movements Conover et al. (2013a, b) and other civil protests González-Bailón et al. (2013); Varol et al. (2014); Stella et al. (2018), Twitter and other social media platforms appeared to play an instrumental role in involving the public in policy and political conversations by collectively framing the narratives related to particular social issues, and coordinating online and off-line activities. The use of digital media for political discussions during presidential elections is examined by many studies, including the past four U.S. Presidential elections Adamic and Glance (2005); Diakopoulos and Shamma (2010); Bekafigo and McBride (2013); Carlisle and Patton (2013); DiGrazia et al. (2013), and other countries like Australia Gibson and McAllister (2006); Bruns and Burgess (2011), and Norway Enli and Skogerbø (2013). Findings that focus on the positive effects of social media, such as increasing voter turnout Bond et al. (2012) or exposure to diverse political views Bakshy et al. (2015) contribute to the general praise of these platforms as a tool for promoting democracy and civic engagement Shirky (2011); Loader and Mercea (2011); Effing et al. (2011); Tufekci and Wilson (2012); Tufekci (2014).
However, concerns regarding the possibility of manipulating public opinion and spreading political propaganda or fake news through social media were also raised early on Howard (2006). These effects are documented by several studies Ratkiewicz et al. (2011a); Conover et al. (2011a); El-Khalili (2013); Woolley and Howard (2016); Shorey and Howard (2016); Bessi and Ferrara (2016); Ferrara (2017); Fourney et al. (2017). Social media have been proven to be an effective tool to influence individuals’ opinions and behaviors Aral et al. (2009); Aral and Walker (2012); Bakshy et al. (2011); Centola (2011, 2010) and some studies even evaluate the current tools to combat misinformation Pennycook and Rand (????). Computational tools, like troll accounts and social bots, have been designed to perform such type of influence operations at scale, by cloning or emulating the activity of human users while operating at much higher pace (e.g., automatically producing content following a scripted agenda) Hwang et al. (2012); Messias et al. (2013); Ferrara et al. (2016b); Varol et al. (2017b); Ferrara (2018) – however, it should be noted that bots have been also used, in some instances, for positive interventions Savage et al. (2016); Monsted et al. (2017).
Early accounts of the adoption of bots to attempt manipulate political communication with misinformation started in 2010, during the U.S. midterm elections, when social bots were employed to support some candidates and smear others; in that instance, bots injected thousands of tweets pointing to Web sites with fake news Ratkiewicz et al. (2011b). Similar cases are reported during the 2010 Massachusetts special election Metaxas and Mustafaraj (2012) – these campaigns are often referred to as Twitter bombs, or political astroturf Ferrara et al. (2016a); Varol et al. (2017a). Unfortunately, oftentimes determining the actors behind these operations was impossible Kollanyi et al. (2016); Ferrara et al. (2016b). Prior to this work, only a handful of other operations are linked to some specific actors Woolley and Howard (2016), e.g., the alt-right attempt to smear a presidential candidate before the 2017 French election Ferrara (2017). This is because governments, organizations, and other entities with sufficient resources, can obtain the technological capabilities necessary to covertly deploy hundreds or thousands of accounts and use them to either support or attack a given political target. Reverse-engineering these strategies has proven a challenging research venue Freitas et al. (2015); Alarifi et al. (2016); Subrahmanian et al. (2016); Davis et al. (2016), but it can ultimately lead to techniques to identify the actors behind these operations.
One difficulty facing such studies is objectively determining what is fake news, as there is a range of untruthfulness from simple exaggeration to outright lies. Beyond factually wrong information, it is difficult to classify information as fake.
Rather than facing the conundrum of normative judgment and arbitrarily determine what is fake news and what is not, in this study we focus on user intents, specifically the intent to deceive, and their effects on the Twitter political conversation prior to the 2016 U.S. Presidential election.
Online accounts that are created and operated with the primary goal of manipulating public opinion (for example, promoting divisiveness or conflict on some social or political issue) are commonly known as Internet trolls (trolls, in short) Buckels et al. (2014). To label some accounts or sources of information as trolls, a clear intent to deceive or create conflict has to be present. A malicious intent to harm the political process and cause distrust in the political system was evident in 2,752 now-deactivated Twitter accounts that are later identified as being tied to Russia’s “Internet Research Agency” troll farm, which was also active on Facebook Dutt et al. (2018). The U.S. Congress released a list of these accounts as part of the official investigation of Russian efforts to interfere in the 2016 U.S. Presidential election.
Since their intent is clearly malicious, the Russian Troll accounts and their messages are the subject of our scrutiny: we study their spread on Twitter to understand the extent of the Russian interference effort and its effects on the election-related political discussion.
1.1 Research Questions
In this paper, we aim to answer three crucial research questions regarding the effects of the interference operation carried out by Russian trolls:
-
RQ1
What is the role of the users’ political ideology?. We investigate whether political ideology affects who engages with Russian trolls, and how that may have helped propagate trolls’ content. If that is the case, we will determine if the effect is more pronounced among liberals or conservatives, or evenly spread across the political spectrum.
-
RQ2
How central are the trolls in the network of spreading information in the year of 2016 (pre and post-the US presidential elections)? We offer analyses of the position of trolls and the users who spread their messages in the retweet network progressively in time from the beginning of 2016 to the end of that year.
-
RQ3
What is the role of social bots? We characterize whether social bots play a role in spreading content produced by Russian trolls and, if that was the case, where on the political spectrum are bots situated.
-
RQ4
Do trolls succeed in specific areas of the US?. We offer an extensive analysis of the geospatial dimension and how it affects the effectiveness of the Russian interference operation; we test whether users located within specific states participate in the consumption and propagation of trolls’ content more than others.
This paper improves upon our previous work Badawy et al. (2018) by 1) extending the span of the data to one year before and after the 2016 US elections rather than just two months as in the previous paper; 2) using sophisticated network analysis to understand the influence of malicious users across time. We collect Twitter data for a year leading into the election. We obtained a dataset of over 13 million tweets generated by over a million distinct users in the year of 2016. We successfully determine the political ideology of most of the users using label propagation on the retweet network with precision and recall exceeding 84%. Next, using advanced machine learning techniques developed to discover social bots Ferrara et al. (2016b); Subrahmanian et al. (2016); Davis et al. (2016) applied on users who engage with Russian trolls, we find that bots existed among both liberal and conservative users. We perform text analysis on the content Russian trolls disseminated, and find that conservative trolls are concerned with particular causes, such as refugees, terrorism and Islam, while liberal trolls write about issues related to the police and school shootings. Additionally, we offer an extensive geospatial analysis of tweets across the United States, showing that it is mostly proportionate to the states’ population size—as expected—however, a few outliers emerge for both liberals and conservatives.
1.2 Summary of Contributions
Findings presented in this work can be summarized as:
-
•
We propose a novel way of measuring the consumption of manipulated content through the analysis of activities of Russian trolls on Twitter in the year of 2016.
-
•
Using network-based machine learning methods, we accurately determine the political ideology of most users in our dataset, with precision and recall above 84%.
-
•
We use network analysis to map the position of trolls and spreaders in the retweet network over the year of 2016.
-
•
State-of-the-art bot detection on users who engage with Russian trolls shows that bots are engaged in both liberal and conservative domains.
-
•
Text analysis shows that conservative Russian trolls are mostly promoting conservative causes in regards to refugees, terrorism, and Islam as well as talking about Trump, Clinton, and Obama. For liberal trolls, the discussion is focused on school shootings and the police, but Trump and Clinton are in the top words used as well.
-
•
We offer a comprehensive geospatial analysis showing that certain states overly-engaged with production and diffusion of Russian trolls’ contents.
2 Data Collection
2.1 Twitter Dataset
2.1.1 Trolls
To collect Twitter data about the Russian trolls, we use a list of 2,752 Twitter accounts identified as Russian trolls that is compiled and released by the U.S. Congress.111https://www.recode.net/2017/11/2/16598312/russia-twitter-trump-twitter-deactivated-handle-list To collect the tweets, we use Crimson Hexagon,222https://www.crimsonhexagon.com/ a social media analytic platform that provides paid datastream access. This tool allows us to obtain tweets and retweets produced by trolls and subsequently deleted in the year of 2016. Table 1 offers some descriptive statistics of the Russian troll accounts. Out of the accounts appearing on the list, 1,148 accounts exist in the dataset, and a little over a thousand of them produce more than half a million of original tweets.
| Value | |
|---|---|
| # of Russian trolls | 2,735 |
| # of trolls in our data | 1,148 |
| # of trolls wrote original tweets | 1,032 |
| # of original tweets | 538,166 |
We also collect users that did not retweet any troll, since it helps us have a better understanding of trolls behaviour online vs. normal users and how it affects the overall discourse on Twitter. We collect non-trolls’ tweets using two strategies. First, we collect tweets of such users using a list of hashtags and keywords that relate to the 2016 U.S. Presidential election. This list is crafted to contain a roughly equal number of hashtags and keywords associated with each major Presidential candidate: we select 23 terms, including five terms referring to the Republican Party nominee Donald J. Trump (#donaldtrump, #trump2016, #neverhillary, #trumppence16, #trump), four terms for Democratic Party nominee Hillary Clinton (#hillaryclinton, #imwithher, #nevertrump, #hillary), and several terms related to debates. To make sure our query list was comprehensive, we add a few keywords for the two third-party candidates, including the Libertarian Party nominee Gary Johnson (one term), and Green Party nominee Jill Stein (two terms).Our second strategy is to collect tweets from the same users that do not include the same key terms mentioned above.
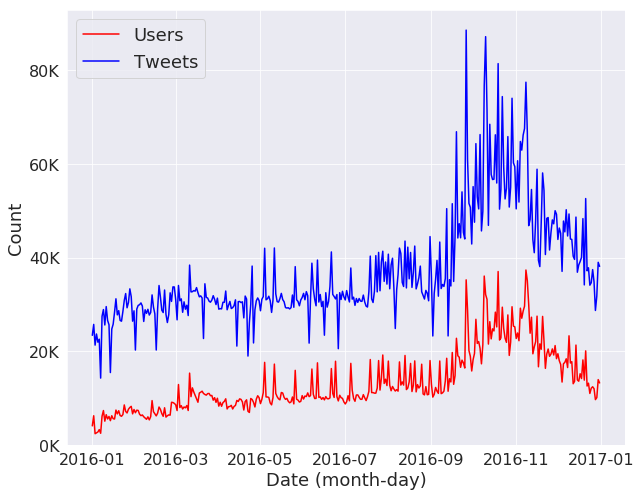
Table 2 reports some aggregate statistics of the data. It shows that the number of retweets and tweets with URLs are quite high, more than 3/4 of the dataset. Figure 1 shows the timeline of the tweets’ volme and the users who produced these tweets in the 2016 with a spike around the time of the election.
| Statistic | Count |
|---|---|
| # of Tweets | 13,631,266 |
| # of Retweets | 10,556,421 |
| # of Distinct Users | 1,089,974 |
| # of Tweets/Retweets with a URL | 10,621,071 |
2.2 Classification of Media Outlets
We classify users by their ideology based on the political leaning of the media outlets they share. The classification algorithm is described in Section 3.2. In this section, We describe the methodology of obtaining ground truth labels for the media outlets.
We use lists of partisan media outlets compiled by third-party organizations, such as AllSides333https://www.allsides.com/media-bias/media-bias-ratings and Media Bias/Fact Check.444https://mediabiasfactcheck.com/ We combine liberal and liberal-center media outlets into one list and conservative and conservative-center into another. The combined list includes 641 liberal and 398 conservative outlets. However, in order to cross reference these media URLs with the URLs in the Twitter dataset, we need to get the long URLs for most of the links in the dataset, since most of them are shortened. As this process is quite time-consuming, we get the top 5,000 URLs by count and then retrieve the long version for those. These top 5,000 URLs accounts for more than 2.1 million or around 1/5 of the URLs in the dataset.
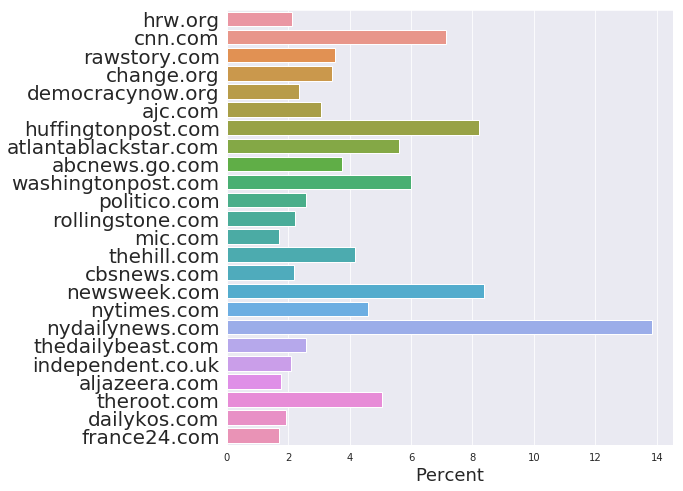
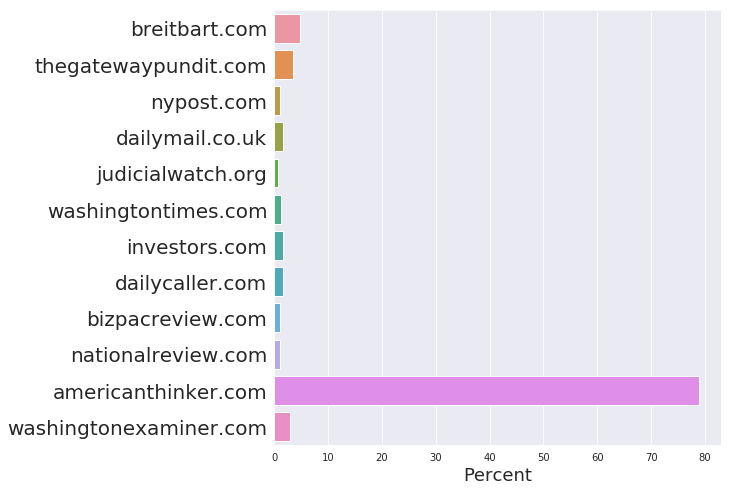
After cross-referencing the 5,000 long URLs with the media URLs, we observe that 7,912 tweets in the dataset contain a URL that points to one of the liberal media outlets and 29,846 tweets with a URL pointing to one of the conservative media outlets. Figure 2 shows the distributions of tweets with URLs from liberal and conservative outlets. As we can see in the figures, American Thinker dominated the URLs being shared in the conservative sample under study, while in the liberal sample more media outlets were equally represented. Table 3 shows the list of the left and right media outlets/domain names after removing left/right center from the list.
| Liberal | Conservative |
|---|---|
| change.org | dailycaller.com |
| cnn.com | nypost.com |
| dailykos.com | americanthinker.com |
| democracynow.org | bizpacreview.com |
| huffingtonpost.com | breitbart.com |
| nydailynews.com | dailymail.co.u |
| rawstory.com | judicialwatch.org |
| rollingstone.com | nationalreview.com |
| thedailybeast.com | thegatewaypundit.com |
| theroot.com |
We use a polarity rule to label Twitter users as liberal or conservative depending on the number of tweets they produce with links to liberal or conservative sources. In other words, if a user has more tweets with URLs to liberal sources, he/she is labeled as liberal and vice versa. Although the overwhelming majority of users include URLs that are either liberal or conservative, we remove any users that has equal number of tweets from each side. Our final set of labeled users includes 10,074 users.
3 Methods and Data Analysis
3.1 Retweet Network
We construct a retweet network, containing nodes (Twitter users) with a directed link between them if one user retweet a post of another. Table 4 shows the descriptive statistics of the retweet network. It is a sparse network with a giant component that includes 1,357,493 nodes.
| Statstic | Count |
|---|---|
| # of nodes | 1,407,190 |
| # of edges | 4,874,786 |
| Max in-degree | 198,262 |
| Max out-degree | 8,458 |
| Density | 2.46e-06 |
3.2 Label Propagation
We use label propagation555We use the algorithm in the Python version of the Igraph library Csardi and Nepusz (2006) to classify Twitter accounts as liberal or conservative, similar to prior work Conover et al. (2011b). In a network-based label propagation algorithm each node is assigned a label, which is updated iteratively based on the labels of node’s network neighbors. In label propagation, a node takes the most frequent label of its neighbors as its own new label. The algorithm proceeds updating labels iteratively and stops when the labels no longer change (see Raghavan et al. (2007) for more information). The algorithm takes as parameters (i) weights, in-degree or how many times node retweets node ; (ii) seeds (the list of labeled nodes). We fix the seeds’ labels so they do not change in the process, since this seed list also serves as our ground truth.
We construct a retweet network where each node corresponds to a Twitter account and a link exists between pairs of nodes when one of them retweets a message posted by the other. We use more than 10,000 users mentioned in the media outlets sections as seeds – those who mainly retweet messages from either the liberal or the conservative media outlets in Figure 2 – and label them accordingly. We then run label propagation to label the remaining nodes in the retweet network.
To validate results of the label propagation algorithm, we apply stratified cross (5-fold) validation to the set of more than 10,000 seeds. We train the algorithm on 4/5 of the seed list and see how it performs on the remaining 1/5. The precision and recall scores are around 0.84. Since we combine liberal and liberal-center into one list (same for conservatives), we can see that the algorithm is not only labeling the far liberal or conservative correctly, which is a relatively easier task, but it is performing well on the liberal/conservative center as well.
| Seed Users | |
|---|---|
| Precision | 0.84 |
| Recall | 0.84 |
3.3 Bot Detection
Determining whether either a human or a bot controls a social media account has proven a very challenging task Ferrara et al. (2016b); Subrahmanian et al. (2016); Kudugunta and Ferrara (2018). We use an openly accessible solution called Botometer (a.k.a. BotOrNot) Davis et al. (2016), consisting of both a public Web site (https://botometer.iuni.iu.edu/) and a Python API (https://github.com/IUNetSci/botometer-python), which allows for making this determination with high accuracy. Botometer is a machine-learning framework that extracts and analyses a set of over one thousand features, spanning six sub classes:
- User:
-
Meta-data features that include the number of friends and followers, the number of tweets produced by the users,profile description and settings.
- Friends:
-
Four types of links are considered here: retweeting, mentioning, being retweeted, and being mentioned. For each group separately, botometer extracts features about language use, local time, popularity, etc.
- Network:
-
Botometer reconstructs three types of networks: retweet, mention, and hashtag co-occurrence networks. All networks are weighted according to the frequency of interactions or co-occurrences.
- Temporal:
-
Features related to user activity, including average rates of tweet production over various time periods and distributions of time intervals between events.
- Content:
-
Statistics about length and entropy of tweet text and Part-of-Speech (POS) tagging techniques, which identifies different types of natural language components, or POS tags.
- Sentiment:
Botometer is trained with thousands of instances of social bots, from simple to sophisticated, yielding an accuracy above 95 percent Davis et al. (2016). Typically, Botometer returns likelihood scores above 50 percent only for accounts that look suspicious to a scrupulous analysis. We adopted the Python Botometer API to systematically inspect the most active users in our dataset. The Python Botometer API queries the Twitter API to extract 300 recent tweets and publicly available account metadata, and feeds these features to an ensemble of machine learning classifiers, which produce a bot score. To label accounts as bots, we use the fifty-percent threshold – which has proven effective in prior studies Davis et al. (2016): an account is considered to be a bot if the overall Botometer score is above 0.5.
3.4 Geolocation
There are two ways to identity the location of tweets produced by users. One way is to collect the coordinates of the location the tweets were sent from; however, this is only possible if users enable the geolocation option on their Twitter accounts. The second way is to analyze the self-reported location text in users’ profiles. The latter includes substantially more noise, since many people write fictitious or imprecise locations – for example, they may identify the state and the country they reside in, but not the city.
In this paper, we use the location provided by Crimson Hexagon, which uses two methodologies. First, it extracts the geotagged locations, which is only available in a small portion of the Twitter data. For the tweets which are not geotagged, Crimson Hexagon estimates the users’ countries, regions, and cities based on “various pieces of contextual information”, for example, their profile information as well as users’ time zones and languages. Using the country and state information provided by Crimson Hexagon, this dataset has over 9 Million tweets with country location. More than 7.5 million of these geolocated tweets come from the US, with the UK, Nigeria, and Russia trailing behind the US with 287k, 277k, and 192k tweets respectively. There are more than 4.7 Million US tweets with State information provided. The top four states are as expected: California, Texas, New York, and Florida with 742k, 580k, 383k, and 360k tweets.
4 Results
Let us address the three research questions we sketched earlier:
-
RQ1
What is the role of the users’ political ideology?
-
RQ2
How central are trolls and the users who retweet them, spreaders?
-
RQ3
What is the role of social bots?
-
RQ4
Did trolls especially succeed in specific areas of the US?
In Section 4.1, we analyze how political ideology affects engagement with content posted by Russian trolls. Section 4.2 shows how the position of trolls and spreaders evolve over time in the retweet network. Section 4.3 focuses on social bots and how they contribute to the spreading of content produced by Russian trolls. Finally, in Section 4.4 we show how users contribute to the consumption and the propagation of trolls’ content based on their location.
4.1 RQ1: Political Ideology
The label propagation method succeeds in labeling most of the users as either liberal or conservative; however, the algorithm was not able to label some users outside of the giant component. Table 6 shows the number of trolls by ideology, and we can see that there are almost double the amount of conservative trolls compared to liberal ones in terms of number of trolls overall and the number of trolls who wrote original tweets. Although the number of liberal trolls is twice smaller, they produce more tweets than conservative trolls.
Table 7 shows descriptive statistics of spreaders. The table shows that only few spreaders wrote original tweets and that more than half of the tweets are retweets of trolls. There are fewer conservative spreaders, but they write substantially more tweets than their liberal counterparts (see Table 8). Besides talking about the candidates, liberals talk about being black, women, and school shootings. Conservatives talk about being American, Obama, terrorism, refugees, and Muslims (see Table 9 for top 20 words used for liberals and conservatives).
| Liberal | Conservative | Ratio | |
|---|---|---|---|
| # of trolls | 339 | 688 | 2 |
| # of trolls w/ original tweets | 306 | 608 | 1.98 |
| # of original tweets | 299,464 | 215,617 | 0.7 |
| Value | |
|---|---|
| # of spreaders | 720,558 |
| # of times retweeted trolls | 3,540,717 |
| # of spreaders with original tweets | 21,338 |
| # of original tweets | 319,565 |
| # of original tweets and retweets | 7,357,717 |
| Liberal | Conservative | Ratio | |
| # of spreaders | 446,979 | 273,546 | 0.6 |
| # of tweets | 1,715,696 | 5,641,988 | 3.2 |
| # of bots | 3,528 | 4,896 | 1.4 |
| # of tweets by bots | 26,233 | 181,604 | 7 |
| Conservative | count | Liberal | Count |
|---|---|---|---|
| trump | 10,362 | police | 15,498 |
| hillary | 5,494 | trump | 13,999 |
| people | 4,479 | man | 13,118 |
| clinton | 4,295 | black | 9,942 |
| obama | 2,593 | year | 8,627 |
| one | 2,447 | state | 7,895 |
| american | 2,388 | woman | 7,748 |
| woman | 2,167 | shooting | 6,564 |
| day | 2,152 | killed | 6,407 |
| donald | 2,148 | people | 5,913 |
| time | 2,105 | clinton | 5,606 |
| refugee | 2,103 | school | 5,143 |
| president | 2,079 | shot | 5,132 |
| terrorist | 1,994 | city | 4,754 |
| country | 1,980 | win | 4,543 |
| muslim | 1,963 | cop | 4,515 |
| year | 1,893 | day | 4,478 |
| need | 1,856 | fire | 4,408 |
| think | 1,835 | officer | 4,397 |
| al | 1,823 | death | 4,305 |
4.2 RQ2: Temporal Analysis
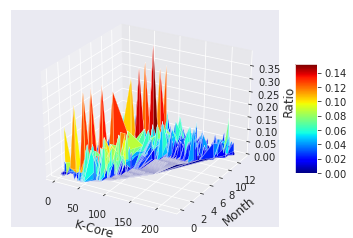
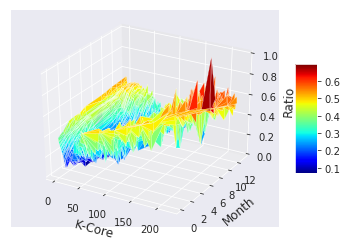
Analyzing the influence of trolls across time is one of the most important questions in terms of the spread of political propaganda. The way we measure the influence of trolls is by measuring where they are located in the retweet network. We choose the retweet network in particular because retweeting is the main vehicle for spreading information on Twitter. In terms of the location of the user, there are multiple ways to measure the location of a user in the network he/she is embedded in. We choose the k-core decomposition technique, because it captures the notion of who is in the core of the network vs. the periphery, while giving an ordinal measure reflecting the number of connections.
The k-core of a graph is the maximal subgraph in which every node has at least degree k. In a directed network, k is the sum of in-degree + out-degree. The k-core decomposition is a recursive approach that progressively trims the least connected nodes in a network (those with lower degree) in order to identify the most central ones Barberá et al. (2015).
We measure the centrality of trolls across time by dividing the number of trolls by the total number of nodes in every core for every snapshot of the network. Since we want to measure the evolution of the trolls’ importance, we construct monthly retweet networks, where every network contains all the previous nodes and edges up to the time in question. The first snapshot of the network contains the nodes and edges observed until one month after the initialization of the data collection, while the last snapshot includes all nodes and edges in the retweet network.
Figure 3 (left side) shows that trolls make up a substantial portion of the lower cores and remain fairly stable across time. We replicate the analysis for spreaders on figure 3 (right-side), which shows that spreaders’ centrality increases progressively across time and dominates the core of the network toward the end.
4.3 RQ3: Social Bots
Since there are many spreaders in this dataset, we take a random sample of 200,000 spreaders and use the approach explained in Section 3.3 to obtain bot scores. We use Botometer to obtain bot scores only for the sample and not for all of the spreaders, since it takes considerably a long time to get bot scores for such a number due to the Twitter API call limit. We are able to obtain bot scores for 115,396 spreaders out of the 200,000 spreaders.
The number of users that have bot scores above 0.5, and can therefore be safely considered bots according to prior work Varol et al. (2017b), stands at 8,424 accounts. Out of the 115,396 spreaders with bot scores, 68,057 are liberal, and 3,528 of them have bot scores above 0.5, about 5% of the total. As for the conservatives, there are 45,807 spreaders, 4,896 of which have bot scores greater than 0.5, representing around 11% of the total. As the Results summarized in Table 8 show, although the number of conservative spreaders is lower than liberal ones, there are more bots among conservatives who write considerably more tweets.
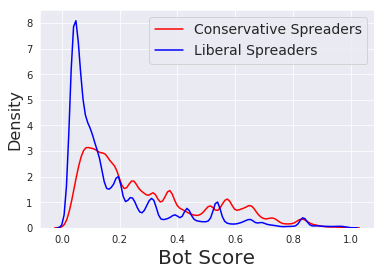
Figure 4 shows the probability density of bot scores of the liberal and conservative spreaders. Again, putting aside the disproportionate number of liberals to conservatives, the mean value of the bot scores of the conservative spreaders (0.29) is higher than the liberal one (0.18). We performed a two-sided t-test for the null hypothesis that the two distributions have identical mean values, and the p-value is less than 0.0, meaning that we can reject the null.
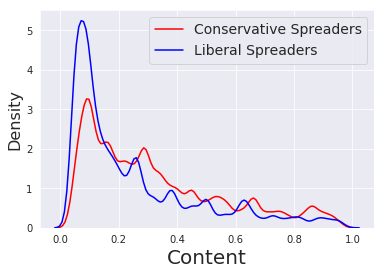
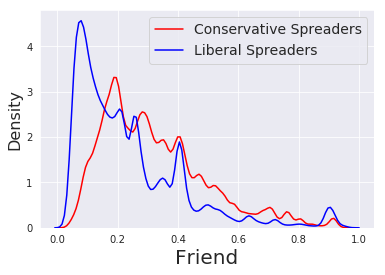
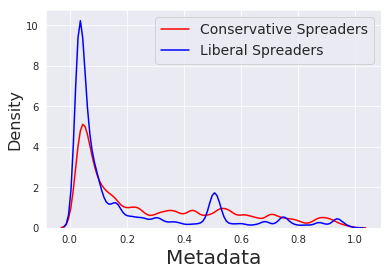
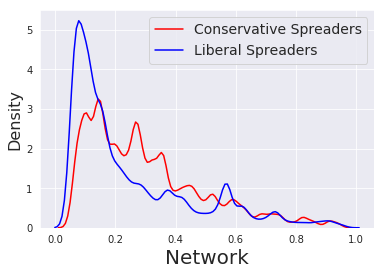
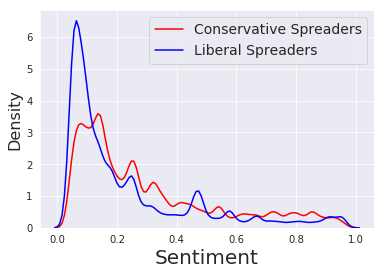
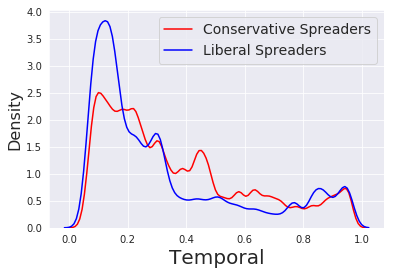
For the plots in Figure 5, it is evident that conservative spreaders have higher means on all of the Botometer subclass scores in comparison to their liberal counterparts. The differences in all plots are statistically significant (p 0.001). Besides, looking at the distributions, we can see that the differences in user characteristics (metadata) and “Friend” category are substantively different (around 0.10 difference).
4.4 RQ4: Geospatial Analysis
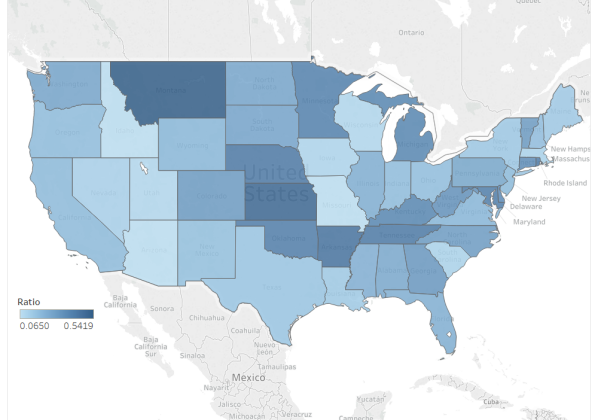
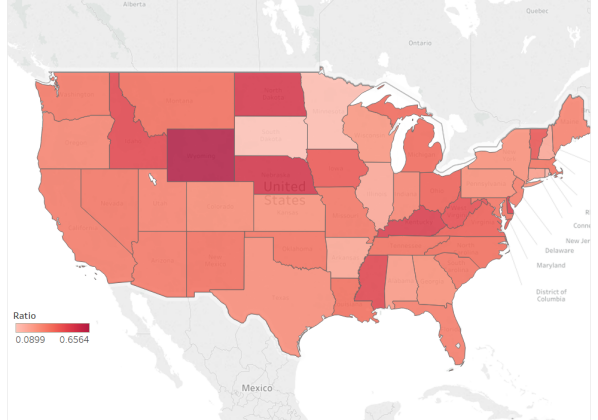
Figure 6 shows the proportion of the number of retweets by liberal and conservative users (classified according to the label propagation algorithm) of the content produced by Russian trolls per each state normalized per state by the total number of liberal and conservative tweets respectively. The ratio is computed as , where is the total number of liberal/conservative retweets of liberal/conservative trolls from a given state , and is the total number of tweets per each State.
We notice that few states exhibit very high proportions of retweets per total number of tweets for liberals and conservatives. We test the deviations using a two-tailed t-test on the z-scores of each deviation calculated on the distribution of ratios. For conservatives, the average is 0.34 and the standard deviation is 0.12, while for liberal states, the average is 0.26 and the standard deviation is 0.13. For conservatives, Wyoming leads the ranking (=3.65, p-value = 0.001). For liberals, Montana (=0.54, p-value = 0.023) and Kansas (=0.51, p-value = 0.046) lead the ranking and are the only states with ratios that are statistically significant. It is also interesting to note that a little less than 1/2 of the trolls have Russia as their location while a small number of spreaders and other users have Russia as their location (see Table 10).
| Count | |
|---|---|
| # of trolls from Russia | 438 |
| # of spreaders from Russia | 1,980 |
| # of overall from Russia | 3,017 |
5 Conclusions
The dissemination of information and the mechanisms for democratic discussion have radically changed since the advent of digital media, especially social media. Platforms like Twitter are praised for their contribution to democratization of public discourse on civic and political issues. However, many studies highlight the perils associated with the abuse of these platforms. The spread of deceptive, false and misleading information aimed at manipulating public opinion are among those risks.
In this work, we investigated the role and effects of trolls, using the content produced by Russian trolls on Twitter as a proxy for propaganda. We collected tweets posted during the year of 2016 by Russian trolls, spreaders, and other users who tweet in this period. We showed that propaganda (produced by Russian trolls) is shared more widely by conservatives than liberals on Twitter. Although the number of liberal spreaders is close to 2:1 in comparison to conservative ones, the latter write about 3.2 times as many tweets as the liberal spreaders. Using state-of-the-art bot detection method, we estimated that about 5% and 11% of the liberal and conservative users are bots. Conservative bot spreaders produce about 7 times as many tweets as liberal ones.
The spread of propaganda by malicious actors can have severe negative consequences. It can enhance malicious information and polarize political conversation, causing confusion and social instability. Scientists are currently investigating the consequences of such phenomena Woolley and Howard (2016); Shorey and Howard (2016). We plan to explore in detail the issue of how malicious information spread via exposure and the role of peer effect. Concluding, it is important to stress that, although our analysis unveiled the current state of the political debate and agenda pushed by the Russian trolls who spread malicious information, it is impossible to account for all the malicious efforts aimed at manipulation during the last presidential election. State- and non-state actors, local and foreign governments, political parties, private organizations, and even individuals with adequate resources Kollanyi et al. (2016), could obtain operational capabilities and technical tools to construct propaganda campaigns and deploy armies of social bots to affect the directions of online conversations. Future efforts will be required by the social and computational science communities to study this issue in depth and develop more sophisticated detection techniques capable of unmasking and fighting these malicious efforts.
References
- Adamic and Glance (2005) Adamic, L. A. and Glance, N. (2005). The political blogosphere and the 2004 us election: divided they blog. In 3rd Int Work Link Disc.
- Agarwal et al. (2011) Agarwal, A., Xie, B., Vovsha, I., Rambow, O., and Passonneau, R. (2011). Sentiment analysis of twitter data. In Proceedings of the workshop on languages in social media, pages 30–38. Association for Computational Linguistics.
- Alarifi et al. (2016) Alarifi, A., Alsaleh, M., and Al-Salman, A. (2016). Twitter turing test: Identifying social machines. Information Sciences, 372.
- Aral and Walker (2012) Aral, S. and Walker, D. (2012). Identifying influential and susceptible members of social networks. Science, 337(6092), 337–341.
- Aral et al. (2009) Aral, S., Muchnik, L., and Sundararajan, A. (2009). Distinguishing influence-based contagion from homophily-driven diffusion in dynamic networks. Proceedings of the National Academy of Sciences, 106(51).
- Badawy et al. (2018) Badawy, A., Ferrara, E., and Lerman, K. (2018). Analyzing the digital traces of political manipulation: The 2016 russian interference twitter campaign. In ASONAM.
- Bakshy et al. (2011) Bakshy, E., Hofman, J., Mason, W., and Watts, D. (2011). Everyone’s an influencer: quantifying influence on twitter. In 4th WSDM.
- Bakshy et al. (2015) Bakshy, E., Messing, S., and Adamic, L. A. (2015). Exposure to ideologically diverse news and opinion on facebook. Science, 348(6239).
- Barberá et al. (2015) Barberá, P., Wang, N., Bonneau, R., Jost, J. T., Nagler, J., Tucker, J., and González-Bailón, S. (2015). The critical periphery in the growth of social protests. PloS one, 10(11), e0143611.
- Bekafigo and McBride (2013) Bekafigo, M. A. and McBride, A. (2013). Who tweets about politics? political participation of twitter users during the 2011 gubernatorial elections. Social Science Computer Review, 31(5), 625–643.
- Bessi and Ferrara (2016) Bessi, A. and Ferrara, E. (2016). Social bots distort the 2016 us presidential election online discussion. First Monday, 21(11).
- Bond et al. (2012) Bond, R. M., Fariss, C. J., Jones, J. J., Kramer, A. D., Marlow, C., Settle, J. E., and Fowler, J. H. (2012). A 61-million-person experiment in social influence and political mobilization. Nature, 489(7415).
- Bruns and Burgess (2011) Bruns, A. and Burgess, J. E. (2011). The use of twitter hashtags in the formation of ad hoc publics. In 6th ECPR General Conference.
- Buckels et al. (2014) Buckels, E. E., Trapnell, P. D., and Paulhus, D. L. (2014). Trolls just want to have fun. Personality and individual Differences, 67.
- Carlisle and Patton (2013) Carlisle, J. E. and Patton, R. C. (2013). Is social media changing how we understand political engagement? an analysis of facebook and the 2008 presidential election. Political Research Quarterly, 66(4).
- Centola (2010) Centola, D. (2010). The spread of behavior in an online social network experiment. Science, 329(5996), 1194–1197.
- Centola (2011) Centola, D. (2011). An experimental study of homophily in the adoption of health behavior. Science, 334(6060), 1269–1272.
- Conover et al. (2011a) Conover, M., Ratkiewicz, J., Francisco, M. R., Gonçalves, B., Menczer, F., and Flammini, A. (2011a). Political polarization on twitter. ICWSM, 133, 89–96.
- Conover et al. (2011b) Conover, M., Gonçalves, B., Ratkiewicz, J., Flammini, A., and Menczer, F. (2011b). Predicting the political alignment of twitter users. In Proc. 3rd IEEE Conference on Social Computing, pages 192–199.
- Conover et al. (2013a) Conover, M. D., Ferrara, E., Menczer, F., and Flammini, A. (2013a). The digital evolution of occupy wall street. PloS one, 8(5), e64679.
- Conover et al. (2013b) Conover, M. D., Davis, C., Ferrara, E., McKelvey, K., Menczer, F., and Flammini, A. (2013b). The geospatial characteristics of a social movement communication network. PloS one, 8(3), e55957.
- Csardi and Nepusz (2006) Csardi, G. and Nepusz, T. (2006). The igraph software package for complex network research. InterJournal, Complex Systems, 1695(5), 1–9.
- Davis et al. (2016) Davis, C. A., Varol, O., Ferrara, E., Flammini, A., and Menczer, F. (2016). Botornot: A system to evaluate social bots. In Proc. 25th International Conference on World Wide Web, pages 273–274.
- Diakopoulos and Shamma (2010) Diakopoulos, N. A. and Shamma, D. A. (2010). Characterizing debate performance via aggregated twitter sentiment. In SIGCHI Conf.
- DiGrazia et al. (2013) DiGrazia, J., McKelvey, K., Bollen, J., and Rojas, F. (2013). More tweets, more votes: Social media as a quantitative indicator of political behavior. PloS one, 8(11), e79449.
- Dutt et al. (2018) Dutt, R., Deb, A., and Ferrara, E. (2018). ‘Senator, We Sell Ads’: Analysis of the 2016 Russian Facebook Ads Campaign. In Third International Conference on Intelligent Information Technologies (ICIIT 2018).
- Effing et al. (2011) Effing, R., Van Hillegersberg, J., and Huibers, T. (2011). Social media and political participation: are facebook, twitter and youtube democratizing our political systems? Electronic participation, pages 25–35.
- El-Khalili (2013) El-Khalili, S. (2013). Social media as a government propaganda tool in post-revolutionary egypt. First Monday, 18(3).
- Enli and Skogerbø (2013) Enli, G. S. and Skogerbø, E. (2013). Personalized campaigns in party-centred politics: Twitter and facebook as arenas for political communication. Information, Communication & Society, 16(5), 757–774.
- Ferrara (2017) Ferrara, E. (2017). Disinformation and social bot operations in the run up to the 2017 french presidential election. First Monday, 22(8).
- Ferrara (2018) Ferrara, E. (2018). Measuring social spam and the effect of bots on information diffusion in social media. In Complex Spreading Phenomena in Social Systems, pages 229–255. Springer, Cham.
- Ferrara et al. (2016a) Ferrara, E., Varol, O., Menczer, F., and Flammini, A. (2016a). Detection of promoted social media campaigns. In Tenth International AAAI Conference on Web and Social Media, pages 563–566.
- Ferrara et al. (2016b) Ferrara, E., Varol, O., Davis, C., Menczer, F., and Flammini, A. (2016b). The rise of social bots. Comm. of the ACM, 59(7), 96–104.
- Fourney et al. (2017) Fourney, A., Racz, M. Z., Ranade, G., Mobius, M., and Horvitz, E. (2017). Geographic and temporal trends in fake news consumption during the 2016 us presidential election. In CIKM, volume 17.
- Freitas et al. (2015) Freitas, C., Benevenuto, Ghosh, and Veloso, A. (2015). Reverse engineering socialbot infiltration strategies in twitter. In ASONAM.
- Gibson and McAllister (2006) Gibson, R. K. and McAllister, I. (2006). Does cyber-campaigning win votes? online communication in the 2004 australian election. Journal of Elections, Public Opinion and Parties, 16(3), 243–263.
- González-Bailón et al. (2011) González-Bailón, S., Borge-Holthoefer, J., Rivero, A., and Moreno, Y. (2011). The dynamics of protest recruitment through an online network. Scientific reports, 1, 197.
- González-Bailón et al. (2013) González-Bailón, S., Borge-Holthoefer, J., and Moreno, Y. (2013). Broadcasters and hidden influentials in online protest diffusion. American Behavioral Scientist, 57(7), 943–965.
- Howard (2006) Howard, P. (2006). New media campaigns and the managed citizen.
- Hwang et al. (2012) Hwang, T., Pearce, I., and Nanis, M. (2012). Socialbots: Voices from the fronts. Interactions, 19(2), 38–45.
- Kloumann et al. (2012) Kloumann, I. M., Danforth, C. M., Harris, K. D., Bliss, C. A., and Dodds, P. S. (2012). Positivity of the english language. PloS one, 7(1), e29484.
- Kollanyi et al. (2016) Kollanyi, B., Howard, P. N., and Woolley, S. C. (2016). Bots and automation over twitter during the first us presidential debate.
- Kudugunta and Ferrara (2018) Kudugunta, S. and Ferrara, E. (2018). Deep neural networks for bot detection. Information Sciences, 467(October), 312–322.
- Loader and Mercea (2011) Loader, B. D. and Mercea, D. (2011). Networking democracy? social media innovations and participatory politics. Inf. Commun. Soc, 14(6).
- Messias et al. (2013) Messias, J., Schmidt, L., Oliveira, R., and Benevenuto, F. (2013). You followed my bot! transforming robots into influential users in twitter. First Monday, 18(7).
- Metaxas and Mustafaraj (2012) Metaxas, P. T. and Mustafaraj, E. (2012). Social media and the elections. Science, 338(6106).
- Monsted et al. (2017) Monsted, B., Sapiezynski, P., Ferrara, E., and Lehmann, S. (2017). Evidence of complex contagion of information in social media: An experiment using twitter bots. PLOS ONE, 12(9), 1–12.
- Pennycook and Rand (????) Pennycook, G. and Rand, D. G. (????). Assessing the Effect of “Disputed” Warnings and Source Salience on Perceptions of Fake News Accuracy.
- Raghavan et al. (2007) Raghavan, U. N., Albert, R., and Kumara, S. (2007). Near linear time algorithm to detect community structures in large-scale networks. Physical review E, 76(3), 036106.
- Ratkiewicz et al. (2011a) Ratkiewicz, J., Conover, M., Meiss, M. R., Gonçalves, B., Flammini, A., and Menczer, F. (2011a). Detecting and tracking political abuse in social media. ICWSM, 11, 297–304.
- Ratkiewicz et al. (2011b) Ratkiewicz, J., Conover, M., Meiss, M., Gonçalves, B., Patil, S., Flammini, A., and Menczer, F. (2011b). Truthy: mapping the spread of astroturf in microblog streams. In 20th WWW Conf., pages 249–252.
- Savage et al. (2016) Savage, S., Monroy-Hernandez, A., and Höllerer, T. (2016). Botivist: Calling volunteers to action using online bots. In 19th CSCW.
- Shirky (2011) Shirky, C. (2011). The political power of social media: Technology, the public sphere, and political change. Foreign affairs, pages 28–41.
- Shorey and Howard (2016) Shorey, S. and Howard, P. N. (2016). Automation, algorithms, and politics: A research review. Int. J Comm., 10.
- Stella et al. (2018) Stella, M., Ferrara, E., and De Domenico, M. (2018). Bots increase exposure to negative and inflammatory content in online social systems. Proceedings of the National Academy of Sciences, page 201803470.
- Subrahmanian et al. (2016) Subrahmanian, V., Azaria, A., Durst, S., Kagan, V., Galstyan, A., Lerman, K., Zhu, L., Ferrara, E., Flammini, A., and Menczer, F. (2016). The darpa twitter bot challenge. Computer, 49(6).
- Tufekci (2014) Tufekci, Z. (2014). Big questions for social media big data: Representativeness, validity and other methodological pitfalls. ICWSM.
- Tufekci and Wilson (2012) Tufekci, Z. and Wilson, C. (2012). Social media and the decision to participate in political protest: Observations from tahrir square. Journal of Communication, 62(2), 363–379.
- Varol et al. (2014) Varol, O., Ferrara, E., Ogan, C. L., Menczer, F., and Flammini, A. (2014). Evolution of online user behavior during a social upheaval. In Proceedings of the 2014 ACM conference on Web science.
- Varol et al. (2017a) Varol, O., Ferrara, E., Menczer, F., and Flammini, A. (2017a). Early detection of promoted campaigns on social media. EPJ Data Science, 6(13).
- Varol et al. (2017b) Varol, O., Ferrara, E., Davis, C., Menczer, F., and Flammini, A. (2017b). Online human-bot interactions: Detection, estimation, and characterization. In ICWSM, pages 280–289.
- Warriner et al. (2013) Warriner, A. B., Kuperman, V., and Brysbaert, M. (2013). Norms of valence, arousal, and dominance for 13,915 english lemmas. Behavior research methods, 45(4), 1191–1207.
- Wilson et al. (2005) Wilson, T., Wiebe, J., and Hoffmann, P. (2005). Recognizing contextual polarity in phrase-level sentiment analysis. In Proceedings of the conference on human language technology and empirical methods in natural language processing, pages 347–354. Association for Computational Linguistics.
- Woolley and Howard (2016) Woolley, S. C. and Howard, P. N. (2016). Automation, algorithms, and politics: Introduction. Int. Journal of Commun., 10.