Ionization Profiles of Galactic H II Regions
Abstract
Using Green Bank Telescope radio recombination line (RRL) data, we analyze the role of leaking radiation from H II regions in maintaining the ionization of the interstellar medium. We observed a sample of eight Galactic H II regions of various sizes, morphologies, and luminosities. For each region the hydrogen RRL intensity decreases roughly as a power-law with distance from the center of the region. This suggests that radiation leaking from the H II region is responsible for the majority of surrounding ionized gas producing RRL emission. Our results further indicate that the hydrogen RRL intensity appears to be fundamentally related to the H II region sizes traced by their photodissociation regions, such that physically smaller H II regions show a steeper decrease in intensity with increasing distance from the region centers. As a result, giant H II regions may have a much larger effect in maintaining the ionization of the interstellar medium. For six of the eight observed H II regions we find a decrease in the abundance ratio with increasing distance, indicating that He-ionizing photons are being absorbed within the ionization front of the H II region. There is enhanced carbon RRL emission toward directions with strong continuum background, suggesting that the carbon emission is amplified by stimulated emission.
1 Introduction
H II regions, first described by Strömgren (1939), are regions of ionized gas surrounding O and B-type stars. Only these short-lived and massive stars emit a sufficient number of high-energy photons ( eV) to fully ionize their surroundings. H II regions are among the most luminous objects in our Galaxy at radio wavelengths and can be studied using radio recombination line (RRL) and radio free-free continuum emission. Compared to observations at near- to mid-infrared (IR) wavelengths, these radio observations are faint, but have the benefit of being essentially free from extinction.
Between the H II region and the ambient diffuse interstellar medium (ISM) lies the H I front, the boundary between fully ionized hydrogen within the region and neutral hydrogen outside, followed by a photodissociation region (PDR). In PDRs, hydrogen is predominantly neutral, but carbon and other species with ionization potentials lower than that of hydrogen are mostly ionized. PDRs can be studied using numerous atomic or molecular transitions, e.g. IR emission from polycyclic aromatic hydrocarbons (PAHs) or C+ emission at 158 m.
Low-density diffuse gas known as the “Diffuse Ionized Gas” or “Warm Ionized Medium” (WIM) is a major component of the ISM of our Galaxy. The WIM, with electron temperatures ranging from 6000 K to 10,000 K, accounts for over 90% of all ionized hydrogen in the ISM (Haffner et al., 2009). It has a scale height of 1 kpc and was found to be in a lower ionization state than gas in H II regions (Haffner et al., 1999; Madsen et al., 2006). The “Extended Low-Density Medium” (ELDM), another diffuse component of the ISM (see Gottesman & Gordon, 1970; Mezger, 1978), has a smaller scale height of only 100 pc and has been observed to be spatially correlated with the locations of discrete H II regions (Alves et al., 2012).
While it is still not fully known how the WIM maintains its ionization (Haffner et al., 2009), it is believed that O-stars are the most likely source of ionizing photons since all other possible ionization mechanisms (e.g., supernova explosions) cannot fulfill the energy requirements (Domgörgen & Mathis, 1994; Hoopes & Walterbos, 2003). Given the distribution of the WIM, however, it remains unclear precisely how the radiation from O-stars within H II regions is able to propagate through their surrounding PDRs and across kiloparsec size-scales into the ISM. While Wood et al. (2010) argue that a supernova-driven turbulent ISM has low-density paths that would allow ionizing photons to reach and ionize gas several kiloparsecs above the midplane, it is unknown whether this scenario could explain the WIM distribution in the Galactic plane.
Observations have shown that a significant amount of ionizing radiation is leaking from individual H II regions. While most of these analyses focus on H II regions in external galaxies (e.g. Oey & Kennicutt, 1997; Zurita et al., 2002; Giammanco et al., 2005; Pellegrini et al., 2012), a few studies were performed on Milky Way H II regions. Anderson et al. (2015) showed using H-alpha emission data that the Galactic H II region RCW 120 is leaking 25% of its ionizing radiation into the ISM. They further showed that the PDR is clumpy at 8.0 m and that photons preferentially escape through low-density pathways into the ISM. We performed a similar analysis on the compact Galactic H II region NCG 7538 (Luisi et al., 2016, hereafter L16) using Green Bank Telescope (GBT) RRL and radio continuum data to better understand how a single H II region may contribute to the ionization of the WIM. We computed an ionizing leaking fraction of % and found that, unlike giant H II region complexes, the radiation leaking from NCG 7538 seems to only affect the local ambient medium.
It is not well-understood how emission from the WIM is affected by the presence of H II regions, their sizes, and morphologies. We showed in L16 that the hydrogen RRL intensity around the compact H II region NGC 7538 decreases rapidly with distance from the central region, whereas the RRL emission decrease in the giant H II region complex W43 is much less steep. This result implies that giant H II regions may have a much larger effect on maintaining the ionization of the WIM compared to compact H II regions. In fact, Zurita et al. (2002) suggest that essentially all ionizing radiation escapes from H II regions with the highest luminosities. Using a model from Beckman et al. (2000), Zurita et al. (2000) suggest that radiation leaking from luminous clusters of H II regions may be sufficient to ionize the diffuse gas. As a result, a large escape fraction of less luminous regions may not necessarily be required to maintain the ionization of the WIM.
The spectrum of the radiation field provides additional information on the physical processes within H II regions and the effect of leaking radiation on the WIM. Within an H II region, the radiation field depends on the temperature of the ionizing star(s). The ratio of emitted helium ( eV) to hydrogen ( eV) ionizing photons, , can be estimated indirectly by measuring the ionic abundance ratio. While is determined by the temperature of the ionizing star(s), its value is only even for the hottest O3V stars (see Martins et al., 2005; Draine, 2011). For an O9V star, is reduced to 0.015. As the radiation travels through the stellar atmosphere, metals will selectively absorb more energetic photons in a process known as line blanketing. While dependent on the metallicity of the star, this process will generally result in a decrease in the ratio of He-to-H ionizing photons (e.g., Pankonin et al., 1980; Afflerbach et al., 1997). The He-to-H ionizing photon ratio is also affected by dust, which causes selective attenuation of ultraviolet (UV) photons.
As radiation propagates through an H II region, its spectrum changes further due to absorption and re-emission processes. Wood & Mathis (2004) suggested that these interaction processes preferentially result in a hardening of the H-ionizing continuum and a suppression of He-ionizing photons. Recently, Weber et al. (2018) showed that for O-stars with low effective temperatures ( K) nearly the entire He-ionizing radiation is absorbed within the H II regions. The radiation hardening has been demonstrated by Osterbrock (1989) based on the dependence of the absorption cross-section on frequency: ionizing photons with energies E13.6 eV are preferentially absorbed by hydrogen compared to photons with much higher energies. Since the ionization cross-section of He is much greater than that of H, a large fraction of He-ionizing photons is absorbed well within the ionization front of the H II region, resulting in a depletion of He-ionizing photons outside the PDR.
| Source | Radius | Distance | Spectral Type | |||
|---|---|---|---|---|---|---|
| (deg.) | (deg.) | (pc) | (kpc) | (kpc) | ||
| M17 (S45) | 15.098 | 11.3 | 6.6 | 2.0 | O4-O4[1] | |
| M16 (S49) | 16.993 | 14.2 | 6.1 | 2.6 | O5[2] | |
| N49 | 28.823 | 3.6 | 4.5 | 5.5 | O5[3] | |
| G45.45+0.06 (G45) | 45.453 | 9.9 | 6.5 | 8.4 | O6[4] | |
| S104 | 74.769 | 2.4 | 8.2 | 1.5 | O5[5] | |
| S206 | 150.596 | 7.9 | 11.6 | 3.4 | O6[6] | |
| Orion (S281) | 209.107 | 3.4 | 8.9 | 0.4 | O6[7] | |
| G29.960.02 (G29) | 29.956 | 2.4 | 4.7 | 5.3 | O5.5[8] |
The suppression of He-ionizing photons implies a reduced ionic abundance ratio by number outside the H II region as there will be a fewer number of photons with sufficient energy to ionize He compared to H. Such H II regions may be density bounded beyond the He+ zone, but within the H+ zone (see Reynolds et al., 1995). This effect was observed by Pankonin et al. (1980), who show that the ionized helium abundance in the Orion Nebula decreases with distance from the exciting star. We also indirectly confirmed these results in L16 for the compact H II region NCG 7538 by observing a decrease in the ratio with increasing distance from the region’s central position. It is, however, unknown whether these findings are applicable to Galactic H II regions in general and their relation to age or geometry of the region.
Previous observational work and simulations confirm that the ratio of He-to-H ionizing photons in the WIM is lower than that found in H II regions. In a study of optical emission lines toward faint H-emitting regions in the Milky Way, Madsen et al. (2006) show that the He I/H line ratio is suppressed compared to that of H II regions, indicating a softer radiation field. Using Monte Carlo photoionization simulations, Wood & Mathis (2004) suggest that this line ratio depends strongly on the H II region leaking fraction. They find that He I/H is significantly reduced only for low escape fractions (%). This result is in disagreement with Roshi et al. (2012), who observed a upper limit of only 0.024 in the diffuse gas near the H II region G49, despite an apparent escape fraction of % and ratios of within the H II region (Churchwell et al., 1974; Lichten et al., 1979; Thum et al., 1980; McGee & Newton, 1981; Mehringer, 1994; Bell et al., 2011). Clearly, a larger sample size is required for further study.
The goal of this study is to observe a variety of H II regions to determine the role of leaking radiation from H II regions in maintaining the ionization of the WIM. Our observed sample includes H II regions of different sizes and morphologies for which the PDR boundary can be identified and for which the spectral class of its central star(s) is known. The properties of our observed H II regions are summarized in Table 1, which lists the source name, the Galactic longitude and latitude, the radius of the H II region, its Galactocentric radius, the distance to the Sun, and the spectral type of the ionizing source(s).
The GBT RRL observations are described in §2 of this paper and we outline the process of defining PDR boundaries in §3. In §4 and §5 we analyze the hydrogen RRL emission around the observed H II regions and derive ionic abundance ratios for the observed directions, respectively. Physical properties of the ionized gas, including electron temperatures, emission measures, and electron densities are derived in §6. In §7 a line profile analysis is performed as an alternative method to derive electron temperatures. We analyze carbon and doubly-ionized helium emission in §8 and §9, respectively, and conclude in §10.
2 Observations and Data Reduction
We observed 8 H II regions with the Green Bank Observatory GBT from 2017 February to 2017 May. The properties of the observed H II regions are given in Table 1, which lists the source, the Galactic longitude and latitude, the radius of the H II regions as defined in §3, the Galactocentric radius and heliocentric distance given by the WISE Catalog of Galactic H II Regions (Anderson et al., 2014), and the spectral type of the ionizing source(s). For each targeted H II region, several positions within and outside the region’s PDR were observed (see §3 for a description of how the PDR boundaries were determined). We employed total-power position-switching observations with variable off-source and on-source integration times, ranging from 3 to 36 minutes, depending on the expected brightness of the position. For integration times exceeding 6 minutes, the observation was split up into blocks of 6 minutes each to reduce the overall impact of radio-frequency interference (RFI).
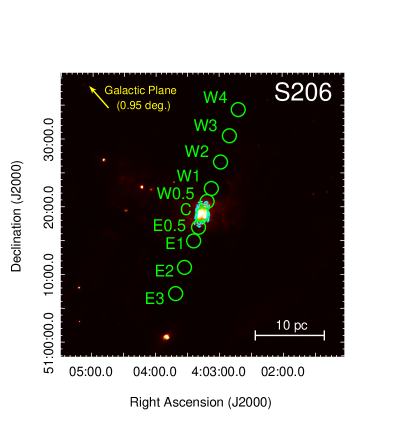
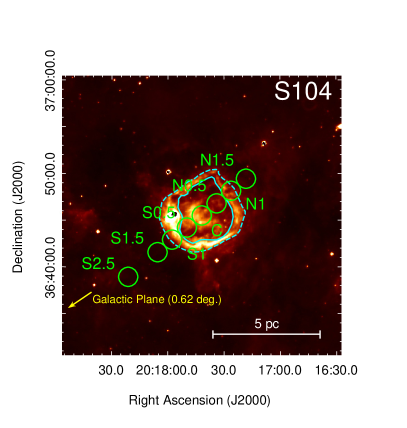
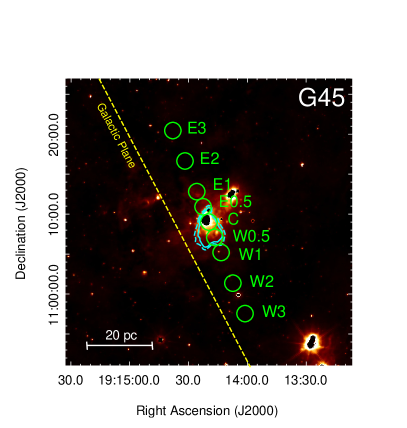
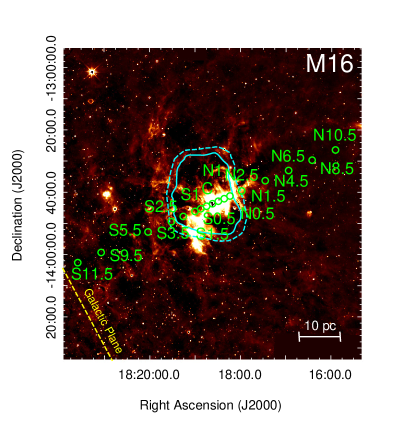
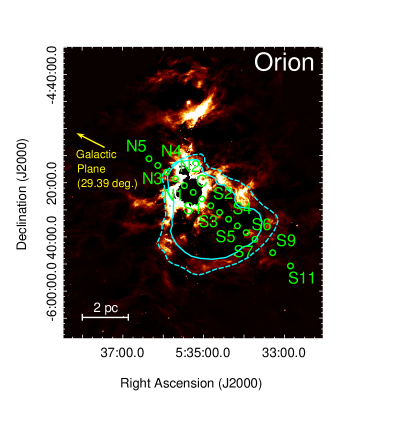
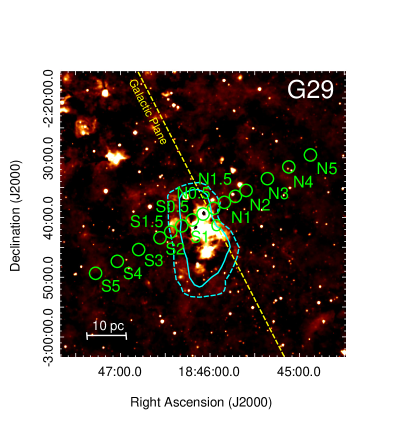
The individual pointings for each observed H II region lie along an imaginary line on the plane of the sky intersecting the region center. The angle of the line was chosen such that there is as little confusion by other radio sources (e.g., nearby H II regions) as possible. For each targeted H II region, between 7 and 17 positions were observed. The goal was to include as many positions as possible within the regions’ PDR boundaries, separated by as little as the average GBT half-power beam width (HPBW) of 123″. Outside the PDR boundaries, our pointings are spaced apart by one to four GBT HPBWs, depending on the spatial extent of the source and our total available observing time. For the largest regions, we sample up to a maximum distance of 47′ from the center. The locations of the observed positions for each source are shown in Figure 1. The locations are labeled according to their predominant direction from the region center in Galactic coordinates (N … north, S … south, E … east, W … west) and their distance from the center of the regions in multiples of 2HPBW. The coordinates of all observed directions are given in Table A.1, which lists the source, the source coordinates, and the location of the observed direction with respect to the PDR boundary (see §3).
The GBT C–band instantaneous bandpass in combination with the VEGAS backend includes 22 Hn lines, 19 Hn lines, and 8 Hn lines between 4.054 and 7.793 GHz. In our setup, the lines range from to , the lines range from to , and the lines range from to (see Luisi et al., 2018). In addition, we tuned to 7 HeIn lines and 8 molecular lines, including formaldehyde and methanol. To achieve a higher signal-to-noise ratio, we average together all Hn, Hn, and Hn lines, respectively, using TMBIDL111V7.1, see https://github.com/tvwenger/tmbidl.git. after first re-gridding and shifting the spectra so that they are aligned in velocity (see Balser, 2006). Spectra affected by RFI were discarded before averaging. The averaged spectra were smoothed to a resolution of 1.86 and a fourth-order polynomial baseline was subtracted.
Gaussian models were fit to the H and He profiles for which the signal-to-noise ratio (S/N) is at least 5 as defined by the method given by Lenz & Ayres (1992),
| (1) |
where is the peak line intensity, rms is the root-mean-squared spectral noise, is the full width at half maximum (FWHM) of the line, and is the FWHM of the Gaussian smoothing kernel. We also fit carbon lines with a S/N of at least 3. Here, the narrow width of the carbon lines allows for a lower S/N threshold as they are less likely to be confused with baseline fluctuations. In the few cases where more than one hydrogen line velocity component is detected, we assume that the brightest component is due to the H II region.
The continuum antenna temperature, , was derived for all observed positions from the continuum background of our averaged spectral line data by removing all lines above the 3 level. We also remove 20% of all channels towards each end of the bandpass, since the bandpass edges are prone to instabilities, and average the antenna temperature over the remaining baseline to find . Since the baseline stability is the dominant uncertainty contribution, the error in is estimated by averaging over individual segments of each baseline, 1000 channels in width, and by computing the standard deviation between these segments. All continuum antenna temperatures are given in Table A.3, which lists the source, , the LTE electron temperatures (; see §6.1), and the emission measures (EM; see §6.2), including all 1 uncertainties.
The averaged Hn spectra are shown in Figure A.1 and the derived Hn, Hn, and Hn RRL parameters are given in Table A.2 which lists the source, the transition, the element, the line intensity, the FWHM line width, the LSR velocity, the rms noise in the spectrum, and the total on-source integration time for each position, including the corresponding 1 uncertainties of the Gaussian fits. The averaged Hn and Hn spectra are shown in Figures A.2 and A.3, respectively.
3 The PDR Boundaries
Defining the PDR boundaries of the observed H II regions is a crucial step in determining the region properties. Since PAHs are abundant in PDRs where they emit strongly in the 8 m, 12 m, and 24 m bands (e.g. Hollenbach & Tielens, 1997), enhancements in the 12 m WISE emission can be used to trace the PDR itself. We define the PDR boundary for all observed regions by following the enhanced 12 m emission surrounding the H II region by hand. We estimate the inner and outer PDR boundary for each region such that the width of the PDR is the FWHM of the enhanced emission. Although this characterization of the PDR structure is by no means unique, results from L16 show that the above method appears to reliably trace the PDR around compact H II regions.
 |
 |
 |
 |
 |
 |
 |
 |
 |
 |
 |
 |
 |
 |
 |
 |
The PDR boundaries are determined using the above method for each of the 8 observed H II regions and the results are shown in Figure 1. The term “strong” refers to a PDR boundary for which the enhanced 12 m emission shows the largest contrast to the surrounding medium, whereas a “weak” PDR is barely distinguishable from the 12 m background. Several PDR boundaries are asymmetrical or incomplete in the associated 12 m emission. For example, in the case of G45, the western PDR boundary is much weaker and further away from the region center than the eastern boundary. For M16, the PDR shows discontinuities to the east and west, but is strong toward the north (the sampled directions). Similarly, the PDR boundary of Orion appears to be strongest toward the east and west and less so towards the south where it is at the largest distance from the center. Defining the PDR boundary of G29 is perhaps the most challenging of all observed regions due to its very weak 12 m emission, many discontinuities, and proximity to several nearby continuum sources.
For M16 and Orion, several PDR components are visible in a given direction. In these cases, we define the strongest PDR boundary as the “main” PDR. For a number of regions, the sharp decrease in 12 m intensity makes it difficult to unambiguously locate the PDR boundary toward some directions.
4 Hydrogen RRL Emission
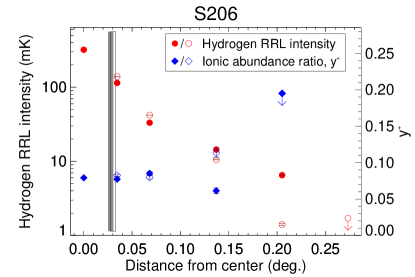
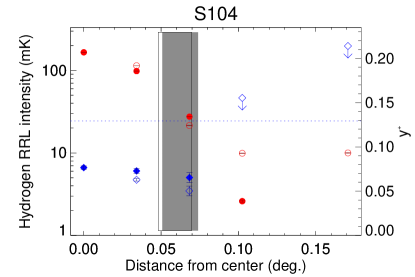
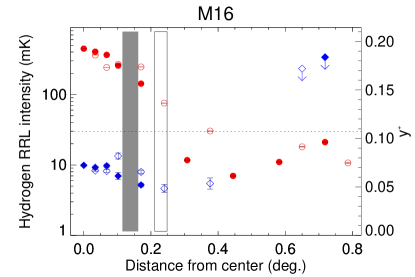
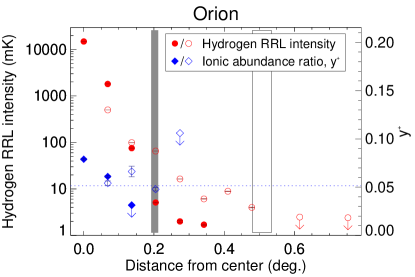
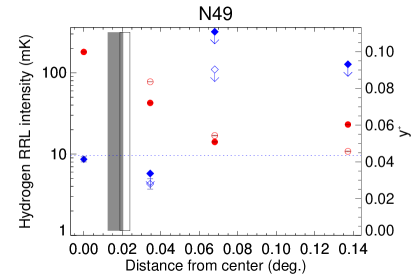
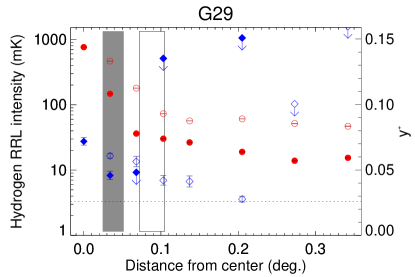
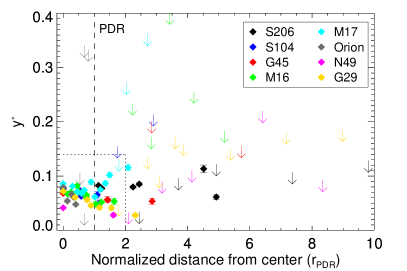
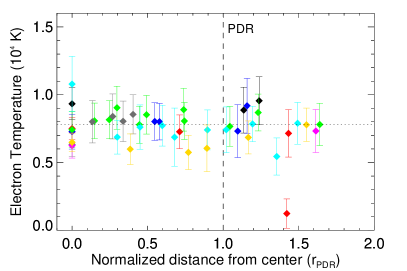
Using our GBT data, we test the hypothesis that high luminosity H II regions have a greater effect on maintaining the ionization of the WIM compared to compact H II regions, possibly because they allow a larger fraction of ionizing radiation to escape into the ISM. In Figure 2 the hydrogen RRL intensity is shown, averaged over the Hn transitions given in §2, and the ionic abundance ratio (see §5) as a function of distance from the region center for all observed H II regions. As expected, the RRL intensity decreases with increasing distance for all regions. Regions with more extended PDR boundaries (e.g., M16, M17, and Orion) have more extended emission than the observed compact regions, possibly because they are in a later evolutionary stage. In Figure 3 the hydrogen RRL emission is shown for all observed regions with distance, normalized by the radius of the PDR boundary along the given direction. It is striking that all observed H II regions except for Orion and perhaps M17 exhibit roughly the same hydrogen RRL emission gradient. We also show exponential fits of the form (where is the hydrogen RRL intensity, is the normalized distance from the region center, and and are the fit parameters) to the data to highlight the similarity between the gradients.
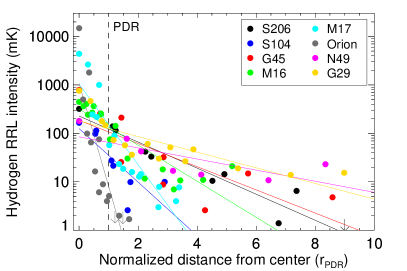
The inverse correlation between H II region size and the slope of the hydrogen RRL intensity may indicate that larger regions allow more ionizing photons to escape through their PDRs which in turn maintain the ionization of the surrounding WIM. Our results suggest that the total amount of escaping ionizing radiation is fundamentally correlated with the radius of the PDR boundary of that region. It is possible that the PDR boundaries surrounding large and luminous H II regions are generally weaker or more inhomogeneous than those surrounding more compact regions. In §3 we show that the PDRs around M16 and Orion are not as well-defined as the PDR boundaries around the more compact regions in our sample. For M16, this result could be related to the fact that large, high-luminosity H II regions are more likely to be density-bounded rather than radiation-bounded (Beckman et al., 1998), however, the PDR boundaries may be less well-defined for regions with multiple sources of ionization.
For a number of sources (M16, G29, N49), the intensity does not continue to decrease with distance from the center but rather flattens out beyond a certain radius. We hypothesize that this emission far from the region center is not due to the H II region itself but from the WIM. The observed hydrogen line intensities of 10–50 mK are not uncommon for WIM emission (see Anderson et al., 2015; Luisi et al., 2017). It is noteworthy that all these regions are at relatively low Galactic latitudes where presumably emission from the WIM is the strongest (Alves et al., 2012).
Several regions have more than one hydrogen line component. The southern positions of G29 exhibit a second component approximately –40 offset from the velocity of the H II region itself. There is also a second hydrogen line visible in N49 and in the southernmost positions of M16. Due to their low RRL intensities and since the existence of an additional H II region along the line of sight is unlikely, these additional line components are probably due to emission from the WIM (see Anderson et al., 2015). The second hydrogen component in the central position of M17 is too strong and spatially constrained to be caused by the WIM. It may instead be due to expansion processes within the H II region itself.
5 Ionic Abundance Ratios
It has been suggested that He-ionizing photons are suppressed as UV photons escape from H II regions (Hoopes & Walterbos, 2003; Wood & Mathis, 2004). The complex absorption and re-emission processes in the surrounding gas, however, have never been observed in detail and it is unclear whether this result is applicable to the Galactic H II region population as a whole. The hardness of the interstellar radiation field for our region sample can be constrained by deriving the ionic abundance ratio using our GBT data. Since helium (with an ionization potential of 24.6 eV) is ionized by harder radiation compared to hydrogen (13.6 eV), a larger value of indicates a more energetic radiation field.
We calculate using
| (2) |
where and are the line temperatures of helium and hydrogen, respectively, and and are the corresponding FWHM line widths (Peimbert et al., 1992). For positions with hydrogen but no helium detections, we use upper limits of and , where is the average line width ratio for the observed region. Our values for range from 0.59 to 0.87, which is consistent with previous studies by L16 () and Wenger et al. (2013, ). Since the atomic mass of hydrogen is approximately one-fourth that of helium, should be equal to in the absence of turbulence. The above values for therefore indicate that turbulence plays a significant role in broadening the observed line widths of our positions (see §7).
is shown for each individual H II region in Figure 2 and for all observed regions in Figure 4. We observe a decrease in with distance from the center for most regions. While previous results indicated an approximately constant value of within the region, and a decrease outside the PDR boundary (L16; see also Balser et al., 2001), our sample shows a relatively steady decrease with angular offset regardless of the sampled location with respect to the PDR. We fit a linear profile, (where is the distance to the center of the H II region in degrees, and and are the fitting parameters), to the ionic abundance ratios of each region, separately for each direction from the region center. We also calculate Spearman’s rank correlation coefficient, , both for each direction separately and for each H II region as a whole. We give the fitting parameters and Spearman’s in Table 2. Our results support the hypothesis that a large fraction of He-ionizing photons is being absorbed well within the H II region boundary. We note that the measured gradient may also partly be due to the geometries of the observed H II regions since we implicitly assume in the derivation of that both H+ and He+ fill the beam. We expect to find environments near ionization fronts where hydrogen exists in predominantly ionized form, but where helium remains mostly neutral (see Pankonin et al., 1980). Depending on the geometry of the region, the telescope beam may intersect several ionization fronts, and for these lines of sight the value of would be lower than expected.
| Source | Direction | Spearman’s | Spearman’s | ||||
|---|---|---|---|---|---|---|---|
| (deg-1) | (deg-1) | (along direction) | (total) | ||||
| S206 | East | ||||||
| West | |||||||
| S104 | North | ||||||
| South | |||||||
| G45 | East | ||||||
| West | |||||||
| M16 | North | ||||||
| South | |||||||
| M17 | East | ||||||
| West | |||||||
| Orion | North | ||||||
| South | |||||||
| N49 | East | ||||||
| West | |||||||
| G29 | North | ||||||
| South |
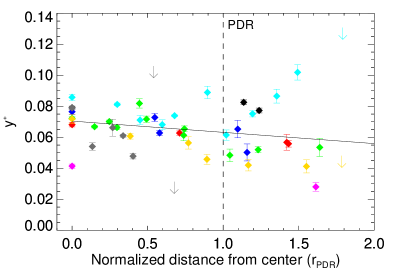
Two regions do not follow the general trend of decreasing : S206 and M17. S206 shows an increase of with distance and for M17 the results are inconclusive. It is unclear why these two regions exhibit such different behavior than the rest of our sample. S206 is a relatively compact H II region without much extended emission, whereas M17 is one of the largest and brightest H II regions in the Milky Way. This suggests that the measured increase in may not be related to the size or morphology of the these two regions.
6 Physical Properties of the Ionized Gas
6.1 LTE Electron Temperatures
The electron temperature, , is a proxy for the metallicity of an H II region (e.g., Rubin, 1985) and can be used to study its intrinsic heating and cooling processes. Previous studies have found conflicting results regarding the relationship between inside and outside the PDR boundaries of H II regions. Most research shows a relatively constant electron temperature distribution within H II regions (e.g., Roelfsema et al., 1992; Adler et al., 1996; Rubin et al., 2003), but there has been evidence for a decrease of with increasing distance from Orion A (Wilson et al., 2015). Under the assumption of LTE, can be derived by
| (3) |
where GHz is the average frequency of our Hn recombination lines, is the continuum antenna temperature, is the H line antenna temperature, is the FWHM line width, and is the ionic abundance ratio from Eq. 2 (Mezger & Ellis, 1968; Quireza et al., 2006).
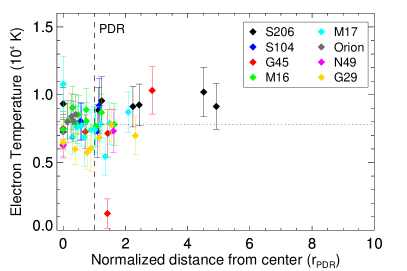
The derived are shown in Figure 5 for all observed positions where the He line could be detected. While the average electron temperature for each H II region is slightly different, there are no large variations of with distance for any of the observed regions. For G45, our derived electron temperature of at a normalized distance of is abnormally low. At this position, our calculated continuum antenna temperature used to derive is affected by severe baseline instability in our the spectra. We therefore argue that here our value of does not reflect the actual electron temperature. This assumption is supported by our line profile analysis (§7), which yields an estimated electron temperature of K for this direction. We disregard this position for all further analysis.
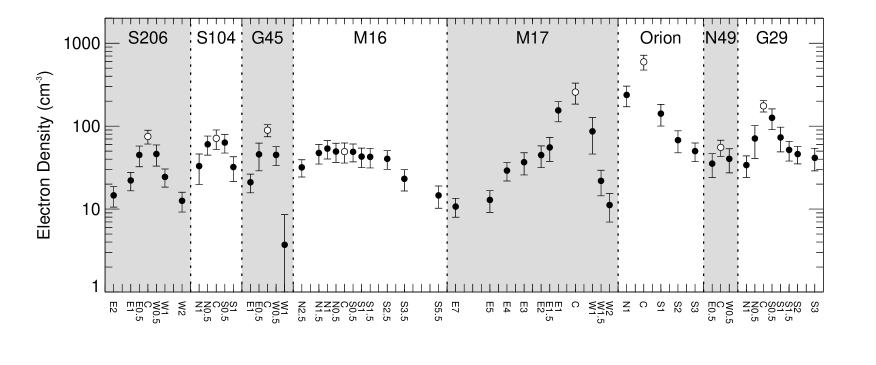
6.2 Electron Densities
Assuming that the ionized gas is in LTE, we are able to constrain the emission measure and the root mean square electron number density for each observed direction. The emission measure, EM, is defined as the integral of the electron density squared, , along the line of sight. Because the emission measure is proportional to the optical depth at the line center, , the brightness temperature of a recombination emission line can be estimated by
| (4) |
where is the brightness temperature at the line center and is the line FWHM (Condon & Ransom, 2016). Assuming that the RRL emitting region is extended evenly across the GBT beam and using a GBT main beam efficiency of 0.94 at C-band (Maddalena, 2010, 2012), the emission measure can be expressed as
| (5) |
We use our LTE electron temperatures, , to calculate the EM for all positions for which an He line was detected. The resulting EM values range from pc cm-6 to pc cm-6, with the largest values found toward the central directions of Orion and M17 (see Figure 6, top panel). All observed H II regions show a decrease in EM with distance from the center, with the exception of M16 whose EM remains roughly constant within the PDR boundaries. The derived EM values are given in Table A.3.
The root mean square electron number density, , can be estimated from the derived emission measures, assuming the H II region geometry is approximated by a slab of constant line-of-sight path length and uniform density. We further assume that the path length for each H II region is twice its radius, , as given in Table 1. By definition,
| (6) |
such that
| (7) |
We calculate for all positions with an He line detection and show the calculated values in the bottom panel of Figure 6. Due to our assumption of constant path length for each region, follows the same trends as EM.

6.3 Non-LTE Analysis
There is debate in the literature on whether H II regions and their surroundings are typically close to LTE. In a study of 72 Galactic H II regions, Balser et al. (2011) argue that non-LTE effects, such as stimulated emission should be small within H II regions. Dupree & Goldberg (1970) show for three Galactic H II regions that the observed intensity ratios of Hn and higher-order lines systematically deviate from the theoretical values; in their sample the Hn to Hn line intensity ratio is generally 20–30% lower than the LTE value. They suggest that this effect is due to departure from LTE and further argue that non-LTE effects are different for each level population (see also Zuckerman et al., 1967). While stimulated emission typically affects -lines more strongly than -lines at the same frequency and could account for the lower line ratios, Shaver & Wilson (1979) suggest that instead the observed line ratios are produced by pressure broadening. They argue that consequently there is no clear evidence of non-LTE effects in single-dish RRL observations of Galactic H II regions (Shaver, 1980).
Unfortunately, our - and -line data cannot be used to test for LTE since we did not detect RRLs in most individual Hn and Hn spectra. While the hydrogen line is detected toward many directions after averaging together the - and -lines, respectively, the averaged spectra are centered at different frequencies than our -lines. Thus, the average beam size varies and a different region of space is sampled for each level population.
The departure from LTE can, however, be directly quantified using our Hn line data. The following analysis is based on our derived LTE electron temperatures (§6.1) and root mean square electron densities (§6.2). The necessary calculations are from Brocklehurst & Salem (1977) and Salem & Brocklehurst (1979), and include the effect of stimulated emission due to an external radiation field, as well as collisional transitions from excited atom–electron collisions. As a first-order approximation, we assume that the conditions toward our observed directions are typical for H II regions but that there is no incident radiation present (see Salem & Brocklehurst, 1979). Given our average for the observed -lines, we perform a bilinear interpolation between the electron temperature and electron density values from Salem & Brocklehurst (1979, their Table 1) to find the departure coefficient () that matches our values of and . relates the number of atoms in level to the number that would be there if the system were in thermodynamic equilibrium. Using the same method, we also find the amplification factor () which describes an enhancement of the stimulated emission due to the overpopulation of level relative to lower states.
Our values for range from 0.76 to 0.96 and ranges from 46 to 136. With average , there is only a small deviation from LTE for all observed directions. We notice a trend of decreasing with increasing distance from the all H II regions in our sample. This effect is particularly strong for the more luminous H II regions (e.g., M17) and is likely due to the steep decrease in electron density while remains roughly constant. The largest values are found toward the central positions of M17, Orion, and G29, suggesting that due to the large electron densities the collision rates dominate the level populations at these locations.
We note that our non-LTE analysis of the observed positions is only a rough approximation due to the following two reasons. First, and are mean values averaged along the line of sight and over the beam. Given our large average beam (″) and the H II region geometries, many different physical environments must contribute to these parameters for each observed position. This becomes especially important near the central locations and the PDRs of each H II region where the spatial gradients of electron temperature and density are presumably the steepest. Second, we use and to estimate and . Since and are based on the assumption of LTE, this approach is only valid for positions that are near LTE.
While our derived and values assume constant density and temperature, and are therefore not truly representative of the values in real H II regions, we argue that is a reasonable approximation of the true electron temperature averaged along the line of sight and over the HPBW. The line opacities are small for these sources at the observed frequencies, which decreases the impact of stimulated emission. Therefore, provides a good estimate of the deviation from LTE despite typical values of for (see, e.g., Salem & Brocklehurst, 1979). With close to unity for all observed positions, it is unlikely that the true average electron temperatures deviate significantly from .
7 Line Profile Analysis
The observed line widths of RRLs within and near H II regions predominantly depend on two variables: the temperature of the plasma (thermal line broadening) and the amount of turbulence in the local ISM (turbulent line broadening). Other mechanisms that affect the observed line widths, such as natural broadening or pressure broadening, are thought to be negligible given our observed frequencies and electron densities (Hoang-Binh, 1972).
Here we assume that the RRL widths are only affected by thermal broadening and turbulent broadening. Therefore,
| (8) |
where is the observed FWHM of the hydrogen RRL, is the electron temperature, is the mass of the hydrogen atom, and is the velocity contribution due to turbulence. The first term in the parentheses thus corresponds to the thermal contribution, while the constant of 2.355 accounts for the conversion from the one-dimensional velocity dispersion to FWHM. Since we can measure directly, only two unknowns remain, and . These, however, can be expressed in terms of each other by observing the helium RRL toward the same direction, as long as and are unchanged between the two species. After accounting for natural constants and atomic masses,
| (9) |
where is the observed FWHM of the helium RRL.

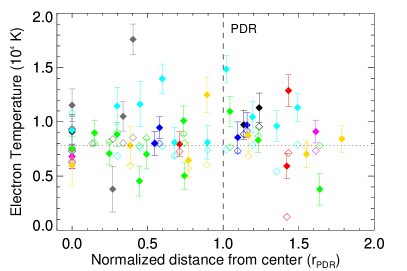
Our results for are shown in Figure 7. As for , only directions for which the helium line was detected are included. The average electron temperature is K outside the H II region PDRs and K within. As for , this difference is not statistically significant. The larger deviation between individual values of suggests that this method of calculation is less robust than that described in §6.1. This may be due to the strong dependence of on the width of the observed hydrogen and helium RRLs, and the fact that may have larger uncertainties than those given in Table A.2 because of its low intensity and sensitivity to baseline variations. Due to the large deviation between individual values of , we use only as a consistency check in this work.
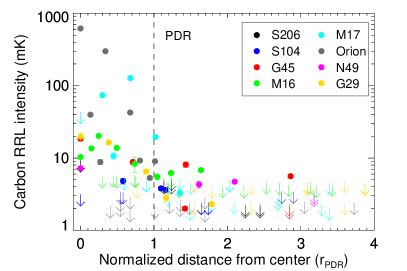
8 Carbon RRLs
Previous results suggest that carbon RRL emission is often observed from H II region PDRs (e.g., Hollenbach & Tielens, 1999, L16). This is possibly due to its first ionization potential of only 11.3 eV, which is lower than that of hydrogen or helium. The carbon in H II region PDRs may therefore be ionized by soft-UV photons ( eV) that pass through the H II region essentially undisturbed, aside from being attenuated by dust.
We do not observe enhanced carbon RRL emission near the PDR boundaries for most H II regions in our sample (see top panel of Figure 8). Instead, the emission is strongest within the H II regions and decreases steadily with distance. While it is likely that a fraction of the PDR is contained within the telescope beam along the line of sight, this may also suggest that a large number of soft-UV photons are attenuated by dust present within the H II regions. S104 is the only observed source for which the line emission may be increased near the PDR. The large number of non-detections for S104, however, casts doubt on the statistical significance of this interpretation.
At low frequencies, carbon can be observed in either absorption lines or amplified emission lines due to stimulated emission from inverted populations. Observations of Cas A at 26 MHz show spectral features consistent with the detection of a carbon- absorption line at (Konovalenko & Sodin, 1981; Walmsley & Watson, 1982). In an Ooty Radio Telescope study of RRLs near 327 MHz, Roshi et al. (2002) found evidence of stimulated emission, resulting a strong correlation between carbon RRL intensity and continuum emission.
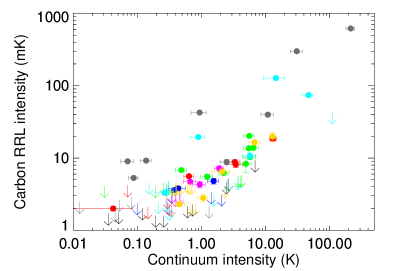
To test whether carbon RRL emission is amplified by stimulated emission at our higher average observing frequency of 6 GHz, we show the carbon RRL intensity as a function of continuum intensity in the bottom panel of Figure 8. While there is a correlation between the carbon emission and the continuum intensity, the spread in our data is quite large. Most of the spread, however, is caused by only two sources, Orion and M17, which show stronger carbon RRL emission than expected given their background continuum intensity. These two sources are among the largest and most luminous H II regions in our sample. This suggests that much of the carbon emission may be amplified by stimulated emission. At large distance offsets, a possible lack of amplification of the carbon lines by stimulated emission may explain our carbon non-detections where the continuum emission is weak. It is also possible that a low carbon abundance in the diffuse medium at these positions is responsible for the non-detections.
9 He++ Emission
The second ionization potential of helium at 54.4 eV exceeds helium’s first ionization potential by over a factor of two and thus He+ is ionized by only the most energetic radiation fields within H II regions. Previous GBT observations by Roshi et al. (2017) failed to detect emission from He++ in the diffuse gas surrounding ultracompact H II (UCH II) regions. Their combined 1 upper limit for their setup is 4 mK, however, they only observed 3 UCH II regions with a total of 18 independent pointings.
Although many of our sampled positions are cospatial with luminous H II regions, we did not detect the He++ line. The rms values for our individual positions range from 3 to 20 mK, corresponding to upper limits for the He++ line of 9 to 60 mK. Our best upper limit for the He++/He+ line ratio is 0.064, sampled at the central position of Orion. We average together all positions for which the line intensity of singly-ionized He is at least 30 mK after shifting them in velocity, and again fail to detect the He++ line. The rms of our combined, averaged spectrum is 0.6 mK, corresponding to a 3 upper limit for the He++ line of 1.8 mK.
10 Conclusions
Despite our recent studies (Anderson et al., 2015, L16), radiation leaking from Galactic H II regions is still not well-understood. Models and observations of external galaxies suggest that 30–70% of the emitted ionizing radiation escapes from H II regions into the ISM (Oey & Kennicutt, 1997; Zurita et al., 2002; Giammanco et al., 2005; Pellegrini et al., 2012). Due to observational constraints, however, these studies tend to be biased towards the largest and most luminous H II regions which only make up a small fraction of the total number of H II regions in a given galaxy. Here we observe a sample of Galactic H II regions of various sizes, geometries, and luminosities, including several compact (radius pc) H II regions whose extragalactic counterparts may have been missed in previous studies.
If ionizing radiation leaking from an individual H II region is responsible for maintaining the ionization of the WIM around that region, we expect a decrease in RRL intensity with distance from the region, for which the slope of the decrease is believed to roughly constrain the amount of leaking photons (see L16). We observe a power-law decrease in hydrogen RRL emission intensity outside the PDR of all observed H II regions (see Figure 3). We showed in §4 that the hydrogen line intensity decreases with roughly the same slope for all our targets except Orion when normalizing the angular offset from the region center by the radius of the PDR. This suggests that the slope in the decrease of hydrogen RRL intensity with distance is directly related to the size of the region. The case of Orion is further complicated by its highly asymmetrical geometry and the presence of several PDR boundaries toward the observed directions. In fact, when defining the innermost visible enhancement in 12 m emission as the main PDR boundary, its slope is similar to that of the other sources, suggesting that the power-law decrease of hydrogen RRL intensity with distance and region size may fundamentally be the same for all Galactic H II regions. The physical implications of this result are unclear, although it may be related to a transition from ionization-bounded to density-bounded behavior (e.g., Rozas et al., 1998; Zurita et al., 2002).
Using the ionic abundance ratio, , the hardness of the interstellar radiation field can be constrained for our region sample. We observe a general trend of decreasing with distance from the H II regions. This is indicative of absorption of He-ionizing photons within the ionization front of the H II region. It is unclear why two of the observed regions, S206 and M17, do not follow this trend. The difference in their physical properties, such as M17 being ionized by more than one O star, makes it unlikely that this is due to the region’s size, luminosity, or morphology.
The electron temperature, , is believed to remain relatively constant within H II regions (Roelfsema et al., 1992; Adler et al., 1996; Rubin et al., 2003), although recently Wilson et al. (2015) reported on a decrease in with increasing distance from Orion A. We calculate the electron temperature for our positions with He detections using two independent methods. The first method assumes that LTE is satisfied for all observed directions (see also Mezger & Ellis, 1968; Quireza et al., 2006). We find no general trends in the derived electron temperatures with distance from the H II regions and no statistically significant difference between within and outside the H II region PDRs. The second method is based on a line profile analysis and assumes that and the amount of turbulent line broadening remain the same between hydrogen and helium. Although LTE is not required, this method appears to be less robust than the first, possibly due to the larger contribution of line width uncertainties on the overall uncertainty in . We, again, do not detect a significant difference between electron temperatures within and outside the H II region PDRs.
Our H II region sample spans a wide range of emission measures, EM, and root mean square electron densities, . While most observed directions have cm-3, the electron densities at the central locations of M17 and Orion are as large as 258 cm-3 and 596 cm-3, respectively. These values are significantly lower than those found by optical line tracers (e.g., Danks, 1970; Kitchin, 1987), possibly because they are based on averaged along the line of sight and over the HPBW. With an average departure coefficient of , we do not find strong departure from LTE in our sample. We note that is largest toward the high- regions at the central locations of our H II regions sample where the level populations are dominated by collisions. As expected, decreases with increasing distance from all observed H II regions, suggesting that non-LTE effects become more significant in the lower-density envelopes surrounding Galactic H II regions.
Finally, we do not find enhanced carbon RRL emission near the PDR boundaries, as has been observed previously (Hollenbach & Tielens, 1999, L16). This may indicate selective attenuation of soft-UV photons by dust within the H II regions. However, there exists a correlation between carbon RRL intensity and continuum intensity. This suggests that the carbon emission is amplified by stimulated emission, a relationship that has previously only been observed at frequencies below 1 GHz (Roshi et al., 2002).
References
- Adler et al. (1996) Adler, D. S., Wood, D. O. S., & Goss, W. M. 1996, ApJ, 471, 871, doi: 10.1086/178014
- Afflerbach et al. (1997) Afflerbach, A., Churchwell, E., & Werner, M. W. 1997, ApJ, 478, 190, doi: 10.1086/303771
- Alves et al. (2012) Alves, M. I. R., Davies, R. D., Dickinson, C., et al. 2012, MNRAS, 422, 2429, doi: 10.1111/j.1365-2966.2012.20796.x
- Anderson et al. (2014) Anderson, L. D., Bania, T. M., Balser, D. S., et al. 2014, ApJS, 212, 1, doi: 10.1088/0067-0049/212/1/1
- Anderson et al. (2015) Anderson, L. D., Hough, L. A., Wenger, T. V., Bania, T. M., & Balser, D. S. 2015, ApJ, 810, 42, doi: 10.1088/0004-637X/810/1/42
- Anderson et al. (2015) Anderson, L. D., Deharveng, L., Zavagno, A., et al. 2015, ApJ, 800, 101, doi: 10.1088/0004-637X/800/2/101
- Balser (2006) Balser, D. S. 2006, AJ, 132, 2326, doi: 10.1086/508515
- Balser et al. (2001) Balser, D. S., Goss, W. M., & De Pree, C. G. 2001, AJ, 121, 371, doi: 10.1086/318028
- Balser et al. (2011) Balser, D. S., Rood, R. T., Bania, T. M., & Anderson, L. D. 2011, ApJ, 738, 27, doi: 10.1088/0004-637X/738/1/27
- Bania et al. (2014) Bania, T., Wenger, T., Balser, D., & Anderson, L. 2014, tmbidl: TMBIDL v7.1, Zenodo. dx.doi.org/10.5281/zenodo.32790
- Beckman et al. (1998) Beckman, J. E., Rozas, M., & Knapen, J. H. 1998, PASA, 15, 83, doi: 10.1071/AS98083
- Beckman et al. (2000) Beckman, J. E., Rozas, M., Zurita, A., Watson, R. A., & Knapen, J. H. 2000, AJ, 119, 2728, doi: 10.1086/301380
- Bell et al. (2011) Bell, M. B., Avery, L. W., MacLeod, J. M., & Vallée, J. P. 2011, Ap&SS, 333, 377, doi: 10.1007/s10509-011-0662-5
- Brocklehurst & Salem (1977) Brocklehurst, M., & Salem, M. 1977, Computer Physics Communications, 13, 39, doi: 10.1016/0010-4655(77)90025-X
- Broos et al. (2007) Broos, P. S., Feigelson, E. D., Townsley, L. K., et al. 2007, ApJS, 169, 353, doi: 10.1086/512068
- Cesaroni et al. (1994) Cesaroni, R., Churchwell, E., Hofner, P., Walmsley, C. M., & Kurtz, S. 1994, A&A, 288, 903
- Churchwell et al. (1974) Churchwell, E., Mezger, P. G., & Huchtmeier, W. 1974, A&A, 32, 283
- Condon & Ransom (2016) Condon, J. J., & Ransom, S. M. 2016, Essential Radio Astronomy, ed. D. N. Spergel (Princeton University Press)
- Danks (1970) Danks, A. C. 1970, A&A, 9, 175
- Domgörgen & Mathis (1994) Domgörgen, H., & Mathis, J. S. 1994, ApJ, 428, 647, doi: 10.1086/174275
- Draine (2011) Draine, B. T. 2011, Physics of the Interstellar and Intergalactic Medium, ed. D. N. Spergel (Princeton)
- Dupree & Goldberg (1970) Dupree, A. K., & Goldberg, L. 1970, ARA&A, 8, 231, doi: 10.1146/annurev.aa.08.090170.001311
- Georgelin et al. (1973) Georgelin, Y. M., Georgelin, Y. P., & Roux, S. 1973, A&A, 25, 337
- Giammanco et al. (2005) Giammanco, C., Beckman, J. E., & Cedrés, B. 2005, A&A, 438, 599, doi: 10.1051/0004-6361:20042268
- Gottesman & Gordon (1970) Gottesman, S. T., & Gordon, M. A. 1970, ApJL, 162, L93, doi: 10.1086/180631
- Haffner et al. (1999) Haffner, L. M., Reynolds, R. J., & Tufte, S. L. 1999, ApJ, 523, 223, doi: 10.1086/307734
- Haffner et al. (2009) Haffner, L. M., Dettmar, R.-J., Beckman, J. E., et al. 2009, RvMP, 81, 969, doi: 10.1103/RevModPhys.81.969
- Hoang-Binh (1972) Hoang-Binh, D. 1972, in Les Spectres des Astres dans l’Infrarouge et les Microondes, 367–370
- Hollenbach & Tielens (1997) Hollenbach, D. J., & Tielens, A. G. G. M. 1997, ARA&A, 35, 179, doi: 10.1146/annurev.astro.35.1.179
- Hollenbach & Tielens (1999) Hollenbach, D. J., & Tielens, A. G. G. M. 1999, RvMP, 71, 173, doi: 10.1103/RevModPhys.71.173
- Hoopes & Walterbos (2003) Hoopes, C. G., & Walterbos, R. A. M. 2003, ApJ, 586, 902
- Kitchin (1987) Kitchin, C. R. 1987, Stars, nebulae and the interstellar medium. Observational physics and astrophysics (Bristol: Hilger, 1987)
- Konovalenko & Sodin (1981) Konovalenko, A. A., & Sodin, L. G. 1981, Nature, 294, 135, doi: 10.1038/294135a0
- Lahulla (1985) Lahulla, J. F. 1985, A&AS, 61, 537
- Lenz & Ayres (1992) Lenz, D. D., & Ayres, T. R. 1992, PASP, 104, 1104, doi: 10.1086/133096
- Lichten et al. (1979) Lichten, S. M., Rodriguez, L. F., & Chaisson, E. J. 1979, ApJ, 229, 524, doi: 10.1086/156985
- Luisi et al. (2016) Luisi, M., Anderson, L. D., Balser, D. S., Bania, T. M., & Wenger, T. V. 2016, ApJ, 824, 125, doi: 10.3847/0004-637X/824/2/125
- Luisi et al. (2017) Luisi, M., Anderson, L. D., Balser, D. S., Wenger, T. V., & Bania, T. M. 2017, ApJ, 849, 117, doi: 10.3847/1538-4357/aa8fd2
- Luisi et al. (2018) Luisi, M., Anderson, L. D., Bania, T. M., et al. 2018, PASP, 130, 084101, doi: 10.1088/1538-3873/aac8e9
- Maddalena (2010) Maddalena, R. J. 2010, Theoretical Ratio of Beam Efficiency to Aperture Efficiency, Tech. rep., National Radio Astronomy Observatory
- Maddalena (2012) —. 2012, Modeling the Elevation and Frequency Dependence of Aperture Efficiency for the GBT s Pipeline, Tech. rep., National Radio Astronomy Observatory
- Madsen et al. (2006) Madsen, G. J., Reynolds, R. J., & Haffner, L. M. 2006, ApJ, 652, 401, doi: 10.1086/508441
- Martins et al. (2005) Martins, F., Schaerer, D., & Hillier, D. J. 2005, A&A, 436, 1049, doi: 10.1051/0004-6361:20042386
- McGee & Newton (1981) McGee, R. X., & Newton, L. M. 1981, MNRAS, 196, 889, doi: 10.1093/mnras/196.4.889
- Mehringer (1994) Mehringer, D. M. 1994, ApJS, 91, 713, doi: 10.1086/191953
- Mezger (1978) Mezger, P. G. 1978, A&A, 70, 565
- Mezger & Ellis (1968) Mezger, P. G., & Ellis, S. A. 1968, ApJL, 1, 159
- Moisés et al. (2011) Moisés, A. P., Damineli, A., Figuerêdo, E., et al. 2011, MNRAS, 411, 705, doi: 10.1111/j.1365-2966.2010.17713.x
- O’Dell et al. (2017) O’Dell, C. R., Kollatschny, W., & Ferland, G. J. 2017, ApJ, 837, 151, doi: 10.3847/1538-4357/aa6198
- Oey & Kennicutt (1997) Oey, M. S., & Kennicutt, R. C. J. 1997, MNRAS, 291, 827
- Osterbrock (1989) Osterbrock, D. 1989, Astrophysics of gaseous nebulae and active galactic nuclei (University Science Books)
- Pankonin et al. (1980) Pankonin, V., Walmsley, C. M., & Thum, C. 1980, A&A, 89, 173
- Peimbert et al. (1992) Peimbert, M., Rodriguez, L. F., Bania, T. M., Rood, R. T., & Wilson, T. L. 1992, ApJ, 395, 484, doi: 10.1086/171668
- Pellegrini et al. (2012) Pellegrini, E. W., Oey, M. S., Winkler, P. F., et al. 2012, ApJ, 755, 40, doi: 10.1088/0004-637X/755/1/40
- Quireza et al. (2006) Quireza, C., Rood, R. T., Bania, T. M., Balser, D. S., & Maciel, W. J. 2006, ApJ, 653, 1226, doi: 10.1086/508803
- Reynolds et al. (1995) Reynolds, R. J., Tufte, S. L., Kung, D. T., McCullough, P. R., & Heiles, C. 1995, ApJ, 448, 715, doi: 10.1086/175999
- Roelfsema et al. (1992) Roelfsema, P. R., Goss, W. M., & Mallik, D. C. V. 1992, ApJ, 394, 188, doi: 10.1086/171570
- Roshi et al. (2017) Roshi, D. A., Churchwell, E., & Anderson, L. D. 2017, ApJ, 838, 144, doi: 10.3847/1538-4357/aa662b
- Roshi et al. (2002) Roshi, D. A., Kantharia, N. G., & Anantharamaiah, K. R. 2002, A&A, 391, 1097, doi: 10.1051/0004-6361:20020899
- Roshi et al. (2012) Roshi, D. A., Plunkett, A., Rosero, V., & Sravani, V. 2012, ApJ, 749, 49, doi: 10.1088/0004-637X/749/1/49
- Rozas et al. (1998) Rozas, M., Castaneda, H. O., & Beckman, J. E. 1998, A&A, 330, 873
- Rubin (1985) Rubin, R. H. 1985, ApJS, 57, 349, doi: 10.1086/191007
- Rubin et al. (2003) Rubin, R. H., Martin, P. G., Dufour, R. J., et al. 2003, MNRAS, 340, 362, doi: 10.1046/j.1365-8711.2003.06185.x
- Salem & Brocklehurst (1979) Salem, M., & Brocklehurst, M. 1979, ApJS, 39, 633, doi: 10.1086/190588
- Shaver (1980) Shaver, P. A. 1980, A&A, 90, 34
- Shaver & Wilson (1979) Shaver, P. A., & Wilson, T. L. 1979, A&A, 79, 312
- Sota et al. (2011) Sota, A., Maíz Apellániz, J., Walborn, N. R., et al. 2011, ApJS, 193, 24, doi: 10.1088/0067-0049/193/2/24
- Strömgren (1939) Strömgren, B. 1939, ApJ, 89, 526, doi: 10.1086/144074
- Thum et al. (1980) Thum, C., Mezger, P. G., & Pankonin, V. 1980, A&A, 87, 269
- Walmsley & Watson (1982) Walmsley, C. M., & Watson, W. D. 1982, ApJ, 260, 317, doi: 10.1086/160256
- Watson et al. (2008) Watson, C., Povich, M. S., Churchwell, E. B., et al. 2008, ApJ, 681, 1341, doi: 10.1086/588005
- Weber et al. (2018) Weber, J. A., Pauldrach, A. W. A., & Hoffmann, T. L. 2018, ArXiv e-prints
- Wenger et al. (2013) Wenger, T. V., Bania, T. M., Balser, D. S., & Anderson, L. D. 2013, ApJ, 764, 34, doi: 10.1088/0004-637X/764/1/34
- Wilson et al. (2015) Wilson, T. L., Bania, T. M., & Balser, D. S. 2015, ApJ, 812, 45, doi: 10.1088/0004-637X/812/1/45
- Wood et al. (2010) Wood, K., Hill, A. S., Joung, M. R., et al. 2010, ApJ, 721, 1397, doi: 10.1088/0004-637X/721/2/1397
- Wood & Mathis (2004) Wood, K., & Mathis, J. S. 2004, MNRAS, 353, 1126, doi: 10.1111/j.1365-2966.2004.0784
- Zuckerman et al. (1967) Zuckerman, B., Palmer, P., Penfield, H., & Lilley, A. E. 1967, ApJL, 149, L61, doi: 10.1086/180057
- Zurita et al. (2002) Zurita, A., Beckman, J. E., Rozas, M., & Ryder, S. 2002, A&A, 386, 801, doi: 10.1051/0004-6361:20020212
- Zurita et al. (2000) Zurita, A., Rozas, M., & Beckman, J. E. 2000, A&A, 363, 9
Appendix A Observed RRL Parameters and Derived Source Properties
| Source | RA | Dec | PDRaa “out” = outside the PDR, “on” = on the PDR, “in” = inside the PDR. | ||
|---|---|---|---|---|---|
| (J2000) | (J2000) | (deg.) | (deg.) | ||
| S206_C | 04:03:15.8 | 51:18:54 | 150.593 | 0.951 | in |
| S206_E0.5 | 04:03:20.1 | 51:16:57 | 150.623 | 0.968 | out |
| S206_E1 | 04:03:24.2 | 51:15:02 | 150.652 | 0.985 | out |
| S206_E2 | 04:03:32.8 | 51:11:07 | 150.712 | 1.019 | out |
| S206_E3 | 04:03:41.1 | 51:07:15 | 150.771 | 1.053 | out |
| S206_W0.5 | 04:03:11.5 | 51:20:51 | 150.563 | 0.934 | out |
| S206_W1 | 04:03:07.5 | 51:22:46 | 150.534 | 0.917 | out |
| S206_W2 | 04:02:58.8 | 51:26:41 | 150.474 | 0.883 | out |
| S206_W3 | 04:02:50.3 | 51:30:33 | 150.415 | 0.849 | out |
| S206_W4 | 04:02:41.9 | 51:34:25 | 150.356 | 0.815 | out |
| S104_C | 20:17:41.9 | 36:45:31 | 74.762 | 0.619 | in |
| S104_N0.5 | 20:17:34.0 | 36:46:49 | 74.765 | 0.653 | in |
| S104_N1 | 20:17:26.2 | 36:48:09 | 74.769 | 0.687 | on |
| S104_N1.5 | 20:17:18.3 | 36:49:27 | 74.772 | 0.721 | out |
| S104_S0.5 | 20:17:49.8 | 36:44:14 | 74.759 | 0.585 | in |
| S104_S1 | 20:17:57.7 | 36:42:56 | 74.756 | 0.551 | on |
| S104_S1.5 | 20:18:05.5 | 36:41:35 | 74.752 | 0.517 | out |
| S104_S2.5 | 20:18:21.1 | 36:38:57 | 74.745 | 0.449 | out |
| G45_C | 19:14:19.6 | 11:09:01 | 45.448 | 0.064 | in |
| G45_E0.5 | 19:14:22.6 | 11:10:56 | 45.482 | 0.068 | out |
| G45_E1 | 19:14:25.8 | 11:12:49 | 45.516 | 0.071 | out |
| G45_E2 | 19:14:31.8 | 11:16:39 | 45.584 | 0.079 | out |
| G45_E3 | 19:14:38.0 | 11:20:28 | 45.652 | 0.086 | out |
| G45_W0.5 | 19:14:16.6 | 11:07:06 | 45.414 | 0.060 | in |
| G45_W1 | 19:14:13.4 | 11:05:12 | 45.380 | 0.057 | out |
| G45_W2 | 19:14:07.4 | 11:01:22 | 45.312 | 0.049 | out |
| G45_W3 | 19:14:01.2 | 10:57:34 | 45.244 | 0.042 | out |
| M16_C | 18:18:37.0 | 13:43:46 | 17.001 | 0.869 | in |
| M16_N0.5 | 18:18:29.3 | 13:42:58 | 16.998 | 0.903 | in |
| M16_N1 | 18:18:21.5 | 13:42:09 | 16.995 | 0.937 | in |
| M16_N1.5 | 18:18:13.9 | 13:41:18 | 16.993 | 0.971 | in |
| M16_N2.5 | 18:17:58.4 | 13:39:41 | 16.987 | 1.039 | out |
| M16_N4.5 | 18:17:27.3 | 13:36:22 | 16.976 | 1.176 | out |
| M16_N6.5 | 18:16:56.5 | 13:33:05 | 16.965 | 1.312 | out |
| M16_N8.5 | 18:16:25.4 | 13:29:45 | 16.954 | 1.449 | out |
| M16_N10.5 | 18:15:54.6 | 13:26:27 | 16.943 | 1.585 | out |
| M16_S0.5 | 18:18:44.8 | 13:44:35 | 17.004 | 0.835 | in |
| M16_S1 | 18:18:52.5 | 13:45:23 | 17.007 | 0.801 | in |
| M16_S1.5 | 18:19:00.1 | 13:46:15 | 17.009 | 0.767 | in |
| M16_S2.5 | 18:19:15.7 | 13:47:51 | 17.015 | 0.699 | in |
| M16_S3.5 | 18:19:31.3 | 13:49:33 | 17.020 | 0.630 | on |
| M16_S5.5 | 18:20:02.2 | 13:52:49 | 17.031 | 0.494 | out |
| M16_S9.5 | 18:21:04.3 | 13:59:22 | 17.053 | 0.221 | out |
| M16_S11.5 | 18:21:35.3 | 14:02:38 | 17.064 | 0.085 | out |
| M17_C | 18:20:30.1 | 16:10:44 | 15.057 | 0.689 | in |
| M17_E1 | 18:20:41.1 | 16:07:35 | 15.124 | 0.703 | in |
| M17_E1.5 | 18:20:46.4 | 16:05:57 | 15.158 | 0.709 | in |
| M17_E2 | 18:20:51.8 | 16:04:24 | 15.191 | 0.716 | in |
| M17_E3 | 18:21:02.8 | 16:01:15 | 15.258 | 0.730 | in |
| M17_E4 | 18:21:13.7 | 15:58:06 | 15.325 | 0.744 | out |
| M17_E5 | 18:21:24.5 | 15:54:55 | 15.392 | 0.757 | out |
| M17_E6 | 18:21:35.4 | 15:51:46 | 15.459 | 0.771 | out |
| M17_E7 | 18:21:46.3 | 15:48:37 | 15.526 | 0.785 | out |
| M17_E9 | 18:22:08.0 | 15:42:17 | 15.660 | 0.812 | out |
| M17_E11 | 18:22:29.6 | 15:35:57 | 15.794 | 0.839 | out |
| M17_W1 | 18:20:19.1 | 16:13:53 | 14.990 | 0.675 | in |
| M17_W1.5 | 18:20:13.8 | 16:15:31 | 14.956 | 0.669 | on |
| M17_W2 | 18:20:08.3 | 16:17:03 | 14.923 | 0.662 | out |
| M17_W3 | 18:19:57.3 | 16:20:12 | 14.856 | 0.648 | out |
| M17_W4 | 18:19:46.3 | 16:23:21 | 14.789 | 0.634 | out |
| M17_W5 | 18:19:35.6 | 16:26:32 | 14.722 | 0.621 | out |
| Orion_C | 05:35:15.5 | 05:23:35 | 209.012 | 19.389 | in |
| Orion_N1 | 05:35:28.6 | 05:21:06 | 208.999 | 19.322 | in |
| Orion_N2 | 05:35:41.7 | 05:18:38 | 208.986 | 19.255 | in |
| Orion_N3 | 05:35:54.7 | 05:16:09 | 208.973 | 19.188 | on |
| Orion_N4 | 05:36:08.0 | 05:13:39 | 208.960 | 19.120 | out |
| Orion_N5 | 05:36:21.1 | 05:11:10 | 208.947 | 19.053 | out |
| Orion_S1 | 05:35:02.5 | 05:26:03 | 209.025 | 19.456 | in |
| Orion_S2 | 05:34:49.4 | 05:28:32 | 209.038 | 19.523 | in |
| Orion_S3 | 05:34:36.3 | 05:31:00 | 209.051 | 19.590 | in |
| Orion_S4 | 05:34:23.0 | 05:33:30 | 209.064 | 19.658 | in |
| Orion_S5 | 05:34:09.9 | 05:35:58 | 209.077 | 19.725 | in |
| Orion_S6 | 05:33:56.9 | 05:38:26 | 209.090 | 19.792 | in |
| Orion_S7 | 05:33:43.8 | 05:40:55 | 209.103 | 19.859 | in |
| Orion_S9 | 05:33:17.6 | 05:45:51 | 209.129 | 19.993 | out |
| Orion_S11 | 05:32:51.1 | 05:50:45 | 209.154 | 20.128 | out |
| N49_C | 18:44:45.3 | 03:45:21 | 28.828 | 0.228 | in |
| N49_E0.5 | 18:44:47.8 | 03:43:23 | 28.862 | 0.222 | out |
| N49_E1 | 18:44:50.1 | 03:41:27 | 28.895 | 0.216 | out |
| N49_E2 | 18:44:54.8 | 03:37:28 | 28.963 | 0.203 | out |
| N49_W0.5 | 18:44:42.9 | 03:47:20 | 28.794 | 0.234 | out |
| N49_W1 | 18:44:40.5 | 03:49:16 | 28.761 | 0.240 | out |
| N49_W2 | 18:44:35.9 | 03:53:15 | 28.693 | 0.253 | out |
| G29_C | 18:46:04.7 | 02:39:27 | 29.956 | 0.020 | in |
| G29_N0.5 | 18:45:57.5 | 02:38:28 | 29.957 | 0.014 | on |
| G29_N1 | 18:45:50.3 | 02:37:29 | 29.958 | 0.048 | out |
| G29_N1.5 | 18:45:43.0 | 02:36:28 | 29.959 | 0.083 | out |
| G29_N2 | 18:45:35.8 | 02:35:29 | 29.960 | 0.117 | out |
| G29_N3 | 18:45:21.5 | 02:33:31 | 29.962 | 0.185 | out |
| G29_N4 | 18:45:07.2 | 02:31:32 | 29.964 | 0.253 | out |
| G29_N5 | 18:44:52.6 | 02:29:33 | 29.966 | 0.322 | out |
| G29_S0.5 | 18:46:11.8 | 02:40:26 | 29.955 | 0.054 | in |
| G29_S1 | 18:46:19.0 | 02:41:25 | 29.954 | 0.088 | in |
| G29_S1.5 | 18:46:26.3 | 02:42:26 | 29.953 | 0.123 | on |
| G29_S2 | 18:46:33.5 | 02:43:25 | 29.952 | 0.157 | out |
| G29_S3 | 18:46:47.8 | 02:45:23 | 29.950 | 0.225 | out |
| G29_S4 | 18:47:02.1 | 02:47:21 | 29.948 | 0.293 | out |
| G29_S5 | 18:47:16.7 | 02:49:21 | 29.946 | 0.362 | out |
| Source | Transition | Element | rms | tintg | ||||||
|---|---|---|---|---|---|---|---|---|---|---|
| (mK) | (mK) | () | () | () | () | (mK) | (min) | |||
| S206_C | H | 3 | ||||||||
| He | ||||||||||
| H | 86.3 | 0.3 | 27.1 | 0.1 | 25.5 | 0.1 | 3.6 | |||
| He | 10.4 | 0.3 | 34.2 | 1.3 | 22.0 | 0.5 | ||||
| H | 41.2 | 0.4 | 23.3 | 0.3 | 25.5 | 0.1 | 4.4 | |||
| S206_E0.5 | H | 6 | ||||||||
| He | ||||||||||
| H | 33.0 | 0.2 | 26.3 | 0.1 | 23.1 | 0.1 | 1.9 | |||
| H | 12.2 | 0.2 | 26.8 | 0.7 | 24.7 | 0.3 | 2.7 | |||
| S206_E1 | H | 24 | ||||||||
| He | ||||||||||
| H | 9.2 | 0.1 | 23.5 | 0.2 | 24.6 | 0.1 | 0.7 | |||
| H | 3.5 | 0.1 | 16.4 | 0.7 | 25.6 | 0.3 | 1.0 | |||
| S206_E2 | H | 36 | ||||||||
| He | ||||||||||
| H | 4.1 | 0.1 | 21.7 | 0.5 | 25.8 | 0.2 | 0.6 | |||
| H | 1.0 | |||||||||
| S206_E3 | H | 24 | ||||||||
| H | 0.7 | |||||||||
| H | 1.1 | |||||||||
| S206_W0.5 | H | 6 | ||||||||
| He | ||||||||||
| H | 37.7 | 0.2 | 26.6 | 0.1 | 27.7 | 0.1 | 1.9 | |||
| He | 3.4 | 0.2 | 34.2 | 2.7 | 30.0 | 1.1 | ||||
| H | 13.7 | 0.2 | 25.6 | 0.3 | 27.6 | 0.2 | 2.5 | |||
| S206_W1 | H | 24 | ||||||||
| He | ||||||||||
| H | 11.6 | 0.1 | 21.3 | 0.2 | 27.1 | 0.1 | 0.8 | |||
| H | 5.5 | 0.1 | 15.3 | 0.3 | 26.2 | 0.1 | 1.1 | |||
| S206_W2 | H | 36 | ||||||||
| He | ||||||||||
| H | 3.0 | 0.1 | 19.4 | 0.4 | 19.5 | 0.2 | 0.5 | |||
| H | 0.9 | |||||||||
| S206_W3 | H | 0.1 | 36.9 | 1.4 | 0.6 | 27 | ||||
| H | 0.7 | |||||||||
| H | 0.9 | |||||||||
| S206_W4 | H | 34 | ||||||||
| H | 0.5 | |||||||||
| H | 0.9 | |||||||||
| S104_C | H | 12 | ||||||||
| He | ||||||||||
| H | 46.3 | 0.2 | 20.8 | 0.1 | 1.9 | 0.1 | 1.2 | |||
| He | 5.4 | 0.2 | 12.8 | 0.5 | 0.4 | 0.2 | ||||
| H | 18.9 | 0.2 | 19.7 | 0.2 | 2.0 | 0.1 | 1.7 | |||
| S104_N0.5 | H | 12 | ||||||||
| He | ||||||||||
| H | 28.7 | 0.1 | 21.3 | 0.1 | 0.0 | 0.1 | 1.2 | |||
| He | 3.7 | 0.2 | 12.7 | 0.7 | 0.0 | 0.3 | ||||
| H | 10.3 | 0.2 | 20.6 | 0.5 | 0.7 | 0.2 | 1.5 | |||
| S104_N1 | H | 1.6 | 30 | |||||||
| He | ||||||||||
| C | ||||||||||
| H | 7.9 | 0.1 | 26.9 | 0.2 | 1.7 | 0.1 | 0.6 | |||
| H | 3.1 | 0.1 | 24.6 | 0.8 | 6.0 | 0.3 | 0.9 | |||
| S104_N1.5 | H | 20 | ||||||||
| H | 1.2 | 0.1 | 32.8 | 1.7 | 9.8 | 0.7 | 0.7 | |||
| H | 1.2 | |||||||||
| S104_S0.5 | H | 12 | ||||||||
| He | ||||||||||
| C | ||||||||||
| H | 31.9 | 0.1 | 20.8 | 0.1 | 2.0 | 0.1 | 1.2 | |||
| He | 5.1 | 0.1 | 10.9 | 0.4 | 0.9 | 0.2 | ||||
| H | 12.5 | 0.2 | 22.5 | 0.3 | 3.4 | 0.1 | 1.7 | |||
| S104_S1 | H | 36 | ||||||||
| He | ||||||||||
| C | ||||||||||
| H | 6.1 | 0.1 | 21.7 | 0.3 | 2.0 | 0.1 | 0.6 | |||
| H | 1.9 | 0.1 | 21.5 | 1.1 | 0.6 | 0.5 | 0.9 | |||
| S104_S1.5 | H | 18 | ||||||||
| H | 2.7 | 0.1 | 27.2 | 0.7 | 2.8 | 0.3 | 0.8 | |||
| H | 1.2 | |||||||||
| S104_S2.5 | H | 12 | ||||||||
| H | 2.6 | 0.1 | 39.9 | 2.8 | 2.7 | 1.0 | 1.0 | |||
| H | 1.8 | |||||||||
| G45_C | H | 55.2 | 6 | |||||||
| He | ||||||||||
| C | ||||||||||
| H | 187.7 | 0.3 | 27.5 | 0.1 | 55.7 | 0.1 | 3.5 | |||
| He | 11.3 | 0.3 | 34.2 | 1.0 | 56.9 | 0.4 | ||||
| H | 89.6 | 0.3 | 28.9 | 0.1 | 55.7 | 0.1 | 3.9 | |||
| G45_E0.5 | H | 57.3 | 6 | |||||||
| He | ||||||||||
| C | ||||||||||
| H | 52.5 | 0.2 | 29.6 | 0.1 | 57.8 | 0.1 | 1.8 | |||
| He | 5.6 | 0.2 | 18.5 | 1.0 | 53.8 | 0.4 | ||||
| H | 16.4 | 0.2 | 29.4 | 0.5 | 57.8 | 0.2 | 2.3 | |||
| G45_E1 | H | 54.8 | 18 | |||||||
| He | ||||||||||
| C | ||||||||||
| H | 9.1 | 0.1 | 23.1 | 0.3 | 55.4 | 0.1 | 1.0 | |||
| H | 4.2 | 0.1 | 20.0 | 0.7 | 52.5 | 0.3 | 1.4 | |||
| G45_E2 | H | 52.5 | 24 | |||||||
| H | 3.8 | 0.1 | 16.7 | 0.5 | 51.6 | 0.2 | 0.8 | |||
| H | 1.2 | |||||||||
| G45_E3 | H | 54.4 | 12 | |||||||
| H | 1.8 | |||||||||
| H | 1.5 | |||||||||
| G45_W0.5 | H | 54.7 | 6 | |||||||
| He | ||||||||||
| C | ||||||||||
| H | 69.3 | 0.2 | 22.2 | 0.1 | 55.0 | 0.1 | 2.0 | |||
| He | 7.3 | 0.2 | 16.1 | 0.7 | 54.0 | 0.3 | ||||
| H | 29.4 | 0.3 | 19.6 | 0.2 | 55.8 | 0.1 | 2.5 | |||
| G45_W1 | H | 54.1 | 18 | |||||||
| He | ||||||||||
| C | ||||||||||
| H | 6.6 | 0.1 | 22.9 | 0.3 | 54.8 | 0.1 | 0.9 | |||
| H | 1.3 | |||||||||
| G45_W2 | H | 52.3 | 24 | |||||||
| H | 1.9 | 0.1 | 23.7 | 0.9 | 53.4 | 0.4 | 0.7 | |||
| H | 1.0 | |||||||||
| G45_W3 | H | 12 | ||||||||
| H | 1.4 | |||||||||
| H | 1.8 | |||||||||
| M16_C | H | 25.0 | 10 | |||||||
| He | ||||||||||
| C | ||||||||||
| H | 120.4 | 0.2 | 22.1 | 0.1 | 25.0 | 0.1 | 2.1 | |||
| He | 14.2 | 0.3 | 15.2 | 0.3 | 26.4 | 0.1 | ||||
| H | 49.4 | 0.3 | 21.4 | 0.1 | 25.0 | 0.1 | 2.7 | |||
| M16_N0.5 | H | 23.4 | 6 | |||||||
| He | ||||||||||
| C | ||||||||||
| H | 125.6 | 0.2 | 21.2 | 0.1 | 23.6 | 0.1 | 2.5 | |||
| He | 16.1 | 0.3 | 15.7 | 0.3 | 25.6 | 0.1 | ||||
| H | 52.3 | 0.3 | 21.1 | 0.1 | 23.5 | 0.1 | 2.9 | |||
| M16_N1 | H | 25.3 | 6 | |||||||
| He | ||||||||||
| C | ||||||||||
| H | 121.4 | 0.2 | 25.8 | 0.1 | 25.5 | 0.1 | 2.2 | |||
| He | 14.3 | 0.3 | 22.5 | 0.5 | 27.6 | 0.2 | ||||
| H | 51.6 | 0.3 | 25.3 | 0.2 | 25.7 | 0.1 | 3.1 | |||
| M16_N1.5 | H | 26.8 | 6 | |||||||
| He | ||||||||||
| C | ||||||||||
| H | 87.5 | 0.3 | 26.7 | 0.1 | 26.9 | 0.1 | 2.2 | |||
| He | 8.0 | 0.3 | 21.4 | 0.9 | 29.2 | 0.4 | ||||
| H | 35.4 | 0.3 | 25.0 | 0.2 | 27.4 | 0.1 | 2.6 | |||
| M16_N2.5 | H | 27.8 | 6 | |||||||
| He | ||||||||||
| C | ||||||||||
| H | 42.0 | 0.2 | 22.3 | 0.1 | 28.0 | 0.1 | 2.0 | |||
| H | 14.9 | 0.3 | 21.8 | 0.4 | 28.9 | 0.2 | 2.4 | |||
| M16_N4.5 | H | 24.8 | 6 | |||||||
| H | 4.0 | 0.2 | 18.0 | 0.8 | 23.6 | 0.3 | 1.6 | |||
| H | 2.4 | |||||||||
| M16_N6.5 | H | 21.9 | 6 | |||||||
| H | 1.6 | |||||||||
| H | 2.4 | |||||||||
| M16_N8.5 | H | 21.8 | 6 | |||||||
| H | 3.9 | 0.1 | 36.7 | 1.2 | 32.4 | 0.5 | 1.5 | |||
| H | 2.2 | |||||||||
| M16_N10.5 | H | 23.0 | 6 | |||||||
| H | 6.3 | 0.2 | 17.2 | 0.6 | 22.7 | 0.3 | 1.4 | |||
| H | 2.3 | |||||||||
| M16_S0.5 | H | 24.8 | 6 | |||||||
| He | ||||||||||
| C | ||||||||||
| H | 108.5 | 0.2 | 23.5 | 0.1 | 25.2 | 0.1 | 2.3 | |||
| He | 12.5 | 0.2 | 17.3 | 0.4 | 26.8 | 0.2 | ||||
| H | 44.7 | 0.3 | 22.8 | 0.2 | 24.6 | 0.1 | 3.1 | |||
| M16_S1 | H | 25.6 | 6 | |||||||
| He | ||||||||||
| H | 82.9 | 0.2 | 23.2 | 0.1 | 25.8 | 0.1 | 2.1 | |||
| He | 9.0 | 0.2 | 24.9 | 0.6 | 26.6 | 0.3 | ||||
| H | 33.7 | 0.3 | 22.4 | 0.2 | 25.6 | 0.1 | 2.9 | |||
| M16_S1.5 | H | 27.2 | 6 | |||||||
| He | ||||||||||
| H | 77.8 | 0.2 | 25.0 | 0.1 | 27.6 | 0.1 | 1.9 | |||
| He | 8.3 | 0.2 | 23.8 | 0.8 | 26.5 | 0.3 | ||||
| H | 31.2 | 0.3 | 24.9 | 0.3 | 27.6 | 0.1 | 2.5 | |||
| M16_S2.5 | H | 23.8 | 6 | |||||||
| He | ||||||||||
| H | 76.2 | 0.2 | 23.4 | 0.1 | 24.3 | 0.1 | 1.9 | |||
| He | 6.0 | 0.3 | 19.6 | 1.0 | 28.9 | 0.4 | ||||
| H | 27.7 | 0.3 | 24.6 | 0.3 | 23.2 | 0.1 | 2.7 | |||
| M16_S3.5 | H | 21.8 | 10 | |||||||
| He | ||||||||||
| C | ||||||||||
| H | 21.2 | 0.1 | 26.7 | 0.2 | 22.3 | 0.1 | 1.3 | |||
| H | 9.3 | 0.2 | 26.7 | 0.5 | 21.2 | 0.2 | 1.9 | |||
| M16_S5.5 | H | 22.4 | 24 | |||||||
| He | ||||||||||
| C | ||||||||||
| H | 9.0 | 0.1 | 24.3 | 0.3 | 24.2 | 0.1 | 0.8 | |||
| H | 3.8 | 0.1 | 19.3 | 0.6 | 22.3 | 0.3 | 1.1 | |||
| M16_S9.5 | H | 22.0 | 6 | |||||||
| H | 5.4 | 0.1 | 21.5 | 0.6 | 21.4 | 0.3 | 1.4 | |||
| H | 2.4 | |||||||||
| M16_S11.5 | H | 42.3 | 6 | |||||||
| H | 4.6 | 0.2 | 18.6 | 0.7 | 42.6 | 0.3 | 1.7 | |||
| H | 2.2 | |||||||||
| M17_C | H | 7.9 | 4 | |||||||
| He | ||||||||||
| H | 822.3 | 4.5 | 27.4 | 0.2 | 7.9 | 0.1 | 14.7 | |||
| He | 92.7 | 1.9 | 46.0 | 1.8 | 9.5 | 1.2 | ||||
| H | 452.9 | 2.0 | 41.9 | 0.2 | 23.7 | 0.1 | 16.4 | |||
| He | 36.2 | 2.0 | 41.6 | 2.8 | 28.7 | 1.2 | ||||
| M17_E1 | H | 13.2 | 6 | |||||||
| He | ||||||||||
| C | ||||||||||
| H | 634.6 | 0.7 | 32.6 | 0.1 | 13.6 | 0.1 | 9.0 | |||
| He | 65.9 | 0.6 | 37.1 | 0.4 | 16.0 | 0.2 | ||||
| H | 246.1 | 0.7 | 31.9 | 0.1 | 12.9 | 0.1 | 8.1 | |||
| M17_E1.5 | H | 17.5 | 6 | |||||||
| He | ||||||||||
| C | ||||||||||
| H | 65.8 | 0.2 | 38.6 | 0.1 | 18.4 | 0.1 | 2.1 | |||
| He | 8.2 | 0.2 | 34.0 | 1.0 | 25.0 | 0.4 | ||||
| H | 24.2 | 0.2 | 36.5 | 0.3 | 16.9 | 0.1 | 2.6 | |||
| M17_E2 | H | 28.6 | 6 | |||||||
| He | ||||||||||
| H | 60.7 | 0.2 | 27.2 | 0.1 | 29.1 | 0.1 | 1.7 | |||
| He | 7.6 | 0.3 | 16.7 | 0.6 | 32.1 | 0.3 | ||||
| H | 22.7 | 0.3 | 24.9 | 0.3 | 29.7 | 0.1 | 2.5 | |||
| M17_E3 | H | 25.1 | 6 | |||||||
| He | ||||||||||
| H | 41.8 | 0.2 | 29.5 | 0.2 | 25.7 | 0.1 | 1.7 | |||
| H | 17.5 | 0.3 | 26.3 | 0.5 | 24.8 | 0.2 | 2.4 | |||
| M17_E4 | H | 24.3 | 18 | |||||||
| He | ||||||||||
| H | 24.7 | 0.1 | 27.7 | 0.1 | 25.3 | 0.1 | 1.0 | |||
| He | 4.0 | 0.1 | 24.9 | 0.9 | 26.6 | 0.3 | ||||
| H | 10.5 | 0.1 | 27.5 | 0.3 | 24.3 | 0.1 | 1.4 | |||
| M17_E5 | H | 27.3 | 30 | |||||||
| He | ||||||||||
| H | 5.4 | 0.1 | 25.9 | 0.4 | 28.2 | 0.2 | 0.7 | |||
| H | 2.7 | 0.1 | 32.7 | 1.1 | 30.7 | 0.4 | 1.0 | |||
| M17_E6 | H | 25.5 | 18 | |||||||
| H | 5.0 | 0.1 | 25.1 | 0.5 | 25.9 | 0.2 | 0.9 | |||
| H | 1.4 | |||||||||
| M17_E7 | H | 28.0 | 30 | |||||||
| He | ||||||||||
| H | 3.7 | 0.1 | 22.2 | 0.6 | 28.6 | 0.3 | 0.7 | |||
| H | 1.2 | |||||||||
| M17_E9 | H | 20.9 | 18 | |||||||
| H | 1.0 | |||||||||
| H | 1.5 | |||||||||
| M17_E11 | H | 38.3 | 24 | |||||||
| H | 0.7 | |||||||||
| H | 1.2 | |||||||||
| M17_W1 | H | 13.8 | 6 | |||||||
| He | ||||||||||
| C | ||||||||||
| H | 209.5 | 0.3 | 27.2 | 0.1 | 14.3 | 0.1 | 3.6 | |||
| He | 26.2 | 0.3 | 29.1 | 0.4 | 15.1 | 0.2 | ||||
| C | 39.5 | 0.7 | 4.8 | 0.1 | 19.4 | 0.1 | ||||
| H | 68.9 | 0.3 | 27.6 | 0.1 | 14.5 | 0.1 | 3.2 | |||
| C | 15.6 | 0.7 | 5.5 | 0.3 | 18.1 | 0.1 | ||||
| M17_W1.5 | H | 19.7 | 12 | |||||||
| He | ||||||||||
| C | ||||||||||
| H | 14.7 | 0.1 | 26.0 | 0.2 | 21.2 | 0.1 | 1.2 | |||
| C | 5.1 | 0.2 | 8.6 | 0.4 | 19.3 | 0.2 | ||||
| H | 5.1 | 0.1 | 23.7 | 0.8 | 20.4 | 0.3 | 1.7 | |||
| M17_W2 | H | 23.0 | 30 | |||||||
| He | ||||||||||
| C | ||||||||||
| H | 7.1 | 0.1 | 28.3 | 0.3 | 24.1 | 0.1 | 0.8 | |||
| He | 4.5 | 0.2 | 33.0 | 1.9 | 23.0 | 0.7 | ||||
| H | 2.7 | 0.1 | 23.7 | 1.1 | 22.3 | 0.4 | 1.1 | |||
| M17_W3 | H | 29.2 | 6 | |||||||
| H | 3.6 | 0.1 | 26.1 | 0.9 | 31.2 | 0.4 | 1.6 | |||
| H | 2.4 | |||||||||
| M17_W4 | H | 29.0 | 6 | |||||||
| H | 1.7 | |||||||||
| H | 2.6 | |||||||||
| M17_W5 | H | 34.5 | 6 | |||||||
| H | 1.5 | |||||||||
| H | 2.3 | |||||||||
| Orion_C | H | 5 | ||||||||
| He | ||||||||||
| C | ||||||||||
| H | 2970.5 | 3.8 | 33.0 | 0.1 | 3.6 | 0.1 | 25.6 | |||
| He | 338.1 | 3.9 | 32.3 | 0.5 | 3.7 | 0.2 | ||||
| C | 135.0 | 11.3 | 4.2 | 0.5 | 9.1 | 0.2 | ||||
| H | 1111.1 | 2.1 | 35.0 | 0.1 | 2.9 | 0.1 | 23.3 | |||
| He | 81.9 | 2.5 | 25.8 | 1.0 | 11.1 | 0.4 | ||||
| Orion_N1 | H | 6 | ||||||||
| He | ||||||||||
| C | ||||||||||
| H | 439.5 | 0.6 | 27.3 | 0.0 | 0.3 | 0.1 | 4.9 | |||
| He | 50.4 | 0.6 | 29.8 | 0.5 | 0.4 | 0.2 | ||||
| C | 83.7 | 1.5 | 5.3 | 0.1 | 7.6 | 0.1 | ||||
| H | 174.6 | 0.4 | 26.3 | 0.1 | 1.3 | 0.1 | 4.7 | |||
| He | 16.9 | 0.5 | 18.3 | 0.9 | 3.3 | 0.3 | ||||
| C | 40.2 | 1.0 | 6.1 | 0.2 | 7.8 | 0.1 | ||||
| Orion_N2 | H | 11.5 | 30 | |||||||
| C | ||||||||||
| H | 21.2 | 0.1 | 20.4 | 0.1 | 12.0 | 0.1 | 0.7 | |||
| C | 12.3 | 0.2 | 4.1 | 0.1 | 9.1 | 0.1 | ||||
| H | 6.1 | 0.1 | 22.9 | 0.5 | 10.7 | 0.2 | 1.2 | |||
| C | 5.2 | 0.3 | 4.7 | 0.3 | 9.9 | 0.1 | ||||
| Orion_N3 | H | 3.1 | 18 | |||||||
| C | ||||||||||
| H | 0.9 | |||||||||
| C | 3.8 | 0.1 | 2.8 | 0.1 | 9.9 | 0.1 | ||||
| H | 1.5 | |||||||||
| Orion_N4 | H | 28.6 | 1.6 | 0.6 | 17 | |||||
| H | 0.9 | |||||||||
| H | 1.3 | |||||||||
| Orion_N5 | H | 30 | ||||||||
| H | 0.7 | |||||||||
| H | 1.0 | |||||||||
| Orion_S1 | H | 6 | ||||||||
| He | ||||||||||
| C | ||||||||||
| H | 128.4 | 0.3 | 35.7 | 0.1 | 4.4 | 0.1 | 2.8 | |||
| He | 14.8 | 0.3 | 29.5 | 1.6 | 0.7 | 0.8 | ||||
| C | 11.3 | 1.0 | 11.8 | 1.0 | 8.4 | 0.3 | ||||
| H | 52.5 | 0.2 | 34.2 | 0.2 | 4.3 | 0.1 | 3.4 | |||
| Orion_S2 | H | 24 | ||||||||
| He | ||||||||||
| C | ||||||||||
| H | 28.7 | 0.1 | 36.4 | 0.1 | 6.1 | 0.1 | 0.8 | |||
| He | 1.9 | 0.1 | 43.3 | 3.8 | 2.1 | 2.0 | ||||
| C | 2.9 | 0.3 | 8.1 | 0.9 | 12.6 | 0.3 | ||||
| H | 10.7 | 0.1 | 37.7 | 0.4 | 5.1 | 0.2 | 1.3 | |||
| C | 4.1 | 0.2 | 7.4 | 0.5 | 11.6 | 0.2 | ||||
| Orion_S3 | H | 24 | ||||||||
| He | ||||||||||
| H | 17.5 | 0.1 | 30.7 | 0.2 | 7.6 | 0.1 | 0.8 | |||
| H | 7.6 | 0.1 | 30.2 | 0.5 | 6.4 | 0.2 | 1.1 | |||
| Orion_S4 | H | 24 | ||||||||
| H | 5.1 | 0.1 | 30.5 | 0.4 | 2.9 | 0.2 | 0.9 | |||
| H | 1.1 | |||||||||
| Orion_S5 | H | 18 | ||||||||
| H | 2.3 | 0.1 | 20.3 | 1.0 | 6.2 | 0.4 | 1.0 | |||
| H | 1.5 | |||||||||
| Orion_S6 | H | 12 | ||||||||
| C | ||||||||||
| H | 3.3 | 0.1 | 25.4 | 0.8 | 3.1 | 0.3 | 1.0 | |||
| H | 1.5 | |||||||||
| Orion_S7 | H | 15 | ||||||||
| C | ||||||||||
| H | 0.9 | |||||||||
| H | 1.3 | |||||||||
| Orion_S9 | H | 24 | ||||||||
| H | 0.7 | |||||||||
| H | 1.1 | |||||||||
| Orion_S11 | H | 36 | ||||||||
| H | 0.9 | |||||||||
| H | 1.0 | |||||||||
| N49_C | H | 88.7 | 24 | |||||||
| He | ||||||||||
| C | ||||||||||
| H | 50.5 | 0.1 | 22.0 | 0.1 | 89.1 | 0.1 | 1.1 | |||
| He | 3.9 | 0.1 | 17.8 | 0.7 | 89.5 | 0.3 | ||||
| H | 22.5 | 0.1 | 22.7 | 0.2 | 88.9 | 0.1 | 1.4 | |||
| N49_E0.5 | H | 86.7 | 24 | |||||||
| C | ||||||||||
| H | 12.2 | 0.1 | 26.1 | 0.2 | 87.1 | 0.1 | 0.8 | |||
| H | 6.8 | 0.2 | 20.7 | 0.6 | 82.9 | 0.2 | 1.2 | |||
| N49_E1 | H | 92.4 | 12 | |||||||
| H | 4.9 | 0.1 | 28.5 | 0.6 | 94.0 | 0.3 | 1.0 | |||
| H | 1.5 | |||||||||
| N49_E2 | H | 95.3 | 12 | |||||||
| H | 7.5 | 0.1 | 19.5 | 0.3 | 96.7 | 0.1 | 1.2 | |||
| H | 1.6 | |||||||||
| N49_W0.5 | H | 89.5 | 24 | |||||||
| He | ||||||||||
| C | ||||||||||
| H | 22.2 | 0.1 | 20.8 | 0.1 | 90.3 | 0.1 | 0.9 | |||
| H | 6.6 | 0.1 | 25.5 | 0.5 | 89.2 | 0.2 | 1.2 | |||
| N49_W1 | H | 90.0 | 12 | |||||||
| H | 5.8 | 0.1 | 33.6 | 0.8 | 89.0 | 0.3 | 1.1 | |||
| H | 1.7 | |||||||||
| N49_W2 | H | 95.8 | 18 | |||||||
| H | 2.5 | 0.1 | 35.6 | 1.3 | 92.8 | 0.5 | 0.9 | |||
| H | 1.4 | |||||||||
| G29_C | H | 91.7 | 6 | |||||||
| He | ||||||||||
| C | ||||||||||
| H | 160.6 | 0.3 | 33.7 | 0.1 | 91.2 | 0.1 | 2.5 | |||
| He | 10.8 | 0.3 | 37.4 | 1.3 | 88.0 | 0.5 | ||||
| H | 71.4 | 0.3 | 37.9 | 0.2 | 89.8 | 0.1 | 3.9 | |||
| G29_N0.5 | H | 91.3 | 18 | |||||||
| He | ||||||||||
| C | ||||||||||
| H | 32.8 | 0.1 | 30.1 | 0.1 | 91.5 | 0.1 | 0.9 | |||
| He | 2.9 | 0.1 | 27.0 | 1.6 | 93.1 | 0.6 | ||||
| C | 2.6 | 0.2 | 8.8 | 0.9 | 97.5 | 0.3 | ||||
| H | 12.2 | 0.2 | 24.2 | 0.3 | 92.6 | 0.1 | 1.3 | |||
| G29_N1 | H | 95.5 | 36 | |||||||
| C | ||||||||||
| H | 10.7 | 0.1 | 24.2 | 0.1 | 95.9 | 0.1 | 0.6 | |||
| H | 5.0 | 0.1 | 19.7 | 0.3 | 95.8 | 0.1 | 0.9 | |||
| G29_N1.5 | H | 94.2 | 6 | |||||||
| H | 8.0 | 0.1 | 25.6 | 0.4 | 95.1 | 0.2 | 1.5 | |||
| H | 5.8 | 0.2 | 22.5 | 0.7 | 93.9 | 0.3 | 2.1 | |||
| G29_N2 | H | 93.5 | 6 | |||||||
| H | 7.2 | 0.1 | 32.0 | 0.7 | 94.4 | 0.3 | 1.6 | |||
| H | 2.4 | |||||||||
| G29_N3 | H | 93.6 | 6 | |||||||
| H | 6.1 | 0.1 | 43.9 | 1.0 | 91.2 | 0.4 | 1.7 | |||
| H | 3.9 | 0.2 | 48.3 | 2.6 | 95.0 | 1.0 | 2.3 | |||
| G29_N4 | H | 93.2 | 6 | |||||||
| H | 5.7 | 0.1 | 35.6 | 0.8 | 91.1 | 0.3 | 1.6 | |||
| H | 2.3 | |||||||||
| G29_N5 | H | 90.5 | 6 | |||||||
| H | 4.2 | 0.1 | 58.1 | 2.4 | 94.2 | 0.8 | 1.5 | |||
| H | 2.2 | |||||||||
| G29_S0.5 | H | 99.0 | 6 | |||||||
| He | ||||||||||
| C | ||||||||||
| H | 114.0 | 0.2 | 32.4 | 0.1 | 99.0 | 0.1 | 2.4 | |||
| He | 11.9 | 0.2 | 35.7 | 0.9 | 98.9 | 0.3 | ||||
| H | 48.3 | 0.2 | 33.3 | 0.2 | 99.1 | 0.1 | 3.0 | |||
| G29_S1 | H | 97.1 | 12 | |||||||
| He | ||||||||||
| H | 48.8 | 0.2 | 29.3 | 0.1 | 97.0 | 0.1 | 1.2 | |||
| He | 2.9 | 0.2 | 25.0 | 3.0 | 108.6 | 1.5 | ||||
| C | 4.6 | 0.5 | 5.6 | 0.8 | 123.5 | 0.3 | ||||
| H | 18.8 | 0.2 | 26.5 | 0.3 | 96.2 | 0.1 | 1.7 | |||
| G29_S1.5 | H | 96.7 | 30 | |||||||
| He | ||||||||||
| C | ||||||||||
| H | 21.0 | 0.1 | 28.1 | 0.1 | 97.1 | 0.1 | 0.7 | |||
| He | 2.0 | 0.1 | 26.8 | 1.5 | 97.4 | 0.6 | ||||
| H | 8.5 | 0.1 | 24.4 | 0.3 | 97.8 | 0.1 | 1.0 | |||
| G29_S2 | H | 96.6 | 24 | |||||||
| He | ||||||||||
| H | 16.0 | 0.1 | 23.5 | 0.1 | 96.9 | 0.1 | 0.7 | |||
| H | 7.2 | 0.1 | 20.8 | 0.4 | 97.5 | 0.2 | 1.1 | |||
| G29_S3 | H | 98.7 | 24 | |||||||
| He | 99.9 | |||||||||
| H | 18.2 | 0.1 | 21.6 | 0.2 | 98.3 | 0.1 | 0.8 | |||
| H | 8.5 | 0.1 | 20.6 | 0.3 | 97.3 | 0.1 | 1.1 | |||
| G29_S4 | H | 100.5 | 6 | |||||||
| H | 16.0 | 0.2 | 21.9 | 0.2 | 100.5 | 0.1 | 1.6 | |||
| H | 4.5 | 0.1 | 45.7 | 1.6 | 100.9 | 0.7 | 2.3 | |||
| G29_S5 | H | 100.5 | 6 | |||||||
| H | 15.5 | 0.2 | 16.9 | 0.3 | 100.2 | 0.2 | 1.5 | |||
| H | 6.5 | 0.2 | 17.9 | 0.8 | 99.1 | 0.3 | 2.2 |
Note. — All uncertainties are 1.
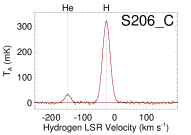 |
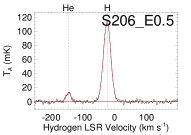 |
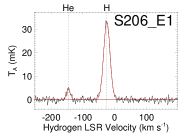 |
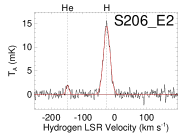 |
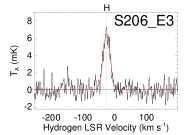 |
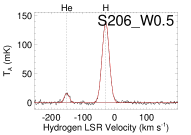 |
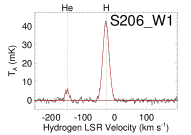 |
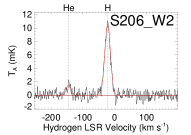 |
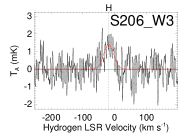 |
 |
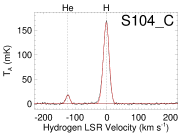 |
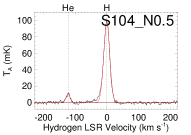 |
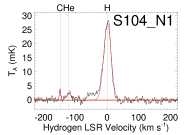 |
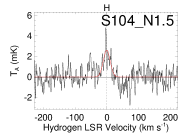 |
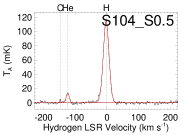 |
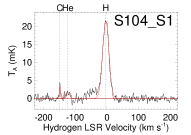 |
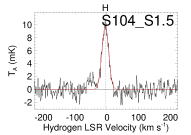 |
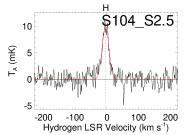 |
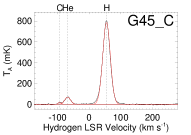 |
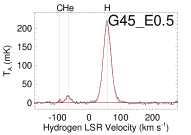 |
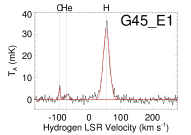 |
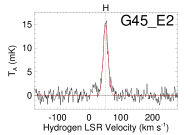 |
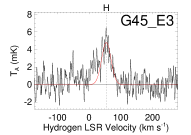 |
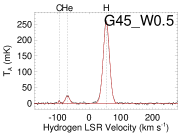 |
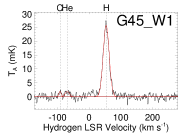 |
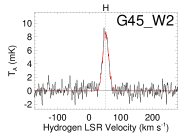 |
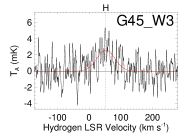 |
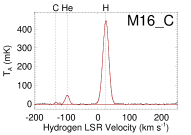 |
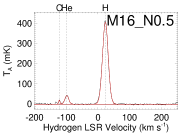 |
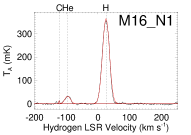 |
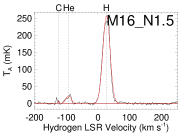 |
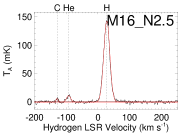 |
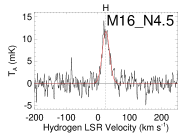 |
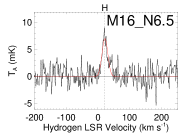 |
 |
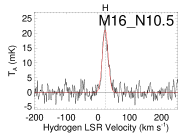 |
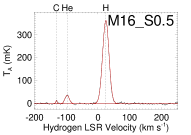 |
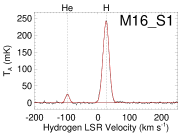 |
 |
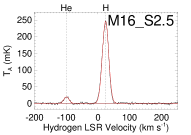 |
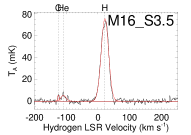 |
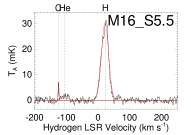 |
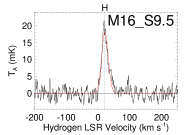 |
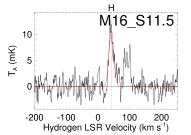 |
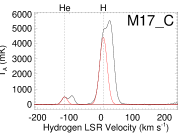 |
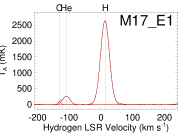 |
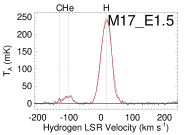 |
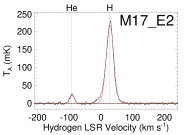 |
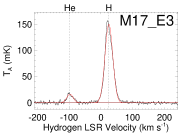 |
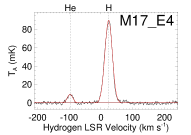 |
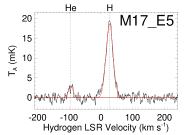 |
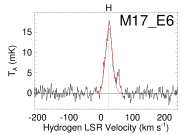 |
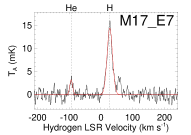 |
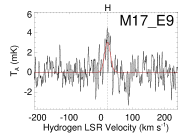 |
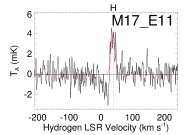 |
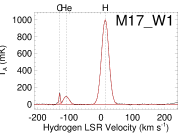 |
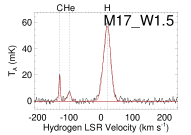 |
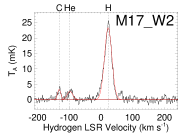 |
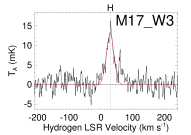 |
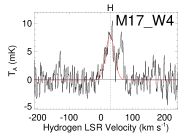 |
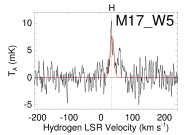 |
 |
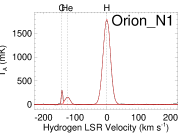 |
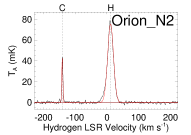 |
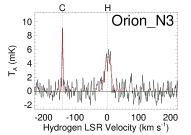 |
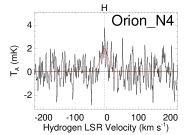 |
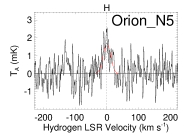 |
 |
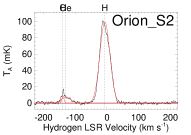 |
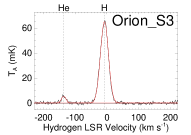 |
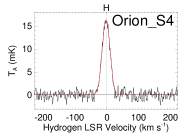 |
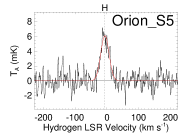 |
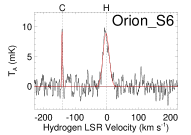 |
 |
 |
 |
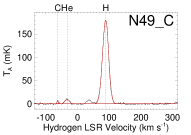 |
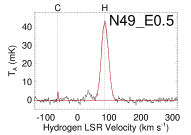 |
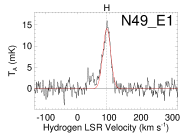 |
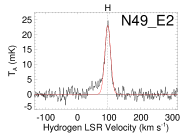 |
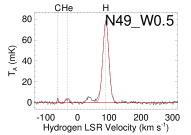 |
 |
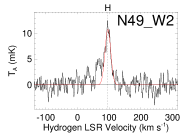 |
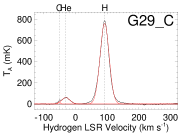 |
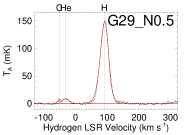 |
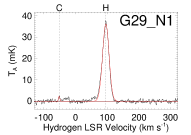 |
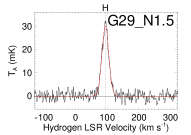 |
 |
 |
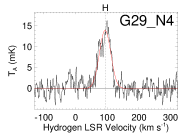 |
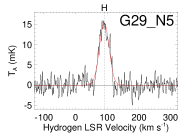 |
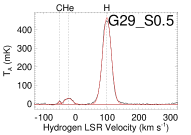 |
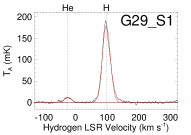 |
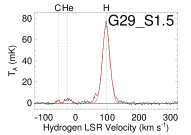 |
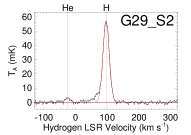 |
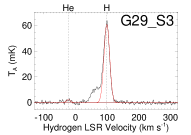 |
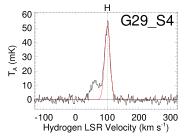 |
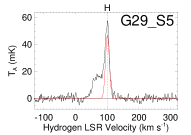 |
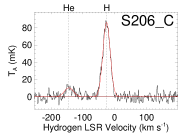 |
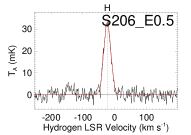 |
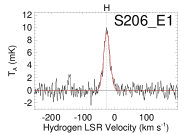 |
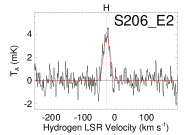 |
 |
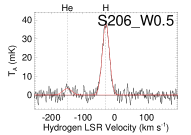 |
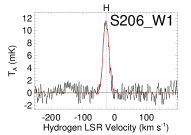 |
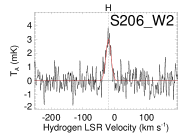 |
 |
 |
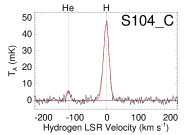 |
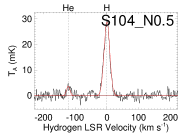 |
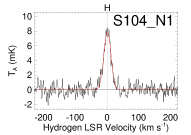 |
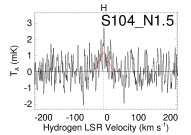 |
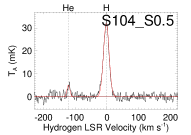 |
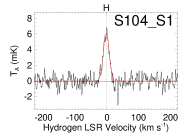 |
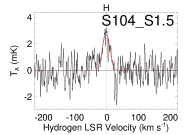 |
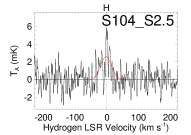 |
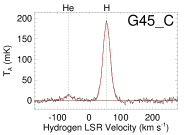 |
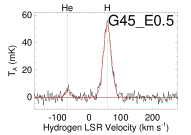 |
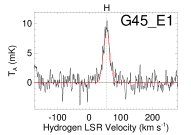 |
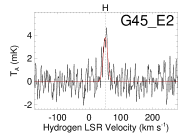 |
 |
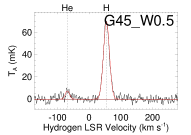 |
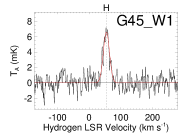 |
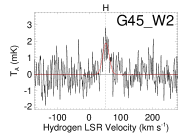 |
 |
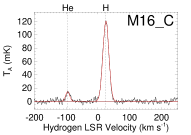 |
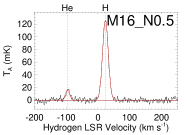 |
 |
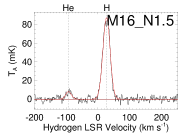 |
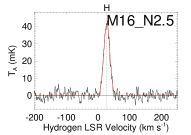 |
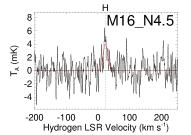 |
 |
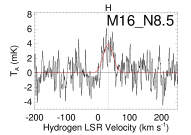 |
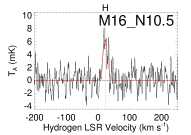 |
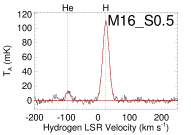 |
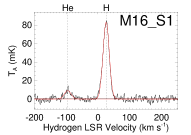 |
 |
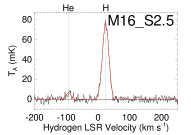 |
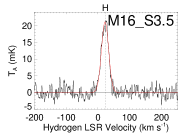 |
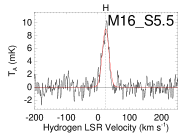 |
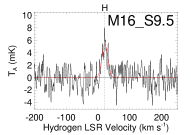 |
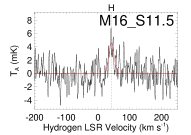 |
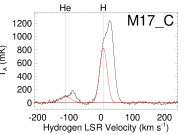 |
 |
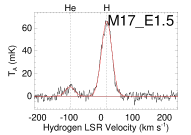 |
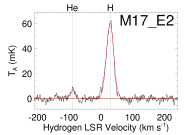 |
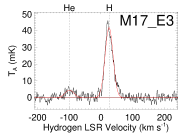 |
 |
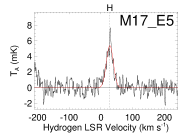 |
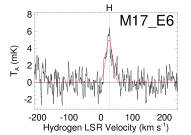 |
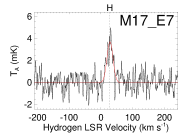 |
 |
 |
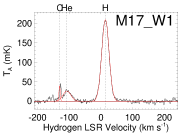 |
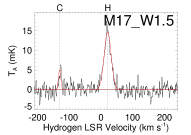 |
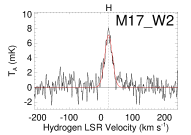 |
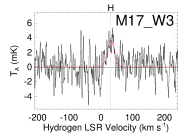 |
 |
 |
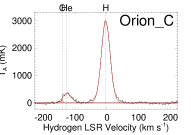 |
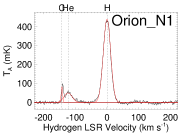 |
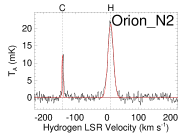 |
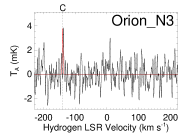 |
 |
 |
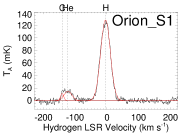 |
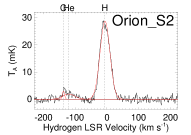 |
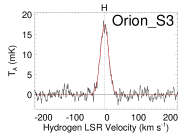 |
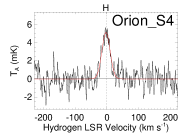 |
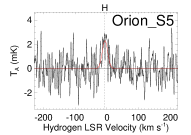 |
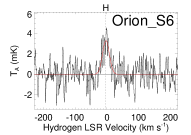 |
 |
 |
 |
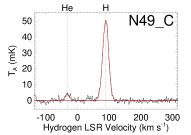 |
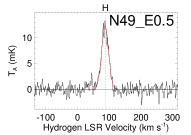 |
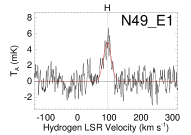 |
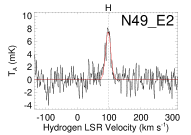 |
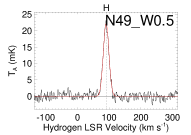 |
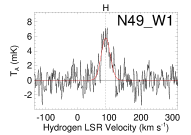 |
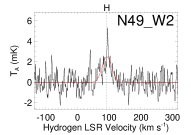 |
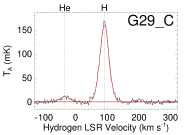 |
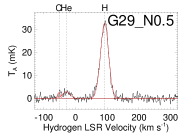 |
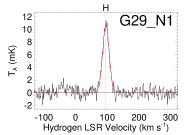 |
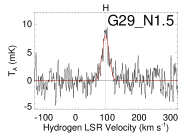 |
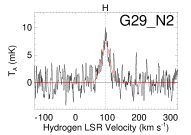 |
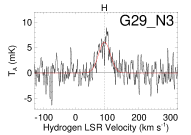 |
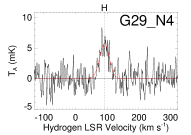 |
 |
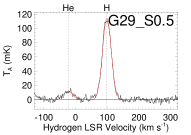 |
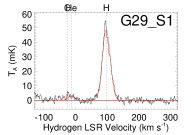 |
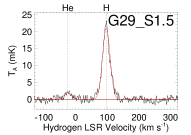 |
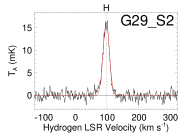 |
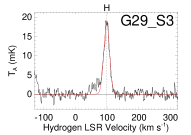 |
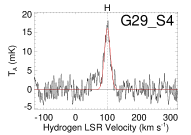 |
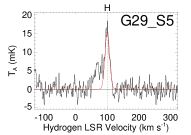 |
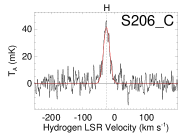 |
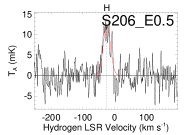 |
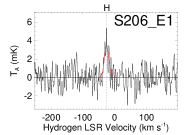 |
 |
 |
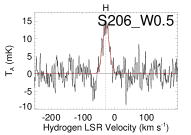 |
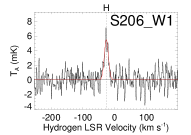 |
 |
 |
 |
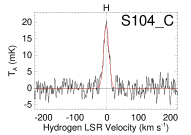 |
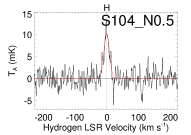 |
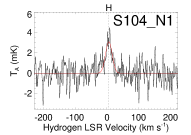 |
 |
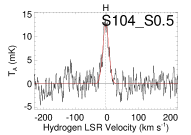 |
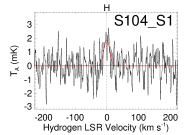 |
 |
 |
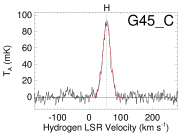 |
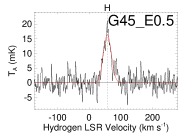 |
 |
 |
 |
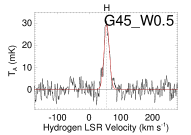 |
 |
 |
 |
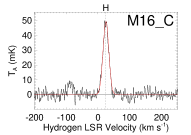 |
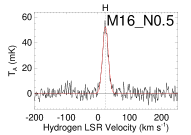 |
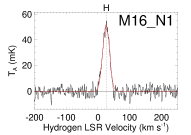 |
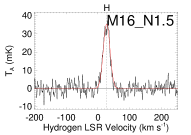 |
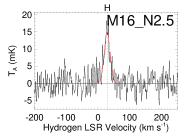 |
 |
 |
 |
 |
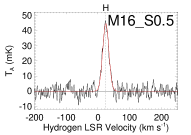 |
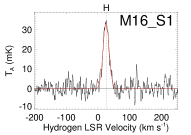 |
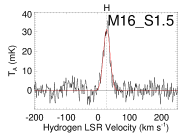 |
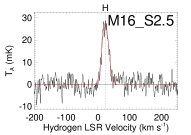 |
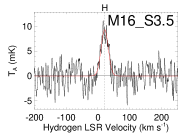 |
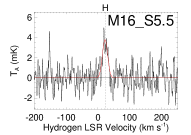 |
 |
 |
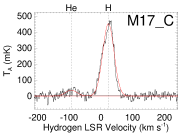 |
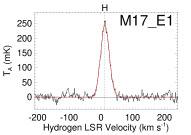 |
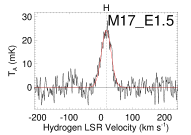 |
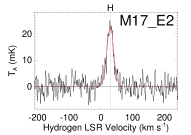 |
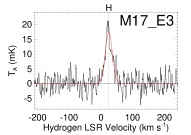 |
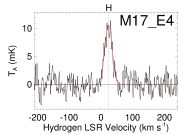 |
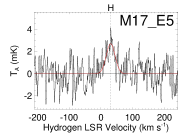 |
 |
 |
 |
 |
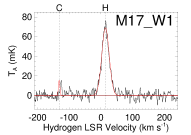 |
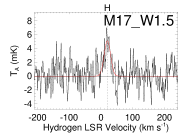 |
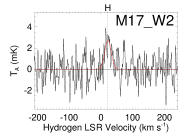 |
 |
 |
 |
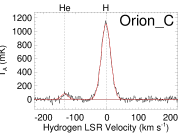 |
 |
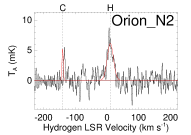 |
 |
 |
 |
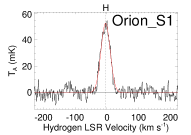 |
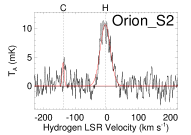 |
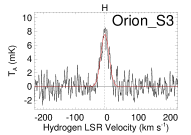 |
 |
 |
 |
 |
 |
 |
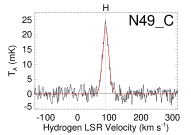 |
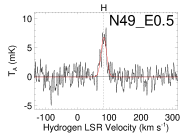 |
 |
 |
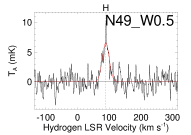 |
 |
 |
 |
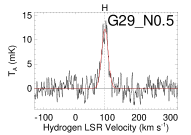 |
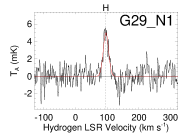 |
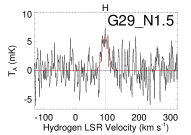 |
 |
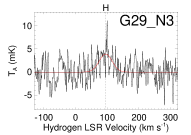 |
 |
 |
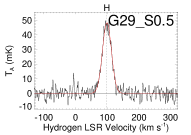 |
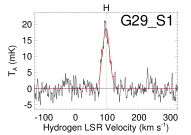 |
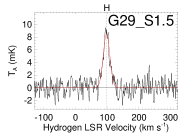 |
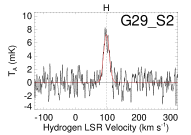 |
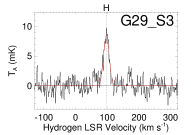 |
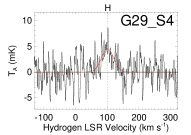 |
 |
| Source | EM | EM | ||||
|---|---|---|---|---|---|---|
| (K) | (K) | (K) | (K) | (pc cm-6) | (pc cm-6) | |
| S206_C | 6.90 | 1.00 | 9330 | 1180 | 89030 | 16910 |
| S206_E0.5 | 2.45 | 0.52 | 9550 | 1770 | 31940 | 8890 |
| S206_E1 | 0.61 | 0.11 | 9250 | 1540 | 7760 | 1940 |
| S206_E2 | 0.26 | 0.05 | 9130 | 1690 | 3390 | 940 |
| S206_E3 | 0.12 | 0.03 | ||||
| S206_W0.5 | 2.67 | 0.58 | 8860 | 1690 | 33690 | 9650 |
| S206_W1 | 0.74 | 0.14 | 9130 | 1500 | 9420 | 2320 |
| S206_W2 | 0.19 | 0.04 | 10190 | 1820 | 2500 | 670 |
| S206_W3 | 0.05 | 0.02 | ||||
| S206_W4 | 0.04 | 0.01 | ||||
| S104_C | 2.06 | 0.41 | 7270 | 1280 | 24400 | 6440 |
| S104_N0.5 | 1.42 | 0.28 | 8020 | 1380 | 17510 | 4520 |
| S104_N1 | 0.44 | 0.13 | 7320 | 1950 | 5230 | 2090 |
| S104_N1.5 | 0.10 | 0.02 | ||||
| S104_S0.5 | 1.55 | 0.30 | 8010 | 1350 | 19310 | 4870 |
| S104_S1 | 0.38 | 0.09 | 9180 | 2020 | 4950 | 1630 |
| S104_S1.5 | 0.30 | 0.05 | ||||
| S104_S2.5 | 0.34 | 0.06 | ||||
| G45_C | 13.09 | 1.64 | 7500 | 830 | 158190 | 26290 |
| G45_E0.5 | 3.45 | 0.96 | 7150 | 1750 | 41410 | 15200 |
| G45_E1 | 0.64 | 0.11 | 10320 | 1740 | 8780 | 2220 |
| G45_E2 | 0.32 | 0.22 | ||||
| G45_E3 | 0.29 | 0.04 | ||||
| G45_W0.5 | 3.34 | 0.65 | 7270 | 1240 | 40140 | 10300 |
| G45_W1 | 0.04 | 0.04 | 1240 | 1080 | 270 | 360 |
| G45_W2 | 0.15 | 0.05 | ||||
| G45_W3 | 0.07 | 0.02 | ||||
| M16_C | 5.76 | 1.20 | 7420 | 1340 | 69080 | 18750 |
| M16_N0.5 | 5.59 | 1.11 | 8150 | 1410 | 69420 | 17970 |
| M16_N1 | 6.49 | 1.24 | 8520 | 1430 | 81790 | 20530 |
| M16_N1.5 | 4.97 | 0.97 | 8900 | 1570 | 64130 | 17010 |
| M16_N2.5 | 2.23 | 0.39 | 8690 | 1360 | 28800 | 6770 |
| M16_N4.5 | 0.19 | 0.06 | ||||
| M16_N6.5 | 0.03 | 0.05 | ||||
| M16_N8.5 | 0.26 | 0.05 | ||||
| M16_N10.5 | 0.31 | 0.06 | ||||
| M16_S0.5 | 5.50 | 1.03 | 8070 | 1310 | 68250 | 16640 |
| M16_S1 | 4.06 | 0.82 | 9040 | 1590 | 52460 | 13830 |
| M16_S1.5 | 4.27 | 0.85 | 7790 | 1370 | 51580 | 13600 |
| M16_S2.5 | 3.73 | 0.72 | 8060 | 1360 | 46360 | 11740 |
| M16_S3.5 | 1.23 | 0.25 | 7670 | 1470 | 15270 | 4390 |
| M16_S5.5 | 0.49 | 0.10 | 7810 | 1560 | 6070 | 1820 |
| M16_S9.5 | 0.39 | 0.08 | ||||
| M16_S11.5 | 0.29 | 0.04 | ||||
| M17_C | 111.11 | 24.07 | 10780 | 2040 | 1500080 | 426320 |
| M17_E1 | 46.96 | 9.81 | 6870 | 1250 | 543540 | 148400 |
| M17_E1.5 | 5.73 | 1.39 | 7610 | 1640 | 69350 | 22360 |
| M17_E2 | 3.72 | 0.82 | 7720 | 1510 | 45360 | 13290 |
| M17_E3 | 2.59 | 0.58 | 7400 | 1470 | 30580 | 9130 |
| M17_E4 | 1.57 | 0.30 | 7840 | 1300 | 19160 | 4780 |
| M17_E5 | 0.32 | 0.07 | 7890 | 1540 | 3760 | 1100 |
| M17_E6 | 0.28 | 0.08 | ||||
| M17_E7 | 0.21 | 0.04 | 8720 | 1490 | 2600 | 670 |
| M17_E9 | ||||||
| M17_E11 | ||||||
| M17_W1 | 14.55 | 5.22 | 6870 | 2140 | 169580 | 79350 |
| M17_W1.5 | 0.90 | 0.23 | 7410 | 1680 | 10850 | 3690 |
| M17_W2 | 0.27 | 0.08 | 5440 | 1370 | 2830 | 1070 |
| M17_W3 | 0.31 | 0.04 | ||||
| M17_W4 | 0.29 | 0.05 | ||||
| M17_W5 | 0.15 | 0.04 | ||||
| Orion_C | 214.56 | 33.39 | 6330 | 860 | 2418330 | 492550 |
| Orion_N1 | 30.89 | 6.57 | 8040 | 1490 | 384950 | 107070 |
| Orion_N2 | 0.94 | 0.25 | ||||
| Orion_N3 | 0.07 | 0.02 | ||||
| Orion_N4 | 0.05 | 0.01 | ||||
| Orion_N5 | 0.05 | 0.01 | ||||
| Orion_S1 | 10.90 | 2.40 | 8010 | 1560 | 136530 | 40000 |
| Orion_S2 | 2.48 | 0.52 | 8400 | 1660 | 31280 | 9260 |
| Orion_S3 | 1.32 | 0.25 | 8550 | 1440 | 17030 | 4320 |
| Orion_S4 | 0.34 | 0.07 | ||||
| Orion_S5 | 0.08 | 0.03 | ||||
| Orion_S6 | 0.14 | 0.03 | ||||
| Orion_S7 | 0.09 | 0.02 | ||||
| Orion_S9 | 0.01 | 0.01 | ||||
| Orion_S11 | ||||||
| N49_C | 1.90 | 0.32 | 6250 | 920 | 22120 | 4890 |
| N49_E0.5 | 0.67 | 0.15 | 8100 | 1720 | 8990 | 2870 |
| N49_E1 | 0.39 | 0.06 | ||||
| N49_E2 | 0.47 | 0.07 | ||||
| N49_W0.5 | 0.94 | 0.21 | 7330 | 1580 | 11750 | 3800 |
| N49_W1 | 0.45 | 0.13 | ||||
| N49_W2 | 0.35 | 0.10 | ||||
| G29_C | 12.94 | 1.46 | 6490 | 680 | 148100 | 23140 |
| G29_N0.5 | 2.12 | 0.68 | 6050 | 1720 | 24240 | 10340 |
| G29_N1 | 0.45 | 0.09 | 6890 | 1340 | 5530 | 1620 |
| G29_N1.5 | 0.40 | 0.08 | ||||
| G29_N2 | 0.61 | 0.07 | ||||
| G29_N3 | 0.70 | 0.07 | ||||
| G29_N4 | 0.49 | 0.06 | ||||
| G29_N5 | 0.37 | 0.07 | ||||
| G29_S0.5 | 6.80 | 1.45 | 5980 | 1120 | 76420 | 21480 |
| G29_S1 | 2.31 | 0.56 | 5750 | 1270 | 25650 | 8480 |
| G29_S1.5 | 1.07 | 0.20 | 6850 | 1220 | 12820 | 3420 |
| G29_S2 | 0.81 | 0.12 | 7780 | 1230 | 10190 | 2410 |
| G29_S3 | 0.67 | 0.15 | 6980 | 1410 | 8260 | 2510 |
| G29_S4 | 0.41 | 0.15 | ||||
| G29_S5 | 0.64 | 0.14 |