Probing the cross-power of unresolved cosmic infrared and X-ray backgrounds with upcoming space missions
Abstract
The source-subtracted cosmic infrared background (CIB) fluctuations uncovered in deep Spitzer data cannot be explained by known galaxy populations and appear strongly coherent with unresolved cosmic X-ray background (CXB). This suggests that the source-subtracted CIB contains emissions from significantly abundant accreting black holes (BHs). We show that theoretically such populations would have the angular power spectrum which is largely independent of the epochs occupied by these sources, provided they are at , offering an important test of the origin of the new populations. Using the current measurements we reconstruct the underlying soft X-ray CXB from the new sources and show that its fluctuations, while consistent with a high- origin, have an amplitude that cannot be reached in direct measurements with the foreseeable X-ray space missions. This necessitates application of the methods developed by the authors to future IR and X-ray datasets, which must cover large areas of the sky in order to measure the signal with high precision. The LIBRAE project within ESA’s Euclid mission will probe source-subtracted CIB over the sky at three near-IR bands, and its cross-power with unresolved CXB can be measured then from the concurrent eROSITA mission covering the same areas of the sky. We discuss the required methodology for this measurement and evaluate its projected to show the unique potential of this experimental configuration to accurately probe the CXB from the new BH sources and help identify their epochs.
1 Introduction
The near-IR source-subtracted CIB fluctuations can probe emissions from early stars and black holes (BHs), inaccessible to direct telescopic studies (Kashlinsky et al., 2004; Cooray et al., 2004; Kashlinsky, 2005). Analysis of deep Spitzer images, specifically assembled for this (Arendt et al., 2010), revealed source-subtracted CIB fluctuations at 3.6 and 4.5 (Kashlinsky et al., 2005) significantly exceeding those from remaining known galaxy populations (Kashlinsky et al., 2005; Helgason et al., 2012) and indicating new cosmological sources. Follow-up studies identified the CIB fluctuation excess to with similar levels across the sky (Kashlinsky et al., 2007, 2012; Cooray et al., 2012). The source-subtracted CIB fluctuations at 3.6 and 4.5 appear coherent with soft ([0.5-2]keV) unresolved cosmic X-ray background (CXB) (Cappelluti et al., 2013; Mitchell-Wynne et al., 2016; Cappelluti et al., 2017; Li et al., 2018). The coherence levels indicate a much larger proportion of accreting BHs among the new sources than in known populations (Helgason et al., 2014). Two suggestions have been made for the origin of these populations, both at high : 1) direct collapse BHs (Yue et al., 2013) and 2) LIGO-type primordial BHs making up dark matter (Kashlinsky, 2016). See review by Kashlinsky et al. (2018).
We identify the X-ray auto-power from the new sources and discuss prospects for probing it with the forthcoming eROSITA X-ray mission in conjunction with the source-subtracted CIB measurements from the Euclid-LIBRAE111https://www.euclid.caltech.edu/page/Kashlinsky%20Team project. The reconstructed CXB power from these new sources is so weak that it cannot be isolated directly in the current or forthcoming X-ray missions. The proposed experimental configuration thus appears uniquely suitable in identifying important information about the BH sources responsible for the observed coherence and their epochs and distribution. After specifying the instrumentational configuration (Euclid-LIBRAE for CIB and eROSITA for CXB), we define theoretical expectations and show that, unlike low- sources, BHs at high exhibit a well-defined shape of the auto- and cross-power spectrum, which rises at , robustly peaks at –, and traces the Harrison-Zeldovich (HZ) regime, , at larger angular scales . These CXB-CIB cross-powers between source-subtracted LIBRAE-based CIB and the net (unclipped) CXB from the X-ray missions are derivable using only harmonics corresponding to their common resolution. We evaluate the uncertainties in this measurement, which require inputs in the net X-ray and IR powers for this setup. The eROSITA-Euclid configuration appears currently the most optimal to probe the cross-power and the CXB power arising in these BH populations.
2 Motivation
Source-subtracted CIB fluctuations will be measured in 3 NISP bands from the Euclid Wide Survey (EWS) covering 15,000 deg2 to AB with instantaneous FoV of 0.5 deg2 (Laureijs et al., 2011, 2014). Even excluding areas with substantial Galactic foregrounds, EWS will provide source-subtracted CIB power to sub-percent statistical accuracy. The clipping fraction for CIB maps from Euclid will be (Kashlinsky et al., 2018) requiring no significant masking corrections of Fourier amplitudes, . Using EWS data, LIBRAE will measure source-subtracted CIB anisotropies on sub-degree angular scales allowing to probe the CIB-CXB cross-power using with the contemporaneous eROSITA X-ray mission. eROSITA will survey the full sky with 15–28′′ resolution after 6 months (eRASS1), and add repeated coverage over the next 3.5 years to reach erg/s/cm2 (eRASS8). Additional depth is reached at the polar region of 140deg2 (Merloni et al., 2012). See Fig.1c.
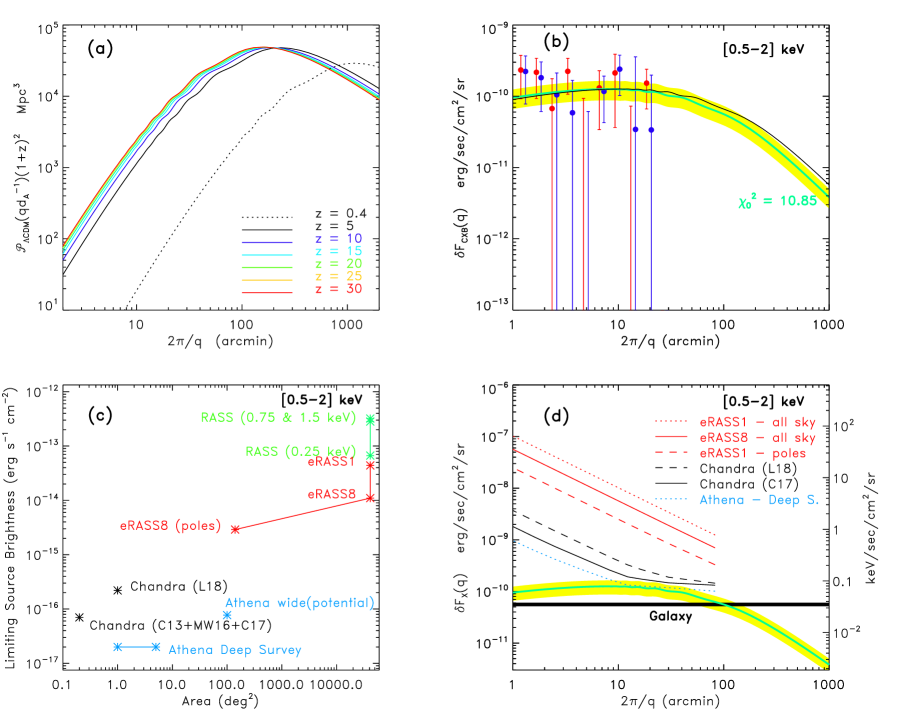
Cross-power between backgrounds at bands 1 (IR) and 2 (X-ray) is:
| (1) |
where , and is the Lyman cutoff for emissions reaching filter at (rest-frame IR) wavelength with being the flux rate production at that wavelength (e.g. NISP H-band). For scales subtending linear density field, the 3-D power spectrum is linearly biased with respect to the underlying CDM power, . In linear regime and at density perturbations grow so that const, which is shown in Fig. 1a at various . At the comoving distance is Gpc varying by over , the range defined by the Ly cutoff at Euclid/NISP J,H filters. Fig.1a shows that sources at exhibit an approximately -independent power spectrum template which defines robustly the cross- and auto-power shapes from sources at those epochs; i.e. the measured cross-power (the weighted measure of CXB and CIB from these sources). The HZ regime, , results in cross- and auto- powers and is reached at –. At the same time, sources at low(er) have widely varying shapes of likely resulting in a broad range of possible shapes for the projected power, which will differ noticeably from the high- component. Thus measuring the CIB-CXB cross-power with good accuracy over sufficiently wide angular scales is important in probing/verifying the origin of the signal at high .
The CIB-CXB cross-power can be used to assess the CXB fluctuations, , from:
| (2) |
This represents the CXB fluctuations produced directly by the new sources to within the product with the square-root of the underlying CXB-CIB coherence, currently measured to exceed ; if the CIB is predominantly BH-produced eq.2 would give the true underlying CXB from the new sources with . Because coherence is , eq.2 sets a lower limit on the CXB power from the sources.
From the Spitzer/Chandra-measured cross- and auto-CIB powers () one can derive the CXB power, eq.2, as . The green line shows the CXB power from the new sources with the normalization of the CIB power using the CDM template at Gpc normalized per Kashlinsky et al. (2015). While the fit is statistically acceptable, the figure shows the limitations of the current measurements for proper interpretation: the signal is probed with limited accuracy and is restricted to .
Fig.1c shows the depth and angular coverage from X-ray data. Fig.1d shows from sources remaining in the data compared to the signal from populations responsible for the measured source-subtracted CIB fluctuations and cross-power with unresolved CXB. We estimated the angular power spectrum from known extragalactic X-ray point sources following Helgason et al. (2014). AGNs are sparse and bright; therefore their power spectrum tends to be shot-noise dominated out to few degrees (Helgason et al., 2014; Kolodzig et al., 2017). We adopt the X-ray population model of Gilli et al. (2007), in agreement with observed source counts (e.g. Luo et al., 2017), and calculate the associated shot-noise power below a given flux limit, neglecting the clustering term from AGN. Galaxies contain high- and low-mass X-ray binaries whose X-ray luminosities scale with star formation rate and stellar mass respectively. For the galaxy population and its clustering, we use a semi-analytic galaxy formation model based on the Millennium simulation (Henriques et al., 2015), which reproduces the observed star formation history and stellar mass function as a function of redshift. We assign each source its luminosity distance and an X-ray brightness using the -SFR relation from Lehmer et al. (2016), accounting for its scatter. We create a model X-ray image inserting each source in its projected position. Eliminating sources above a given flux limit, the power spectrum is calculated directly from the image using the 2D FFT.
Fig.1d shows that to robustly probe the new sources in direct CXB measurements, one would need integrations significantly deeper than what will be available while doing this over a large sky area. Hence, the potential of the proposed CIB-CXB cross-power measurement using Euclid and eROSITA.
The cross-power between source-subtracted CIB from LIBRAE/Euclid and CXB from eROSITA can be evaluated as follows: 1) take X-ray diffuse maps with minimal (corresponding to the X-ray survey limits) clipping and keep all harmonics in , 2) take clipped CIB maps and keep only the same harmonics in . Then 3) evaluate the cross-power over as , where the CIB power is (presumably) dominated by the new sources. ( is the Heaviside step-function and for eROSITA). This is similar to the methodology for measuring CMB-CIB cross-power with Euclid all-sky CIB data to probe the IGM at (Atrio-Barandela & Kashlinsky 2014). The known sources will contribute only negligibly to as we discuss in Sec.3, but will contribute to the noise on it, eq. 3. The half-energy-width (HEW) of the eROSITA PSF is 28 with extended tails, so mask leakage from bright sources is a potential noise source. This effect was estimated as subdominant in (Kashlinsky et al., 2018, Sec. VII.D) at small angular scales, becoming less important at the larger scales. Conservatively we take the smallest angular scale to be for the CXB-CIB cross-power estimates, where also CIB contributions from remaining known sources are smaller than the expected high- component.
In the presence of X-ray and IR maps with net diffuse light power the error on the measured cross-power at from an ensemble of independent Fourier elements is
| (3) |
The cosmological cross-power is expressable in terms of the cosmological auto-powers as with the coherence potentially reaching . The signal-to-noise of the cross-power measurements, for one single patch of size on the side, is
| (4) |
where is the net diffuse flux fluctuation in the X-ray maps from sources remaining at the X-ray depth and Galaxy, is defined similarly at its own IR depth. The number of elements, , for the patch which goes into determining the power at each depends on the patch area, , and the -binning. We write , where is the bin-width over which the power at the given wavenumber is averaged in the Fourier plane. The direct measurement of [Eq. (2)] would have a corresponding . Employing the cross power instead of direct measurement of the CXB fluctuations leads to improved when . Thus improvements are made when the total background is more strongly influenced by the cosmological component in the IR emission than in the X-ray emission, and as long as a low coherence does not counteract the benefit of using cleaner IR data: the method identifies the new CXB contributing populations if 1) they are strongly coherent with the CIB sources, 2) the CIB power of the new sources is isolated, but 3) their CXB contributions are drowned in the noise and other X-ray sources. Furthermore, a given Gaussian-distributed cross-power corresponds to higher confidence levels than the -distributed auto-power.
The net signal-to-noise over a wide net area covering such patches becomes:
| (5) |
where is evaluated in Sec. 3; this last expression being appropriate when analysis of a large area of sky is performed after dividing it into smaller patches. when the terms inside the sum for are -independent.
3 CXB-CIB cross-power uncertainties
To evaluate the one needs the ratios of the cosmic background to total powers in each of the IR and X-ray bands. For CIB, we adopt a theoretical model based on the IMF500 model from Helgason et al. (2016), which fits the Spitzer excess CIB measurements as discussed in Kashlinsky et al. (2015) with the mean formation efficiency per halo of ending at . This model, shown in Fig. 2, has negligible CIB contributions in the NISP Y filter, but dominates remaining known galaxy contributions at J and H. Strictly speaking it corresponds to stellar emissions from very massive stars ( each), but, because those radiate at the Eddington limit with as do BHs, can be straightforwardly rescaled to BH emissions.
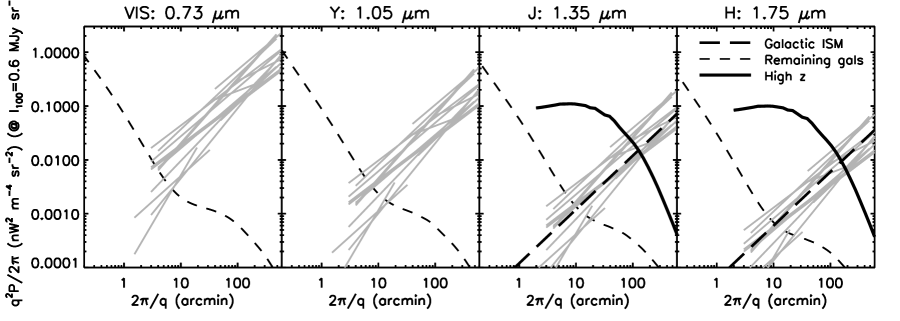
In deep IR images, source subtraction removes Galactic stars and resolved extragalactic sources. At small angular scales (e.g. ) or for relatively shallow observations, the shot noise of the remaining faint galaxies of known populations will still contribute to the overall IR background power. Emission from the Galactic ISM will also remain, and provide a potentially dominant foreground to the CIB. The power spectrum of Galactic ISM emission has been measured at 100 m (e.g. Gautier et al., 1992; Wright, 1998; Miville-Deschênes et al., 2002; Kiss et al., 2003; Lagache et al., 2007; Bracco et al., 2011; Pénin et al., 2012). These studies were in regions of various ISM brightness, but we empirically find using the data from these studies that , and renormalize all the reported power spectra to a mean ISM 100 m intensity of 0.6 MJy/sr. We rescaled the power spectra from 100m to near-IR using a typical 2–300m spectrum of the ISM222https://irsa.ipac.caltech.edu/data/SPITZER/docs/files/spitzer/background.pdf, extended to shorter wavelengths using the diffuse Galactic light measurements of Brandt & Draine (2012), and adjusting at to match the redder 3.6/100 m color (Arendt & Dwek, 2003). The resultant ISM power spectra at different Euclid wavelengths are shown in Fig.2, along with the nominal power law that we use to represent the ISM in further calculations, i.e. .
Contributions from remaining known galaxies, dashes in Fig.2 (see Sec. VII.C, Kashlinsky et al., 2018), are small compared to the model CIB at the scales and wavelengths of interest, and J,H. Because of the much deeper IR threshold of removing individual sources in EWS than in eROSITA, they contribute only negligibly to the IR-X cross-power. We evaluated the cross-power from known sources remaining at the EWS H-band projected depth using the methodology described in Sec.2. The known galaxies were found to contribute (erg/sec/cm2/srnW/m2/sr) at , dropping to at while reaching at . The CIB-CXB fluctuations are measured at 3.6 in Cappelluti et al. (2017, Fig. 2 there) to be in these units leading to numbers displayed in Fig.1b,d. The H-band CIB-CXB cross-power from the new sources would be larger by the corresponding ratio of the CIB powers at the H to 3.6 bands or a factor of per Fig.2,right, assuming the coherence remains constant. This component is thus neglected in the overall budget of .
The ratio of the amplitudes of the CXB and the total X-ray fluctuations is estimated from the components shown in Fig.1d. The total X-ray power is the sum of the CXB, the remaining extragalactic component for any given survey, and a Galactic ISM component. The high latitude X-ray power has been measured by Śliwa et al. (2001) using ROSAT, and over a more limited region using much deeper Chandra data by Kolodzig et al. (2018). The largest scale measurements (at ) by Kolodzig et al. (2018) can be extrapolated (using or =const) as an upper limit on ISM X-ray emission (see Fig.1d), consistent with the largest scale ROSAT/RASS measurements. Comparison with the expected CXB power spectrum reveals that at high latitudes, the ISM power will be comparable to or fainter than the extragalactic power.

The final consideration in evaluating the of the prospective measurement involves in the region of measurements. The ratios and discussed above are representative for high latitude regions. For regions closer to the Galactic plane, the foreground emission increases relative to the cosmic background. The ratios and thus the for such regions decrease. To estimate this effect, we made maps of the amplitudes of and , by rescaling the DIRBE 100 m and ROSAT R4+R7 maps. Thus the can be evaluated by summing over increasingly larger areas (increasing and/or the number of patches), but decreasingly smaller ratios of background to total power. The resultant ’s are shown in Fig.3,right. As one approaches large areas, the value of , governing the overall achievable , saturates and increasing the net area leads to progressively lower benefits as a few thousand deg2.
4 Prospects from upcoming X-ray missions
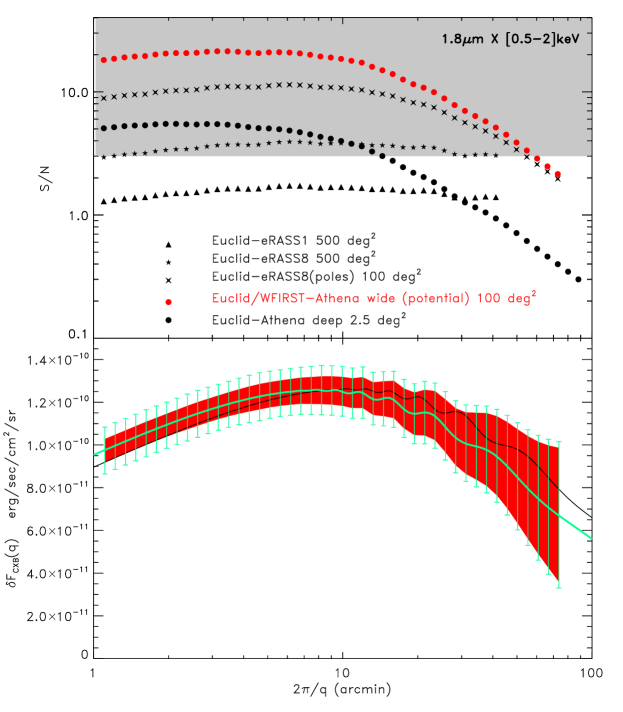
We now evaluate the of the aforementioned configurations using the EWS CIB. The dotted line in Fig.3,left demarcates where CIB and foregrounds contributions to the net IR power become comparable: becomes dominant over the IGM/cirrus contributions over 1) deg2 area if square patches of 0.7∘ on the side are selected (comparable to NISP’s FoV), 2) deg2 if the area is probed in square patches of 1 deg2, or , and 3) deg2 if probing out to . These configurations correspond to 1) eROSITA1/8, 2) eROSITA-poles, and 3) Athena-deep and we estimate the resultant there. This is a conservative limit as covering more area would result in a better signal out to ; Fig.3,right shows that of for eRASS all-sky configurations is reached at deg2. In estimating we adopted Fourier binning of and assumed that the patches analyzed are of the same extent as the scale of interest. If the patches analyzed are much larger than the scales measured, these results can be binned over wider , which increases and .
Fig.4,top shows the achievable for the NISP H-band. As Fig. 2 indicates the numbers using J-band CIB would be similar, although combining the two IR bands would not lead to appreciable increase of the overall S/N because the uncertainties are due to populations remaining in the data which correlate between the IR bands, rather than instrumental noise. eROSITA appears to be very well suited for this measurement at least as far as the soft X-ray band is concerned, with the best configuration being the eROSITA-poles survey. At a given X-ray depth . at each scale can be achieved already with the eROSITA1 maps with out to , enabling a good first look at the cross-power. Athena-Deep would have good sensitivity out to , but because of its small area will lose sensitivity at larger scales. eRASS8 and eROSITA-Poles surveys will allow probing the cross-power highly accurately out to . We note that, given the high , masking corrections may be important to make when doing FFTs, unless avoided by the CPU-time intensive correlation function analysis.
The shape of the cross-power, as probed by the eROSITA-poles, could potentially probe the epochs of the new sources although detailed studies of the masking effects at such high would be required to answer this quantitatively as we are now conducting. However, the high- origin of the signal would be probed directly with the Lyman-break cutoff from the EWS VIS and NISP cross-powers (Kashlinsky et al., 2018).
Post-Euclid/eROSITA, WFIRST to-be-launched in late 2020’s will cover 2,000 deg2 at 4 NIR bands to deeper levels than EWS (Spergel et al., 2015) and ESA’s Athena X-ray mission launch (Nandra et al., 2013) is planned in early 2030s. Athena with HEW PSF and a collecting area much larger than eROSITA’s, will be a much more sensitive telescope for faint diffuse emission to study the fluctuations over a broader range of angular scales. An Athena wide survey (say, deg2) at depths comparable to the Chandra integrations used in Cappelluti et al. (2017) will achieve the shown with red in Fig.4. This exceeds eROSITA and would require only as much integration as the planned Athena Deep Survey (2–5 deg2), assuming const. Such an Athena wide survey would probe the CIB-CXB cross-power, and the corresponding CIB auto-power, at the levels where remaining CXB comes very close to that from the new sources (Fig.1d). In this situation one would be able to probe the intrinsic coherence due to BHs among the CIB sources.
We acknowledge support from NASA/12-EUCLID11-0003 “LIBRAE: Looking at Infrared Background Radiation Anisotropies with Euclid” project (http://librae.ssaihq.com), NASA award #80GSFC17M0002 (RGA), and Icelandic Research Fund grant #173728-051 (KH).
References
- Arendt & Dwek (2003) Arendt, R. G., & Dwek, E. 2003, ApJ, 585, 305
- Arendt et al. (2010) Arendt, R. G., Kashlinsky, A., Moseley, S. H., & Mather, J. 2010, ApJS, 186, 10
- Bracco et al. (2011) Bracco, A., Cooray, A., Veneziani, M., et al. 2011, MNRAS, 412, 1151
- Brandt & Draine (2012) Brandt, T. D., & Draine, B. T. 2012, ApJ, 744, 129
- Cappelluti et al. (2013) Cappelluti, N., Kashlinsky, A., Arendt, R. G., et al. 2013, ApJ, 769, 68
- Cappelluti et al. (2017) Cappelluti, N., Arendt, R., Kashlinsky, A., et al. 2017, ApJ, 847, L11
- Cooray et al. (2004) Cooray, A., Bock, J. J., Keatin, B., Lange, A. E., & Matsumoto, T. 2004, ApJ, 606, 611
- Cooray et al. (2012) Cooray, A., Smidt, J., de Bernardis, F., et al. 2012, Nature, 490, 514
- Gautier et al. (1992) Gautier, T. N., I., Boulanger, F., Perault, M., & Puget, J. L. 1992, AJ, 103, 1313
- Gilli et al. (2007) Gilli, R., Comastri, A., & Hasinger, G. 2007, A&A, 463, 79
- Helgason et al. (2014) Helgason, K., Cappelluti, N., Hasinger, G., Kashlinsky, A., & Ricotti, M. 2014, ApJ, 785, 38
- Helgason et al. (2012) Helgason, K., Ricotti, M., & Kashlinsky, A. 2012, ApJ, 752, 113
- Helgason et al. (2016) Helgason, K., Ricotti, M., Kashlinsky, A., & Bromm, V. 2016, MNRAS, 455, 282
- Henriques et al. (2015) Henriques, B. M. B., White, S. D. M., Thomas, P. A., et al. 2015, MNRAS, 451, 2663
- Kashlinsky (2005) Kashlinsky, A. 2005, Phys. Rep., 409, 361
- Kashlinsky (2016) —. 2016, ApJ, 823, L25
- Kashlinsky et al. (2004) Kashlinsky, A., Arendt, R., Gardner, J. P., Mather, J. C., & Moseley, S. H. 2004, ApJ, 608, 1
- Kashlinsky et al. (2012) Kashlinsky, A., Arendt, R. G., Ashby, M. L. N., et al. 2012, ApJ, 753, 63
- Kashlinsky et al. (2018) Kashlinsky, A., Arendt, R. G., Atrio-Barandela, F., et al. 2018, Reviews of Modern Physics, 90, 025006
- Kashlinsky et al. (2015) Kashlinsky, A., Arendt, R. G., Atrio-Barandela, F., & Helgason, K. 2015, ApJ, 813, L12
- Kashlinsky et al. (2005) Kashlinsky, A., Arendt, R. G., Mather, J., & Moseley, S. H. 2005, Nature, 438, 45
- Kashlinsky et al. (2007) —. 2007, ApJ, 654, L5
- Kiss et al. (2003) Kiss, C., Ábrahám, P., Klaas, U., et al. 2003, A&A, 399, 177
- Kolodzig et al. (2017) Kolodzig, A., Gilfanov, M., Hütsi, G., & Sunyaev, R. 2017, MNRAS, 466, 3035
- Kolodzig et al. (2018) —. 2018, MNRAS, 473, 4653
- Lagache et al. (2007) Lagache, G., Bavouzet, N., Fernandez-Conde, N., et al. 2007, ApJ, 665, L89
- Laureijs et al. (2011) Laureijs, R., Amiaux, J., Arduini, S., et al. 2011, ArXiv e-prints, arXiv:1110.3193
- Laureijs et al. (2014) Laureijs, R., Racca, G., Stagnaro, L., et al. 2014, in Proc. SPIE, Vol. 9143, Space Telescopes and Instrumentation 2014: Optical, Infrared, and Millimeter Wave, 91430H
- Lehmer et al. (2016) Lehmer, B. D., Basu-Zych, A. R., Mineo, S., et al. 2016, ApJ, 825, 7
- Li et al. (2018) Li, Y., Cappelluti, N., Arendt, R. G., et al. 2018, ApJ, 864, 141
- Luo et al. (2017) Luo, B., Brandt, W. N., Xue, Y. Q., et al. 2017, ApJS, 228, 2
- Merloni et al. (2012) Merloni, A., Predehl, P., Becker, W., et al. 2012, ArXiv e-prints, arXiv:1209.3114
- Mitchell-Wynne et al. (2016) Mitchell-Wynne, K., Cooray, A., Xue, Y., et al. 2016, ApJ, 832, 104
- Miville-Deschênes et al. (2002) Miville-Deschênes, M. A., Lagache, G., & Puget, J. L. 2002, A&A, 393, 749
- Nandra et al. (2013) Nandra, K., Barret, D., Barcons, X., et al. 2013, ArXiv e-prints, arXiv:1306.2307
- Pénin et al. (2012) Pénin, A., Lagache, G., Noriega-Crespo, A., et al. 2012, A&A, 543, A123
- Śliwa et al. (2001) Śliwa, W., Soltan, A. M., & Freyberg, M. J. 2001, A&A, 380, 397
- Spergel et al. (2015) Spergel, D., Gehrels, N., Baltay, C., et al. 2015, ArXiv e-prints, arXiv:1503.03757
- Wright (1998) Wright, E. L. 1998, ApJ, 496, 1
- Yue et al. (2013) Yue, B., Ferrara, A., Salvaterra, R., Xu, Y., & Chen, X. 2013, MNRAS, 433, 1556