[a]European XFEL, Holzkoppel 4, 22869 Schenefeld, Germany \affiliation[b]Faculty of Electrical Engineering and Information Technology, Slovak University of Technology, Ilkovičova 3, 81219 Bratislava, Slovakia \affiliation[c]SLAC National Accelerator Laboratory, Sand Hill Road 2575, Menlo Park, California 94025, U.S.A. \affiliation[d]Lawrence Berkeley National Laboratory, Cyclotron Road 1, Berkeley, California 94720, U.S.A. \affiliation[e]Deutsches Elektronen-Synchrotron DESY, Notkestraße 85, 22607 Hamburg, Germany \emailAddivana.klackova@xfel.eu
Characterization of the ePix100a and the FastCCD Semiconductor Detectors for the European XFEL
Abstract
The European X-ray Free Electron Laser (EuXFEL) is a research facility providing spatially coherent X-ray flashes in the energy range from keV to keV of unprecedented brilliance and with unique time structure: X-ray pulses with a MHz repetition rate arranged in trains with 2700 pulses every ms. The facility operates three photon beamlines called SASE 1, SASE 2 and SASE 3. Each of the beamlines is hosting two scientific experiments. The SASE 1 beamline started its user operation in September 2017, followed by successful first lasing at the SASE 2 beamline in May 2018. Early user experiments are planned to start in 2019 at this beamline, while early user experiments for the SASE 3 beamline are scheduled for the end of 2018. The quality of the experimental data will gain substantial benefits from an accurate characterization and calibration of the X-ray detectors. Supplementing high repetition rate detectors at MHz speeds, slower detectors such as the ePix100a and the FastCCD will be operated at the train repetition rate of Hz. These 2D silicon pixelized detectors use fast parallel column-wise readout implemented as a CCD or as a hybrid pixel detector. In the following, characterization and analysis approaches for the FastCCD and the ePix100a detectors are discussed and the performance of the detectors is evaluated using appropriate state-of-the-art analysis techniques.
X-ray detectors, Solid state detectors, Analysis and statistical methods
\arxivnumber1812.01390
\proceeding20 International Workshop on Radiation Imaging Detectors
24–28 June 2018
Sundsvall, Sweden
3cm(11.5cm,-2cm) SLAC-PUB-17361
1 Introduction
The European X-ray Free Electron Laser (EuXFEL) is an international research facility in the Hamburg/Schenefeld area, Germany with the purpose of enabling scientific experiments in various areas using ultrafast spatially coherent X-ray flashes with unprecedented brilliance. The facility provides X-rays in the energy range from keV to keV with a unique time structure: pulses with a MHz repetition rate are arranged in trains of pulses, repeating every ms, the pulse duration is less than fs [1]. EuXFEL serves three scientific beamlines, each hosting two scientific instruments, namely:
-
•
At SASE 1 the Single Particles, Clusters, and Biomolecules & Serial Femtosecond Crystallography (SPB/SFX) and Femtoscond X-ray experiments (FXE) instruments [2].
-
•
At SASE 2 the Materials Imaging and Dynamics (MID) and High Energy Density matter (HED) instruments [2].
-
•
At SASE 3 the Spectroscopy & Coherent Scattering (SCS) and Small Quantum Systems (SQS) instruments [2].
1.1 Detectors at EuXFEL
Requirements deriving from time structure, intensity of the FEL beam and each individual beamline mandate for novel detectors being developed as no existing detector technology was capable of simultaneously satisfying all the requirements [3]. To match the time structure of EuXFEL photon beam, detectors recording images at 4.5 MHz, resolving individual pulses and with ability to detect extremely short pulses (¡100 fs) were needed. High dynamic range enabling single photon counting and simultaneous detection of up to ph/pixel/pulse, spatial resolution required by scientific instrument, energy range matching instrument beamlines and data processing capabilities of the order of GB/s per 4.5 MHz detector are other examples of demanding requirements for detectors at EuXFEL. A summary of the 2D imaging detectors presently in use or planned to be used in the near future at the European XFEL is listed in Table 1.
| 2D detector |
|
|
Dynamic Range | Frame Rate | Instrument | ||||
|---|---|---|---|---|---|---|---|---|---|
| AGIPD [4] |
|
10ph @ 12 keV | 4.5 MHz | SPB, MID | |||||
| DSSC [5] |
|
10ph @ 1 keV | 4.5 MHz | SCS, SQS | |||||
| ePix100a [6, 7] |
|
100 ph @ 8 keV | 240 Hz | HED, MID | |||||
| ePix10Ka [8] |
|
10ph @ 8 keV | 240 Hz | HED | |||||
| FastCCD [9, 10] |
|
10ph @ 0.5 keV | 120 Hz | SCS | |||||
| JUNGFRAU [11] |
|
10ph @ 12 keV | 1.1 kHz | HED | |||||
| LPD [12] |
|
10ph @ 12 keV | 4.5 MHz | FXE | |||||
| pnCCD [13] |
|
610ph @ 1 keV | 150 Hz | SCS, SQS |
-
*
Hexagonal pixels.
Exemplary technical requirements for Hz detection of the three scientific instruments HED, MID and SCS are shown in Table 2. The FastCCD and the ePix100a fulfil these requirements and have been selected as suitable detectors for the mentioned scientific instruments.
| Requirements | Actual parameters | Requirements | Actual parameters | ||||
|---|---|---|---|---|---|---|---|
| HED & MID | ePix100a | SCS | FastCCD | ||||
| Compact design | mm | Passage for beam | Beamhole in the sensor | ||||
| Small pixel size | Small pixel size | ||||||
| Vacuum operation | Compatible | Vacuum operation | Compatible | ||||
|
41 e- rms |
|
23 e- rms | ||||
| Hard X-ray regime | keV range | Soft X-ray regime | keV range |
2 Calibration of the ePix100a and the FastCCD Detectors
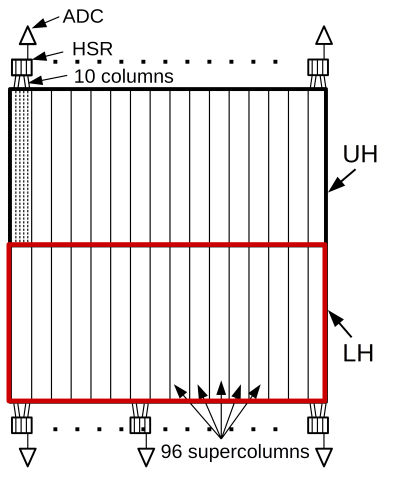
Even though the ePix100a, as a hybrid pixel detector, and the FastCCD, as a CCD, are following two fundamentally different detector designs, each requiring different calibration method, similarities exist between the two, as both detectors are read out in a (quasi-)column-parallel manner. The FastCCD as a CCD detector performs column-wise charge shifting in order to read out the signal from pixels. Readout is implemented in a so-called quasi-column-parallel fashion, where 10 columns are multiplexed onto one common readout node as shown in the left image of Figure 1. In addition the sensor is split into two halves, such that the bottom and top half can be read out separately.
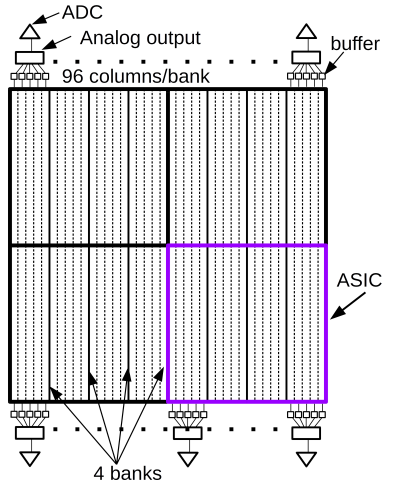
Charge created in the ePix100a pixels is first pre-amplified, integrated in a single-stage charge integrator, low-pass filtered, baseline subtracted and sampled by a column buffer and then digitized in a column-parallel fashion. The ePix100a consists of four ASICs, each divided into four banks [6]. Columns per-bank are multiplexed on a single analog output and are digitized by external ADCs, shown in the right panel of Figure 1. These similarities and differences in signal handling during read-out allow comparing analysis approaches to improve efficiency of calibration and characterization across different detectors technologies.
2.1 Calibration Measurements
Calibration measurements of the FastCCD were performed using an 55Fe radiation source, producing Mn Kα at 5.9 keV and Mn Kβ peak at 6.49 keV. Measurements were carried out under high vacuum conditions at mbar, at a temperature of C using an exposure time of ms. The ePix was operated under ambient conditions while being irradiated with an X-ray tube with Mo target and an 55Fe source. 55Fe data were acquired at 17C with 800s integration time as cooling of the detector to lower temperatures at the time was limited. X-ray tube data were acquired at 10C with 800s integration time.
3 Performance Evaluation
The corresponding data were analysed using the calibration pipeline developed at EuXFEL for fast, consistent and reliable detector calibration [14, 15, 16]. The analysis procedures can be divided into two categories by the type of detector images used. The first category of routines uses dark data to estimate effects of the dark signal, e.g., offset and noise. The outcome of the so called ”dark calibration” is later needed for the second category of characterisation algorithms, operating on data with X-ray signal, such as flat-field calibration which reveals more detailed information about, e.g., the gain and the energy resolution of the detector.
3.1 FastCCD Performance
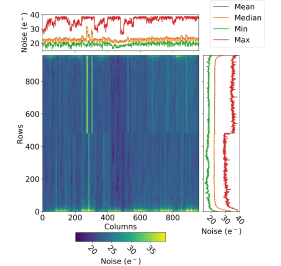
The full size of the FastCCD sensor is pixels. However, the camera was operated in the so-called frame store mode, where only central pixels are used for charge integration, the remaining sensor area acts as a fast storage area, allowing it to operate at higher acquisition rates. Evaluating dark images reveals general performance related features of a detector, e.g. prominent strip pattern observable in an offset map as shown in Figure 2. Due to the quasi-column-parallel readout of the FastCCD, a strip-like pattern corresponding to so-called supercolumns is apparent in the dark image (Figure 2, left). Note that mean and median values of row and column profiles show similar trend, which is due to the homogeneous response of the sensor across the whole sensitive area, with no significant outliers occurring. Another feature relates to the sensor design, being divided into two hemispheres (top and bottom) and read out separately towards the top and bottom. The two hemispheres are distinguishable in both the offset and the noise map (Figure 2, left and right). As RMS noise our analysis reveals () for the FastCCD. Noisier edges apparent in Figure 2 are caused by the readout electronics.

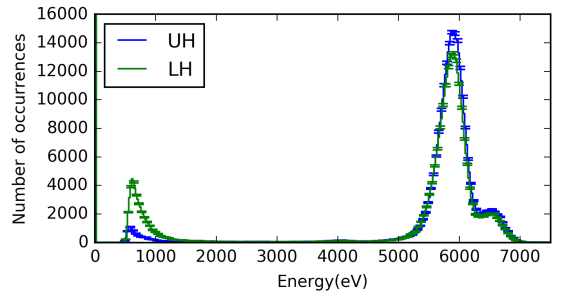
Performing a flat-field analysis on a CCD detector allows investigation of effects such as charge transfer inefficiency (CTI) and varying relative gain due to different characteristics of the readout amplifiers. CTI is a measure of the charge transfer losses given by {align} CTI = 1 - Qn+1Qn, where is the charge in a pixel after n transfer cycles. The per-column CTI of the FastCCD is shown in Figure 4, where the top plot represents the lower hemisphere (LH) and the bottom plot the upper hemisphere (UH) of the FastCCD.

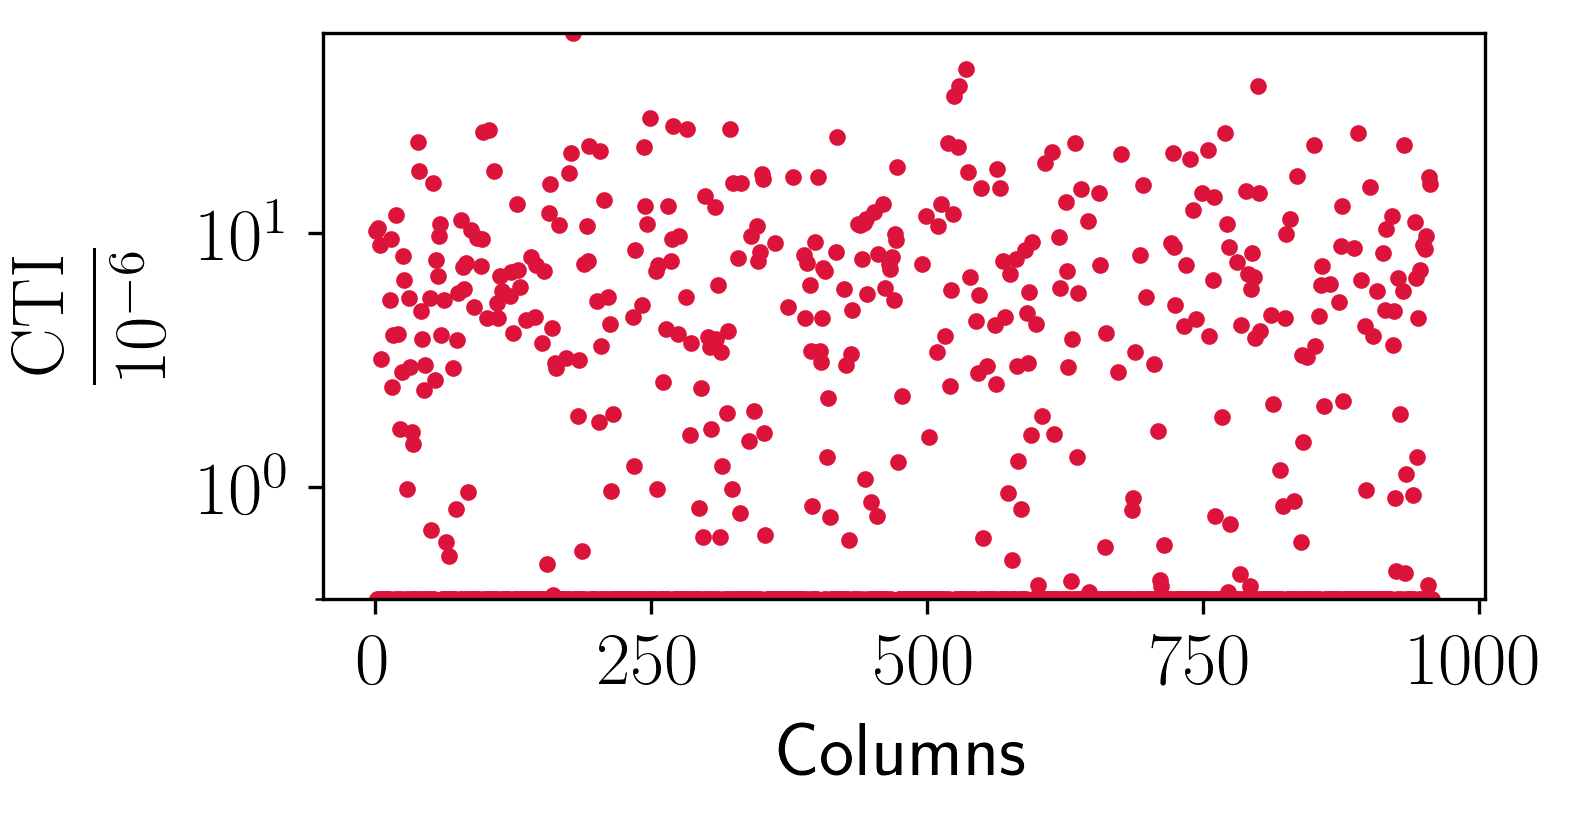
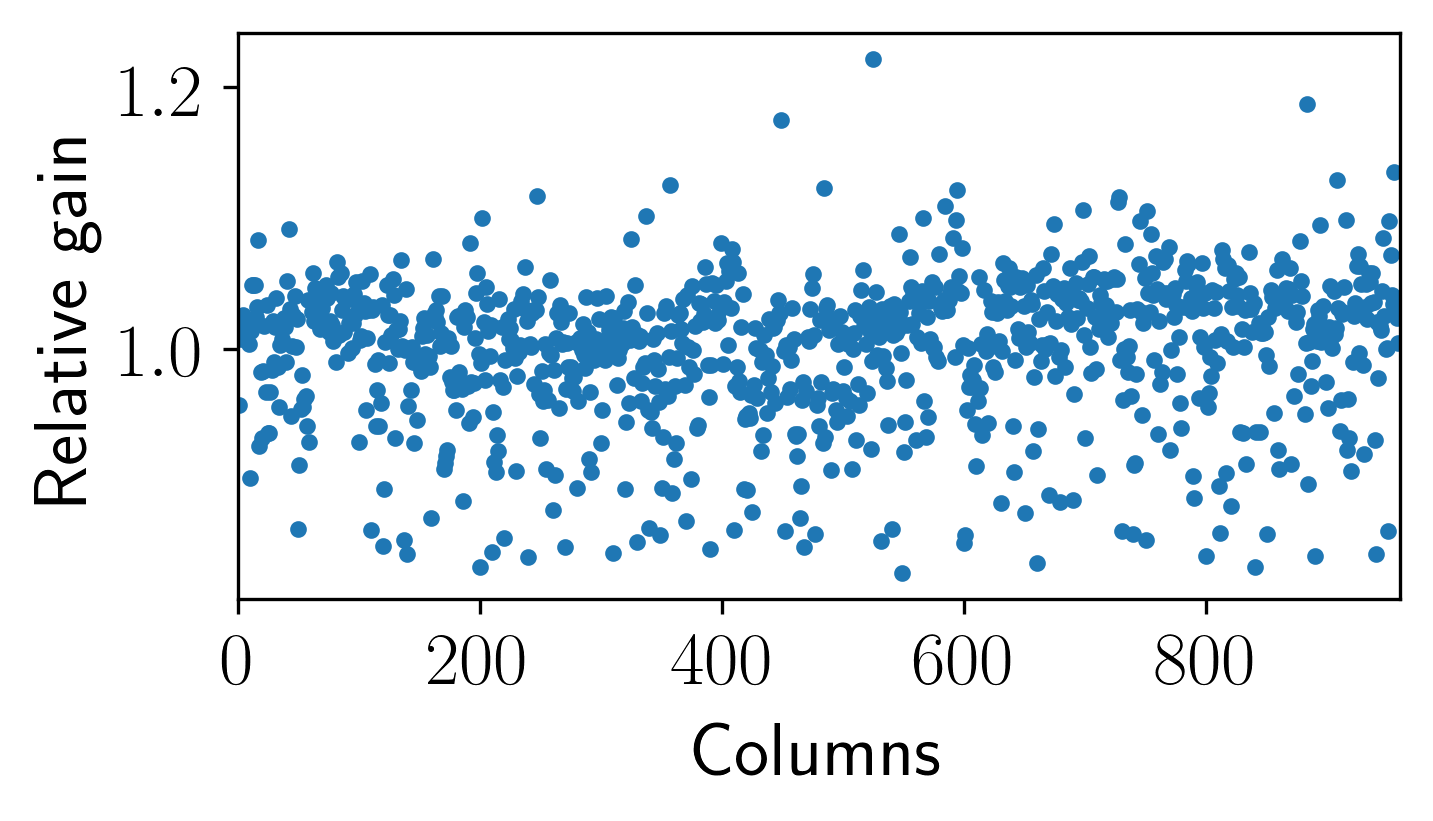
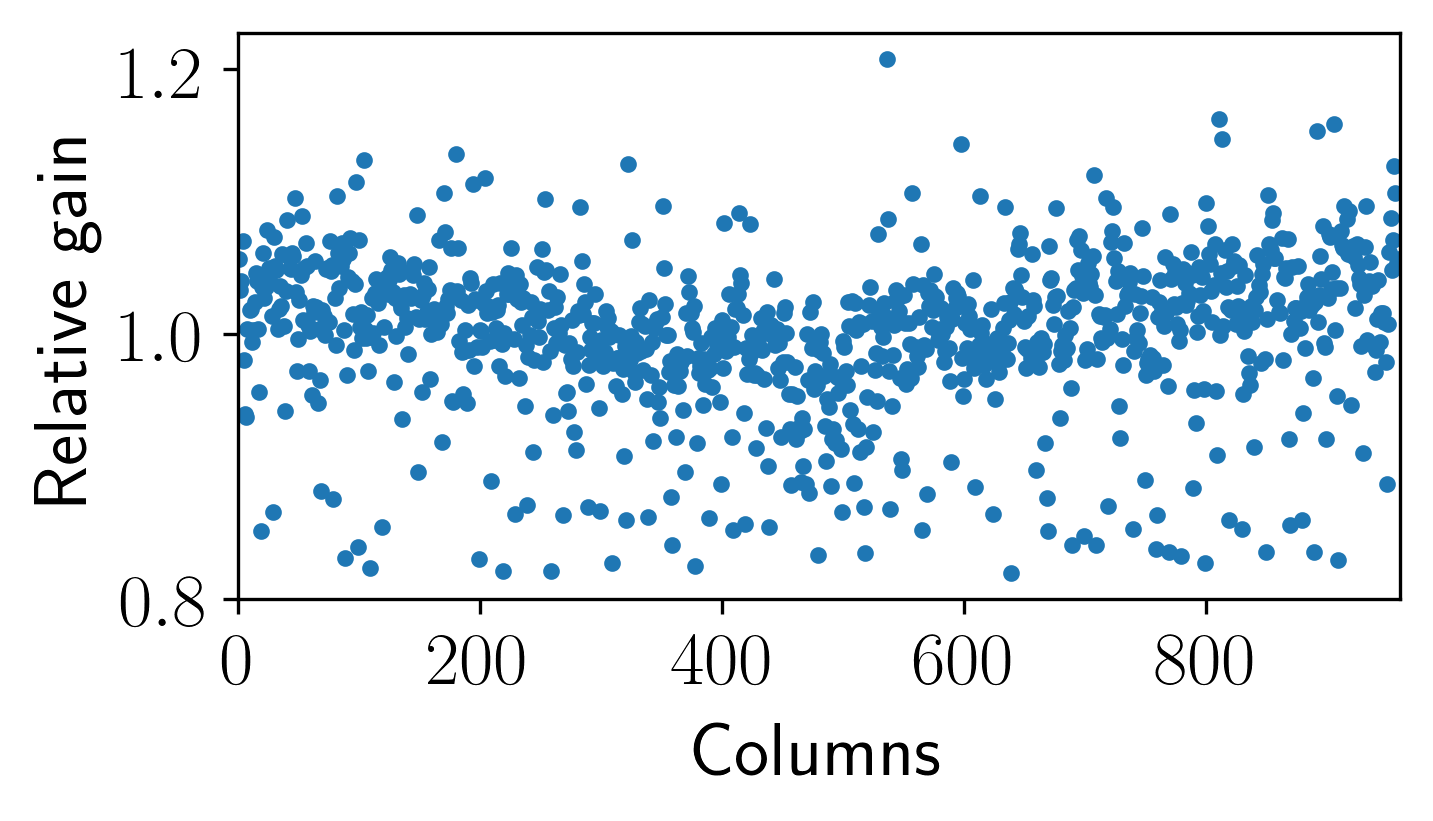
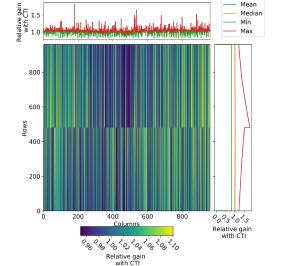
Figure 4 shows column-wise relative gain with a variation of 4.6% for the LH (top plot) and 4.9% for the UH (bottom plot). The combination of CTI and relative gain effects of the FastCCD can be seen in the left plot of Figure 5, where the contribution of CTI and relative gain was calculated for each pixel according to its distance from the readout amplifier and thus the number of shifts.
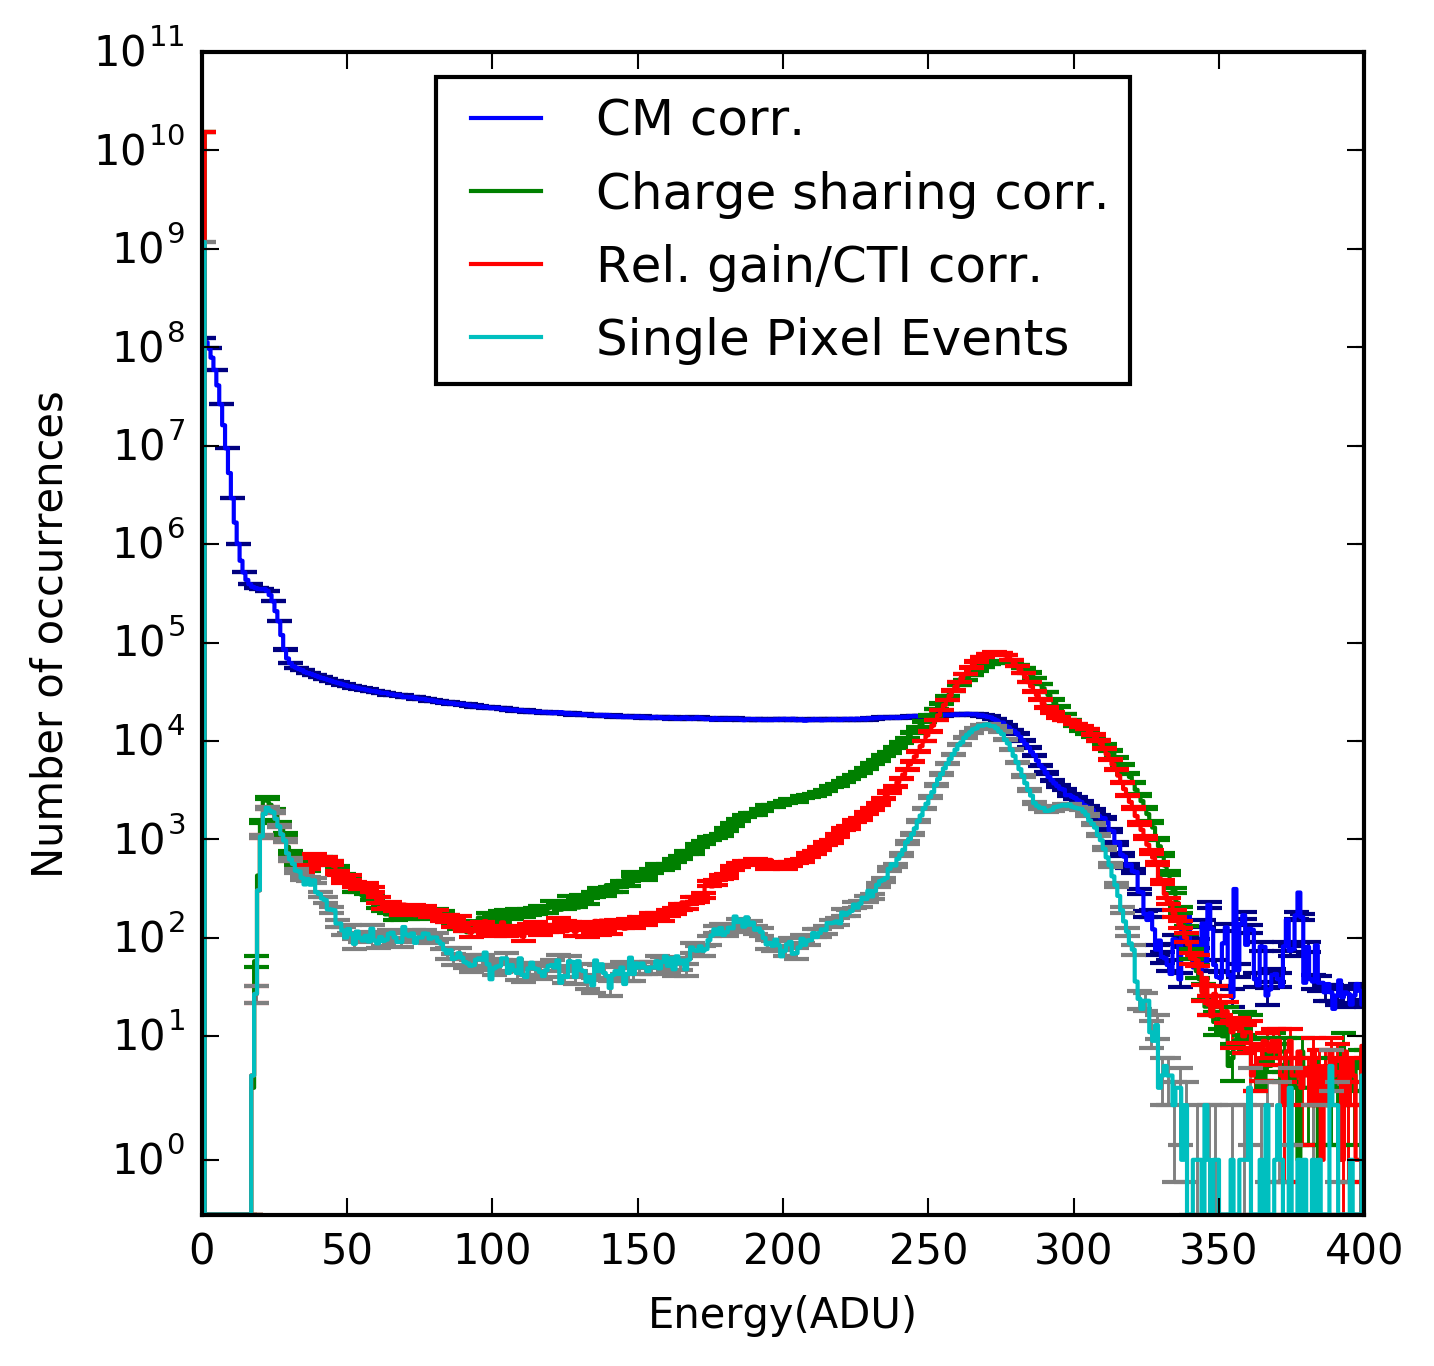
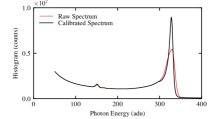
Due to the small pixel size of the FastCCD and ePix detectors, the majority of charge is split across neighbouring pixels during the charge collection process, affecting e.g. the energy resolution of the device if this effect is not taken into account. By summing up the contribution of all pixels the initial charge is distributed to, this effect can be corrected for. As can be seen from the right plot of Figure 5 and the left plot of Figure 6 the resulting energy resolution improves significantly from 571 eV to 426 eV after correction (FWHM, Mn-Kα peak), leading to a peak separation of 5.6 at 1 keV deduced by extrapolation of the values corresponding to Mn Kα and Mn Kβ. Performing the energy calibration, the resulting 55Fe spectra can be transformed to energy units as is shown in Figure 6 (right). The detector performance as reported meets the requirements set by the scientific instrument SCS.

3.2 ePix100a Evaluation
The ePix100a is an active pixel detector (with sensitive area of 704768 pixels), from a design-perspective the CCD-specific algorithms for gain evaluation (CTI + per-column relative gain) are thus not applicable. Rather a per-pixel evaluation, as described in [17] is the appropriate approach. However, the gain map deduced in the reference shows structuring which might be reproduced by combining a CTI-like effect with a per-column gain. As these algorithms were readily available from the FastCCD characterization, an evaluation using these techniques was attempted; the per-pixel approach is considered as a reference.
Figure 7 shows the resulting dark maps of the ePix100a measured at a temperature of 10C with 50s integration time. A strip pattern can be observed in the offset map, due to the readout structure of the camera. The four tile per ASIC like structure visible in the offset map originates in multiplexing columns to four banks. The resulting RMS noise of the ePix100a was found to be (40.57.2, which is within the specifications defined by scientific instruments HED and MID.
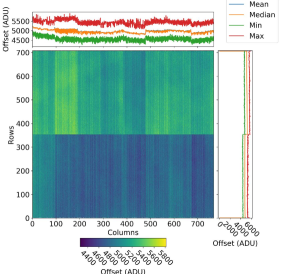
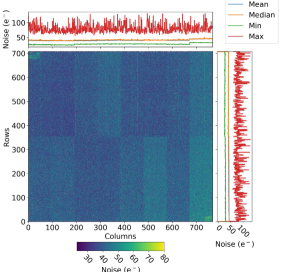
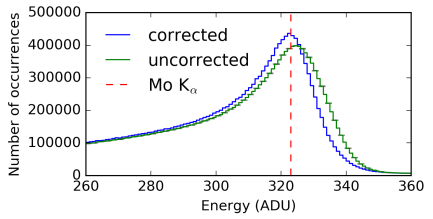
Figure 8 shows a Mo-Kα spectrum corrected for per-column gain variations (left plot), and one corrected using the reference per-pixel correction from [17]. Using per-pixel gain corrections an energy resolution of 590 eV was obtained: a improvement. Using the phenomenologically motivated CCD-like corrections, the energy resolution could be improved by about 30%, to 760 eV (FWHM). For an 55Fe source an energy resolution of 450 eV (FWHM) at 5.9 keV was determined using per-pixel corrections [8]. So far, 55Fe data taken at EuXFEL has only used an uncooled detector and thus no readily comparable values exist. Note that the energy resolution for a synchronous source, such as a FEL, is expected to improve further, as events outside the detector integration window are avoided.
4 Conclusions
Our results show, that the performance of the FastCCD and ePix100a detectors is within the required specifications; for ePix100a even without gain corrections. For the FastCCD proper gain correction improves the energy resolution by 25%, or to 426 eV at 5.9 keV. The corrections are necessary to reach ¿5 peak separation at 1 keV.
Applying a CCD-like characterization to the active pixel ePix100a detector shows that improvements in energy resolution are possible, as its per-pixel gain characteristics can phenomenologically be approximated by combining CTI-like and per-column relative gain effects. However, the detector design-driven per-pixel approach presented in [17] outperforms the phenomenologically driven approach by in terms of obtainable energy resolution, with low requirements on photon counts. Hence, we plan on integrating the low-pixel-statistics gain evaluation of [17] into EuXFEL calibration tool-chain.
We would like to acknowledge the support of U. Bösenberg and A. Parenti in detector integration at the European XFEL. This work was supported in part by the Department of Energy contract DE-AC02-76SF00515.
References
- [1] M. Altarelli. The European X-ray Free-Electron Laser Facility in Hamburg. Nuclear Instruments and Methods in Physics Research Section B: Beam Interactions with Materials and Atoms, 269, 2011.
- [2] T. Tschentscher et al. Photon Beam Transport and Scientific Instruments at the European XFEL. Applied Sciences, 7, 2017.
- [3] H. Graafsma. Requirements for and Development of 2 Dimensional X-ray Detectors for the European X-ray Free Electron Laser in Hamburg. Journal of Instrumentation, 4, 2009.
- [4] A. Allahgholi et al. AGIPD, a High Dynamic Range Fast Detector for the European XFEL. Journal of Instrumentation, 10, 2015.
- [5] M. Porro et al. Development of the DEPFET Sensor with Signal Compression: A Large Format X-ray Imager with Mega-Frame Readout Capability for the European XFEL. IEEE Transactions on Nuclear Science, 59, 2012.
- [6] B. Markovic et al. Design and Characterization of the epix100a: A Low Noise Integrating Pixel ASIC for LCLS Detectors. In Nuclear Science Symposium and Medical Imaging Conference (NSS/MIC), 2014 IEEE. IEEE, 2014.
- [7] G. Blaj et al. X-ray Imaging with epix100a: a High-Speed, High-Resolution, Low-Noise Camera. In Hard X-Ray, Gamma-Ray, and Neutron Detector Physics XVIII, volume 9968. International Society for Optics and Photonics, 2016.
- [8] G. Blaj et al. Performance of ePix10K, a High Dynamic Range, Gain Auto-Ranging Pixel Detector for FELs. In AIP Conference Proceedings. AIP, 2018. in print.
- [9] P. Denes et al. A Fast, Direct X-Ray Detection Charge-Coupled Device. Review of Scientific Instruments, 80, 2009.
- [10] F. Januschek et al. Performance of the LBNL FastCCD for the European XFEL. In Nuclear Science Symposium, Medical Imaging Conference and Room-Temperature Semiconductor Detector Workshop (NSS/MIC/RTSD), 2016. IEEE, 2016.
- [11] JH. Jungmann-Smith et al. JUNGFRAU 0.2: Prototype Characterization of a Gain-Switching, High Dynamic Range Imaging System for Photon Science at SwissFEL and Synchrotrons. Journal of Instrumentation, 9, 2014.
- [12] M. Hart et al. Development of the LPD, a High Dynamic Range Pixel Detector for the European XFEL. In Nuclear Science Symposium and Medical Imaging Conference (NSS/MIC), 2012 IEEE. IEEE, 2012.
- [13] L. Strüder et al. The European Photon Imaging Camera on XMM-Newton: The pn-CCD camera. Astronomy & Astrophysics, 365, 2001.
- [14] M. Kuster et al. Detectors and Calibration Concept for the European XFEL. Synchrotron radiation news, 27(4), 2014.
- [15] The European XFEL Detector Group. European XFEL Offline Calibration. \urlhttps://in.xfel.eu/readthedocs/docs/european-xfel-offline-calibration/en/latest/.
- [16] The European XFEL Detector Group. X-ray Detectors at the European XFEL. \urlhttps://in.xfel.eu/readthedocs/docs/detector-documentation/en/latest/.
- [17] G. Blaj et al. Robust Pixel Gain Calibration with Limited Statistics. In Nuclear Science Symposium and Medical Imaging Conference (NSS/MIC), 2017 IEEE. IEEE, 2017. in print.