Continuum extrapolation of the critical endpoint in 4-flavor QCD with Wilson-Clover fermions
Abstract:
We report our study on the critical endpoint of the finite temperature phase transition in 4-flavor QCD with Wilson-Clover fermions. Using the kurtosis intersection method, we determined the critical endpoint on lattices with = 4, 6 and 8. Our continuum extrapolated results show that the pseudo-scalar meson mass at the critical endpoint, , for 4-flavor is clearly larger than that for 3-flavor. We also compared our results to those with staggered fermions and found that for 4-flavor with Wilson fermions might remain finite even in the continuum limit in contrast to that with staggered fermions, where is very close to zero, which suggests that the difference between Wilson and staggered fermions is at least not due to the rooting.
1 Introduction
Understanding the nature of finite temperature phase transition is an important subject in Quantum chromodynamics (QCD). It is known that the order of the phase transition depends on the quark mass as well as the number of quark flavors [1]. Especially in the case of three degenerate massless flavors, the phase transition is expected to be of first order. It is also expected that for a certain large there is no longer any phase transition but an analytic crossover. Therefore, as increasing from zero, one should find a second order phase transition point or a so-called critical endpoint which separates regions of the first order phase transition and the crossover.
However, to pin down the critical endpoint of QCD is a longstanding issue in the lattice QCD community. Previous studies with staggered-type quarks [2, 3, 4, 5, 6] have shown that the critical pion mass, a pion mass at the critical endpoint, gets smaller as using more improved fermion actions and smaller lattice spacings, which suggests that the critical pion mass in the continuum limit is quite small or consistent with zero. A similar tendency has been also reported with Wilson-type quarks [7, 8, 9] but the critical pion mass is always much larger than that for the staggered ones at any lattice spacing and even in the continuum limit. Therefore, following two questions are naturally raised: one is whether the critical pion mass can be really so small as given with the staggered-type quarks and the other is why the critical pion mass for the two different types of quarks are so different.
To answer these questions, in this study, we consider QCD as a good analogue of because of following three reasons. First, a first order phase transition is expected in the massless limit also in [1]. Second, the critical pion mass can be larger in than in based on a naive counting of the degrees of freedom, which means that one needs less computing cost for carrying out a proper continuum extrapolation in than in . Finally, staggered-type quarks are naturally defined in in contrast to , where the rooted fermion determinant, which is a non-trivial operation, is needed to represent three degenerate flavors. Therefore, no concern of the rooting allows better comparison between staggered- and Wilson-type quarks. Since a study in this context with the naive staggered quarks has already been reported in [10], our aim is to find a critical endpoint in with Wilson-type quarks and compare our results with those of [10].
2 Simulation setup
We employ the Iwasaki gauge and the Wilson-Clover fermion actions, where the clover coefficient is non-perturbatively determined in the same way as given in a previous study for 0, 2 and 3 [11]. Our simulations are performed on lattices with three different lattice spacings corresponding to temporal extents = 4, 6 and 8 in order to take the continuum limit. We compute the chiral condensate and its cumulants up to the 4th order, i.e. susceptibility, skewness and kurtosis, by using 10 random sources for each configurations. For each we repeat the calculations at several hopping parameters and 2-3 lattice gauge couplings covering the critical endpoint. To improve statistics we also adopt the -reweighting given in [12]. Then, we determine the critical endpoint with the kurtosis intersection method [2], where we check the finite-size scaling with three different spatial volumes . BQCD code [13] is used for our simulations.
3 Results
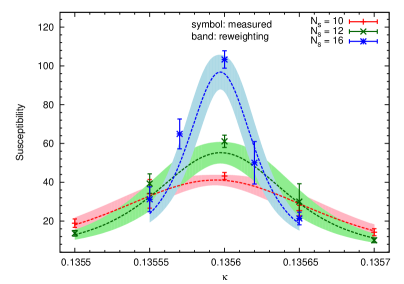
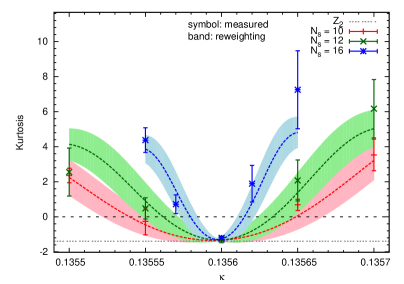
First, an example of the susceptibility and the kurtosis of the chiral condensate is given in Fig. 1, where results at = 1.68 for = 6 are shown. It is shown that the reweighting works well and accordingly, clear extrema of the susceptibility and the kurtosis can be seen.
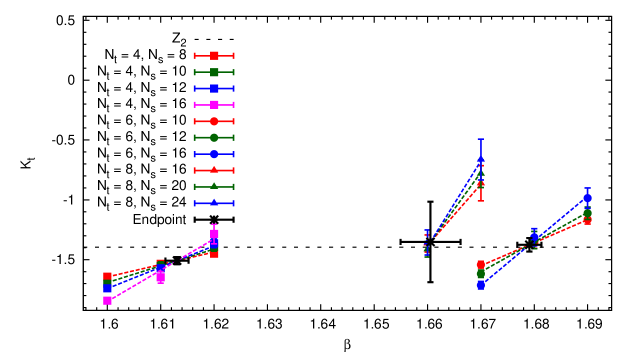
Then, Fig. 2 shows results for the kurtosis intersection method, where kurtosis values at phase transition/crossover points for each are fitted to an ansatz
| (1) |
with /d.o.f. ¡ 0.42, where is a value at the critical endpoint. One can see that there are well-defined intersections indicating the critical endpoints for each and kurtosis values at these points are consistent with one for the Z(2) universality class, -1.396, except for . Note that we do not assume the Z(2) universality for the fits, i.e. both and in Eq. (1) are free parameters. The critical exponent = 0.7(1) and 0.7(2) for = 4 and 6, respectively, are also close to 0.630 of the Z(2) universality class while more statistics are needed for = 8.
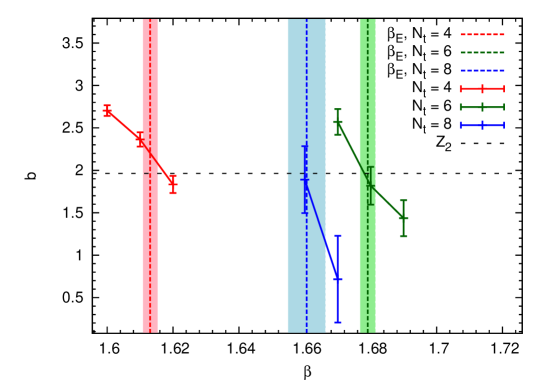
To further check the universality we also fit the susceptibility peak to an ansatz
| (2) |
where we get /d.o.f. ¡ 0.63. Results of the critical exponent are shown in Fig. 3. It can be seen that at the critical endpoint is consistent with one for the Z(2) universality class, 1.964, for = 6 and 8 while the inconsistency with the Z(2) universality class is observed again for . This might be due to cutoff effects since we check that our largest volume, 163, does not influence the location of the critical endpoint within statistical uncertainty, which means that there should not be any visible finite-size effects.
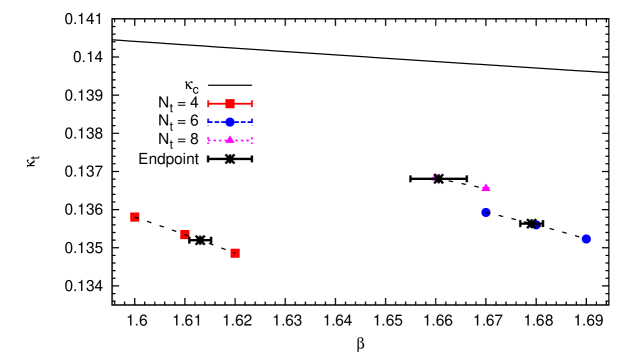
Once is given, we determine a value at the critical endpoint by interpolating values at the transition/crossover points for each using a quadratic function for = 4 and 6 and a linear function for = 8, where linearly infinite-volume-extrapolated values are used. The critical endpoints in the (, )-plain are shown in Fig. 4, where we find that locations of the critical endpoints have a non-monotonic behavior as increasing .
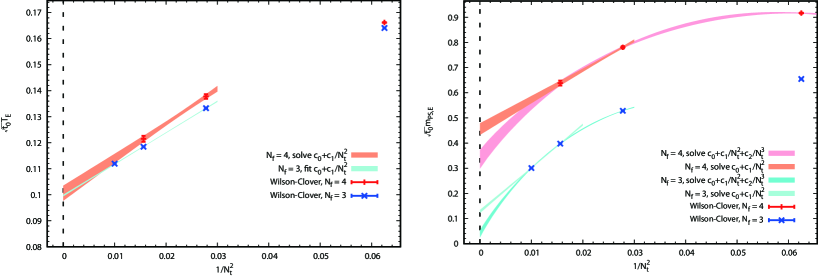
Finally, we convert (, ) into physical quantities, i.e. temperature and the pseudo-scalar meson mass at the critical endpoint, (, ), where the physical scale is determined by the scale given by the gradient flow method [14] at zero temperature. Fig. 5 summarizes cutoff dependence of and , where = 3 results with the Wilson-Clover fremions from [9] are also shown. We carry out continuum extrapolations by using polynomials of with up to a cubic term as shown in Fig 5. The left panel shows that the continuum extrapolation of is smoothly performed and its value in the continuum limit for = 4 is consistent with that for = 3 within the statistical error. On the other hand, it can be found from the right panel that the continuum extrapolations of for = 4 highly depend on the functional forms used, which indicates that some of our data, especially for = 4, could be out of the scaling region. Therefore, simulations on finer lattices are needed for taking the continuum limit more reliably. However, what can be clearly seen here is that for = 4 is always larger than that for = 3 at any and even in the continuum limit.
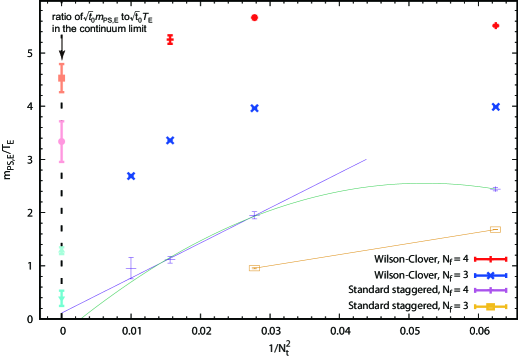
In Fig. 6 results of for = 3 and 4 with Wison-Clover and standard staggered fermions [4, 10] are compared, where the continuum extrapolated values for Wilson-Clover fermions are estimated from the ratio of to in the continuum limit since the continuum extrapolations cannot be carried out smoothly due to strong cutoff dependence. With this it is found that the Wilson-Clover results are much larger than the standard staggered ones for both = 3 and 4. Furthermore, the = 4 result seems to remain finite in the continuum limit so far in contrast to the staggered case, where is very close to zero.
4 Conclusions
We studied finite temperature phase transitions of = 4 QCD with the non-perturbatively improved Wilson-Clover fermions. We determined critical endpoints on lattices with = 4, 6 and 8 by applying the kurtosis intersection method for the chiral condensate. The kurtosis value and a critical exponent for the finite-size scaling of the susceptibility peak at the critical endpoint suggest that the second order phase transition belongs to the Z(2) universality class. We carried out continuum extrapolations of temperature and the pseudo-scalar meson mass at the critical endpoint and found that temperature at the critical endpoint for = 3 and 4 are consistent with each other within statistical uncertainties. Moreover, we showed that the pseudo-scalar meson mass at the critical endpoint for = 4 is larger than that for = 3. We also compared results with Wilson-Clover and standard staggered fermions and found that a ratio of the pseudo-scalar meson mass to temperature at the critical endpoint for = 4 with Wilson-Clover fermions might remain finite even in the continuum limit while that with standard staggered fermions is very close to zero. Since there is no concern about the rooting for staggered ferminons for = 4, the difference between Wilson and staggered fermions is at least not due to the rooting.
As we still have strong scaling violation of the pseudo-scalar meson mass at the critical endpoint in our continuum extrapolation, taking a more reliable continuum limit is needed to obtain a concrete conclusion. Therefore, simulations on finer lattices are our future plan.
Acknowledgments.
Our numerical calculations were done on computational resources of HA-PACS, COMA and Oakforest-PACS provided by Interdisciplinary Computational Science Program in Center for Computational Sciences at University of Tsukuba and HOKUSAI GreatWave (project ID:G17031 and G18018) at RIKEN.References
- [1] R. D. Pisarski and F. Wilczek, Phys. Rev. D 29, 338 (1984). doi:10.1103/PhysRevD.29.338
- [2] F. Karsch, E. Laermann and C. Schmidt, Phys. Lett. B 520, 41 (2001) doi:10.1016/S0370-2693(01)01114-5 [hep-lat/0107020].
- [3] F. Karsch, C. R. Allton, S. Ejiri, S. J. Hands, O. Kaczmarek, E. Laermann and C. Schmidt, Nucl. Phys. Proc. Suppl. 129, 614 (2004) doi:10.1016/S0920-5632(03)02659-8 [hep-lat/0309116].
- [4] P. de Forcrand, S. Kim and O. Philipsen, PoS LATTICE 2007, 178 (2007) [arXiv:0711.0262 [hep-lat]].
- [5] L. Varnhorst, PoS LATTICE 2014, 193 (2015). doi:10.22323/1.214.0193
- [6] A. Bazavov, H.-T. Ding, P. Hegde, F. Karsch, E. Laermann, S. Mukherjee, P. Petreczky and C. Schmidt, Phys. Rev. D 95, no. 7, 074505 (2017) doi:10.1103/PhysRevD.95.074505 [arXiv:1701.03548 [hep-lat]].
- [7] Y. Iwasaki, K. Kanaya, S. Kaya, S. Sakai and T. Yoshie, Phys. Rev. D 54, 7010 (1996) doi:10.1103/PhysRevD.54.7010 [hep-lat/9605030].
- [8] X. Y. Jin, Y. Kuramashi, Y. Nakamura, S. Takeda and A. Ukawa, Phys. Rev. D 91, no. 1, 014508 (2015) doi:10.1103/PhysRevD.91.014508 [arXiv:1411.7461 [hep-lat]].
- [9] X. Y. Jin, Y. Kuramashi, Y. Nakamura, S. Takeda and A. Ukawa, Phys. Rev. D 96, no. 3, 034523 (2017) doi:10.1103/PhysRevD.96.034523 [arXiv:1706.01178 [hep-lat]].
- [10] P. de Forcrand and M. D’Elia, PoS LATTICE 2016, 081 (2017) doi:10.22323/1.256.0081 [arXiv:1702.00330 [hep-lat]].
- [11] S. Aoki et al. [CP-PACS and JLQCD Collaborations], Phys. Rev. D 73, 034501 (2006) doi:10.1103/PhysRevD.73.034501 [hep-lat/0508031].
- [12] Y. Kuramashi, Y. Nakamura, S. Takeda and A. Ukawa, Phys. Rev. D 94, no. 11, 114507 (2016) doi:10.1103/PhysRevD.94.114507 [arXiv:1605.04659 [hep-lat]].
- [13] Y. Nakamura and H. Stuben, PoS LATTICE 2010, 040 (2010) doi:10.22323/1.105.0040 [arXiv:1011.0199 [hep-lat]].
- [14] M. Lüscher, JHEP 1008, 071 (2010) Erratum: [JHEP 1403, 092 (2014)] doi:10.1007/JHEP08(2010)071, 10.1007/JHEP03(2014)092 [arXiv:1006.4518 [hep-lat]].