Infrared Echo and late-stage rebrightening of nuclear transient PS1-10adi: Exploring Torus by tidal disruption event in active galactic nuclei
Abstract
Tidal disruption events (TDEs) in active galactic nuclei (AGNs) have been overlooked for a long time but tentatively been investigated recently. We report the discovery of a long-lasting luminous mid-infrared (mid-IR) flare in PS1-10adi, which is a newly-identified highly energetic transient event occurred in AGN. The IR luminosity of PS1-10adi, as well as other analogous events, are at least one order of magnitude higher than all known supernova, but can be well interpreted as the dust echoes of TDEs, whose ultra-high IR energy is reprocessed from the dusty torus around the black hole. The torus dust is sublimating during the early stage of the outburst and probably lead to the observed rapid emergence of Fe II lines. Moreover, the UV-optical rebrightening and contemporaneous X-ray onset after rest-frame days since the optical peak is also an intriguing feature of PS1-10adi, which could be attributed to the interaction between the high-velocity outflow and torus. We suggest that the luminous IR echo is a very typical phenomenon of TDEs in AGNs and may provide us an ideal opportunity to explore the torus properties.
Subject headings:
galaxies: individual (PS1-10adi) — galaxies: active — galaxies: nuclei — infrared:galaxies1. Introduction
The stellar or gas kinematics on nearby galaxies in the past two decades have established that supermassive black holes (SMBHs), with masses of , are universal in the centers of galaxies with massive bulges. Furthermore, the tight correlations between the BH mass () and various bulge properties indicate an attractive co-evolutionary growth of SMBHs and their host galaxies (see reviews by Kormendy & Ho 2013 and Heckman & Best 2014). The widespread picture is not unquestionable but still competed by some alternative views which claim that their relation can emerge as the result of a statistical convergence process without a physical coupling (e.g., Peng 2007; Jahnke & Macciò 2011) or the dark matter might be influential (e.g., Ostriker 2000; Zhao et al. 2002; Bogdán & Goulding 2015). Whatever, SMBHs are normally believed to accumulate their mass through the phase of active galactic nuclei (AGN), during which the BHs are efficiently accreting surrounding materials. AGNs themselves are also the best evidence of the existence of SMBHs in distant galaxies, which are otherwise beyond the current capabilities for direct dynamical measurement.
Nevertheless, the detection of SMBHs in normal galaxies are still very difficult provided that vast majority of them are quiescent and faraway. Although some new approaches seem promising to detect SMBHs at cosmological distances, such as gravitational lensing (e.g., Mao et al. 2001; Hezaveh et al. 2015; Chen et al. 2018) and future gravitational wave observations of SMBH mergers or the inspiral of compact stellar remnants consumed by SMBH, they are not so efficient and practical for the time being. Heaven will always leave a door open, the so-called tidal disruption event (TDE) could offer us the greatest chance to catch sight of these dormant SMBHs. The TDE happens if a star in the galaxy wanders too close to the central black hole, the star can be ripped apart when the tidal force exceeds its self-gravity and roughly half mass of the star will be accreted on to the black hole while the remaining half may be ejected by the simple classical theory (Rees 1988). Recent works reveal that the real accreting fraction could be much lower since most of the mass may join in an outflow (e.g., Metzger & Stone 2016). A luminous flare of electromagnetic radiation is expected during this process with emission peaks in the UV or soft X-rays and a characteristic decline on timescale of months to years (Rees 1988; Phinney 1989). The TDE event rate is estimated to be to and might be highest in nucleated dwarf galaxies (Wang & Merritt 2004, Stone & Metzger 2016).
Observationally, TDEs are though first discovered in X-ray bands serendipitously, the field has not experienced explosive growth until the past decade, benefited from a batch of dedicated optical time-domain surveys (see Komossa 2015 as a review). To avoid any potential contaminations stemmed from variability of AGN, traditional searching of TDEs care about solely normal galaxies and neglected active galaxies (e.g., van Velzen et al. 2011). However, TDEs might also occur in AGNs and the rates are expected to be even high (Karas & Šubr 2007), not to mention that TDEs ware actually first proposed out as a possible power source of AGNs and quasars (Hills 1975). Recently, Blanchard et al. 2017 have claimed a TDE candidate PS16dtm found in the Panoramic Survey Telescope and Rapid Response System (Pan-STARRS). This event occurs in a Seyfert 1 galaxy with , and display some distinctive features, such as a plateau phase, disappeared prior X-ray emission and newly-emerging strong Fe II emission. Soon thereafter, Kankare et al. (2017, hereafter K17) have reported the other high energetic Pan-STARRS transient event named PS1-10adi with a total radiated energy of erg. The rapid smooth brightening light curve and persistently narrow spectral lines over 3 yr of PS1-10adi is inconsistent with known types of recurring BH variability, yet may be linked to a TDE or supernova (SNe) in the nuclear region powered by shock interaction between expanding material and large quantities of surrounding dense matter. K17 have even unveiled possibly a population of such kind of events in the centers of active galaxies yet to be further explored.
Encouraged by our successful detection of a mid-infrared (mid-IR) flare in PS16dtm and valuable implications learned from it (Jiang et al. 2017), we have also checked the mid-IR variability of PS1-10adi and discovered a long-lasting flare not surprisingly in the location coincident with PS1-10adi using data from the Wide-field Infrared Survey Explorer (WISE; Wright et al. 2010; Mainzer et al. 2014). In addition, we have noticed an odd late-stage rebrightening in the UV-optical light curve as well as a corresponding mid-IR signal. The mid-IR emission in radio-quiet AGNs is generally thought to be associated with thermal emission from dust at parsec-scale distances from the central SMBH. On the other hand, an optically thick obscuring medium in the equatorial plane (commonly dubbed the ”torus”) is needed in the unified model, the current paradigm suggests that the IR-emitting dust is the same medium as the obscuring material. This is reflected by the widespread use of torus models in order to reproduce IR spectral energy distributions (SEDs, see a recent review on torus in Netzer 2015. Basing on the fact of a pre-existing dusty torus, mid-IR echoes are predictable for those TDEs in active galaxies, which would expose the torus itself dynamically. The ubiquitous luminous IR echoes associated with TDEs in AGNs may be one of the most notable characteristics distinguished from SNe (see §5).
In this paper, we will try to analyze all of these new recognized phenomenons in PS1-10adi and understand them under the context of TDEs in AGNs. We assume a cosmology with km s-1 Mpc-1, , and . At a redshift of , PS1-10adi has a luminosity distance of 996.5 Mpc.
2. Mid-IR Light Curves
The WISE has performed a full-sky imaging survey in four broad mid-IR bandpass filters centered at 3.4, 4.6, 12 and 22 m (labeled W1-W4) from 2010 February to August. The solid hydrogen cryogen used to cool the W3 and W4 instrumentation was depleted later and it was placed in hibernation in 2011 February. WISE was reactivated and renamed NEOWISE-R since 2013 October, using only W1 and W2, to hunt for asteroids that could pose as impact hazard to the Earth. WISE has scanned a specific sky area every half year and thus yielded 10-11 times of observations for every object up to now. For each epoch, there are 10-20 single exposures. We use only the best quality single frame images by selecting only detections with data quality flag ’qual_frame’¿0.
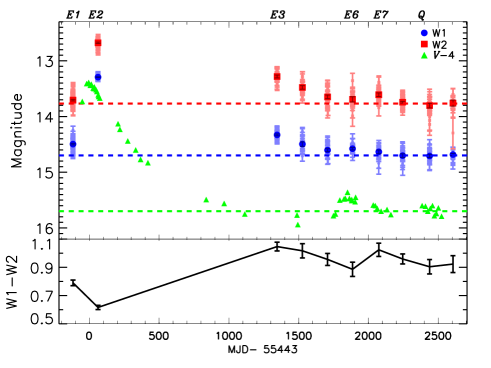
PS1-10adi is a point-like source in WISE images without any potential contamination within 10″. We have collected all of its public WISE photometric data, including from ALLWISE and NEOWISE-R catalogs. The data are distributed in 10 epochs at intervals of about six months from 2010 May 9 (MJD=55,325) up to 2017 Oct 22 (MJD=58,048). The light curves in W1 and W2 are presented in Figure 1. For ease of comparison, its optical light curve (-band) has also been overplotted. First, no reliable variability is detected within each epoch and thus we then average these data to obtain a mean value at each epoch following our previous works (Jiang et al. 2012; 2016). We noticed that the first WISE epoch (”E1”) is 98 days earlier and the second epoch (”E2”) is 82 days after the optical discovery date, or -117 (rest-frame -97) days and 63 (52) days since the optical peak. PS1-10adi has began brightened by mag in W1 and W2 at E2 relative to E1. Unfortunately the WISE went into hibernation soon and hasn’t yielded the third observation until 2014 May, resulting in a gap of days between E2 and E3. The light curve presents a declining trend at E3 and thereafter and keeps at a constant level in the near past. In order to isolate the host galaxy and AGN emission (or background emission as a whole) from the outburst phase, We take the last three epochs as the quiescent state, which contributes an averaged magnitude of and at W1 and W2, respectively. The original and background-subtracted magnitudes are shown in Table 1. It’s interesting to note that PS1-10adi is already brighter at E1, by and magnitudes in W1 and W2, respectively. The W1-W2 color has generally been used as a rough assessment of the AGN or stellar dominance of a galaxy, for instance, W1-W2¿0.8 for AGN-like or W1-W2¡0.5 for galaxy-like (Stern et al. 2012; Yan et al. 2013). The W1-W2 at E1 is , significantly lower than at the last three epochs (see bottom panel of Figure 1), indicating likely that it is experiencing an extra high energy input in addition to AGN at E1. Therefore, we think that the flux excess at E1 is not simply due to AGN variability.
K17 has presented UV-optical-IR light curves of PS1-10adi up to days since the peak (see their Supplementary Figure 1). When we look through them carefully, it’s worthwhile to find that there’s a tiny yet notable hump at MJD. For ease of convenience, we call the first major flare as the ”primary outburst” and the second peak as ”rebrightening”. Interestingly, the rebrightening looks also occurs subsequently in W1 and W2, in which the W2 lags behind W1 by about half year. The W1 and W2 magnitudes have brightened by ) and at E6, while by and at E7, respectively.
| Epoch | MJD | W1m | W2m | W1 | W2 | W1-W2 | log | log | log | |
|---|---|---|---|---|---|---|---|---|---|---|
| (1) | (2) | (3) | (4) | (5) | (6) | (7) | (8) | (9) | (10) | (11) |
| E1 | 55325 | -0.41 | 42.9 | 42.4 | .. | … | ||||
| E2 | 55505 | 0.47 | 44.1 | 43.9 | 1972 | 44.3 | ||||
| E3 | 56788 | 1.29 | 43.2 | 43.3 | 886 | 43.5 | ||||
| E4 | 56969 | 1.37 | 42.9 | 43.1 | 843 | 43.2 | ||||
| E5 | 57150 | 1.22 | 42.6 | 42.7 | 927 | 42.8 | ||||
| E6 | 57329 | 0.43 | 42.7 | 42.5 | 2114 | 43.0 | ||||
| E7 | 57517 | 1.98 | 42.4 | 42.8 | 620 | 43.1 | ||||
| Q | 57881 | … | … | 0.93 | … | … | … | … |
Note. — Column (1): observational epochs. Column (2): median modified Julian Date. Column (3)-(4): median W1 and W2 magnitudes. Column (5)-(6): background-subtracted W1 and W2 magnitudes. Column (7): background-subtracted W1-W2 color. Column (8)-(9): background-subtracted W1 and W2 monochromatic luminosity. Column (10): dust temperature inferred from W1-W2 color assuming blackbody radiation. Column (11): the logarithmic integrated dust blackbody luminosity.
3. Evaporation and Echo of Torus Dust
3.1. Infrared Echo of Torus Dust
The IR flares detected in TDEs thus far are all successfully translated into dust echoes (Jiang et al. 2106, 2017; Dou et al. 2016, 2017; van Velzen et al. 2016). The dust, if there, in the vicinity of SMBHs will certainly absorb the primary emission of TDEs (soft X-ray, UV and optical) and reprocess them into IR, so we expect the flare in the IR would lag behind the optical (Lu et al. 2016). However, in some cases, the mid-IR variability could be detectable even earlier than the optical band and thus the echo interpretation is not so obvious. For example, we recently found a mid-IR flare that started days before the optical detection of a TDE candidate PS16dtm (Jiang et al. 2016). Interpreting the mid-IR flare as a dust echo requires close pre-existing dust with a high covering factor, which is fully qualified with the geometrically and optically thick torus in AGNs. The case in PS1-10adi looks even more extreme, in which the mid-IR brightening is detectable 118 (or rest-frame 98) days earlier than the optical discovery. Can it be explained by the scenario of PS16dtm as well?
The AGN property before the outburst is unfortunately missing due to lack of observations, yet can be supposed to be almost the same as the post-flare state. For the sake of an estimate, we have fitted the optical spectra at +1600 days (see Supplementary Figure 2 of K17) and obtained that the broad H luminosity () is erg s-1 with a full width at half maximum (FWHM) of 3,676 . By virtue of the empirical relation of in AGNs estimated from the luminosity and FWHM of broad H line (Greene & Ho 2005), the is . Using the bolometric correction given by Greene & Ho 2007, the bolometric luminosity () is erg s-1. The peak background-subtracted associated with the flare inferred from the UV-optical emission is erg s-1 (see Figure 2), thus the total peak is erg s-1 provided that all of the radiation is originated from the BH accretion.
In order to assess if the energy budget for the dust echo is reasonable, we have fitted the background-subtracted UV-optical-IR SEDs at different epochs using double-blackbody model, one for the original outburst emission dominating UV-optical band and the other for the reprocessed dust emission peaked in the IR (see an example in the top panel of Figure 3). We take the integrated luminosity of the blue component as the (see its evolution in Figure 2). Since there is no reliable detection of residual UV-optical emission at E1, a single blackbody is adopted and yields an ultra-high dust temperature of K. The value seems absolutely unreasonable probably because of a non-equilibrium condition, too simplified model and insensitivity to the slope of Rayleigh-Jeans tail for very high blackbody temperature. Therefore, we believe that the dust at E1 is sublimating in spite of the very uncertain dust temperature.
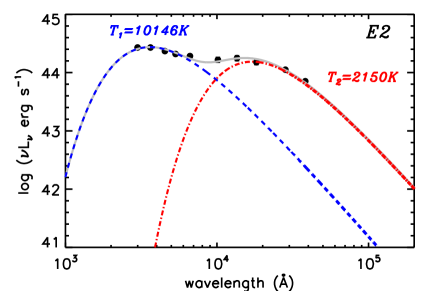
The double-blackbody fitting at E2 yields a dust temperature () of K, that is consistent with the dust sublimation temperature within error. Assuming that the equilibrium of a dust grain with radius at distance of from the heating source is determined by the balance between the radiative heating by UV-optical photons and the thermal re-emission in the IR:
| (1) |
The calculated is erg s-1 given a dust distance light days by the time lag to the optical peak. The value is slightly higher yet comparable to the observed peak () of erg s-1, providing valid evidence for the dust echo interpretation.
3.2. Evaporation of Torus Dust and the Fe II Emergence
The torus inner radius can be computed by the dust sublimation radius () below (here we used the formula given in Namekata & Umemura 2016):
| (2) |
The original torus inner radius is determined by the before the primary outburst, whose corresponding is pc, that is 66 light days. As the luminosity of PS1-10adi increases, the illuminated dust in the inner region evaporates gradually, pushing the inner side of dusty torus outward. The calculation at the optical peak yields a new of 0.10 pc ( light days), so the pre-existing dust located between 66 and 120 light days should have been evaporated.
The dust sublimation as a function of temperature can be estimated by
| (3) |
We adopt , , K, following Equation 7 of Lu et al. 2016, which are representative values for refractory grains (Guhathakurta & Draine 1989; Waxman & Draine 2000). The A is the total illuminated dust area, that is at E2 (), giving a dust sublimation rate . The precise mass of evaporated dust is difficult to acquire because of the poor sampling of the light curves. We hypothesize that the sublimation rate at E2 is an average value between -98 and +120 days (regions between the two orange dashed lines in Figure 2), the integrated evaporated dust is thus g, that is around 1 .
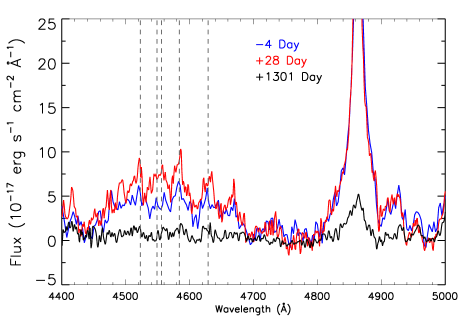
Similar to the story told in PS16dtm (Jiang et al. 2017), metals originally reserved in the evaporated dust will enter into the gas and may be ionized, giving rise to metal lines, such as Fe II multiplets observed in PS1-10adi (Figure 4, see also Supplementary Figure 2 in K17), making it resemble a classical narrow-line Seyfert 1 galaxy. If we believe that metals are mostly locked in the dust and the gas holds the solar metallicity, the gas mass should be higher than the dust mass by a factor of . Supposing that the gas is distributed in the spherical region (outer radius light days) with a covering factor of , the column density of the new broad-line region (BLR) can be calculated as below.
| (4) |
The derived is , in which we have adopted the (see §5.3). Both the gas mass and of new BLR here are comparable with typical AGNs (Peterson 1997; Netzer 2013), indicating that they are likely sufficient to produce the observed Fe II strength even if the physical mechanisms are still not very clear to date. It is worthwhile to note that the Fe II multiplets have almost vanished after the outburst (see its +1301 days spectrum in Figure 4), agreeing well with the photoionization model.
Many previous studies show that the photoionization can not fully address the Fe II emission of AGNs(Collin & Joly 2000; Sigut & Pradhan 2003; Baldwin et al. 2004) yet collisional excitation might also act (e.g., Joly 1981; Véron-Cetty et al. 2006). This could be feasible in TDEs because the unbound debris ejected from the disrupted star may cause shocks by interacting with the gas and excite the iron. One needs to illustrate whether the time of collision is early enough to result in the instant presence of Fe II. The maximum escaping velocity of the unbound debris in the case of one solar mass star disrupted by a BH, so the timescale of reaching the torus is yr given a of 66 light days. For the bound debris, although the circularization process is still not fully understood yet, several simulations show that the circularization timescale is in the range of several times to times the orbital period of the most bound debris (Bonnerot et al. 2016; Hayasaki et al. 2016). The period of the most bound debris can be estimated by in which is the lowest specific mechanical energy. The derived yr, meaning that the circularization timescale could be also as long as years yet with large uncertainties.
In brief, we surmise that the rapid emergence of prominent Fe II lines could be a universal characteristic of TDEs in AGNs, which will potentially promote us to understand the origin of Fe II emission in AGNs.
4. Late-Stage Rebrightening
4.1. Late Accretion?
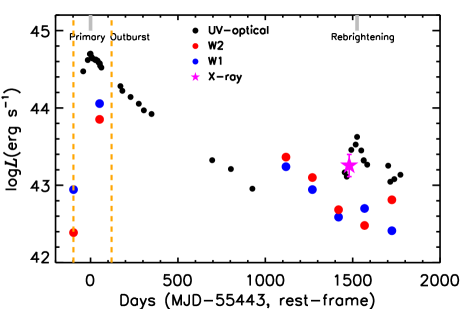
The rebrightening hump appeared in the UV-optical light curve is non-negligible while it has not been discussed in K17. As it happens, the similar hump is also present in the mid-IR light curve, with W1 band ahead of W2. Besides that, the X-ray emission has been first detected with a keV luminosity of erg s-1during the rebrightening (see Supplementary Table 4 of K17). Unfortunately, the photons are too few to constrain whether it’s dominated by soft X-rays or not.
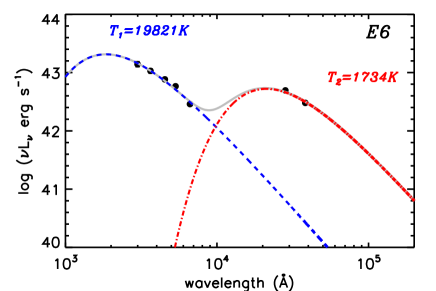
First, we attempt to naively understand the rebrightening as a late-stage accretion. The peak of the rebrightening is lower than the primary outburst by one order of magnitude, the time delay of dust emission relative to the rebrightening should be days as long as no dust newly formed. The fitted at E6 is K and then it has dropped quickly to K at E7. The mid-IR emission at E6 requires erg s-1 according to equation 1 , that is two orders of magnitude higher than the observed at days before E6. One way may resolve the conflict is that the blackbody assumption for dust emission could be over-simplistic and the dust absorption efficiency () should be taken into account. The value is quite uncertain: it approaches zero for very large grain (grey case); while for small grains, strongly depends on the composition, i.e. for graphite, for silicate, and for SiC. If we adopt (see formula 8.16 in Kruegel 2003):
| (5) |
we get , calling for of erg s-1 for dust with MRN size distribution (Mathis et al. 1977), that is still comparable with the observation. However, it is hard to imagine that the dust properties responsible for E2 and E6 are so different. The other negative evidence stems from the concomitant X-ray emission, which is strangely absent in the early accretion but not in the late accretion. Therefore, we conclude that the late-stage accretion scheme is very unlikely.
4.2. Rebrightening in Other TDEs
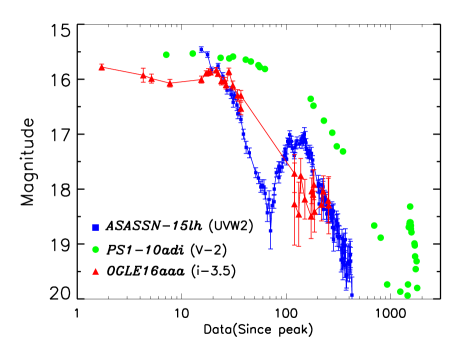
We have noticed that among reported TDEs, ASASSN-15lh and OGLE16aaa also show a rebrightening characteristic in their UV-optical light curves (see Figure 5). In fact, it’s exactly the giant double-humped feature that motivated reconsideration of the nature of ASASSN-15lh, which was first claimed to be an unprecedentedly luminous SNe in view of its spectral resemblance to hydrogen-poor super-luminous SNe (SLSNe) at early stage (Dong et al. 2016). Together with several other lines of evidence by further monitoring (e.g., temperature evolution), ASASSN-15lh can be better understood as a TDE occurred in a spinning BH with mass of (Leloudas et al. 2016; Krühler et al. 2018) rather than a SNe. Coincidentally, the X-ray emission hasn’t been detected in ASASSN-15lh either until the rebrightening, which is about 4 months after the primary peak (Margutti et al. 2017). Both the circulization (Guillochon & Ramirez-Ruiz 2015) and reprocessing (Metzger & Stone 2016) models have been suggested possible to address the intriguing UV-optical light curve (Leloudas et al. 2016). The rebrightening of OGLE16aaa is visible, yet much less obvious as ASASSN-15lh. Wyrzykowski et al. 2017 has tried to explain the variability as induced by a binary BH on a tight orbit or due to disc precession or circularization on a timescale of about a month. Swift observations taken around the same time of optical flare detected no X-ray emission. However, further Swift exposures at dates later enabled us to detect significant X-ray emission from this event, which then decayed and faded over a few months (Auchettl et al. 2017).
Both the rebrightening as well as associated X-ray onset in ASASSN-15lh and OGLE16aaa are similar to PS1-10adi, indicating plausibly a common and unified phenomenon in TDEs waiting to be understood. However, PS1-10adi is still somehow different from the other two. First, its occurring time of the rebrightening relative to the primary outburst is much later (see Figure 5), at some 1500 days when the TDE emission has almost disappeared. Second, the pc-scale gas and dust around the SMBH of PS1-10adi should be pretty ample, evidenced by the intense usual AGN activity and high dust covering factor revealed by the dust echo (see S5). In contrast, the nucleus of ASASSN-15lh and OGLE16aaa are relatively quiescent despite of weak AGN signatures (Krühler et al. 2018; Wyrzykowski et al. 2017).
4.3. Interaction between Debris or Outflow and Torus
The particularities of PS1-10adi encouraged us to come up with possible new mechanisms of the rebrightening. Could it be caused by the collision between the unbound stellar debris and the interstellar medium (ISM) at scale of AGN torus? The spread of specific orbital energy is almost a constant for a large range of (Stone et al. 2013; Tejeda et al. 2017). The total orbital energy of unbound debris is . The interaction timescale for this collision is days. Therefore we can estimate the upper limit of rebrightening power assuming that all of the orbital energy can be transferred into the gas internal energy and radiate efficiently: , which is one order of magnitude lower than observations. As a result, we argue that the rebrightening may not be due to the collision between the unbound debris and the torus.
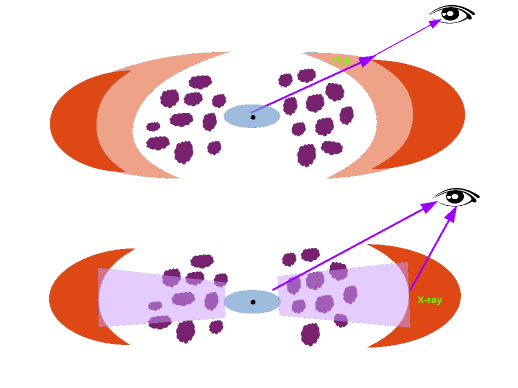
Apart from the ejected debris, outflows launched by the TDE can also serve as a source of collision (see Figure 6 as an illustration). If that is the case, the observed outflow velocity can be estimated by = . Outflows with such a kind of high velocity has been found in observations (e.g., Blanchard et al. 2017; Kara et al. 2018), and numerical simulations in which the outflow may be produced during the self-crossing process under the general relativistic precessing (e.g., Sa̧dowski et al. 2016; Jiang et al. 2016), or from the final accretion disk with super-Eddingtion accretion rate (e.g., Dai et al. 2018). For example, in the simulation of Sa̧dowski et al. 2016, about 10% of the star’s total mass can be transferred into outflow after the violent self-crossing, with outflowing velocity of 0.1c, (yet we should stress that the simulated objects therein is 0.1 solar mass star tidal disrupted by a BH of ). Hence the total kinetic energy of this outflow is in the order of ergs. As a comparison, the integrated UV- optical bolometric light curve between 1500 and 2000 rest-frame days results in a total energy of erg, which is on the same order of magnitude with the self-crossing outflow. In the torus interacting model, both the primary collisional and dust reprocessed emission are almost local, which can naturally address the high at the rebrightening stage. This is also supported by the time lag between the optical and IR rebrightening, which is shorter than the light travel time from BH to the new torus boundary ( days).
Last, we caution that besides the torus dust distributed in the equatorial plane around the accretion disk, dust elongated in the polar direction has also been found in both type 1 and type 2 AGNs via recent mid-IR interfermetry observations (Hönig et al. 2013) and SED fitting (Lyu & Rieke 2018). It’s suggested that a radiatively driven dusty wind, possibly launched in a puffed-up region of the inner hot part of the torus, is responsible for the polar dust (Hönig et al. 2012). The dusty wind is mostly optically thin and extends in the polar direction over parsecs or even tens of parsecs. On the other hand, the polar outflow is not inhibited inherently and has been tentatively reported in some broad absorption line quasars (e.g., Zhou et al. 2006). Therefore, the collision between the polar outflow and the polar dust can not be excluded completely to produce the observed rebrightening.
5. Revisiting the Nature of PS1-10adi and Analogs
In previous sections, we have assumed that the nuclear transient in PS1-10adi is a TDE and have tried to understand all observations in the context of TDEs. However, as mentioned in K17, the case of extraordinary bright SNe occasionally exploded in the galactic nucleus is still impossible to disentangle from the TDE case up until then. In this section we will try to revisit the nature of PS1-10adi and other similar events with aid of mid-IR light curves.
5.1. Mid-IR Light Curves of PS1-10adi Analogs
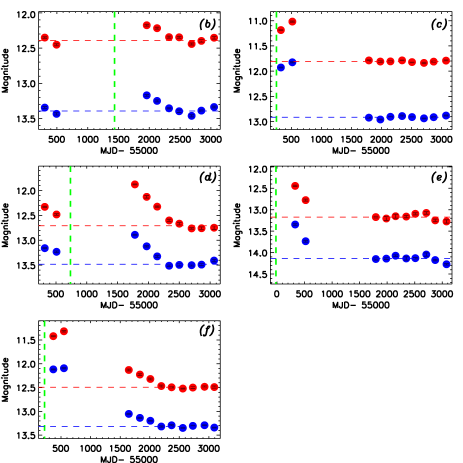
Besides PS1-10adi, K17 has reported 5 other outbursts in the centers of active galaxies. They constitute the sample of highly-energetic nuclear transient events along with PS1-10adi. To understand their nature as a whole, we have retrieved their WISE and NEOWISE photometric data and presented the light curves in Figure 7. Significant mid-IR flare-like variability is visible for them all. As we already know the optical peak date of these events, we first estimated the background emission unassociated with the outbursts by averaging the magnitudes before or after the flares when the light curves maintain a stable level.
It’s interesting to note that a sustainedMIR excess is present in J094608 before the optical flare. To exclude the probability of spurious signal caused by a systematical bias between ALLWISE and NEOWISE-R data, we have performed aperture photometry on the time-resolved coadds of WISE images (Meisner et al. 2018). The excess ahead of the optical flare is proven to be real. It may be simply attributed to a higher dust covering factor then as the torus has receded to a further distance after the outburst, but it may be also reconciled by several alternative modes under the TDE scenario. Guillochon & Ramirez-Ruiz 2015 suggested that there is a delay between the flare and the disruption of the star of order years for BH mass of . If the unbound debris collides with (torus) ISM, producing shocks and emitting UV/X-rays, it may lead to the enhanced IR emission before the primary outburst. This may be also a potential mechanism to address the early IR brightenings in PS16dtm (Jiang et al. 2017) and PS1-10adi (see §3). Other explanations, such as invoking stream collisions as a precursor to the main TDE flare (e.g., Bonnerot & Rossi 2018) or double TDEs induced by stellar binaries incident on SMBH binaries (Coughlin et al. 2018), are also possible. Owing to the deficiency of observational data before the event (e.g., X-rays), a thorough discussion of these possibilities is beyond of this work but could be tested in the future for TDEs with multiwavelength monitoring.
5.2. Infrared Luminosity Compared with Known Supernovas
The SNe scenario has been discussed by K17 in parallel with the TDE case. Spectroscopically, PS1-10adi bears similarity to type IIn SNe (SNe IIn, Schlegel 1990; Filippenko 1997), which is distinguished by relatively narrow emission lines and slowly declining light curves. The signatures of SNe IIn are not associated with the explosion itself, but rather with the interaction between ejecta and dense circumstellar medium (CSM) generally produced by pre-SN mass loss. SNe IIn have gained considerable attention over the past decade partly because they show a huge range in bolometric luminosity (e.g., Richardson et al. 2014; Li et al. 2011), among which the SLSNe are of greatest interest (e.g., Smith et al. 2007; Ofek et al. 2007; Gal-Yam 2012). It’s firstly necessary to demonstrate why PS1-10adi and analogs prefer to be linked to AGNs if they are indeed SLSNe. One possible formation channel of these SLSNe has been proposed to be the runaway mergers of massive stars in dense and young stellar clusters, giving rise to very massive H-rich CSM (Portegies Zwart & van den Heuvel 2007), which seems feasible in high-density central regions of an active galaxy. The dense AGN environment can also provide suitable conditions for high ISM pressure as well as the photoionizing radiation to trap a large fraction of the mass lost from the progenitor (Mackey et al. 2014).
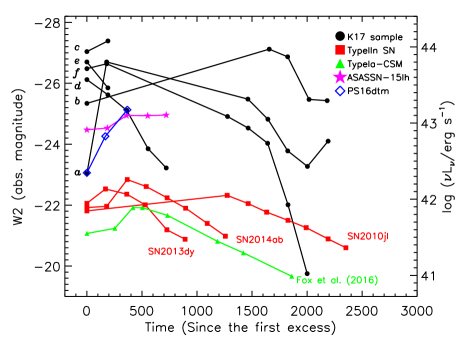
Could the SNe scenario also meet the mid-IR flare freshly revealed by the WISE light curve? Fox et al. 2011 have detected 10 out of 68 SNe IIn with late-time (¿100 days) IR emission from a warm Spitzer/IRAC survey, holding a maximal IR luminosity of , that is around erg s-1. Statistically, the IR emission of SNe IIn are somewhat more luminous and more sustained than other types (e.g., type Ia), due to the heating of pre-existing dust by radiative shocks between the expanding SN shell and the dense wind of the progenitor (Fox et al. 2013; Tinyanont et al. 2016). Even so, the peak IR (W2 band) luminosity () of PS1-10adi and analogous objects are uniformly higher than SNe IIn by at least one order of magnitude, exceeding erg s-1. As a comparison, the maximum of the other AGN transient PS16dtm up to 2017 July (latest public epoch) is also above erg s-1 (Jiang et al. 2017) already. We caution that previous Spitzer follow-ups (Fox et al. 2011) may missed the early IR emission, so then we have subsequently checked the WISE light curves of all SNe IIn exploded during 2009 and 2016 from the open supernova catalog 111https://sne.space/ (Guillochon et al. 2017). Among them, the most IR luminous ones (e.g., SN2010jl, SN2013dy, SN2014ab) show no higher luminosity and still possess erg s-1 (see Figure 8). As we mentioned in §4.2, the controversial event ASASSN-15lh was discovered as a historical SLSNe at first while more observational facts later favour the TDE scenario. A mid-IR flare after the giant optical outburst has also been detected in ASASSN-15lh by WISE with peak erg s-1, making it stand out from SNe despite slightly lower than PS1-10adi. In one word, the IR luminosity of PS1-10adi and analogs are significantly higher than known certified SNe IIn as well as any other types of SNe to our knowledge.
5.3. Dust Covering Factor: Consistent with AGN Torus
The extremely high IR luminosity of PS1-10adi can not reconcile with SNe, but seems fairly practical for TDEs in AGNs, in which the dusty torus around the BH will unavoidably absorb the TDE emission and reprocess them into the IR. To depict the dust content around PS1-10adi more quantitatively, we try to calculate its dust covering factor (), namely the fraction of the sky obscured by dust when seen from the central source. The idea is very straightforward that the original UV-optical photons towards the dust region will be entirely absorbed and re-emitted in the IR. Therefore, the ratio between energy radiated through dust reprocessing () and total energy initially released by the event () can be used to indicate (see also van Velzen et al. 2016). K17 has obtained a of erg by integrating the UV-optical blackbody emission and taking into consideration of the early UV excess and missing rise-time contribution. Unfortunately, the precise calculation of is hindered by the sparse sampling and the 3-year-gap of the mid-IR light curve. As an acceptable alternative, we have calculated the basing on the piecewise linear luminosity evolution, yielding a value of erg. The derived of PS1-10adi is thus , that is broadly consistent with AGNs estimated by other methods, such as fitting torus component to the SEDs of AGNs (e.g., Fritz et al. 2006; Mor et al. 2009; Roseboom et al. 2013). We have subsequently computed the for the left 5 events in K17 using the same approach and obtained comparable values.
The high of PS1-10adi is a natural consequence of AGNs, which is automatically satisfied in the TDE case as it happens in the accretion disk scale encircled by the torus. Core-collapse SNe have been believed to be one of the major production sites of cosmic dust grains (see a recent review by Sarangi et al. 2018), either by ejecting metal-rich materials into space for dust condensation or through the interaction between the ejecta and dense CSM. However, the amount of dust produced by an individual SNe is very limited and hard to manifest the SNe as a such high covering factor. The only conceivable SNe likelihood remained to be a SLSNe exploded inner or exactly in the torus (e.g., Assef et al. 2018). In the meantime, the torus or AGN gas may also provide the dense CSM that is thought to be needed to make the SNe super-luminous. The SNe scheme can not be ruled out completely with the caveat that the SNe explosion within the torus scale hasn’t been well demonstrated.
We do not expect that the mid-IR echoes have the function to definitely diagnose the nature of PS1-10adi and analogs, but they indeed confine the outburst location to be no larger than the torus scale confidently. It’s not trivial to differentiate TDEs and SNe with existing information and our current knowledge. Some other studies have even invoked peculiar AGN processes to generate these intense nuclear flares of Seyfert galaxies. For instance, the interaction between BH disk winds and BLR clouds is proposed to reproduce the observed luminosity and timescale (Moriya et al. 2017). In fact, a high-amplitude AGN variability could be misidentified as TDE or vice verse (e.g., Merloni et al. 2015; Saxton et al. 2018). In this way, the ionizing continuum and mid-IR echoes may be the least informative aspect of the transient, and other identifying signatures (e.g., chemical abundance ratio, Yang et al. 2017) are needed.
6. Summary
The investigation of TDEs in AGNs has become more and more realizable thanks to the rapid development of time-domain astronomy nowadays. Continuing with our first dust echo case study on PS16dtm (Jiang et al. 2017), which is a TDE occurring in a Seyfert 1 host found by Pan-STARRS, we have next turned our attention to the other event PS1-10adi (K17) discovered by the same survey. The outburst of PS1-10adi happens much earlier than PS16dtm and thus yields a more complete light curve, that will provide us an excellent opportunity to understand TDEs in AGNs.
The mid-IR echoes appeared in both events display some distinctive characteristics by comparing with previous TDEs in quiescent galaxies. The complete understanding of these two events is beyond this work, yet their unusual behaviors can be largely attributed to a pre-existing dusty torus in AGNs but absent in quiescent galaxies. First, the mid-IR flares are detectable even earlier than the optical ones. The dust temperature naively fitted by blackbody emission in the early stage is higher than the dust sublimation temperature, indicating strongly on-going dust evaporation. We infer that it’s the torus dust around the BH that have (partially) obscured and weakened the optical emission, which has been conversely transferred to the IR emission. Along with the rising of the TDE bolometric luminosity, the inner radius of the torus receded until the peak luminosity. During this process, the metals originally contained in the dust will be delivered to the gas and give rise to the prominent Fe II multiplets seen in PS16dtm and PS1-10adi. The Fe II lines of PS1-10adi have faded over when the outburst ends, supporting strongly the photoionizing mechanism, although the collisional excitation may also act, triggered by the interaction between the unbound stellar debris with the torus gas in the TDE scenario.
The other intriguing feature of PS1-10adi is the late-stage UV-optical rebrightening at rest-frame days after the primary outburst. The peak luminosity of the hump is erg s-1, that is two orders of magnitude lower than the primary peak. In agreement with most other optical TDEs, the X-rays hasn’t been detected in the early stage (Auchettl et al. 2017). Interestingly, the Swift observation triggered during the rebrightening has captured the X-ray emission. In addition, there also exists a mid-IR rebrightening immediately after the the optical one. The late-stage accretion possibility is disfavoured by the ultra-high and X-ray emerging. We have also noticed that at least two other reported TDEs (ASASSN-15lh and OGLE16aaa) show somewhat similar behavior yet the rebrightening takes place at much earlier stage. Unlike the reprocessing or circularization model suggested in ASASSN-15lh, we have proposed a new mechanism responsible for the rebrightening inspired by the fact of AGN phase before PS1-10adi occurs. In this scenario, the collision between the high-speed outflow and the torus has resulted in the UV-optical rebrightening and X-ray onset. We suspect that it may be a universal phenomenon for the TDEs in AGNs. Further follow-ups of PS16dtm and more other events can help us confirm the idea or not.
The mid-IR light curves analyzed in this work can also help us understand the nature of these highly energetic transient events in the centers of active galaxies. The peak IR luminosities of PS1-10adi and analogs are more than 10 times higher than all known IR-luminous SNe, but could be rare SNe exploded in the torus. Moreover, their IR luminosity is also much higher than normal TDEs in quiescent galaxies (e.g., Jiang et al. 2016; van Velzen et al. 2016). It can be easily understood as the dusty torus effect, which solely acts in AGNs. The torus has obscured the central engine of PS1-10adi with a covering factor of and radiatively transferred a large fraction of high energy photons to the IR band.
Tori is an essential ingredient in the AGN unification model to explain various
observational characteristics exhibited in different types of AGNs
although its attributes are still far away from clarity.
TDEs in AGNs may enable us to probe the torus from a novel perspective.
The dust echo of the torus will respond to the tidal disruption radiation as an
outstanding mid-IR flare, which is presumably even remarkable than the optical flare.
The time delay of the flare in the mid-IR to the optical is an expression of the
torus physical scale and the total radiated energy in the IR can be used to
measure the dust covering factor of AGN.
Similar phenomenon has also been reported in the other sorts of systems undergoing
dramatic change of accretion rate, namely changing-look AGNs in which
the AGN type has transited from type 1 to type 2 or vice versa (Sheng et al. 2017;
2018 in preparation).
Moreover, the interaction between the high-speed outflow and ISM may also
give useful insights into the torus information.
The new approach demands timely trigger of mid-IR monitoring (e.g., Spitzer)
of the TDE candidates found in AGNs by X-ray or optical band. On the other hand, the
mid-IR flares identified from surveys like WISE (Jiang et al. in preparation) also
deserve prompt follow-ups in other bands (e.g., X-rays). The complete coverage of all
events at each band is too expensive and unrealistic, yet could be achieved by
certain well-defined projects at the upcoming golden era of time-domain astronomy.
References
- Assef et al. (2018) Assef, R. J., Prieto, J. L., Stern, D., et al. 2018, ApJ, 866, 26
- Auchettl et al. (2017) Auchettl, K., Guillochon, J., & Ramirez-Ruiz, E. 2017, ApJ, 838, 149
- Baldwin et al. (2004) Baldwin, J. A., Ferland, G. J., Korista, K. T., Hamann, F., & LaCluyzé, A. 2004, ApJ, 615, 610
- Blanchard et al. (2017) Blanchard, P. K., Nicholl, M., Berger, E., et al. 2017, ApJ, 843, 106
- Bogdán & Goulding (2015) Bogdán, Á., & Goulding, A. D. 2015, ApJ, 800, 124
- Bonnerot et al. (2016) Bonnerot, C., Rossi, E. M., Lodato, G., & Price, D. J. 2016, MNRAS, 455, 2253
- Bonnerot & Rossi (2018) Bonnerot, C., & Rossi, E. M. 2018, arXiv:1805.09329
- Chen et al. (2018) Chen, M. C., Broadhurst, T., Lim, J., et al. 2018, ApJ, 863, 135
- Collin & Joly (2000) Collin, S., & Joly, M. 2000, NewAstronomy, 44, 531
- Coughlin et al. (2018) Coughlin, E. R., Darbha, S., Kasen, D., & Quataert, E. 2018, ApJ, 863, L24
- Dai et al. (2018) Dai, L., McKinney, J. C., Roth, N., Ramirez-Ruiz, E., & Miller, M. C. 2018, ApJ, 859, L20
- Dong et al. (2016) Dong, S., Shappee, B. J., Prieto, J. L., et al. 2016, Science, 351, 257
- Dou et al. (2016) Dou, L., Wang, T., Jiang, N., et al. 2016, ApJ, 832, 188
- Dou et al. (2017) Dou, L., Wang, T., Yan, L., et al. 2017, ApJ, 841, L8
- Filippenko (1997) Filippenko, A. V. 1997, ARA&A, 35, 309
- Fox et al. (2011) Fox, O. D., Chevalier, R. A., Skrutskie, M. F., et al. 2011, ApJ, 741, 7
- Fox et al. (2013) Fox, O. D., Filippenko, A. V., Skrutskie, M. F., et al. 2013, AJ, 146, 2
- Fox et al. (2016) Fox, O. D., Johansson, J., Kasliwal, M., et al. 2016, ApJ, 816, L13
- Fritz et al. (2006) Fritz, J., Franceschini, A., & Hatziminaoglou, E. 2006, MNRAS, 366, 767
- Gal-Yam (2012) Gal-Yam, A. 2012, Science, 337, 927
- Godoy-Rivera et al. (2017) Godoy-Rivera, D., Stanek, K. Z., Kochanek, C. S., et al. 2017, MNRAS, 466, 1428
- Greene & Ho (2005) Greene, J. E., & Ho, L. C. 2005, ApJ, 630, 122
- Greene & Ho (2007) Greene, J. E., & Ho, L. C. 2007, ApJ, 670, 92
- Guhathakurta & Draine (1989) Guhathakurta, P., & Draine, B. T. 1989, ApJ, 345, 230
- Guillochon et al. (2014) Guillochon, J., Manukian, H., & Ramirez-Ruiz, E. 2014, ApJ, 783, 23
- Guillochon & Ramirez-Ruiz (2015) Guillochon, J., & Ramirez-Ruiz, E. 2015, ApJ, 809, 166
- Guillochon et al. (2017) Guillochon, J., Parrent, J., Kelley, L. Z., & Margutti, R. 2017, ApJ, 835, 64
- Hayasaki et al. (2016) Hayasaki, K., Stone, N., & Loeb, A. 2016, MNRAS, 461, 3760
- Heckman & Best (2014) Heckman, T. M., & Best, P. N. 2014, ARA&A, 52, 589
- Hezaveh et al. (2015) Hezaveh, Y. D., Marshall, P. J., & Blandford, R. D. 2015, ApJ, 799, L22
- Hills (1975) Hills, J. G. 1975, Nature, 254, 295
- Hönig et al. (2012) Hönig, S. F., Kishimoto, M., Antonucci, R., et al. 2012, ApJ, 755, 149
- Hönig et al. (2013) Hönig, S. F., Kishimoto, M., Tristram, K. R. W., et al. 2013, ApJ, 771, 87
- Jahnke & Macciò (2011) Jahnke, K., & Macciò, A. V. 2011, ApJ, 734, 92
- Jiang et al. (2012) Jiang, N., Zhou, H.-Y., Ho, L. C., et al. 2012, ApJ, 759, L31
- Jiang et al. (2016) Jiang, N., Dou, L., Wang, T., et al. 2016, ApJ, 828, L14
- Jiang et al. (2017) Jiang, N., Wang, T., Yan, L., et al. 2017, ApJ, 850, 63
- Jiang et al. (2016) Jiang, Y.-F., Guillochon, J., & Loeb, A. 2016, ApJ, 830, 125
- Joly (1981) Joly, M. 1981, A&A, 102, 321
- Karas & Šubr (2007) Karas, V., & Šubr, L. 2007, A&A, 470, 11
- Kankare et. (2017) Kankare, E., Kotak, R., Mattila, S., et al. 2017, Nature Astronomy, 1, 865 (K17)
- Kara et al. (2018) Kara, E., Dai, L., Reynolds, C. S., & Kallman, T. 2018, MNRAS, 474, 3593
- Komossa (2015) Komossa, S. 2015, Journal of High Energy Astrophysics, 7, 148
- Kormendy & Ho (2013) Kormendy, J., & Ho, L. C. 2013, ARA&A, 51, 511
- Kruegel (2003) Kruegel, E. 2003, The physics of interstellar dust, by Endrik Kruegel. IoP Series in astronomy and astrophysics, ISBN 0750308613. Bristol, UK: The Institute of Physics, 2003.,
- Krühler et al. (2018) Krühler, T., Fraser, M., Leloudas, G., et al. 2018, A&A, 610, A14
- Leloudas et al. (2016) Leloudas, G., Fraser, M., Stone, N. C., et al. 2016, Nature Astronomy, 1, 0002
- Li et al. (2011) Li, W., Leaman, J., Chornock, R., et al. 2011, MNRAS, 412, 1441
- Lu et al. (2016) Lu, W., Kumar, P., & Evans, N. J. 2016, MNRAS, 458, 575
- Lyu & Rieke (2018) Lyu, J., & Rieke, G. H. 2018, ApJ, 866, 92
- Mackey et al. (2014) Mackey, J., Mohamed, S., Gvaramadze, V. V., et al. 2014, Nature, 512, 282
- Mainzer et al. (2014) Mainzer, A., Bauer, J., Cutri, R. M., et al. 2014, ApJ, 792, 30
- Mao et al. (2001) Mao, S., Witt, H. J., & Koopmans, L. V. E. 2001, MNRAS, 323, 301
- Margutti et al. (2017) Margutti, R., Metzger, B. D., Chornock, R., et al. 2017, ApJ, 836, 25
- Mathis et al. (1977) Mathis, J. S., Rumpl, W., & Nordsieck, K. H. 1977, ApJ, 217, 425
- Meisner et al. (2018) Meisner, A. M., Lang, D., & Schlegel, D. J. 2018, AJ, 156, 69
- Merloni et al. (2015) Merloni, A., Dwelly, T., Salvato, M., et al. 2015, MNRAS, 452, 69
- Metzger & Stone (2016) Metzger, B. D., & Stone, N. C. 2016, MNRAS, 461, 948
- Mor et al. (2009) Mor, R., Netzer, H., & Elitzur, M. 2009, ApJ, 705, 298
- Moriya et al. (2017) Moriya, T. J., Tanaka, M., Morokuma, T., & Ohsuga, K. 2017, ApJ, 843, L19
- Namekata & Umemura (2016) Namekata, D., & Umemura, M. 2016, MNRAS, 460, 980
- Netzer (2013) Netzer, H. 2013, The Physics and Evolution of Active Galactic Nuclei, by Hagai Netzer, Cambridge, UK: Cambridge University Press, 2013,
- Netzer (2015) Netzer, H. 2015, ARA&A, 53, 365
- Ofek et al. (2007) Ofek, E. O., Cameron, P. B., Kasliwal, M. M., et al. 2007, ApJ, 659, L13
- Ostriker (2000) Ostriker, J. P. 2000, Physical Review Letters, 84, 5258
- Peng (2007) Peng, C. Y. 2007, ApJ, 671, 1098
- Peterson (1997) Peterson, B. M. 1997, An introduction to active galactic nuclei, Publisher: Cambridge, New York Cambridge University Press, 1997 Physical description xvi, 238 p. ISBN 0521473489,
- Phinney (1989) Phinney, E. S. 1989, The Center of the Galaxy, 136, 543
- Portegies Zwart & van den Heuvel (2007) Portegies Zwart, S. F., & van den Heuvel, E. P. J. 2007, Nature, 450, 388
- Rees (1988) Rees, M. J. 1988, Nature, 333, 523
- Richardson et al. (2014) Richardson, D., Jenkins, R. L., III, Wright, J., & Maddox, L. 2014, AJ, 147, 118
- Roseboom et al. (2013) Roseboom, I. G., Lawrence, A., Elvis, M., et al. 2013, MNRAS, 429, 1494
- Sa̧dowski et al. (2016) Sa̧dowski, A., Tejeda, E., Gafton, E., Rosswog, S., & Abarca, D. 2016, MNRAS, 458, 4250
- Sarangi et al. (2018) Sarangi, A., Matsuura, M., & Micelotta, E. R. 2018, Space Sci. Rev., 214, 63
- Saxton et al. (2018) Saxton, C. J., Perets, H. B., & Baskin, A. 2018, MNRAS, 474, 3307
- Schlegel (1990) Schlegel, E. M. 1990, MNRAS, 244, 269
- Smith et al. (2007) Smith, N., Li, W., Foley, R. J., et al. 2007, ApJ, 666, 1116
- Sheng et al. (2017) Sheng, Z., Wang, T., Jiang, N., et al. 2017, ApJ, 846, L7
- Sigut & Pradhan (2003) Sigut, T. A. A., & Pradhan, A. K. 2003, ApJS, 145, 15
- Stern et al. (2012) Stern, D., Assef, R. J., Benford, D. J., et al. 2012, ApJ, 753, 30
- Stone et al. (2013) Stone, N., Sari, R., Loeb, A., 2013, MNRAS, 435, 1809
- Stone & Metzger (2016) Stone, N. C., & Metzger, B. D. 2016, MNRAS, 455, 859
- Tejeda et al. (2017) Tejeda, E., Gafton, E., Rosswog, S., & Miller, J. C., 2017, MNRAS, 469, 4483
- Tinyanont et al. (2016) Tinyanont, S., Kasliwal, M. M., Fox, O. D., et al. 2016, ApJ, 833, 231
- van Velzen et al. (2011) van Velzen, S., Farrar, G. R., Gezari, S., et al. 2011, ApJ, 741, 73
- van Velzen et al. (2016) van Velzen, S., Mendez, A. J., Krolik, J. H., & Gorjian, V. 2016, ApJ, 829, 19
- Véron-Cetty et al. (2006) Véron-Cetty, M.-P., Joly, M., Véron, P., et al. 2006, A&A, 451, 851
- Wang & Merritt (2004) Wang, J., & Merritt, D. 2004, ApJ, 600, 149
- Wang et al. (2018) Wang, T., Yan, L., Dou, L., et al. 2018, MNRAS, 477, 2943
- Waxman & Draine (2000) Waxman, E., & Draine, B. T. 2000, ApJ, 537, 796
- Wright et al. (2010) Wright, E. L., Eisenhardt, P. R. M., Mainzer, A. K., et al. 2010, AJ, 140, 1868-1881
- Wyrzykowski et al. (2017) Wyrzykowski, Ł., Zieliński, M., Kostrzewa-Rutkowska, Z., et al. 2017, MNRAS, 465, L114
- Yan et al. (2013) Yan, L., Donoso, E., Tsai, C.-W., et al. 2013, AJ, 145, 55
- Yang et al. (2017) Yang, C., Wang, T., Ferland, G. J., et al. 2017, ApJ, 846, 150
- Zhao et al. (2002) Zhao, H., Haehnelt, M. G., & Rees, M. J. 2002, NewA, 7, 385
- Zhou et al. (2006) Zhou, H., Wang, T., Wang, H., et al. 2006, ApJ, 639, 716