Molecular tracers of radiative feedback in Orion (OMC-1)††thanks: Herschel is an ESA space observatory with science instruments provided by European-led Principal Investigator consortia and with important participation from NASA.,††thanks: Includes IRAM 30m observations. IRAM is supported by INSU/CNRS (France), MPG (Germany), and IGN (Spain).
Young massive stars regulate the physical conditions, ionization, and fate of their natal molecular cloud and surroundings. It is important to find tracers that help quantifying the stellar feedback processes that take place at different spatial scales. We present 85 arcmin2 (1.3 pc2) velocity-resolved maps of several submillimeter molecular lines, taken with Herschel/HIFI, toward the closest high-mass star-forming region, the Orion molecular cloud 1 core (OMC-1). The observed rotational lines include probes of warm and dense molecular gas that are difficult, if not impossible, to detect from ground-based telescopes: CH+ ( 1–0), CO ( 10–9), HCO+ ( 6–5) and HCN ( 6–5), and CH (, 1, 3/2–1, 1/2). These lines trace an extended but thin layer (3–6 mag or 1016 cm) of molecular gas at high thermal pressure, cm-3 K, associated with the far ultraviolet (FUV) irradiated surface of OMC-1. The intense FUV radiation field, emerging from massive stars in the Trapezium cluster, heats, compresses and photoevaporates the cloud edge. It also triggers the formation of specific reactive molecules such as CH+. We find that the CH+ ( 1–0) emission spatially correlates with the flux of FUV photons impinging the cloud: from 103 to 105. This correlation is supported by constant-pressure photodissociation region (PDR) models in the parameter space cm-3 K where many observed PDRs seem to lie. The CH+ ( 1–0) emission spatially correlates with the extended infrared emission from vibrationally excited H2 ( 1), and with that of [C ii] 158 m and CO 10–9, all emerging from FUV-irradiated gas. These correlations link the presence of CH+ to the availability of C+ ions and of FUV-pumped H2 ( 1) molecules. We conclude that the parsec-scale CH+ emission and narrow-line (v 3 km s-1) mid- CO emission arises from extended PDR gas and not from fast shocks. PDR line tracers are the smoking gun of the stellar feedback from young massive stars. The PDR cloud surface component in OMC-1, with a mass density of 120–240 pc-2, represents 5% to 10% of the total gas mass, however, it dominates the emitted line luminosity; the average CO 10–9 surface luminosity in the mapped region being 35 times brighter than that of CO 2–1. These results provide insights into the source of submillimeter CH+ and mid- CO emission from distant star-forming galaxies.
Key Words.:
galaxies: ISM – H II regions – infrared: galaxies – ISM: clouds1 Introduction
Massive stars (8 ) dominate the injection of radiative energy into the interstellar medium (ISM) through ultraviolet (UV) photons, and of mechanical energy through stellar winds, supernova explosions, and merger encounters (Beuther et al., 2007; Zinnecker & Yorke, 2007; Tan et al., 2014; Krumholz et al., 2014). Massive stars are born inside dense giant molecular cloud (GMC) cores ( 105 cm-3). Protostars of different masses develop inside these star-forming sites (e.g., McKee & Ostriker, 2007). Their outflows shock the ambient cloud, heating and compressing the molecular gas around them to high temperatures and densities. These young protostellar systems emit, on spatial scales of 0.05 pc, high infrared (IR) luminosities, as well as vibrationally and rotationally excited H2, CO, and H2O lines from shocked gas (e.g., van Dishoeck et al., 2011, and references therein). At the scales of an entire GMC, however, from several to hundred parsec most of the dust continuum and gas line luminosity do not arise from individual protostars but from the extended cloud component.
Once a new O-type star or a massive star cluster is formed, the energy and momentum injected by photoionization, radiation pressure, and stellar winds, ionize and erode the natal molecular cloud, creating H ii regions and expanding bubbles (e.g., Krumholz et al., 2014; Rahner et al., 2017; Haid et al., 2018). Photodisociation regions (PDRs) develop at the interfaces between the hot ionized gas and the cold molecular gas, and more generally, at any slab of neutral gas (meaning that hydrogen atoms are not ionized) illuminated by stellar far-UV (FUV) photons with energies in the range eV (e.g., Hollenbach & Tielens, 1997; Goicoechea et al., 2016).
A strong FUV radiation field111 1 equals to 1.610-3 erg cm-2 s-1, the FUV flux (integrated from 912 Å to 2400 Å) in the solar neighbourhood (Habing, 1968). (103) induces a plethora of dynamical effects (e.g., Hill & Hollenbach, 1978; Hosokawa & Inutsuka, 2006; Wareing et al., 2018; Bron et al., 2018) and chemical changes in the cloud (e.g., Hogerheijde et al., 1995; Cuadrado et al., 2015, 2016, 2017; Nagy et al., 2017; Goicoechea et al., 2017). This stellar feedback is not limited to the close vicinity of massive stars, but it can determine the gas physical conditions at scales of several parsec (e.g., Stacey et al., 1993; Herrmann et al., 1997; Goicoechea et al., 2015b) and drive the evolution of the natal cloud itself. Finding observational tracers of the radiative and mechanical feedback from massive stars is relevant not only for local studies, but also in the more general framework of star formation in galaxies. There it is not easy, at high red-shifts not even possible, to disentangle where the observed line emission is coming from: embedded star-forming sites, nuclear outflows, quiescent molecular clouds, diffuse halos, etc.
The brightest FUV radiation line diagnostic is the [C ii] 158 m fine-structure line of ionized carbon C+ (Dalgarno & McCray, 1972). With an ionization potential of 11.3 eV, C+ can also be abundant in both the hot ionized and the cold atomic gas (e.g., Pineda et al., 2013). Hence, it is not always trivial to delimitate the origin of the [C ii] 158 m line and exploit its full diagnostic power (e.g., Pabst et al., 2017). In consequence, it is important to have diverse observational probes of stellar feedback processes.
1.1 Reactive ions as tracers of harsh interstellar conditions
Reactive ions such as CH+, OH+, or SH+ are among the first molecules to form in initially atomic gas.
That is, (H atoms) (H2 molecules), where refers to the species abundance with respect to H nuclei (for a review see Gerin et al., 2016). In FUV-irradiated neutral gas, carbon is mainly in the form of C+ (Goldsmith et al., 2012; Gerin et al., 2015). The formation of CH+ depends on the flux of FUV photons, the gas temperature, and the abundance of vibrationally excited H2 ( 1); either collisionally excited or FUV-pumped (Sternberg & Dalgarno, 1995; Agúndez et al., 2010).
The main gas-phase reaction producing detectable quantities of CH+ is:
| (1) |
where refers to the specific vibrational level of H2. This reaction has a very high endothermicity, 4300 K, if =0. Thus, one would expect negligible CH+ abundances in molecular clouds (where ). Reaction (1), however, becomes exothermic and fast for 1 (Hierl et al., 1997; Zanchet et al., 2013), with the first H2 vibrational level lying at 5987 K. Hence, compared to other molecules, CH+ is expected to be abundant only in high-temperature FUV-irradiated gas (e.g., Black, 1998; Gerin et al., 2016)
Once formed, CH+ is a very reactive ion; the timescale for its destruction in reactions with H2 molecules or H atoms is comparable to, or shorter than, that for non-reactive collisions (elastic or inelastic). In dense gas, 105 cm-3, the lifetime of CH+ is so short, a few hours, that the molecule may form and be destroyed without experiencing many non-reactive collisions with other species (Black, 1998; Nagy et al., 2013; Godard & Cernicharo, 2013; Goicoechea et al., 2017).
CH+ was one of the first interstellar molecules detected in the 1930s (Douglas & Herzberg, 1941). Due to the high endothermicity of reaction (1) and limited H2 ( 1) column densities in low-density gas, explaining the presence of CH+ in diffuse clouds (typically with 1, 100 cm-3 and 100 K) has been a long standing problem in astrochemistry. At such low densities, the CH+ 1–0 line can only be detected in absorption against bright submillimeter (submm) continuum background sources (Falgarone et al., 2010a; Godard et al., 2012). Low-velocity shocks (Elitzur & Watson, 1978; Draine & Katz, 1986; Pineau des Forets et al., 1986) and, in particular, intermittent turbulence dissipation in a magnetized medium (Falgarone et al., 1995; Joulain et al., 1998; Godard et al., 2009, 2014) are the most promising scenarios to explain the presence of CH+ in diffuse gas. These theories are based in a local enhancement of the gas heating that raises the temperature to 1000 K in shear structures or vortices of only a few hundred AU. At these high temperatures, and enhanced velocity drift between ions and neutrals, reaction (1) becomes efficient. Other, perhaps less succesful, scenarios include the turbulent mixing between the warm and the cold neutral phases of the ISM (Lesaffre et al., 2007) and the presence of extended warm H2 (Valdivia et al., 2017).
The detection of far-IR (FIR) and submm CH+ rotational line emission from strongly FUV-irradiated ( 103) and dense PDRs ( 105 cm-3) (Cernicharo et al., 1997; Naylor et al., 2010; Nagy et al., 2013; Pilleri et al., 2014; Joblin et al., 2018) suggested that the more intense FUV field and much higher densities compared to diffuse clouds enhances the abundance of H2 ( 1) and also the CH+ production. Indeed, PDR models using updated state-to-state chemical rates for reaction (1) emphasised the role of FUV-pumped H2 ( 1) to explain the presence of CH+ in bright and dense PDRs (Agúndez et al., 2010; Faure et al., 2017). Later observations showed that the CH+ emission can be relatively extended near young massive stars (Morris et al., 2016). In addition, Herschel also detected CH+ broad line-emission from high- and low-mass protostars (Falgarone et al., 2010b; Benz et al., 2010, 2016). The preferred interpretation is that CH+ forms in irradiated magnetized shocks: the FUV-irradiated walls of a protostellar outflow. Last but not least, CH+ ( 1–0) emission has been recently detected by ALMA in star-forming galaxies at redshift of about two (Falgarone et al., 2017).
| Species | Transition | Frequency | Telescope | HPBW | Herschel | |||
| (GHz) | (K) | (s-1) | (cm-3) | /Instrument | (′′) | ObsID | ||
| CH+ | 5–4 | 4155.8719 | 599.6 | 1.05 | 81010 | Herschel/PACS | 12 | 342218571/2 |
| CH+ | 4–3 | 3330.6297 | 400.1 | 0.53 | 21010 | /PACS | 12 | 342218571/2 |
| CH+ | 3–2 | 2501.4404 | 240.3 | 0.22 | 5109 | /PACS | 12 | 342218571/2 |
| C+ () | - | 1900.5369 | 91.3 | 2.310-6 | 4103 | Herschel/HIFI | 12.0 | 1342250412/4/5 |
| -H2O | 312-221 | 1153.1268 | 215.2 | 2.710-3 | 6107 | /HIFI | 19.8 | 1342250465 |
| 12CO | 10–9 | 1151.9854 | 304.2 | 1.010-4 | 1106 | /HIFI | 19.8 | 1342250465 |
| HCN | 13–12 | 1151.4491 | 387.0 | 7.610-2 | 6109 | /HIFI | 19.8 | 1342250465 |
| CH+ | 1–0 | 835.1375 | 40.1 | 6.210-3 | 1108 | /HIFI | 27.3 | 1342250217 |
| HCO+ | 6–5 | 535.0616 | 89.9 | 1.210-2 | 3107 | /HIFI | 42.6 | 1342244307 |
| CH | =1,3/2–1,1/2 | 532.7933 | 25.7 | 4.110-4 | 3108 | /HIFI | 42.8 | 1342244307 |
| HCN | 6–5 | 531.7164 | 89.3 | 7.210-3 | 7108 | /HIFI | 42.8 | 1342244307 |
| -CH3OH | 110,11–100,10 | 531.3193 | 153.1 | 6.810-4 | 5106 | /HIFI | 42.9 | 1342244307 |
| HCO+ | =3-2 | 267.558 | 25.7 | 1.410-3 | 4106 | IRAM30m/HERA | 9.2 | |
| 12CO () | 2–1 | 230.538 | 16.6 | 6.910-7 | 1104 | /HERA | 10.7 | |
| 13CO () | 2–1 | 220.399 | 15.9 | 6.110-7 | 1104 | /HERA | 11.2 | |
| C18O | 2–1 | 219.560 | 15.8 | 6.010-7 | 1104 | /HERA | 11.2 |
In summary, CH+ has been historically considered a unique, sometimes exotic, tracer of harsh conditions (Black, 1998). Despite many theoretical efforts, there have not been any observational study on how the extended CH+ emission relates with the gas physical conditions and with the flux of FUV photons. In this paper we present the detection of large-scale CH+ ( 1–0) emission toward Orion molecular cloud 1 (OMC-1), complemented with velocity-resolved maps of other key diagnostics of the warm molecular gas that help to understand the role of stellar radiation at large spatial scales. The paper is organized as follows. In Sect. 2 we introduce the region and describe the observations. In Sect. 3 we present the main observational results. In Sect. 4 we analize the maps, focusing on the CH+ emission, and in Sec. 5 we model and discuss the role of FUV radiation.
2 Observations and Data Reduction
2.1 OMC-1 in Orion A
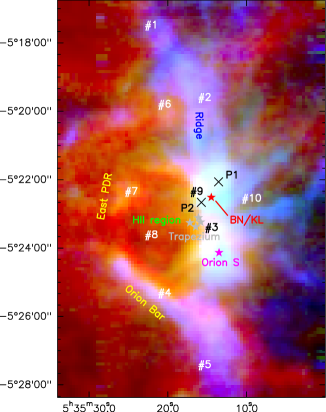
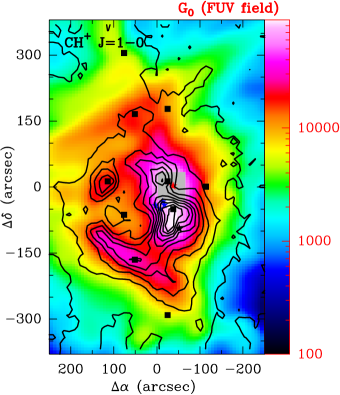
OMC-1, in the Orion A complex, lies behind the iconic Orion Nebula (M42) and the massive stars Ori of the Trapezium cluster (with spectral types from O7V to B3V; e.g., Simón-Díaz et al., 2006) roughly at the center of the Orion nebula cluster (ONC) (e.g., Zuckerman, 1973; Genzel & Stutzki, 1989; O’Dell, 2001). At a distance333Recent estimations, from Gaia DR2, suggest that the distance to ONC is lower, 3863 pc (e.g., Großschedl et al., 2018, and references therein). Here we still adopt 414 pc to be consistent with the luminosities computed in our previous works (e.g., Goicoechea et al., 2015a, b). of 414 pc (Menten et al., 2007), OMC-1 is the closest region of on-going intermediate- and high-mass star formation. The two major star-forming sites are the Becklin-Neugebauer/Kleinmann-Low region (BN/KL; Becklin & Neugebauer, 1967) and Orion South (Orion S; Fig. 1). BN/KL hosts a high-velocity wide-angle outflow that contains the two brightest IR H2 emission peaks in the sky: Peak 1 (P1) and Peak 2 (P2), produced by hot shocked gas (marked with crosses in Fig. 1; see Kwan & Scoville, 1976; Beckwith et al., 1978; González-Alfonso et al., 2002; Goicoechea et al., 2015a). Both BN/KL and Orion S show chemically rich spectra (e.g., Blake et al., 1987; Tercero et al., 2010; Tahani et al., 2016). OMC-1 is directly exposed to the strong FUV radiation emitted by young hot stars in the Trapezium cluster, and in particular dominated by star Ori C1 (33.5 ; e.g., GRAVITY collaboration et al., 2018) located at 0.3 pc in front of the molecular cloud. The FUV-irradiated surface of OMC-1, to a first approximation a large-scale face-on PDR, copiously emits in FIR [C ii] 158 m and [O i] 63 m fine-structure gas-cooling lines (Stacey et al., 1993; Herrmann et al., 1997; Goicoechea et al., 2015b).
Velocity-resolved maps over tens of square arcmin are needed to constrain the kinematics and physical properties of the extended, non star-forming gas in GMCs. A number of studies have provided such molecular line maps toward OMC-1. However, most of them focus on the lowest-energy rotational lines that typically trace cold molecular gas (e.g., Bally et al., 1987; Goldsmith et al., 1997; Ungerechts et al., 1997; Berné et al., 2014; Kauffmann et al., 2017). Indeed, the warm molecular gas, 100 K, predominantly emits in higher frequency lines. Schmid-Burgk et al. (1989) presented a pioneering velocity-resolved CO 7–6 line map (48 arcmin2) of OMC-1 taken with KAO at 100′′ angular resolution. Improved angular resolution maps were later taken from ground-based telescopes in CO 7–6 (8 arcmin2; Wilson et al., 2001) and up to CO 8–7 (30 arcmin2; Peng et al., 2012). The narrow CO line profiles (v4 km s-1) observed toward many positions suggested the widespread nature of warm (but not shocked) molecular gas. In addition, the spatial distribution of the extended CN emission implied an active photochemistry at the interface between the H ii regions M42 and M43 and the molecular cloud (Rodríguez-Franco et al., 1998, 2001).
2.2 Herschel/HIFI and PACS maps
In this work we present new submm line maps of OMC-1 taken with the heterodyne instrument HIFI (de Graauw et al., 2010) on board Herschel space telescope (Pilbratt et al., 2010). The maps have a size of 85 arcmin2 (0.9 pc 1.4 pc). They belong to program OT1jgoicoec4. A [C ii] 158 m map from this program was first presented in Goicoechea et al. (2015b). Morris et al. (2016) previosulsy presented smaller (12 arcmin2) maps around Orion BN/KL based on observations performed during the regular instrument calibration activities. At the observed frequencies, HIFI employed Superconductor-Insulator-Superconductor (SIS) mixers in two orthogonal polarizations. We used the Wide Band Acousto-Optical Spectrometer providing a spectral resolution of 1.1 MHz and a bandwidth of 4 GHz. We obtained on-the-fly (OTF) maps with half-beam sampling, and angular resolutions (half-power beam-widths, HPBW) ranging from 43′′ in Band 1, to 20′′ in Band 5. A reference-OFF position at 9′ was observed. Total map integration times were 1.4 hr at 535 GHz, 2.2 hr at 835 GHz, and 4.6 hr at 1152 GHz. We used the main beam temperature scale ( in K) as opposed to . For semi-extended emission sources, not infinite but larger than HIFI’s HPBW, of uniform brightness temperature (), is the most appropriate intensity scale (). The achieved rms noise was typically 50 mK at 531 GHz, 100 mK at 835 GHz and 1152 GHz, and 800 mK per channel.
As part of a related Herschel program (KPGTebergin1), we used the PACS spectrometer (Poglitsch et al., 2010) to map a 2′2′ region around Orion BN/KL outflows and the Trapezium cluster area. These 12′′ angular resolution observations cover the shorter =70–94 m and 108–190 m wavelength ranges where CH+ rotationally excited lines appear. PACS map data calibration and line flux extraction are described in Goicoechea et al. (2015a). Here we present the detection of bright CH+ 3–2, 4–3, and 5–4 lines toward a position close to the Trapezium cluster: position 3 (see Figs. 1 and 2).
2.3 IRAM 30m maps
We complemented our study with the analysis of unpublished C18O ( 2–1) and HCO+ ( 3–2) line maps, obtained by us with the multi-beam receiver HERA at the IRAM-30m telescope (Pico Veleta, Spain). The HPBW ranges from 9′′ to 11′′. We used the versatile spectrometer VESPA as a backend providing 320 kHz of the spectral resolution (0.4 km s-1). These maps belong to a project to map a much larger area of Orion A in CO isotopologues. The data reduction is described in Berné et al. (2014). The achieved rms noise is 0.2 K (C18O 2–1) and 1 K (HCO+ 6–5) per 0.4 km s-1 channel.
Herschel and IRAM-30m data cubes were processed with GILDAS. Figure 2 and also Figs. 12 and 13 in the Appendix show the resulting emission maps at their native angular resolutions. Offsets in arcsec are given with respect to the maps center at : 5h35m17.0s, : 22′33.7′′. Table 1 summarizes the main spectroscopic parameters of the observed lines. To determine the total luminosity emitted by each line, we converted the integrated line intensity maps from K km s-1 units to line surface brightness in W m-2 sr-1. The conversion3 scales with the cube of the line frequency. Hence, it greatly affects the comparison of FIR, submm and mm lines. Finally, to match the CH+ 1–0 (HCO+ 6–5) angular resolution and carry out a combined analysis (e.g., line ratio maps), we also convolved the maps to an uniform resolution of 27′′ (43′′).
3 Results
3.1 Global spatial distribution of different line tracers
Figure 1 shows a composite image of the integrated line emission in: [C ii] 158 m (red) from the FUV-irradiated surfaces of OMC-1; HCO+ 3–2 (green) from warm and dense molecular gas; and C18O 2–1 (blue) from colder and more FUV-shielded gas, mostly tracing the cloud interior (e.g., Bally et al., 1987; Hacar et al., 2017, 2018). The strong flux of FUV photons from the Trapezium illuminates the surface of the molecular cloud and creates bright and dense PDRs. The most noticeable edge-on H ii/H/H2 interfaces are the Orion Bar and the East PDRs, but the entire illuminated skin of the cloud, bright in [C ii] 158 m emission (Fig. 14), can be seen as a face-on PDR (e.g., Stacey et al., 1993; Goicoechea et al., 2015b).
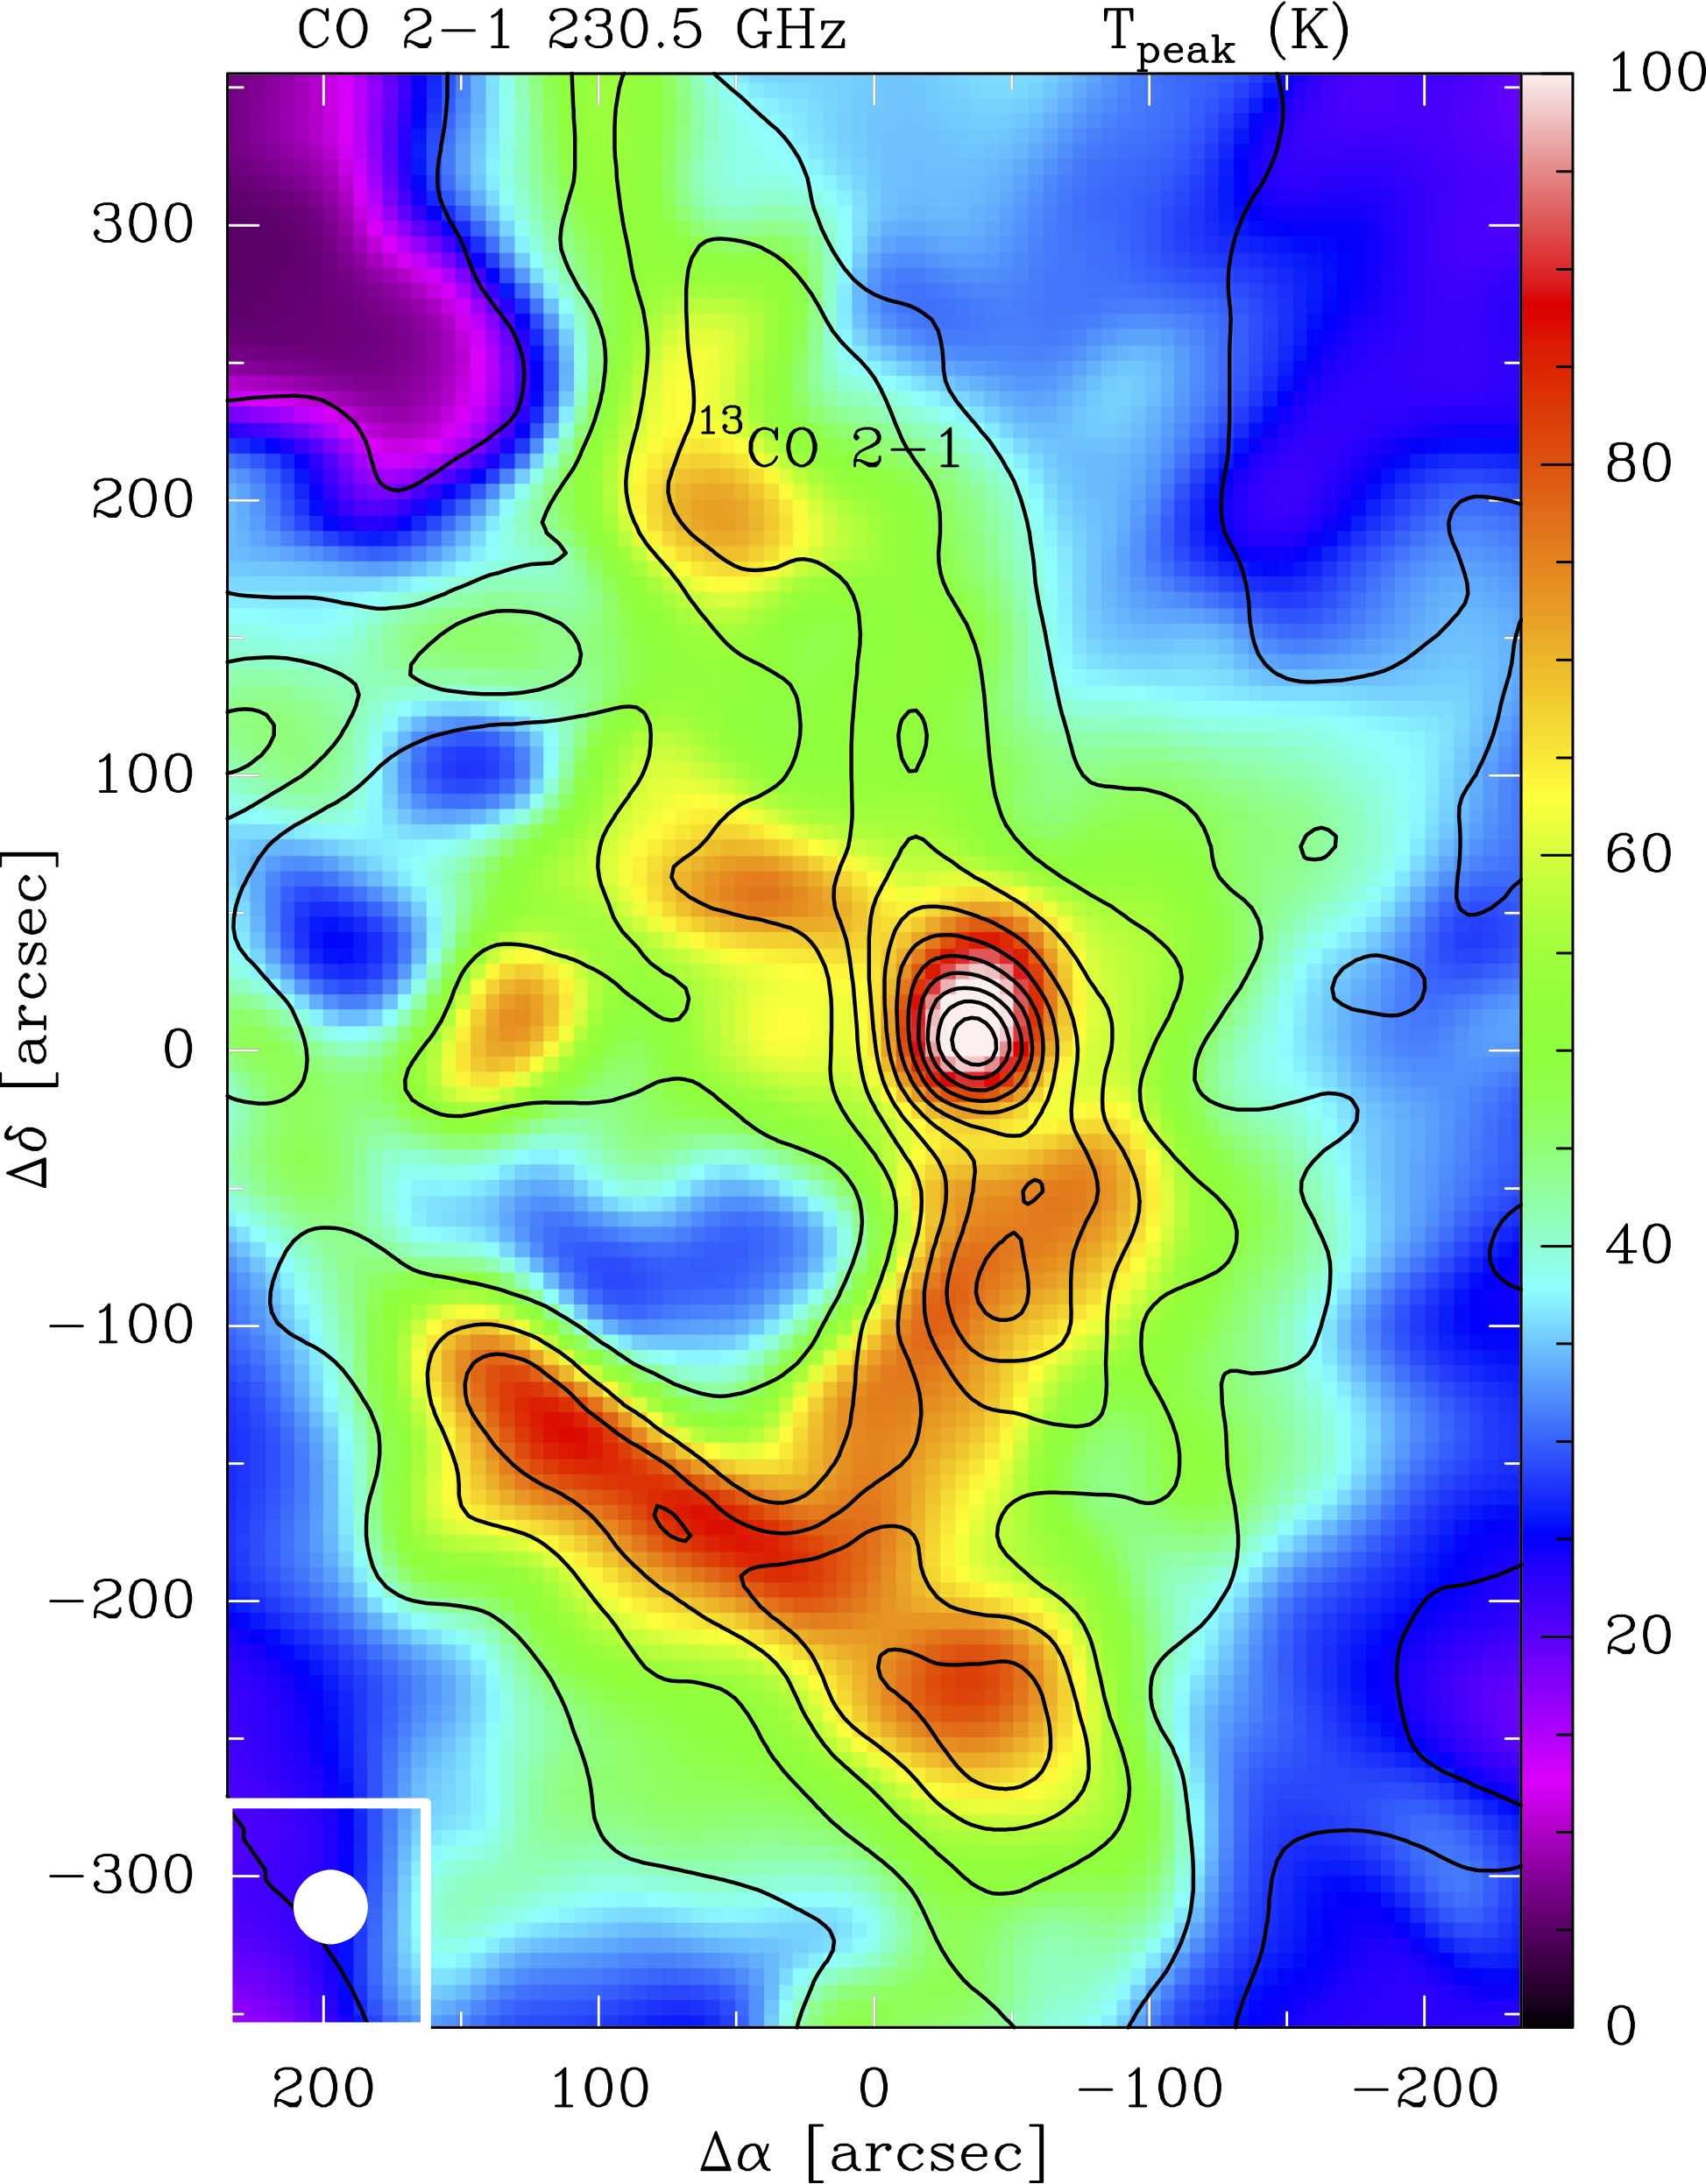
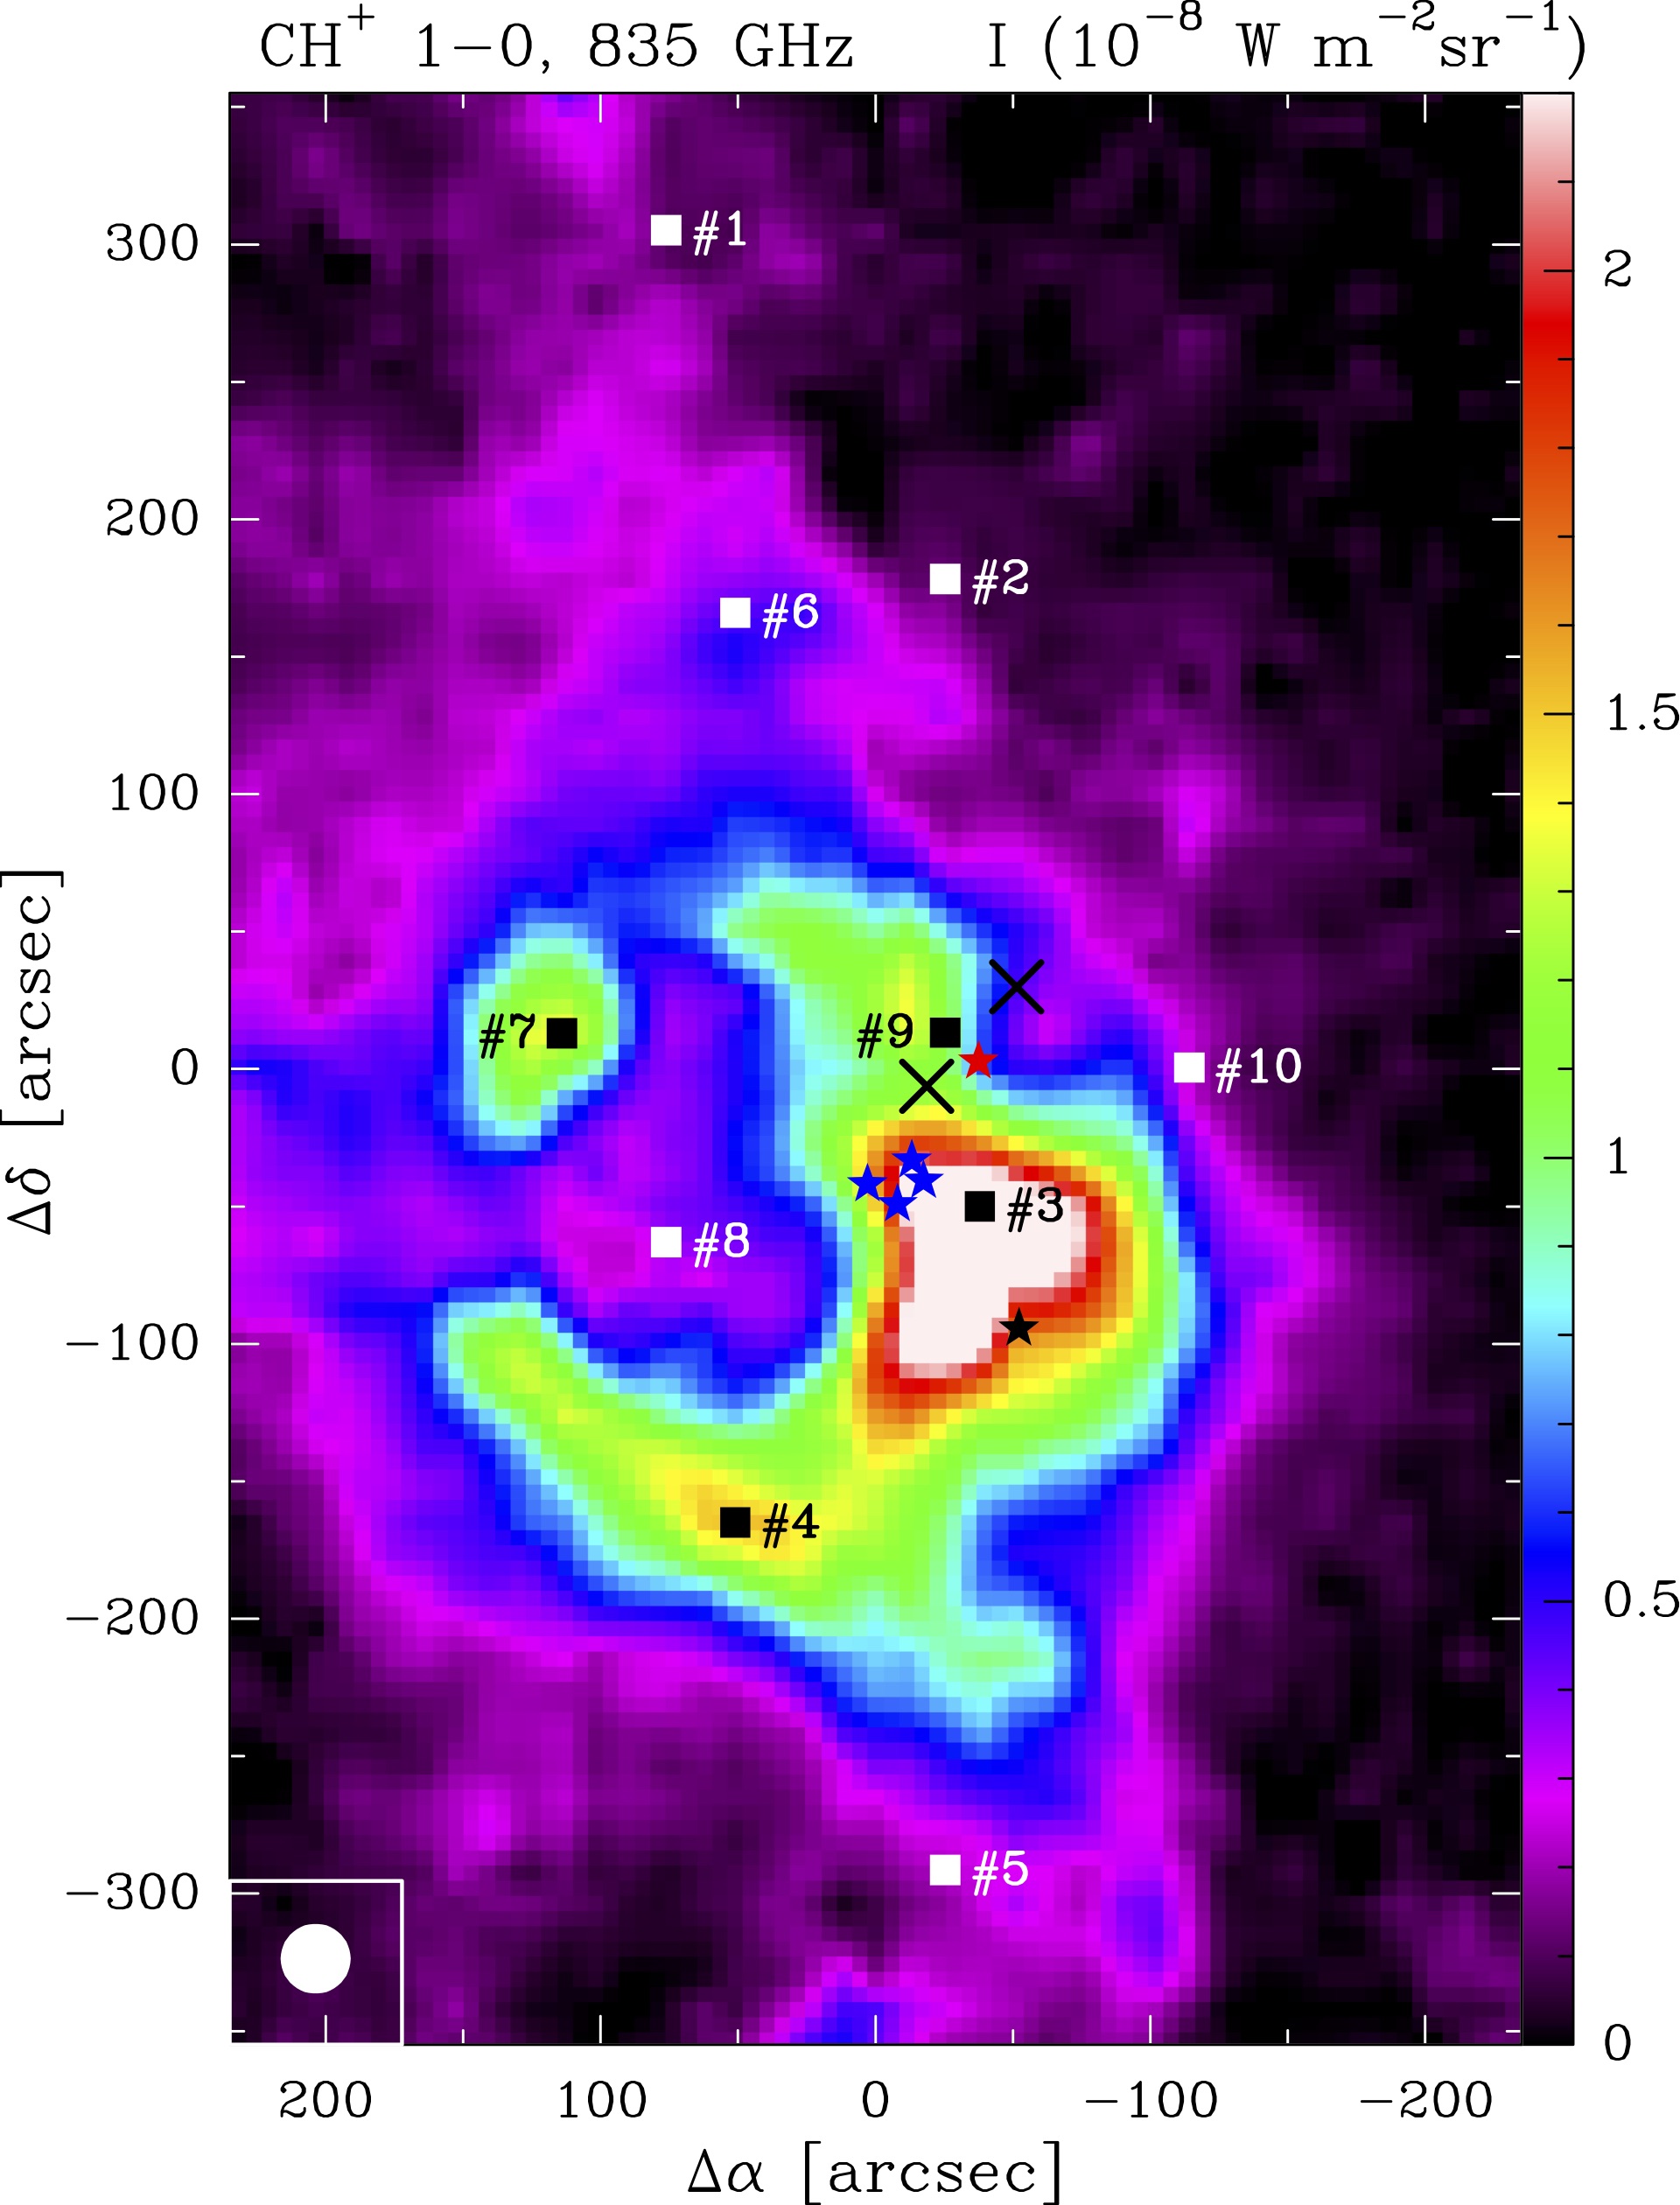
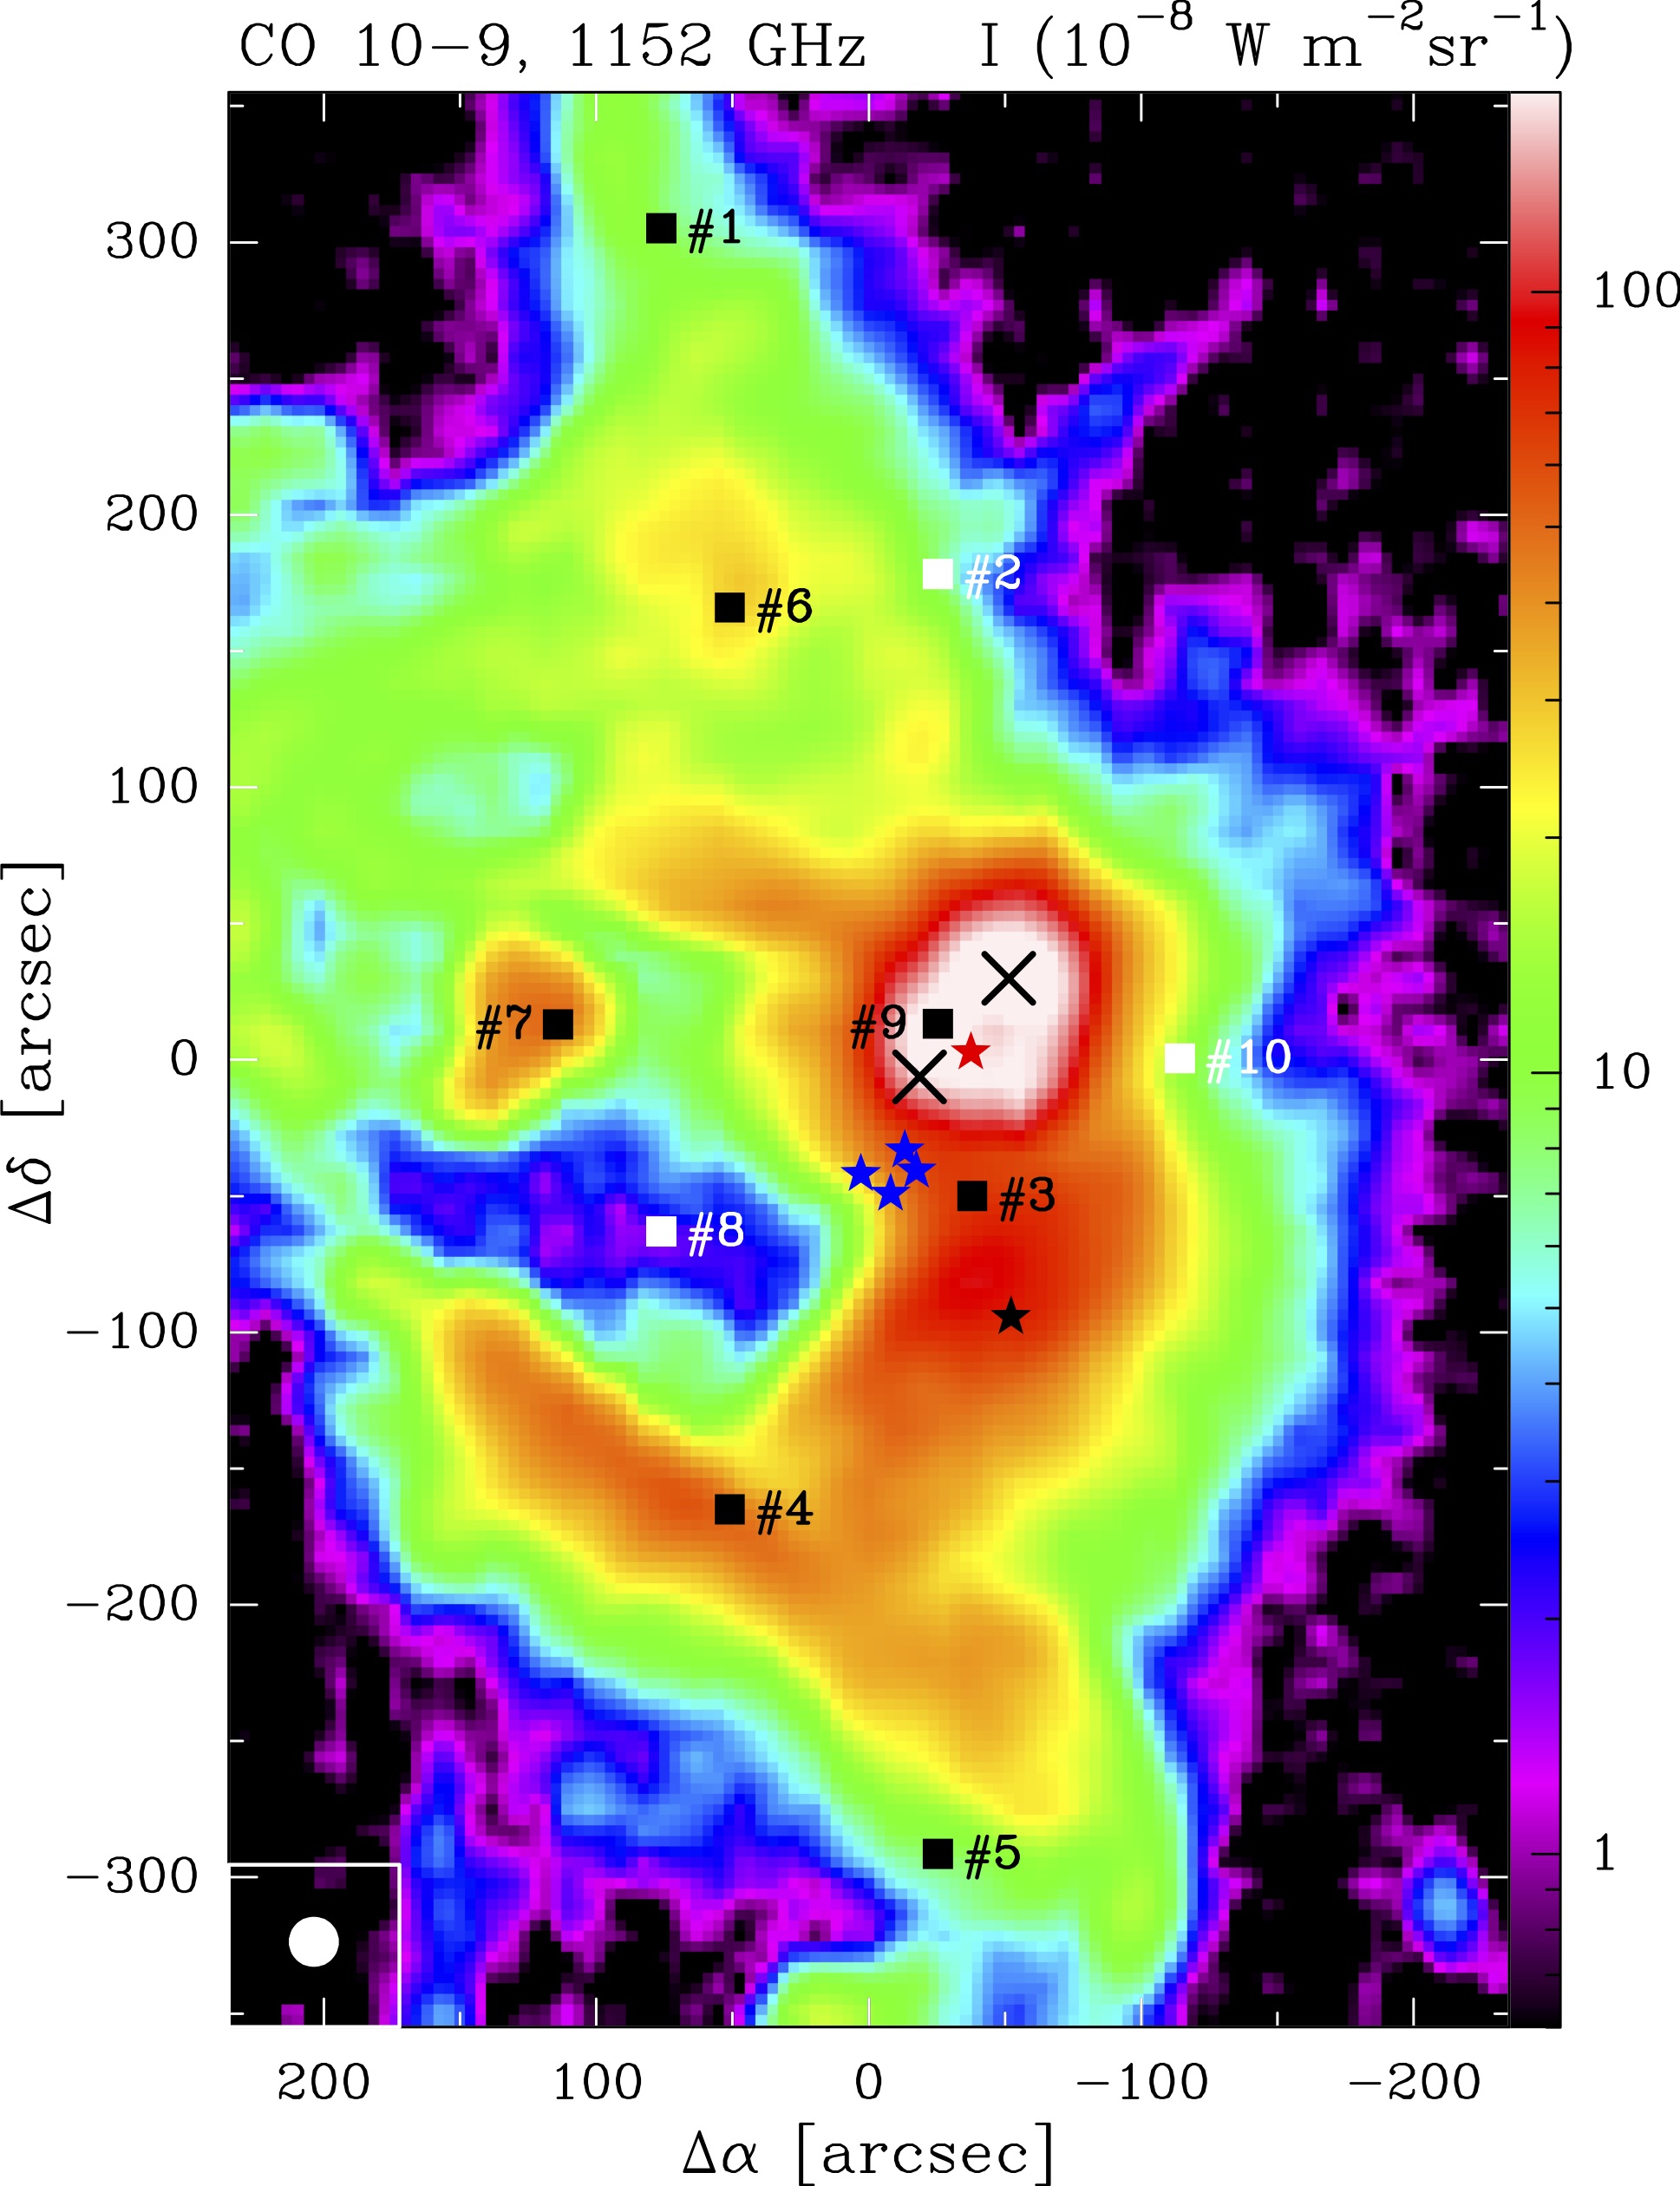
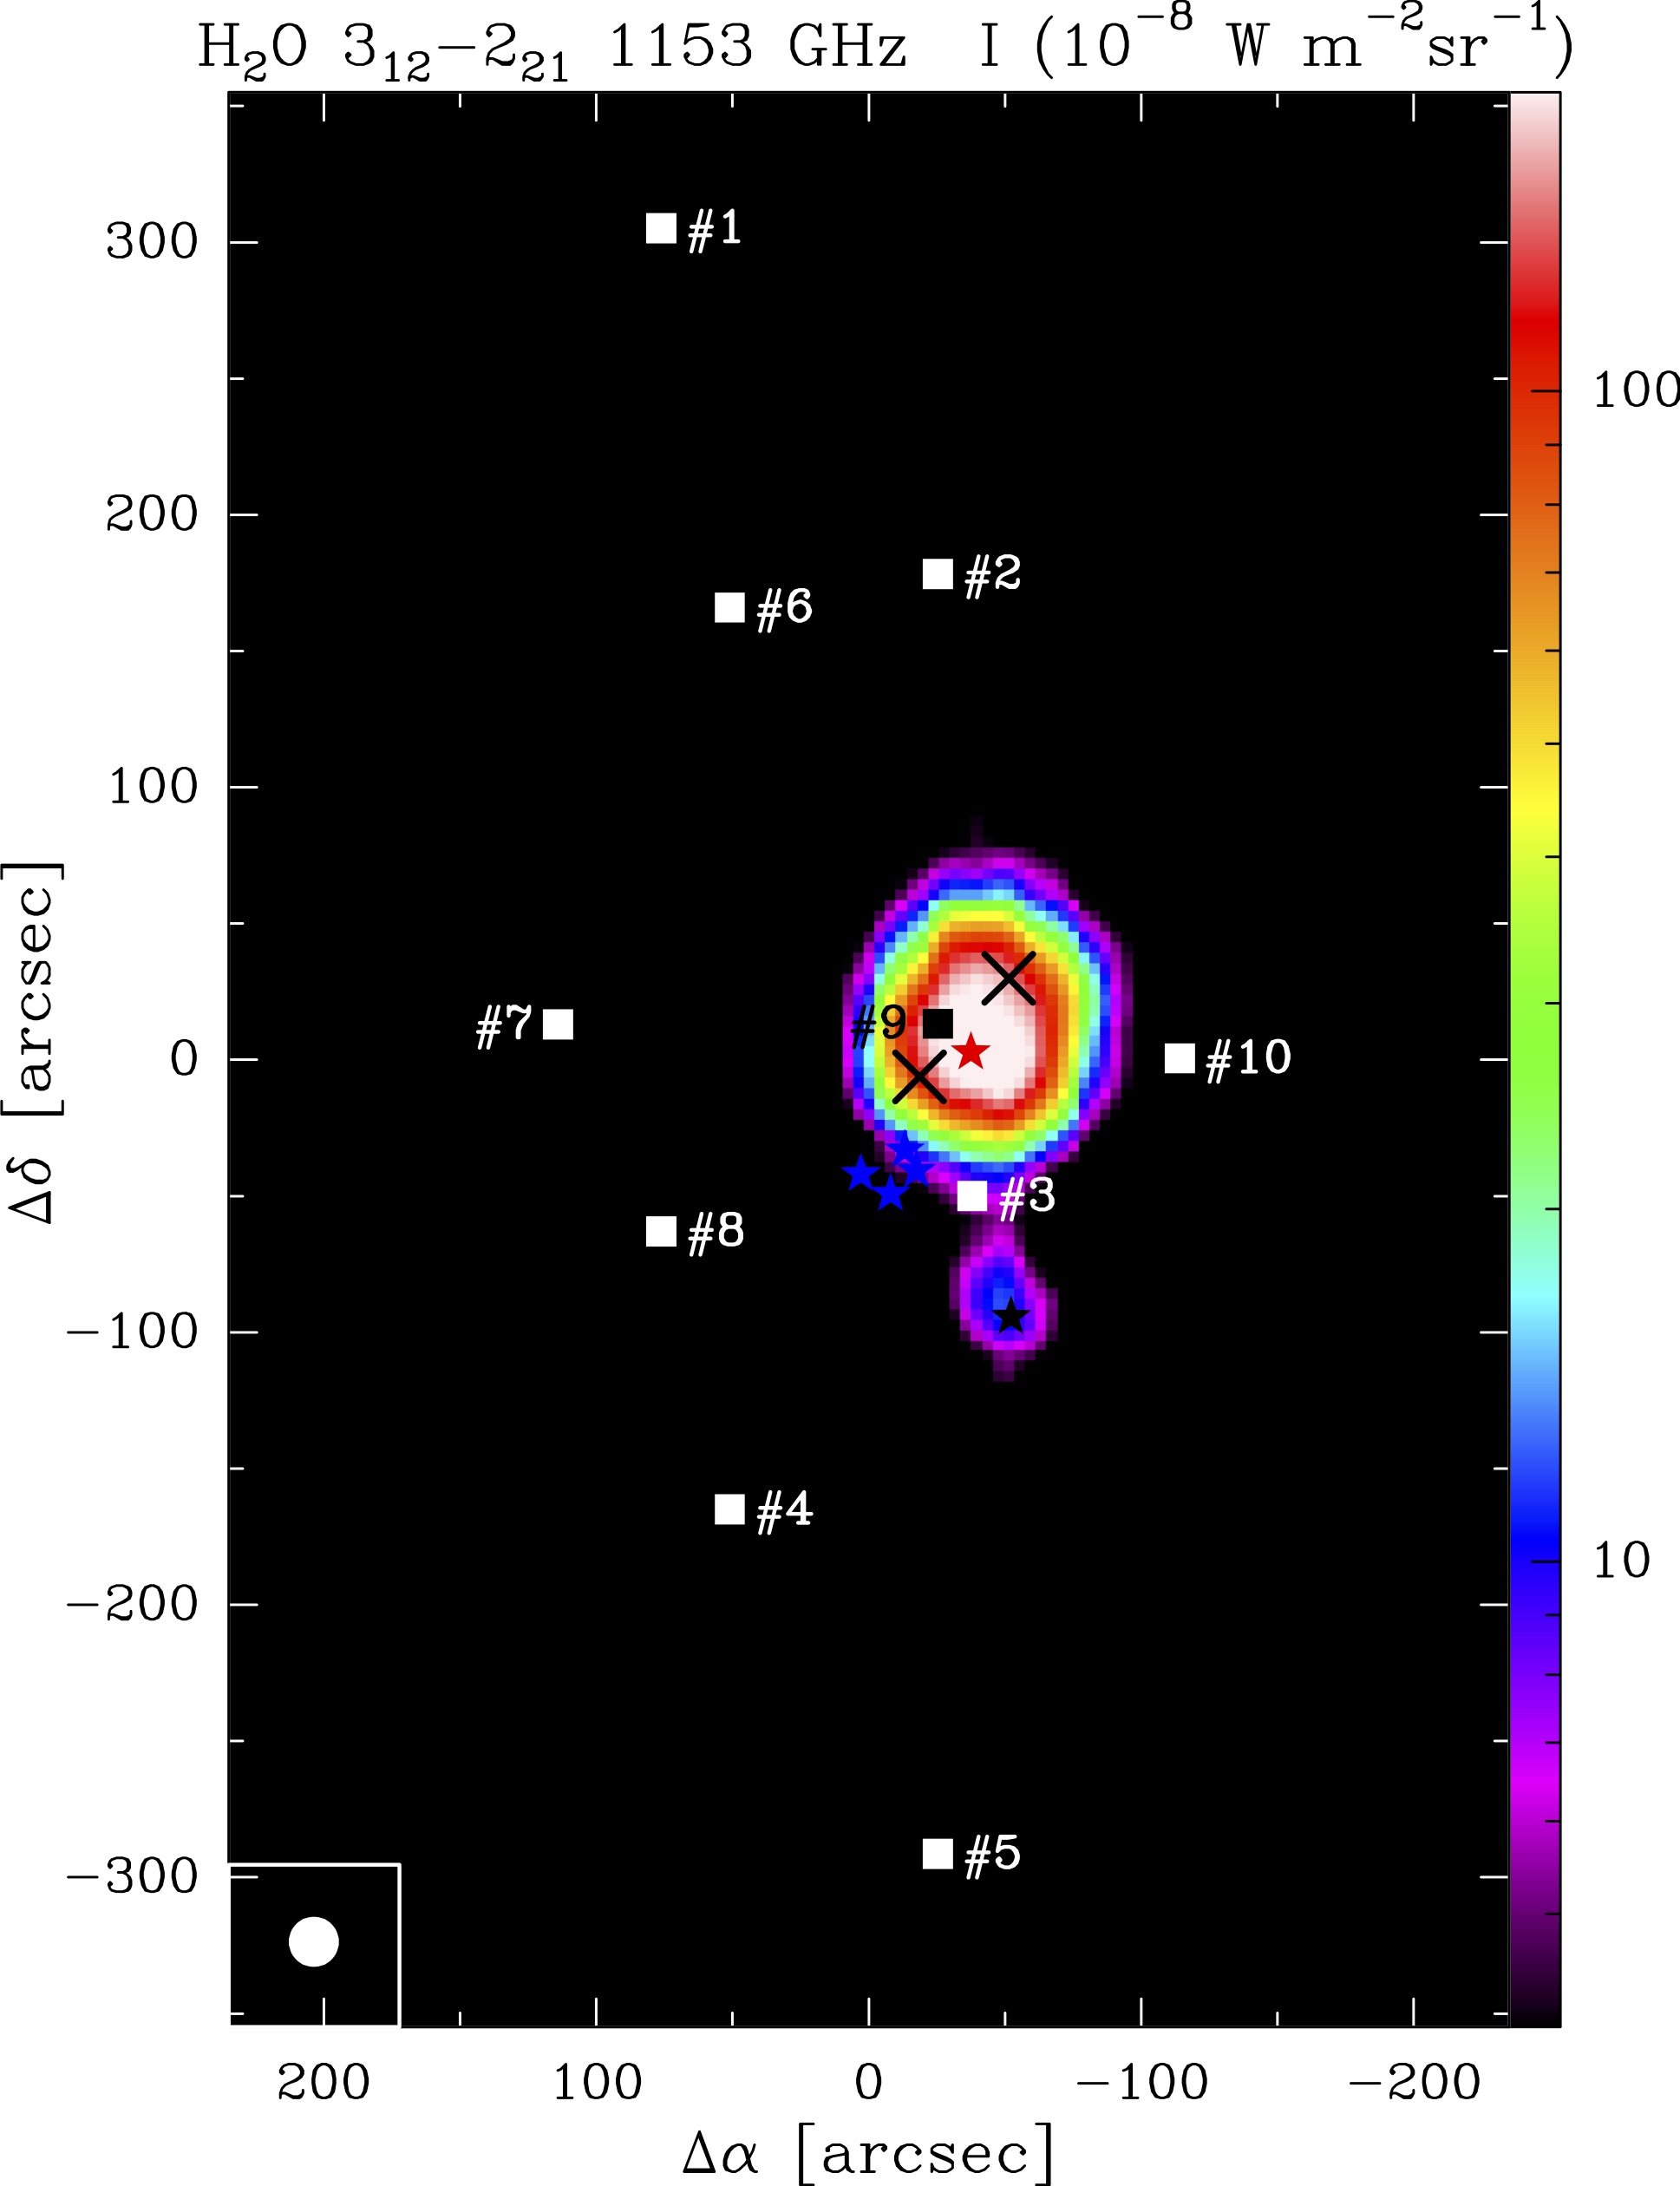
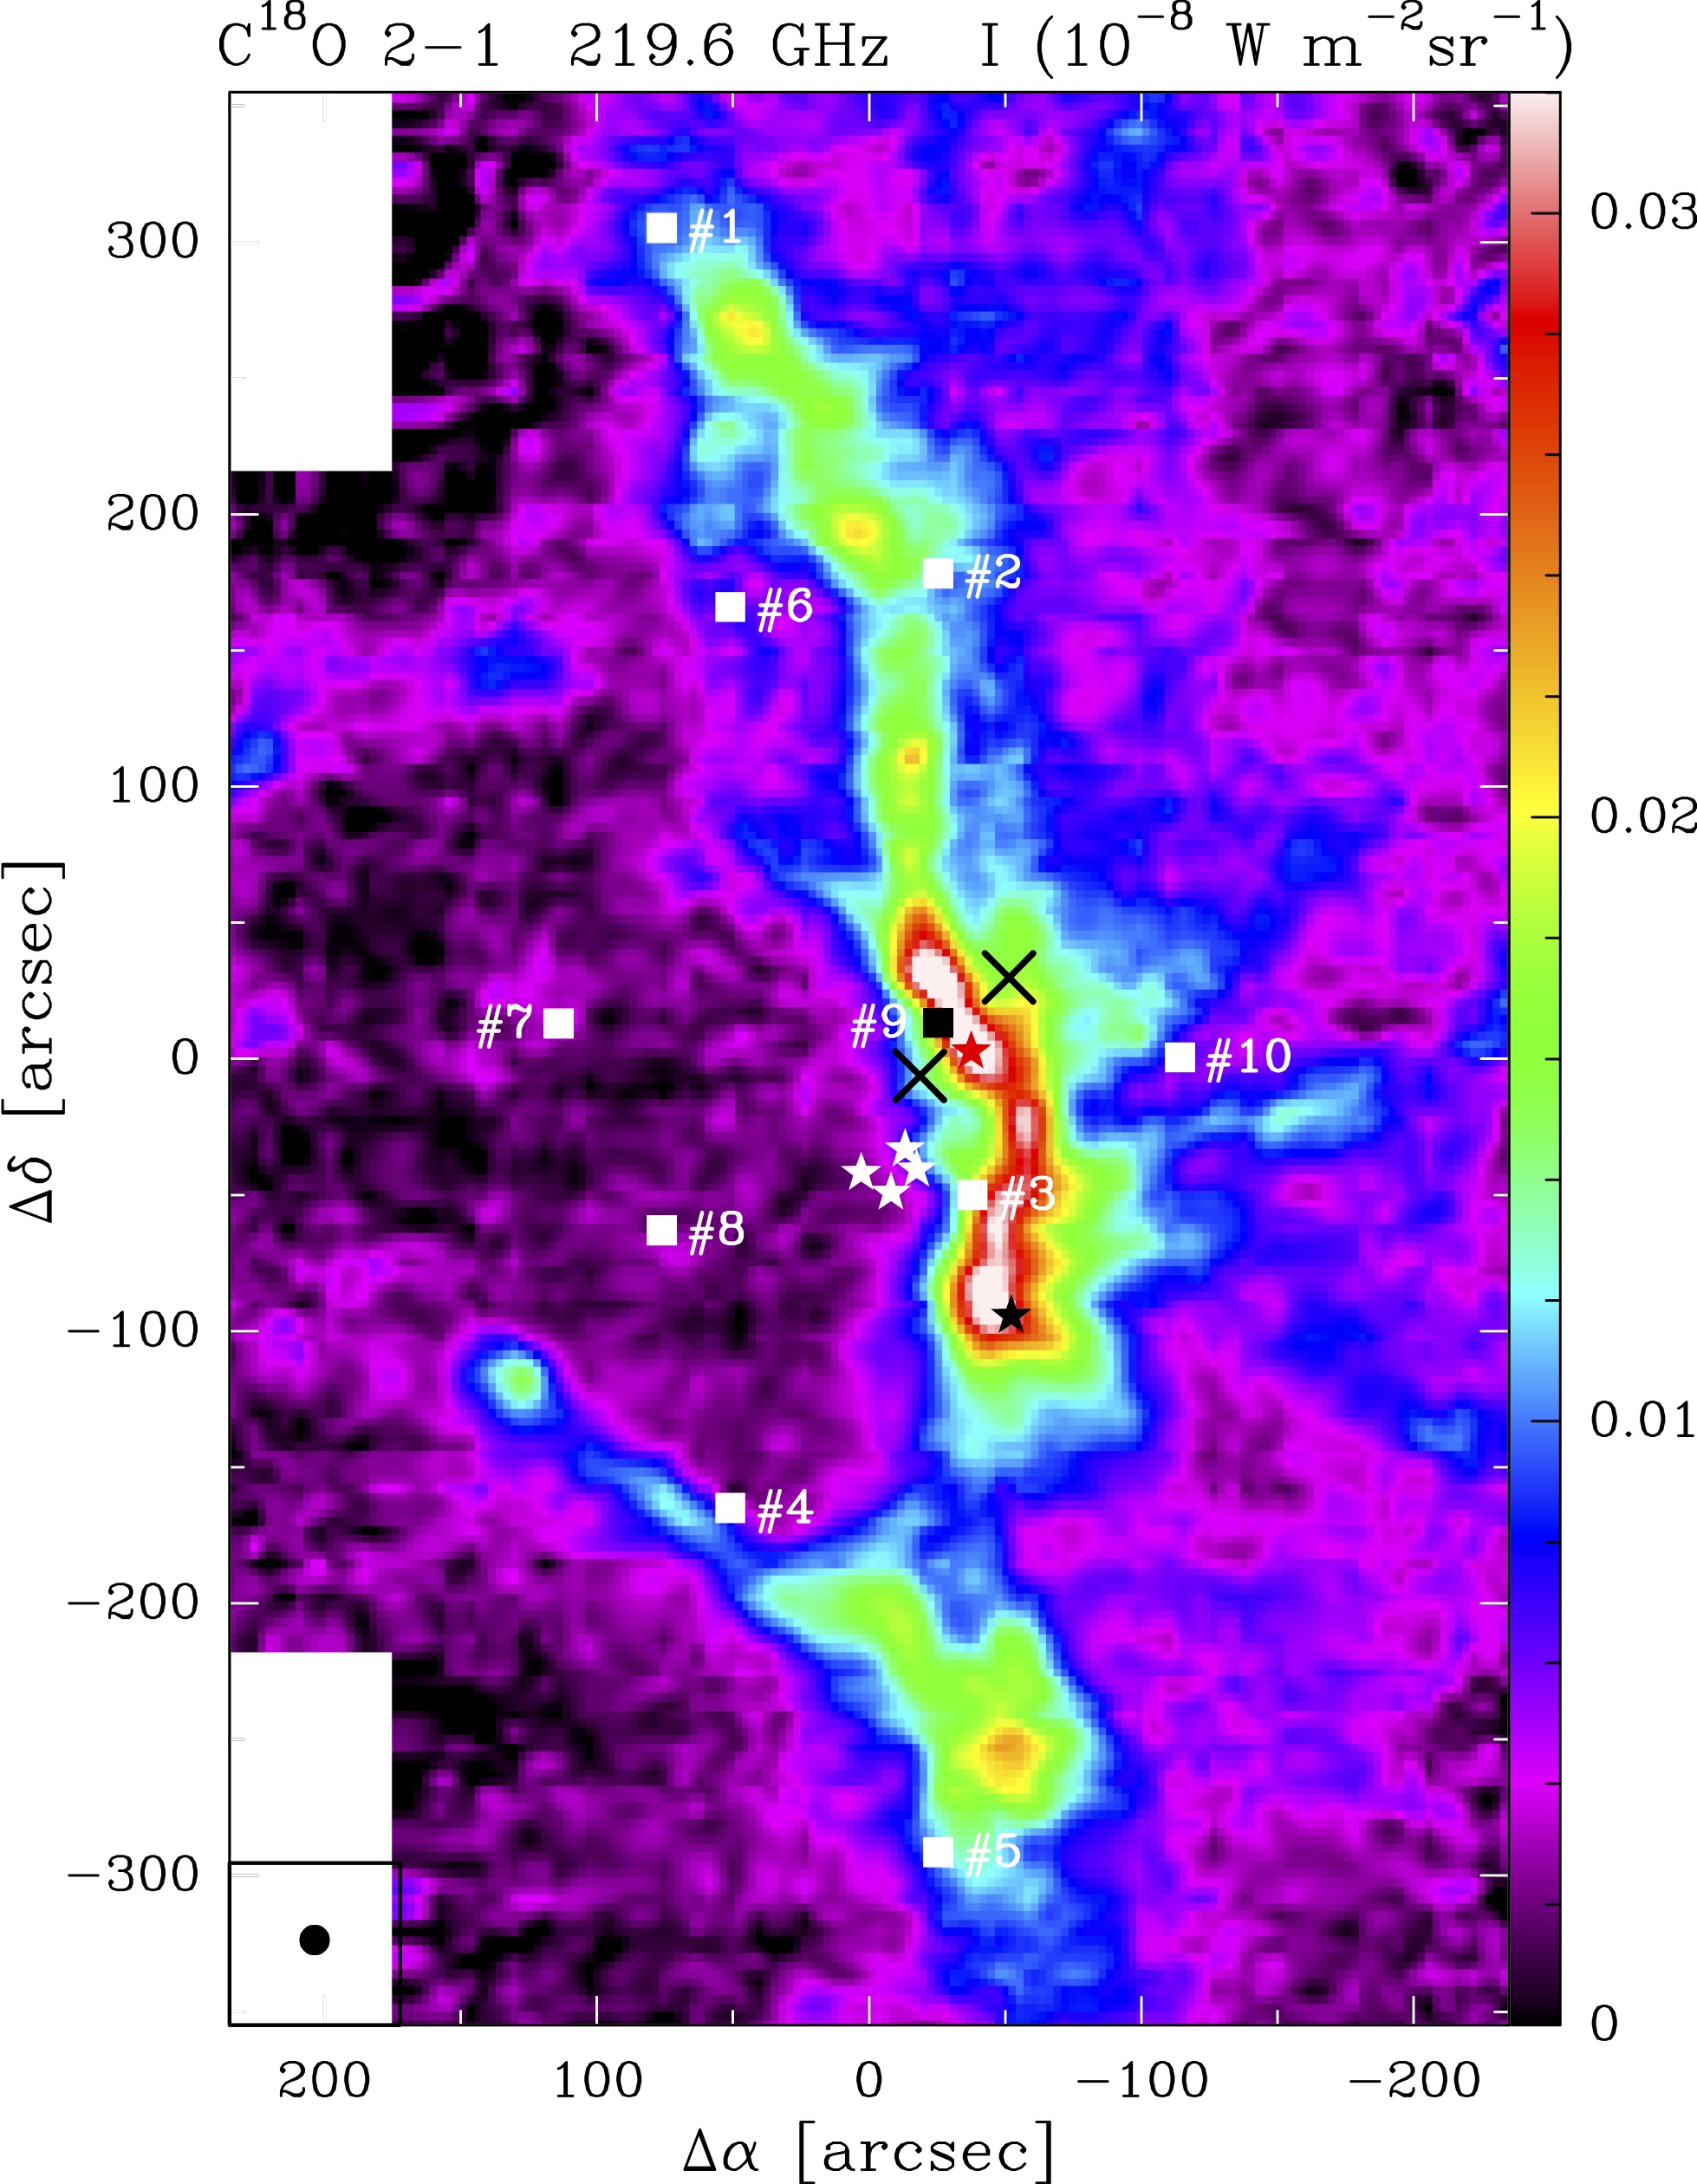
Figure 2 shows maps of the CH+ 1–0, CO 10–9, H2O 312–221, and C18O 2–1 lines. The four emission lines show remarkably different spatial distributions, emphasising the distinctive diagnostic power of different molecular species and lines. Although much less abundant than C+, the spatial distribution of CH+ ( 1–0) is similar to that of [C ii] 158 m (Figs. 3 and 14). In particular, the CH+ 1–0 intensity peaks appear very close to those of [C ii] 158 m. Hence, CH+ also traces FUV-irradiated gas at the surface of the molecular cloud. However, while the brightest regions of [C ii] 158 m emission show uniform intensities, the CH+ 1–0 line is brighter closer to the Trapezium, where the stellar FUV flux is stronger. Of all the observed species, only the CH emission shows a similar spatial distribution to that of CH+ (Fig. 12). This is a consequence of their very related chemistry in PDR gas (see Morris et al., 2016).
Despite the high excitation requirements of the CO rotational level =10 (/=304 K), thus only populated at warm gas temperatures, the CO 10–9 line emission is very extended. Indeed, it is more spatially extended than that of C18O ( 2–1) (Fig. 2). Unlike CH+ and CH, the CO 10–9 emission peaks toward BN/KL. Even if it locally peaks toward shocked gas in outflows, most of the line luminosity arises from the extended cloud component. In addition, outside the BK/KL region, the spatial distribution of the CO 10–9 emission approximately follows that of CH+ and [C ii] 158 m (see Fig. 3). Together with the narrow CO line-widths, v 3 km s-1, this suggests that most of the CO 10–9 emission arises also from the warm FUV-irradiated surface of OMC-1.
Among the species studied in this work, the detection of broad (v 30 km s-1) line-wing H2O (312-221) emission implies the presence of shocked gas activity (e.g., van Dishoeck et al., 2011, 2013). Indeed, we only detect H2O and CH3OH rotationally excited lines toward Orion S and BN/KL (Figs. 2 and 12). Both species are abundant in the ice mantles that coat grains in cold dark clouds (e.g., Gibb et al., 2004). After the onset of protostellar outflows, high-velocity shocks sputter these grain mantles and heat the gas to high temperatures. Both effects enhance the abundance of gas-phase H2O and CH3OH (e.g., Draine, 1995; Jiménez-Serra et al., 2008). In OMC-1, the low- and high-velocity outflows from BN/KL plunge into the ambient molecular cloud (Genzel & Stutzki, 1989) producing hot (from 200 to 2000 K) and dense (up to (H2)106-107 cm-3) post-shocked gas (e.g., González-Alfonso et al., 2002; Goicoechea et al., 2015a). In our HIFI maps, these extreme conditions can also be inferred from the moderately extended emission of the HCN 13–12 line (Fig. 13), a rotational transition with a critical density close to 1010 cm-3 ( , where is the collisional de-excitation rate coefficient in cm3 s-1), around BN/KL outflows. Interestingly, the observed HCN to HCO+ 6–5 line intensity ratio is 2 toward BN/KL, and 1 almost elsewhere (see Fig. 15, right). This may reflect a change in the chemistry between the extended PDR cloud component and the shocked gas in BN/KL outflows. It may also reflect the much stronger mid-IR (MIR) radiation from the BN/KL region that favors the radiative pumping of HCN through its vibrational levels and enhances the high- rotational emission (e.g, Carroll & Goldsmith, 1981; Ziurys & Turner, 1986). Finally, the maps show that both HCO+ and HCN 6–5 lines display widespread emission outside the main star-forming sites (see Fig. 12). This suggests that the gas density of the extended cloud layers traced by HCO+ and HCN 6–5 lines is moderately high.
3.2 C+, CO and CH+ line luminosities: warm gas cooling
For collisionally excited transitions and subsequent optically thin emission, the emitted line luminosity444Line-luminosity () computed in power units (W or ). The conversion from velocity-integrated line intensities =v (K km s-1) to line surface brightness (in W m-2 sr-1) is =2 , with the line frequency, and the continuum-subtracted brightness temperature. provides a measure of its gas cooling power. The [C ii] 158 m line dominates the cooling of FUV-irradiated gas. Indeed, it is the brightest of the observed lines toward OMC-1 (see Table 2), with a surface luminosity of / 140 pc-2 (Goicoechea et al., 2015b). This is more than 3 orders of magnitude more luminous than the widely observed low- CO lines (Bally et al., 1987; Berné et al., 2014). Despite being a trace species, the luminosity emitted by the CH+ 1–0 line in OMC-1 is similar to that of CO 2–1. Remarkably, the CO =10-9 line, with / 4 pc-2, is 35 times brighter than the CO =2-1 line along the mapped region, and it is more than a hundred times brighter toward specific dense PDRs like the Orion Bar. This means that the CO line cooling of warm molecular gas is dominated by the mid- lines. In addition, the average 12CO/13CO 2–1 line luminosity ratio in the map is 7; and it is lower than 15 in most of the region. This is about an order of magnitude lower than the 12C/13C isotopic ratio in Orion (67; Langer & Penzias, 1990) and implies that the 12CO 2–1 line is optically thick at 1 pc2 scales. On the other hand, the high 13CO/C18O 2–1 luminosity ratio, 9, indicates that both lines are optically thin at large scales.
Only in shocked and post-shocked gas, such as H2 Peak 1 and Peak 2 regions in BN/KL outflows, the hot molecular gas cooling is dominated by emission from FIR high- CO ( 15) and water vapor lines, and from MIR H2 lines (e.g., González-Alfonso et al., 2002; Goicoechea et al., 2015a).
| Line | () | Surface ( pc-2) |
|---|---|---|
| [C ii] 158 m | 1.7 | 1.4 |
| CO 10–9 | 5.1 | 4.0 |
| CO 2–1 | 1.5 | 1.2 |
| CH+ 1–0 | 1.4 | 1.1 |
| 13CO 2–1 | 2.1 | 1.7 |
| C18O 2–1 | 2.2 | 1.7 |
3.3 Kinematics of the FUV-irradiated Gas: velocity maps
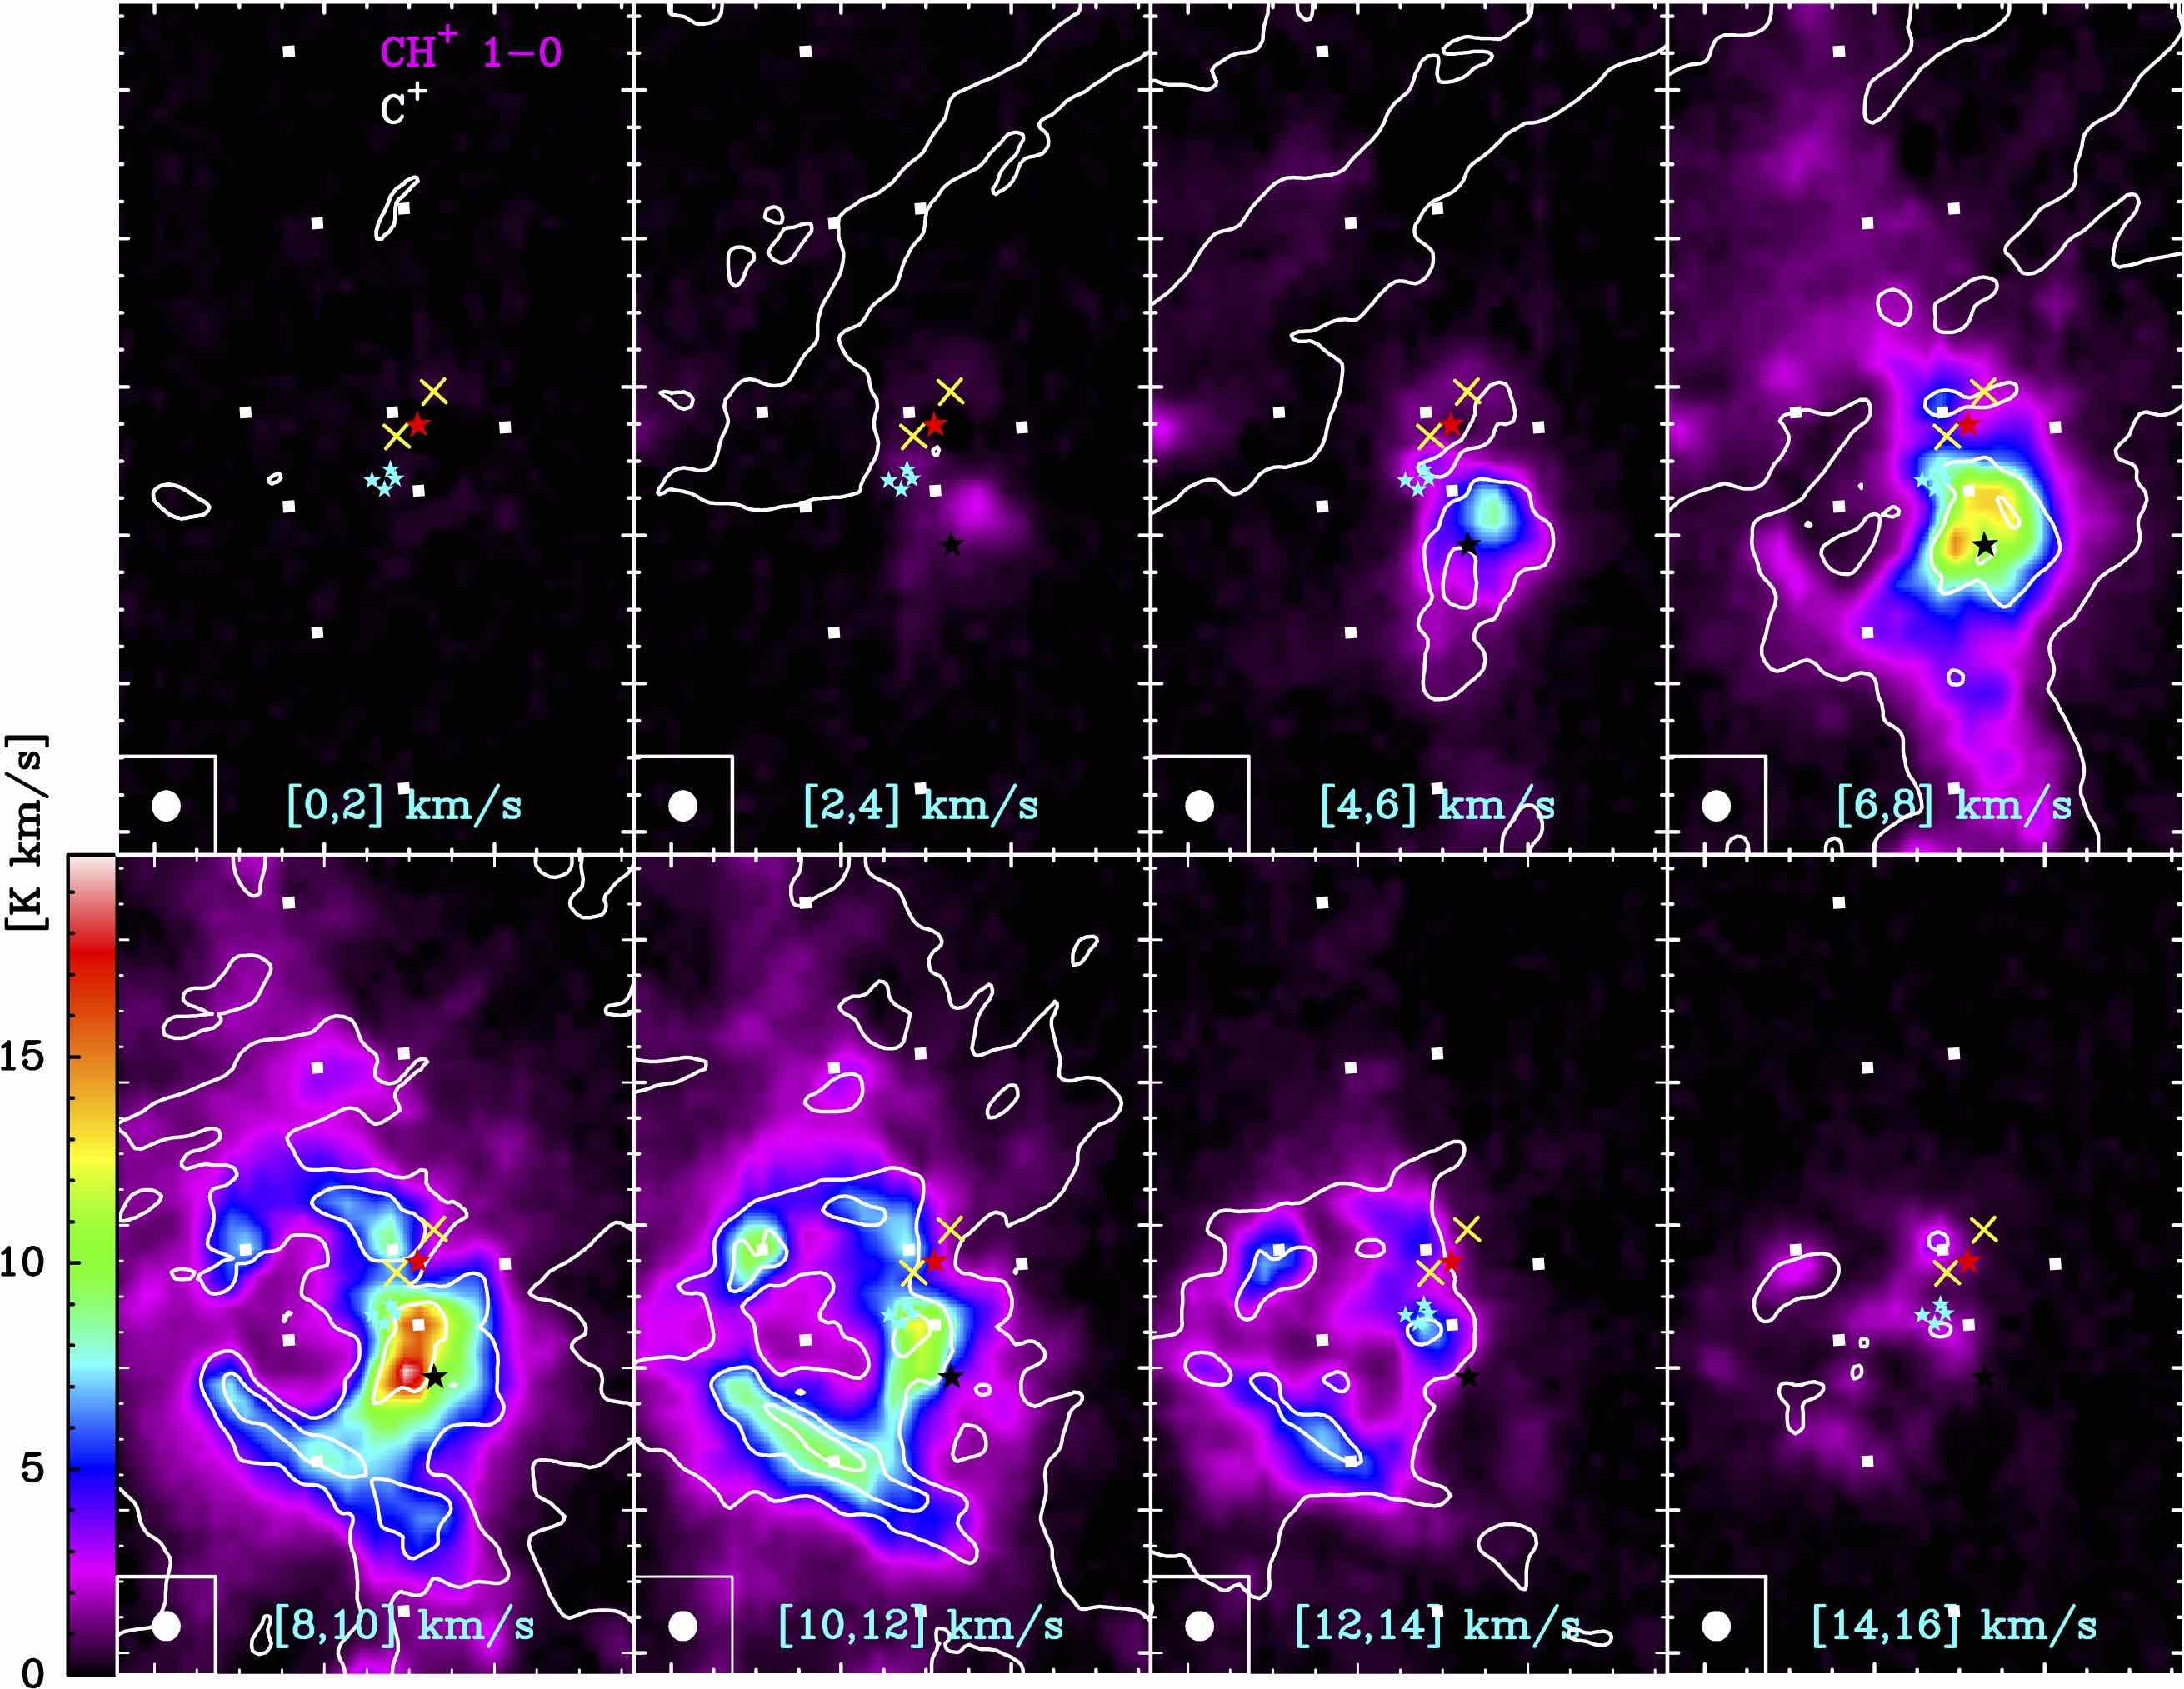
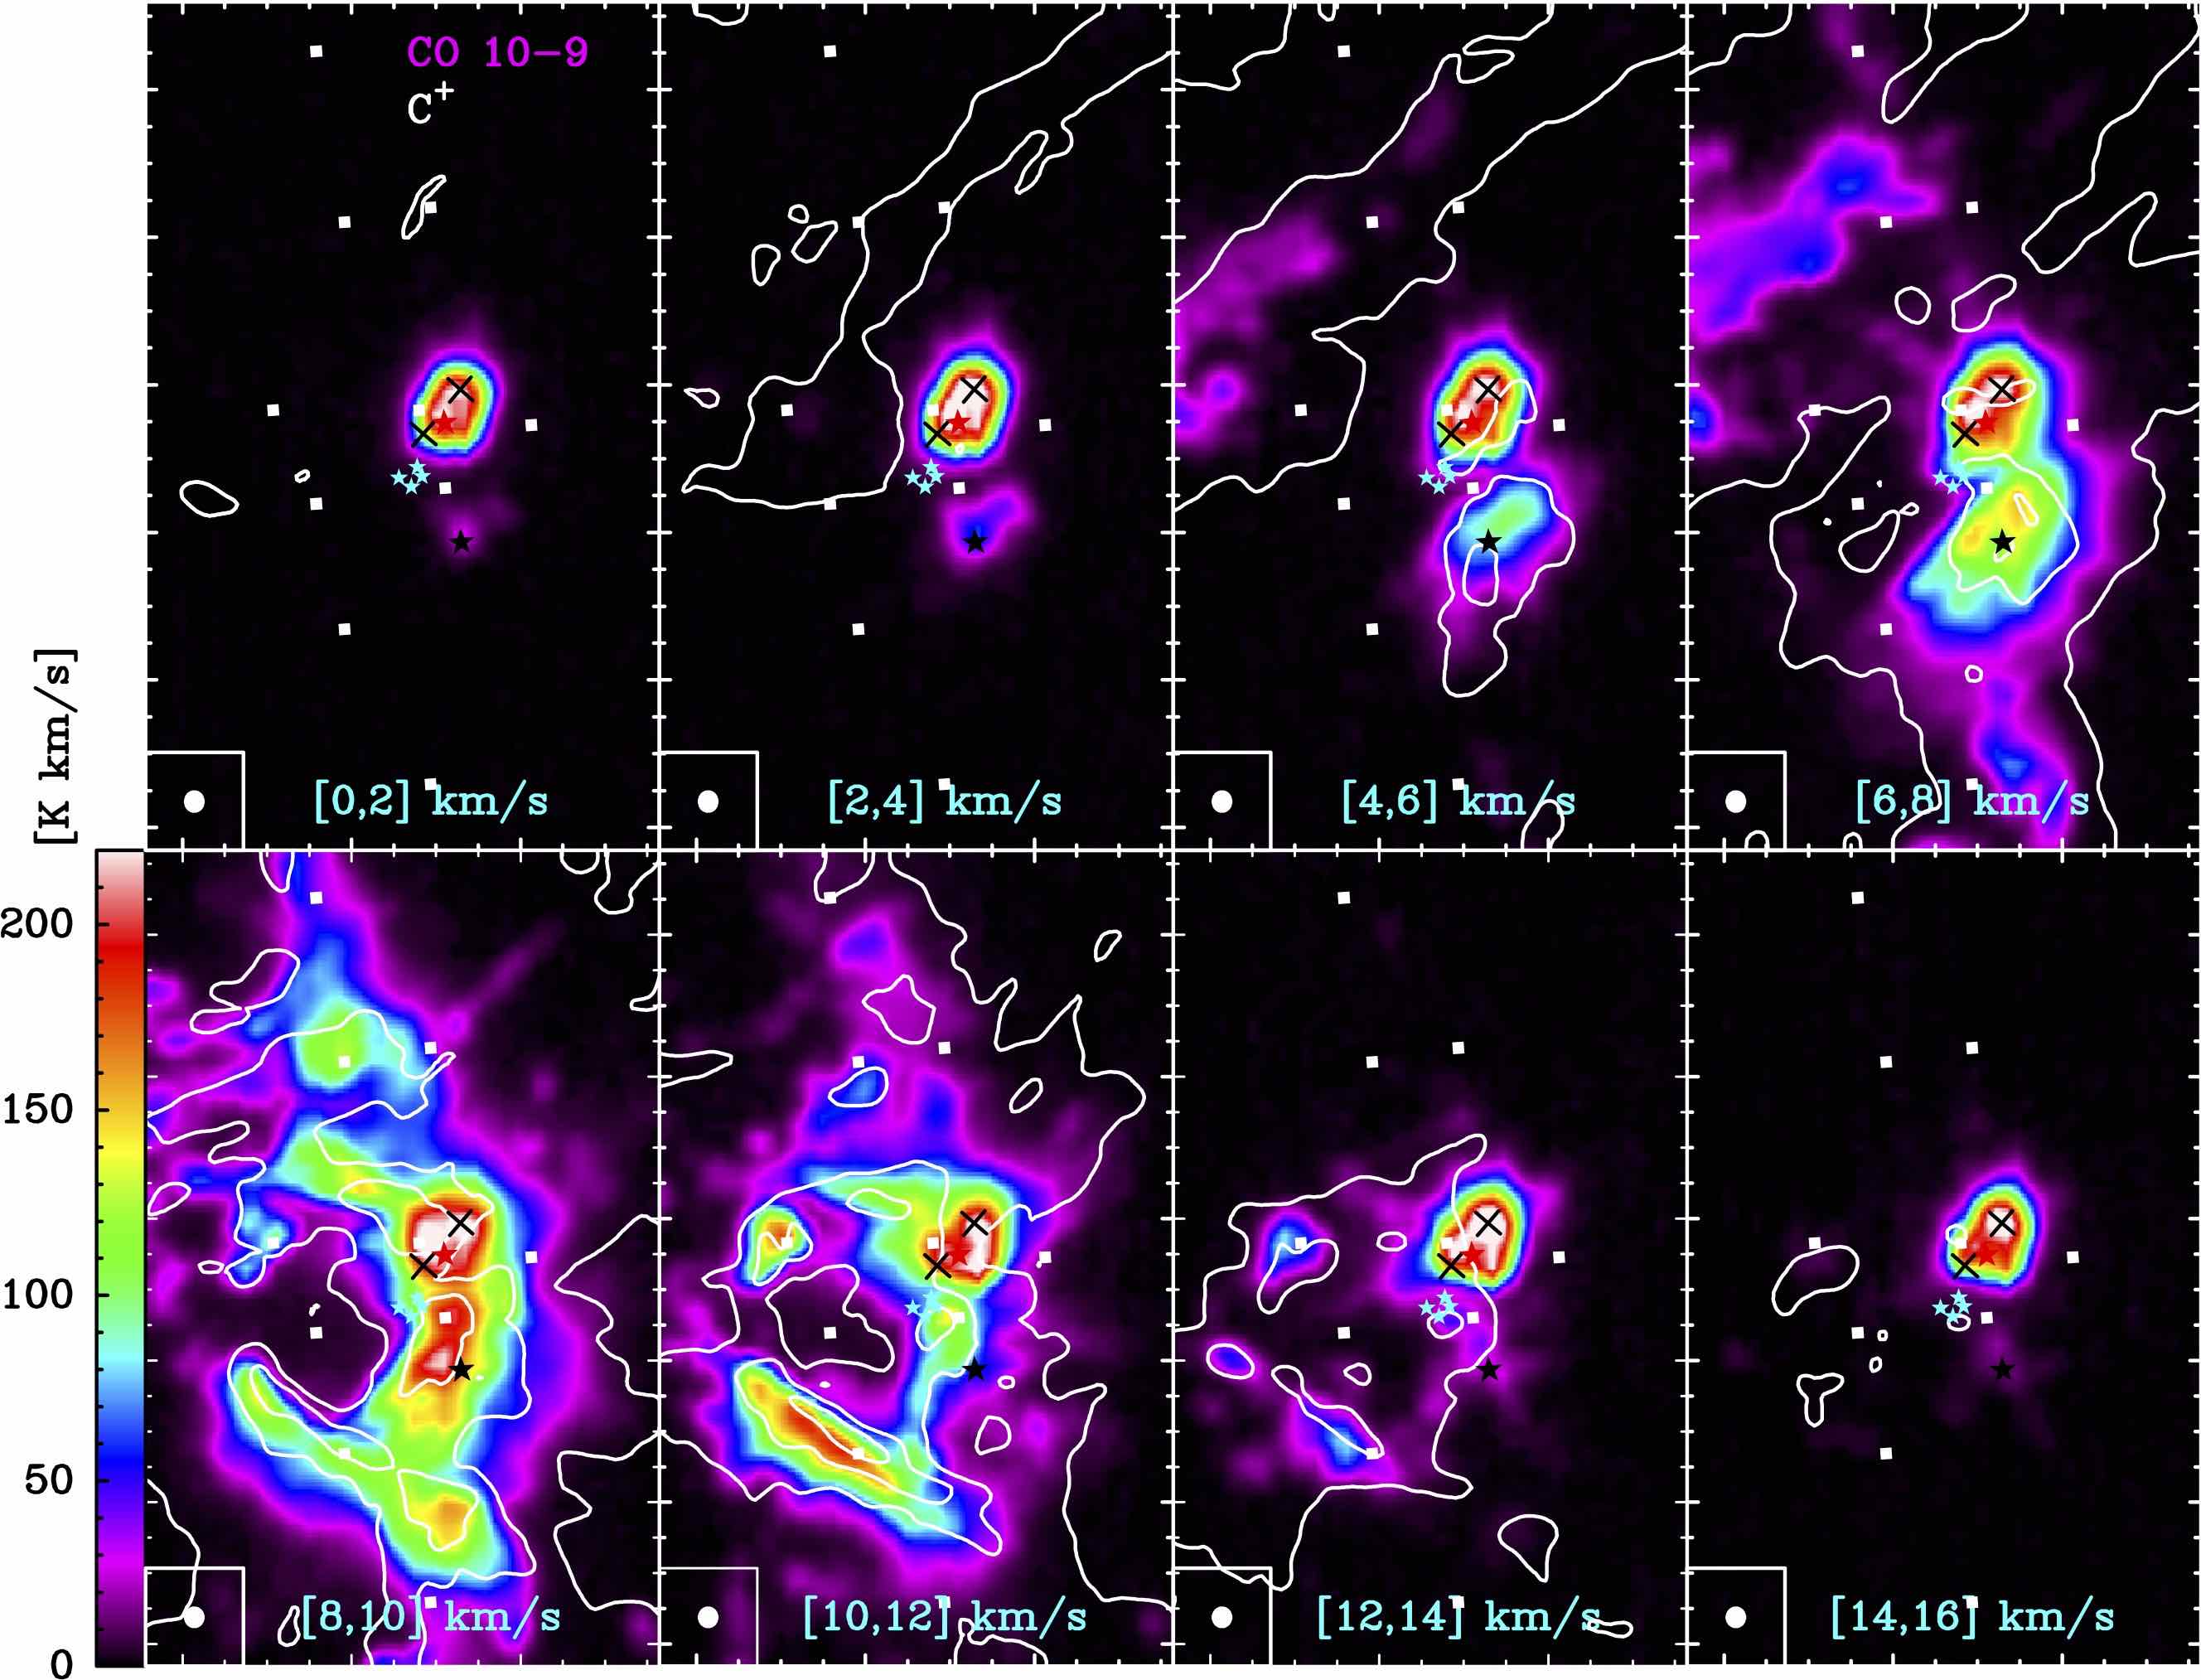
Figure 3 shows CH+ ( 1–0) and CO ( 10–9) velocity channel emission maps, both in color scale, compared to those of [C ii] 158 m in white contours. Both panels display the emission from vLSR=0 to 16 km s-1 in steps of 2 km s-1. The line centroid of the molecular cloud emission lies between vLSR8.5 and 10.5 km s-1 (e.g., Bally et al., 1987). At the angular resolution of our observations, the CH+ 1–0 and CO 10–9 emission appears at these velocities too. In most channels, there is a very good agreement between the CH+ ( 1–0) and [C ii] 158 m emission structures (C+ main spectral component; see Goicoechea et al., 2015b). The brightest CH+ emission peaks arise from the interface between the H ii region around the Trapezium and OMC-1. The spatial distribution of these bright peaks suggest a spherical shell structure, at least in projection, where the H ii region is confined by the background dense cloud. The red-shifted CH+ and C+ structures (vLSR=12 to 16 km s-1; Fig. 3) are likely compressed structures that are being pushed away from the source of FUV radiation, the Trapezium stars, and toward the molecular cloud.
In most areas, the gas kinematics revealed by the CO 10–9 and CH+ 1–0 lines is similar. Toward the more edge-on H ii/OMC-1 interfaces, the bright Orion Bar and East PDRs for example, the maps convolved to the same angular resolution show that the CO 10–9 line peaks slightly deeper inside the molecular cloud (Figs. 3 and 14). Below vLSR4 km s-1 and above 16 km s-1, the velocity channel maps show CO 10–9 emission only from Orion S and BN/KL outflows (Fig. 3). In agreement with previous observations (e.g., Tahani et al., 2016, and references therein) there is CH+ 1–0 and CO 10–9 emission component between vLSR6 and 8 km s-1 that traces the strongly irradiated surface of the cloud that envelops Orion S. In addition to lie closer to the gravitational center of the ONC (Hacar et al., 2017), Orion S seems to be a condensation detached from OMC-1 and embedded in the H ii region itself (O’Dell et al., 2009). CH+ ( 1–0) is brighter toward Orion S than toward BN/KL.
Outside these bright emission areas, there is still widespread but fainter CH+ ( 1–0) emission from the extended cloud. We note that some of the spatial distribution differences in the CH+ 1–0 and CO 10–9 velocity channel maps are due to the systematically broad CH+ 1–0 line-profiles (see next section). Only the emission from hydrogen and helium recombination lines, arising from ionized gas in the H ii region, appears at negative LSR velocities, blue-shifted by 10-20 km s-1 with respect to the molecular gas emission. This is the signature of flows of ionized gas that photoevaporate from OMC-1 and toward the observer (e.g., Genzel & Stutzki, 1989; Goicoechea et al., 2015b).
4 Analysis
4.1 Line Profiles: broad CH+ profiles at large-scales
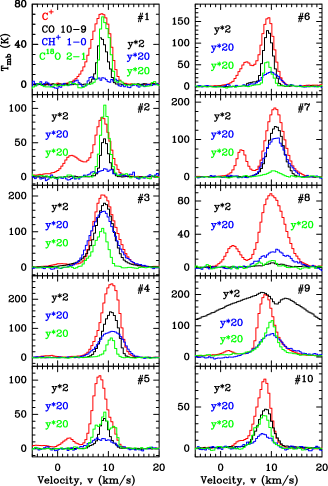
Based on our knowledge of OMC-1 (Genzel & Stutzki, 1989; Stacey et al., 1993; Bally, 2008) and to ease the interpretation of our maps, we select ten representative positions that we analyze in more detail (Table LABEL:table:positions). These positions are marked in the figures with a symbol . Figure 4 shows [C ii] 158 m (red), CO 10–9 (black), CH+ 1–0 (blue), and C18O 2–1 (green) line spectra toward these positions, extracted from maps convolved to a uniform angular resolution of 27′′ (0.05 pc). In Appendix B we show HCO+ 6–5, HCN 6–5, and C18O 2–1 spectra from maps convolved to 43′′ (Fig. 16).
Toward most positions, the observed emission is characterized by a single, roughly Gaussian line profile centered at the LSR velocities of OMC-1. The only exception is the [C ii] 158 m line, that shows a second emission component between vLSR=2 and 5 km s-1 (Goicoechea et al., 2015b). This emission arises from the near side of a 2 pc sized expanding shell of gas driven by the strong winds from star Ori C1 (Pabst et al. 2019, submitted). This foreground component, also known as Orion’s Veil, has no, or little, molecular line emission. Finally, all species that are abundant in shocked gas (CO, H2O, HCO+, HCN, etc.) display high-velocity wings toward Orion S and BN/KL (see spectra of position 9 in Figs. 4 and 16).
| Position | Offset | Comments |
|---|---|---|
| () | Northern ridge | |
| () | North-west ridge edge | |
| () | CH+ peak near Trapezium | |
| () | Orion Bar PDR | |
| () | Southern edge | |
| () | Northern lane | |
| () | East PDR | |
| () | Toward dense H ii region | |
| () | BN-KL outflows | |
| () | Western edge |
C+ and CH+ line profiles show a slightly different behaviour among them. While the [C ii] 158 m line is narrow toward BN/KL outflows, the CH+ 1–0 profile displays a weak red-wing emission. This demonstrates that the outflows around BN/KL are illuminated by a moderate FUV radiation field (Chen et al., 2014; Goicoechea et al., 2015a; Melnick & Kaufman, 2015). It has been suggested that the available C+ in irradiated dense shocked gas must be quickly converted into CH+ (Morris et al., 2016). Nevertheless, the CH+ 1–0 wing is faint compared to CO or H2O lines, and is only restricted to low velocities.
Table 4 tabulates the velocity centroid, obtained from Gaussian fits, toward the ten representative positions. All lines show, within fit errors and spectral resolution, similar velocity centroids. Table 5 tabulates the line-width for the same set of lines and positions; there is more scatter in this case. In principle, the gas velocity dispersion is determined by the gas temperature, through the thermal broadening caused by elastic collisions with other species, and by gas macroscopic motions: turbulence, outflows, etc. The narrowest measured widths (v 3 km s-1) are those of C18O lines, predominantly arising from FUV-shielded and colder gas. At large spatial scales, the CO 10–9 line also displays narrow line-widths (v 3 km s-1) except toward BN/KL and Orion S outflows. This confirms that the bulk of the mid- CO emission arises from relatively quiescent gas and not from fast shocks (see also Wilson et al., 2001; Peng et al., 2012).
Assuming optically thin emission and negligible non-thermal line broadening, the observed CO 10–9 line-width sets an upper limit value to the emitting-gas temperature of 450 K. Taking a more realistic non-thermal velocity dispersion of =1 km s-1 (vnth,FHWM=2.355, where FHWM refers to the full width at half maximum) for the mid- CO-emitting PDR gas (see next Section), one obtains 150 K. These values are consistent with the lower limit to the gas temperature provided by the CO 2–1 line intensity peak ( in K; see map in Fig. 18). Because the CO 2–1 emission is optically thick in most of the field, one obtains (CO 2-1) .
The observed [C ii] 158 m line-peak temperatures, however, suggest that the C+-emitting layers, the atomic PDR, are hotter (300 K; Goicoechea et al., 2015b) than the CO-emitting layers located slightly deeper into the PDR (see model predictions in Fig. 10). This difference is the signature of sharp temperature gradients: from the H ii region, the atomic PDR and molecular PDR, to the shielded cloud interior.
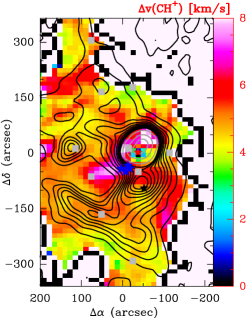
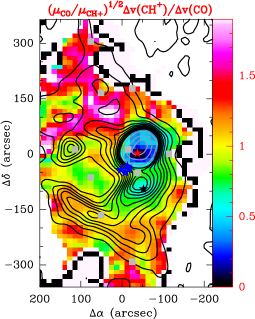
CH+ ( 1–0) shows the broadest line-widths over the observed field, broader than [C ii] 158 m and CO 10–9 lines. Figure 5 (left) shows a map of the CH+ 1–0 line-widths in the region (v5-6 km s-1). Unlike other species, the broad CH+ 1–0 line-profiles are quite uniform along the mapped area. Figure 5 (right) shows a map of the CH+ ( 1–0) to CO ( 10–9) line-width ratio corrected by their different molecular masses, =1.47. Only toward BN/KL and Orion S, the ratio is much lower than one. In the extended cloud component, the line-width ratio is always greater than one. These maps thus confirm the broader CH+ line profiles, not only toward local bright and dense H ii/PDR interfaces (Nagy et al., 2013; Morris et al., 2016; Parikka et al., 2017) but at large-spatial scales, where the CH+ ( 1–0) emission is certainly optically thin and not affected by opacity broadening. Taking =1 km s-1, the observed broad CH+ 1–0 line-widths would imply unrealistically high gas temperatures, from 5500 to 8600 K. As previously discussed in the literature (Black, 1998; Nagy et al., 2013; Godard & Cernicharo, 2013; Goicoechea et al., 2017), this broadening is likely related to the high reactivity of the ion, and to the exothermic route ( 5360 K) that forms CH+ from reaction C++H2 ( 1). The CH+ lifetime in dense PDRs is so short that the newly formed molecular ion does not have time to thermalize its motions through elastic collisions to a Maxwellian velocity distribution at . In this interpretation, part of the formation exothermicity goes into excitation and translational motion. Hence, the broad CH+ line-widths would be related to the excess of energy upon formation (Nagy et al., 2013). We see that in high-mass star forming regions like OMC-1, sources of strong FUV radiation, this mechanism operates at large-spatial scales.
4.2 Physical conditions of the extended warm gas
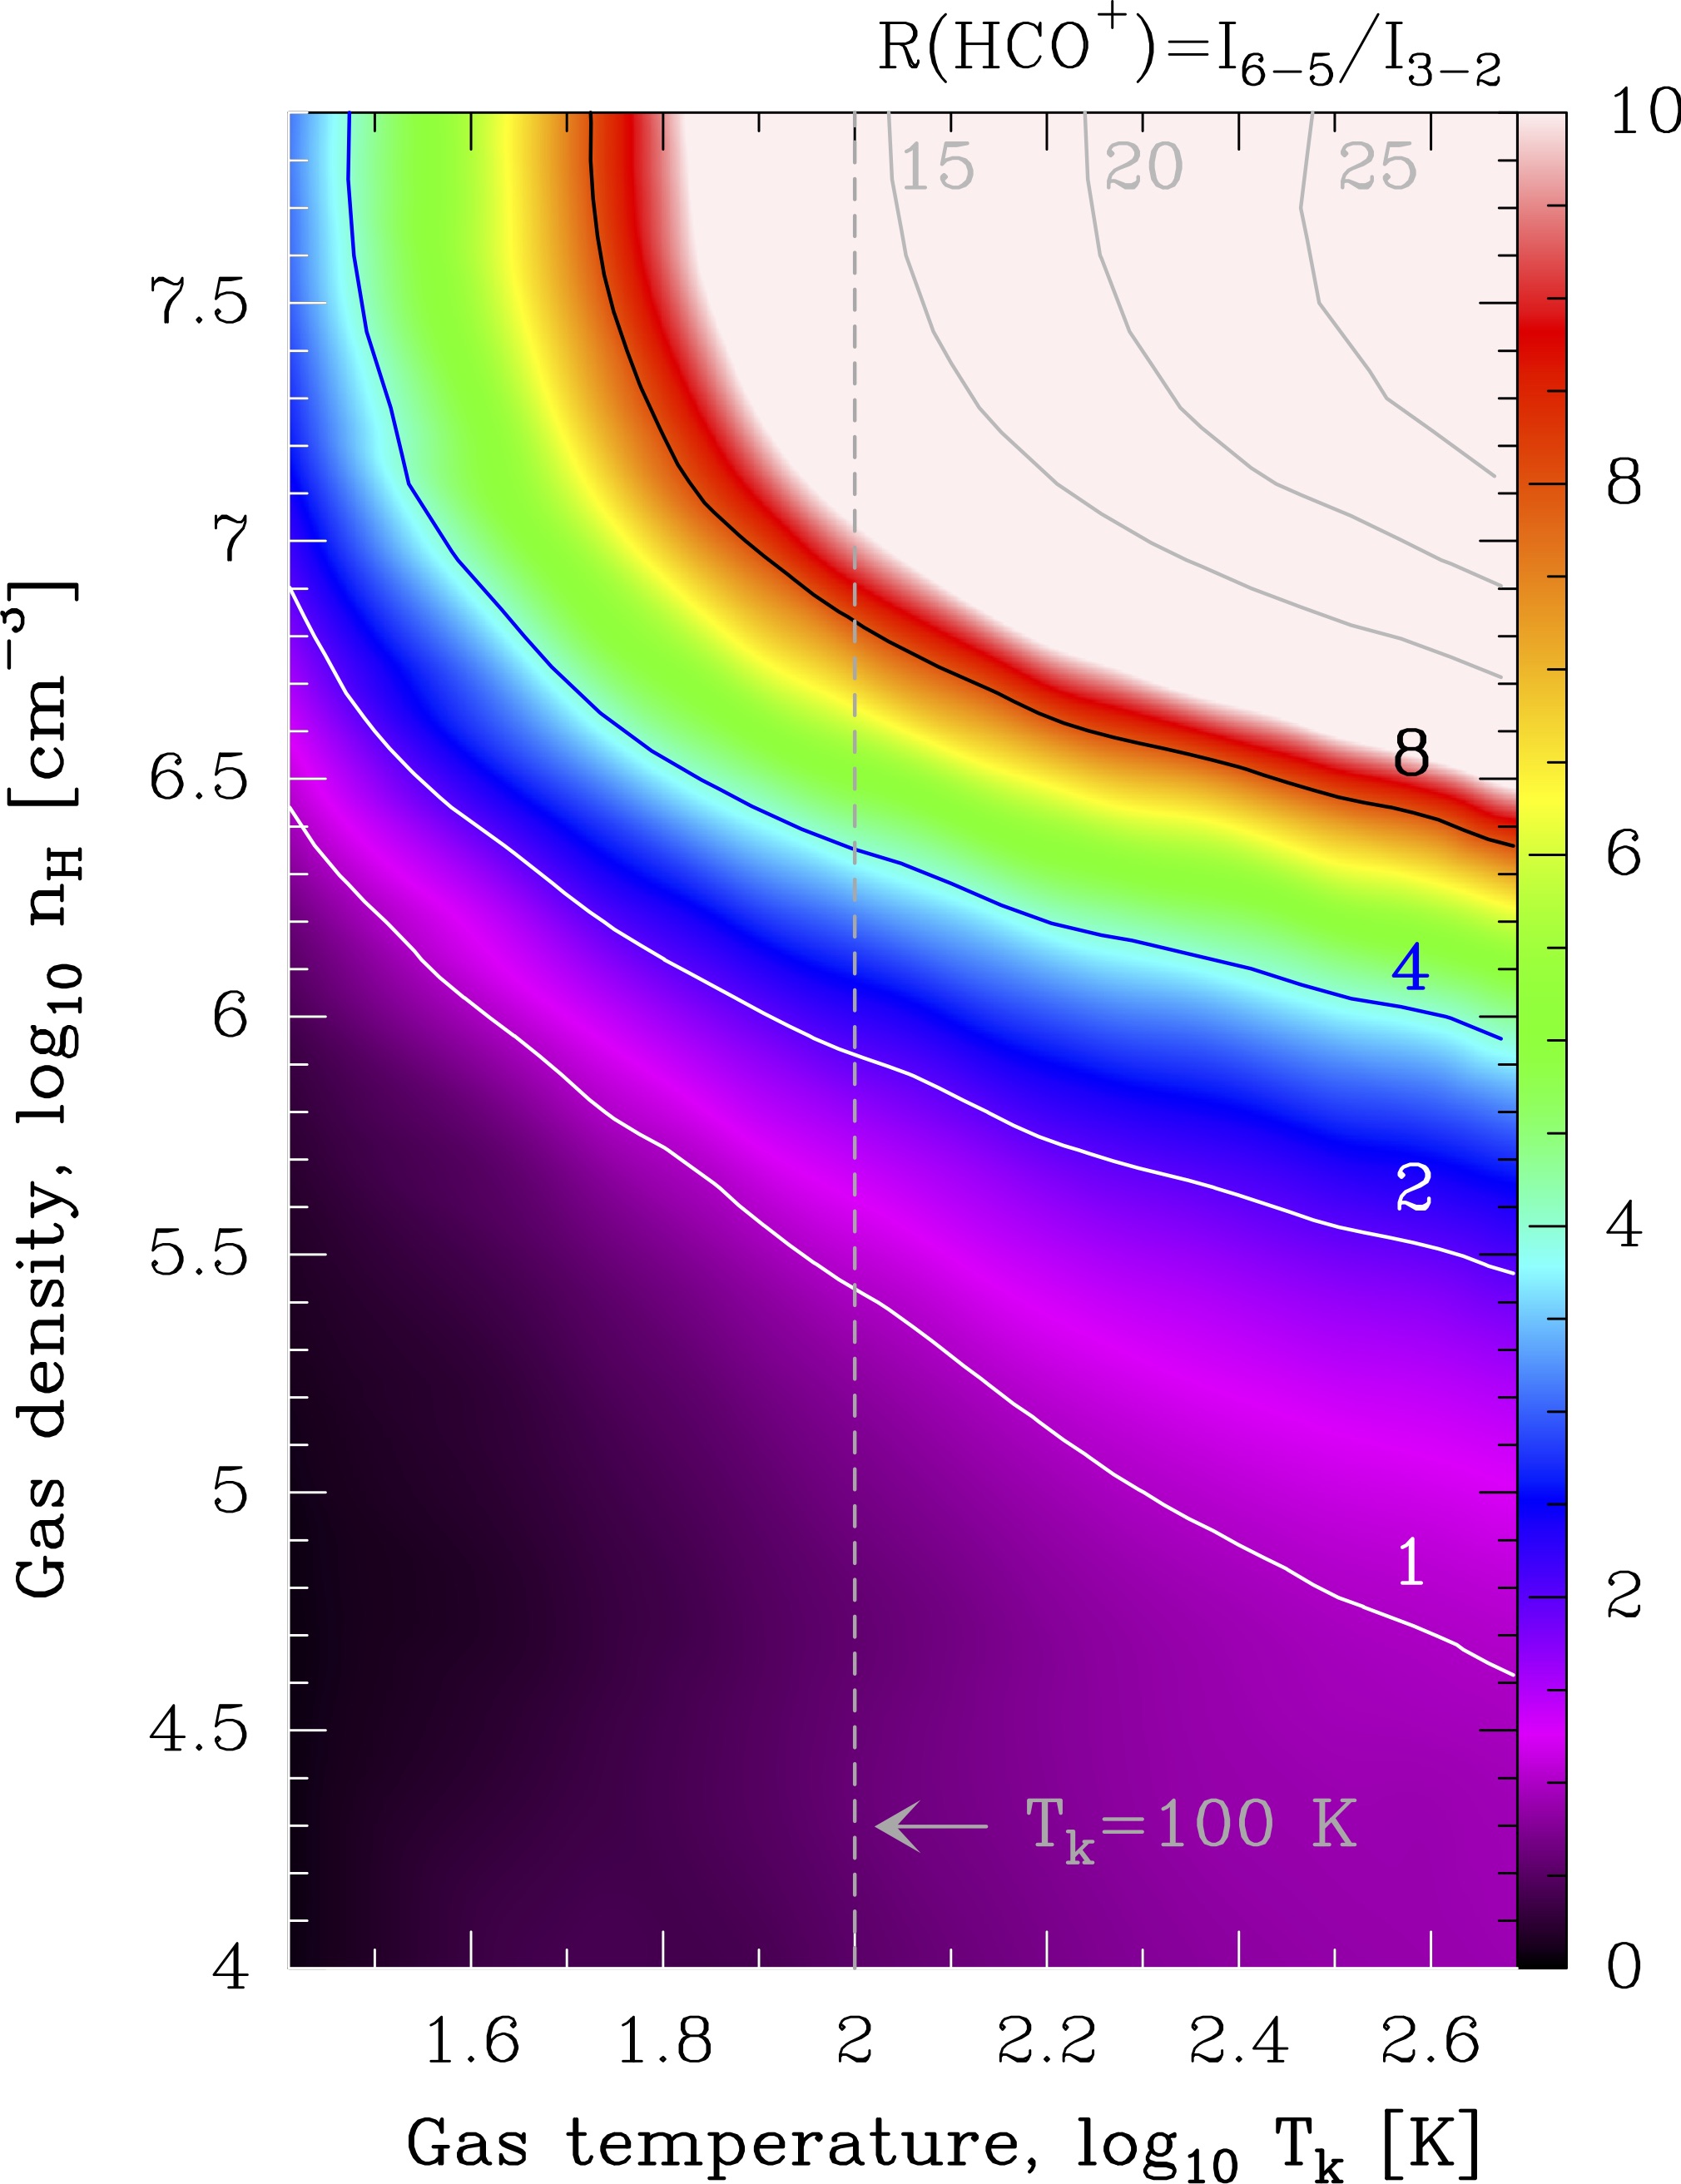
In this section we estimate the average physical conditions of the extended warm molecular gas traced by the observed submm lines. For high-dipole molecules such as HCO+, having high critical density transitions, the intensity ratio of two rotational lines is a good tracer of gas density variations. On the other hand, for low-dipole moment molecules such as CO, and for gas densities comparable or higher than the critical density, line intensity ratios trace gas temperature variations.
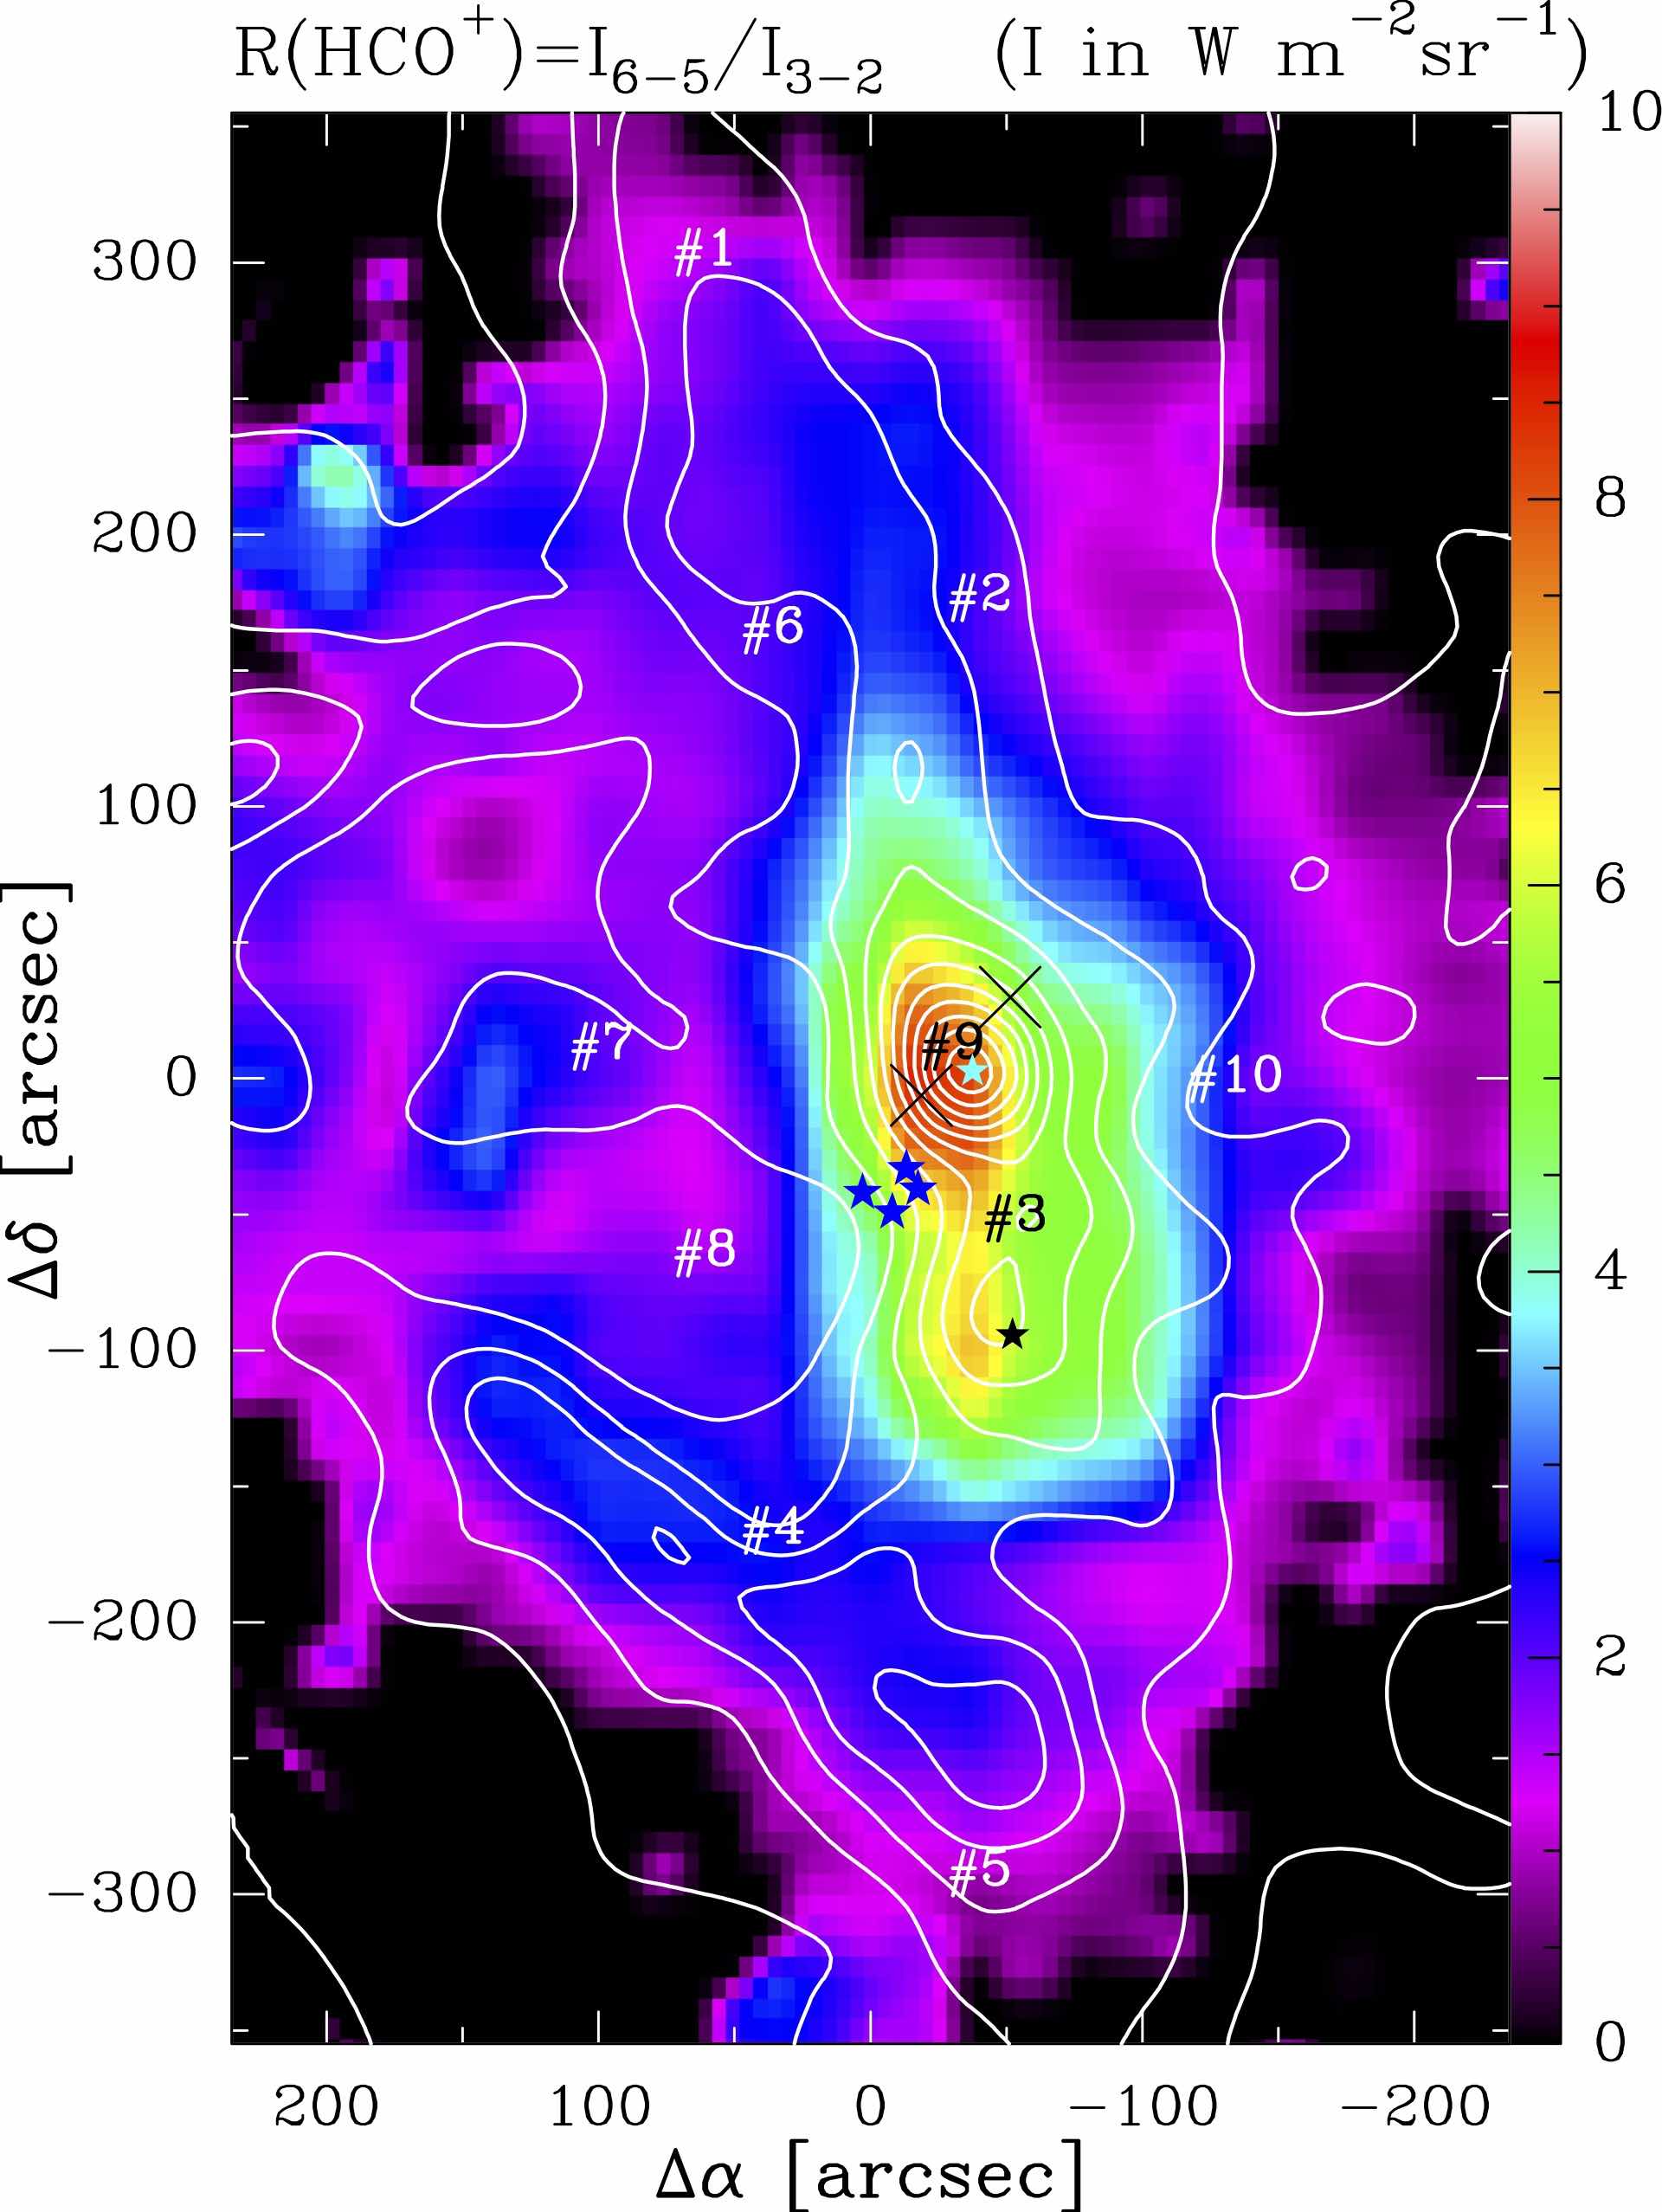
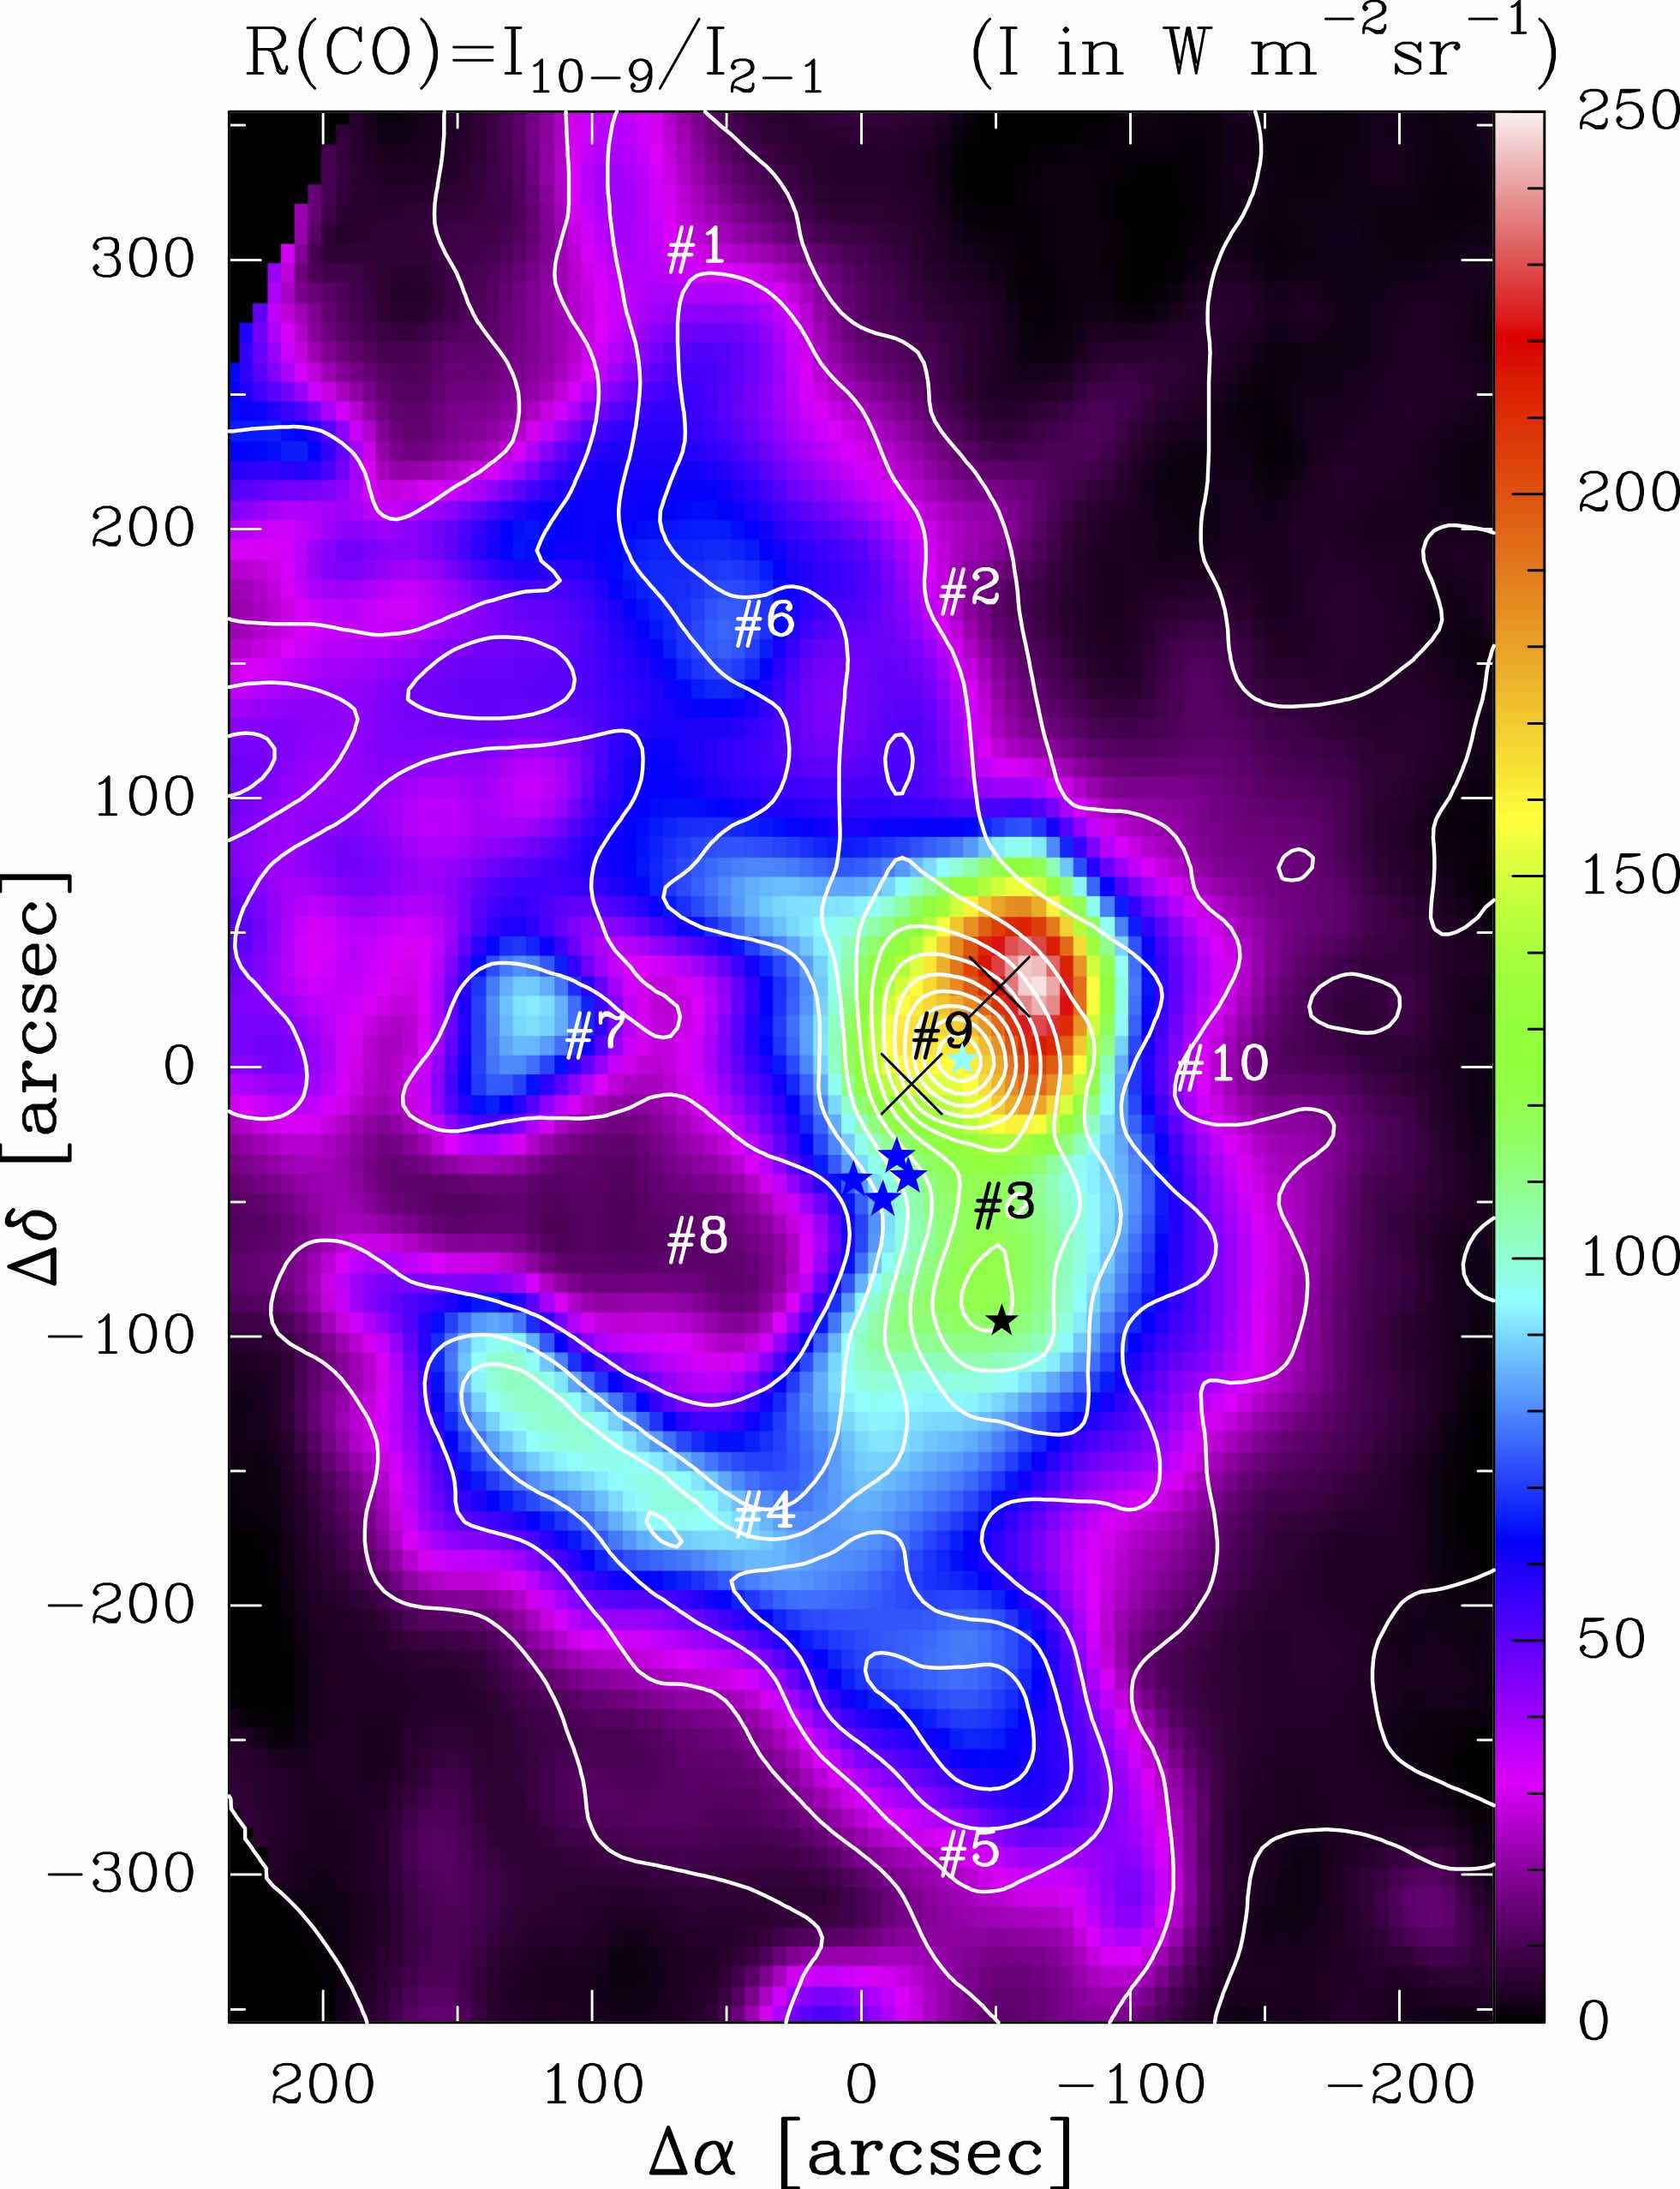
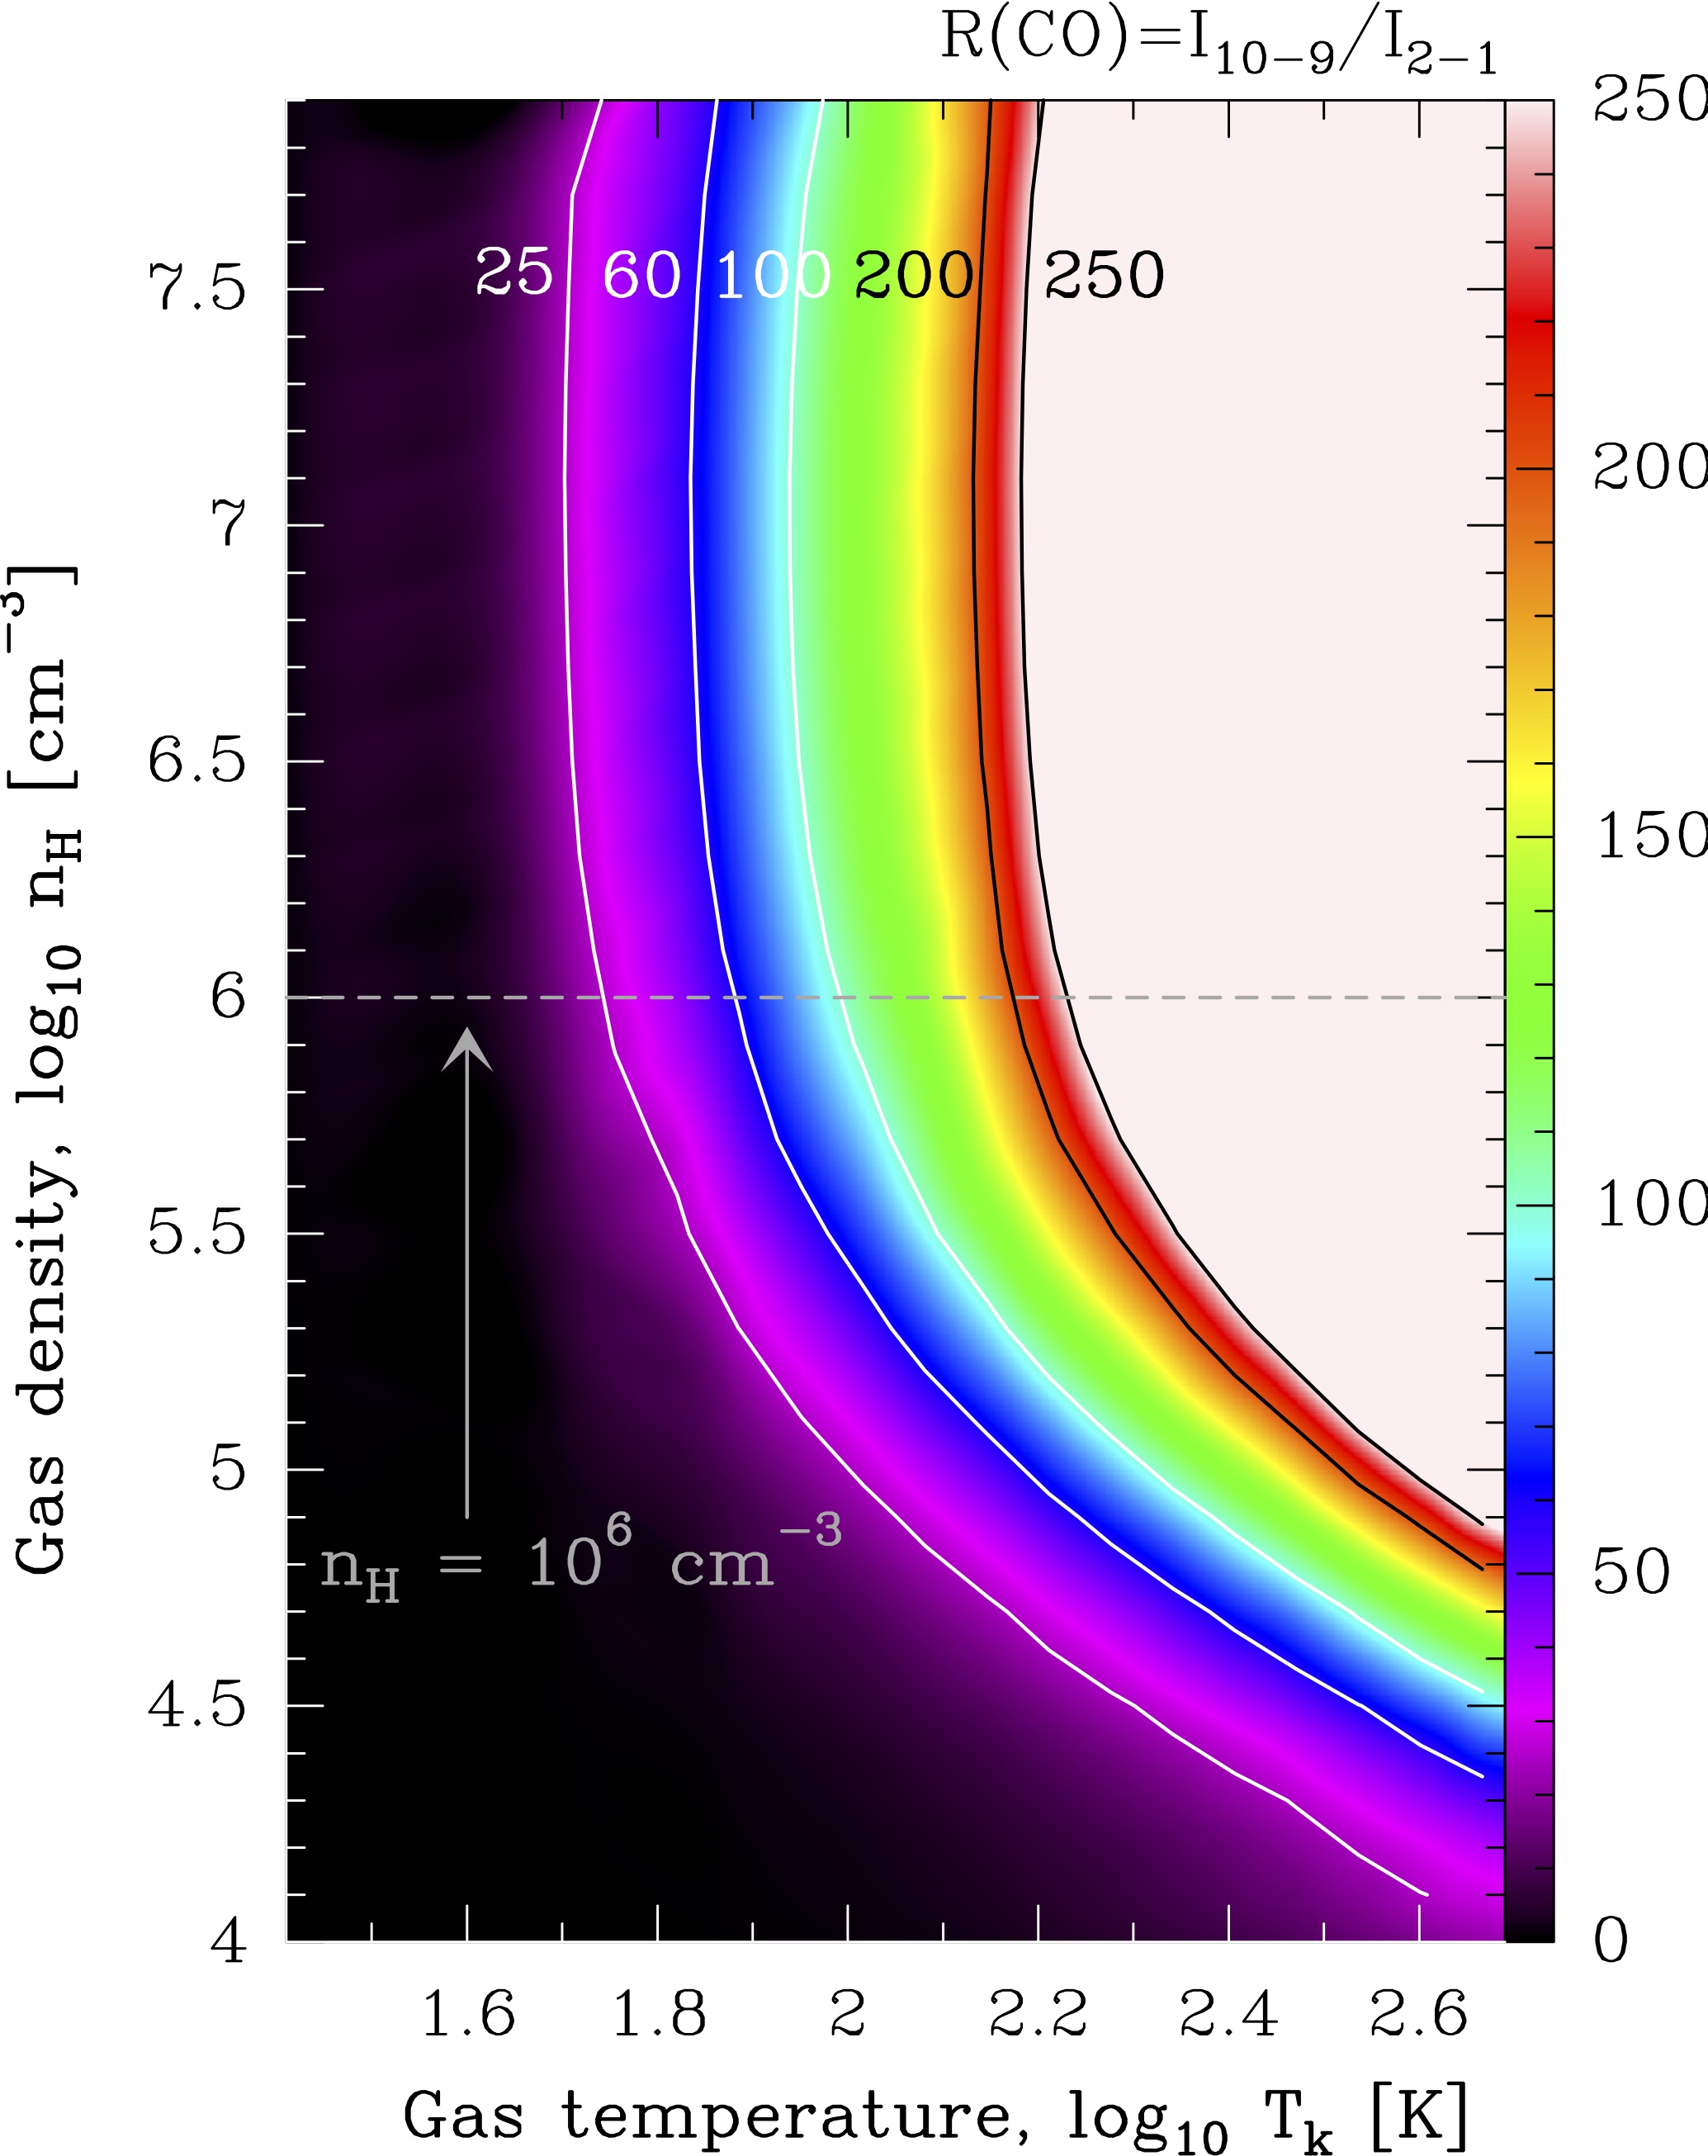
Figure 6 shows maps of the HCO+ 6-5/3-2 and CO 10-9/2-1 line intensity ratios, obtained from integrated intensities in units of W m-2 sr-1. To invert the observed ratios into a range of beam-averaged gas temperatures, , and densities, =(H)+2(H2), we compare the observed line intensities with predictions of a grid of nonlocal and non-LTE excitation models (Monte Carlo radiative transfer code of Goicoechea et al., 2006). The model accounts for line trapping, collisional excitation, and radiative excitation by absorption of the 2.7 K cosmic background and by the dust continuum emission. In FUV-illuminated gas, the high electron abundance, up to (C+)10-4 for standard cosmic ray ionization rates, can play an important role in the collisional excitation of high-dipole moment molecules as the collisional rates compete with those of H2 and H (e.g., van der Tak et al., 2012; Goldsmith & Kauffmann, 2017). Here we assume an ionization fraction of 10-4 (roughly the C+ abundance in PDR gas), which means that our derived values are lower limits if is not that high. We used HCO+–H2 and HCO+– inelastic collisional rates from Flower (1999), Faure & Tennyson (2001), and Fuente et al. (2008). For CO, we just used the rates for CO–H2 collisions from Yang et al. (2010).
Regarding radiative excitation, we modelled the frequency-dependent dust continuum emission as a modified black body with an effective dust grain temperature of 55 K, spectral emissivity index of 2, and a dust opacity 0.05 at a reference wavelength of 160 m. These FIR and submm illumination conditions are typical of the Orion Bar PDR (Arab et al., 2012) but we note that submm pumping plays a negligible role in the excitation of the extended CO and HCO+ emission. This is, however, not the case of H2O or OH excitation toward BN/KL, where the dust thermal continuum is very strong (e.g., González-Alfonso et al., 2002; Melnick et al., 2010; Goicoechea et al., 2015a). Our model includes thermal, turbulent, and line opacity broadening. The non-thermal velocity dispersion that reproduces the observed line-widths is typically 1 km s-1. We adopted column densities of (CO)=51017 cm-2 and (HCO+)=51013 cm-2 extracted from our line survey toward the edge of the Orion Bar (e.g., Cuadrado et al., 2015; Goicoechea et al., 2017).
Figure 6 (right panels) shows synthetic line ratios in the plane log ()–log (), with same color scale as in the maps, for a grid of models with ranging from 104 to 108 cm-3, and from 25 to 500 K. The lowest measured HCO+ 6–5/3–2 intensity ratio in the map is 1 (magenta regions, e.g., positions 1 and 5). This ratio imposes a minimum gas density of a few 105 cm-3 for 150 K. Bright edge-on H ii/OMC-1 interfaces such as the Orion Bar (position 4) or the East PDR (position 7) require higher gas temperatures and densities (100 K and 106 cm-3). Closer to the Trapezium cluster and around Orion S (position 3), densities increase (reaching 107 cm-3). The shocked gas associated with Orion BN/KL (position 9) shows the highest excitation conditions in both and , but we stress again that most of the line integrated emission in the map arises from the irradiated cloud surface. This is an extended but thin gas layer (see PDR models in Sect. 5.1) characterized by high thermal pressures, in the range cm-3 K according to our models. The presence of a layer of high-density gas close to the interface between the H ii region and the molecular cloud was anticipated by Rodríguez-Franco et al. (1998, 2001) from observations of the CN radical, which predominantly arises, but not only (e.g., Pety et al., 2017), from PDR gas. They also estimated gas densities ranging from 105 cm-3 toward the extended cloud, to several 106 cm-3 toward the Trapezium region. They could not, however, constrain the gas temperatures.
Using our CO maps, we estimate the mass contained in the high pressure molecular PDR layer, (H2), along OMC-1. Assuming (10–9) (2–1) (see map in Fig. 18) and that the CO = 10–9 emission is optically thin and only arises from the cloud surface, we convert the CO = 10–9 integrated intensity map into a CO column density map, (CO), and then into a total column density map as = (CO)(CO) 10-4(CO) (see Appendix C for details). With these assumptions, we obtain (H2) 150 . Allowing a opacity correction factor toward lines of sight with 1, we then derive (H2) 300 . This warm molecular gas mass is similar to the 200 mass that arises from the [C ii] 158 m emitting gas (the atomic PDR; Goicoechea et al., 2015b). It represents between 5 and 10 of the total gas mass in OMC-1 (Goicoechea et al., 2015b). Finally, using / 3.510-22 mag cm2, appropriate to Orion, we derive that the average extinction thickness traced by the CO = 10–9 line (roughly the high pressure gas layer) is 3–6 mag.
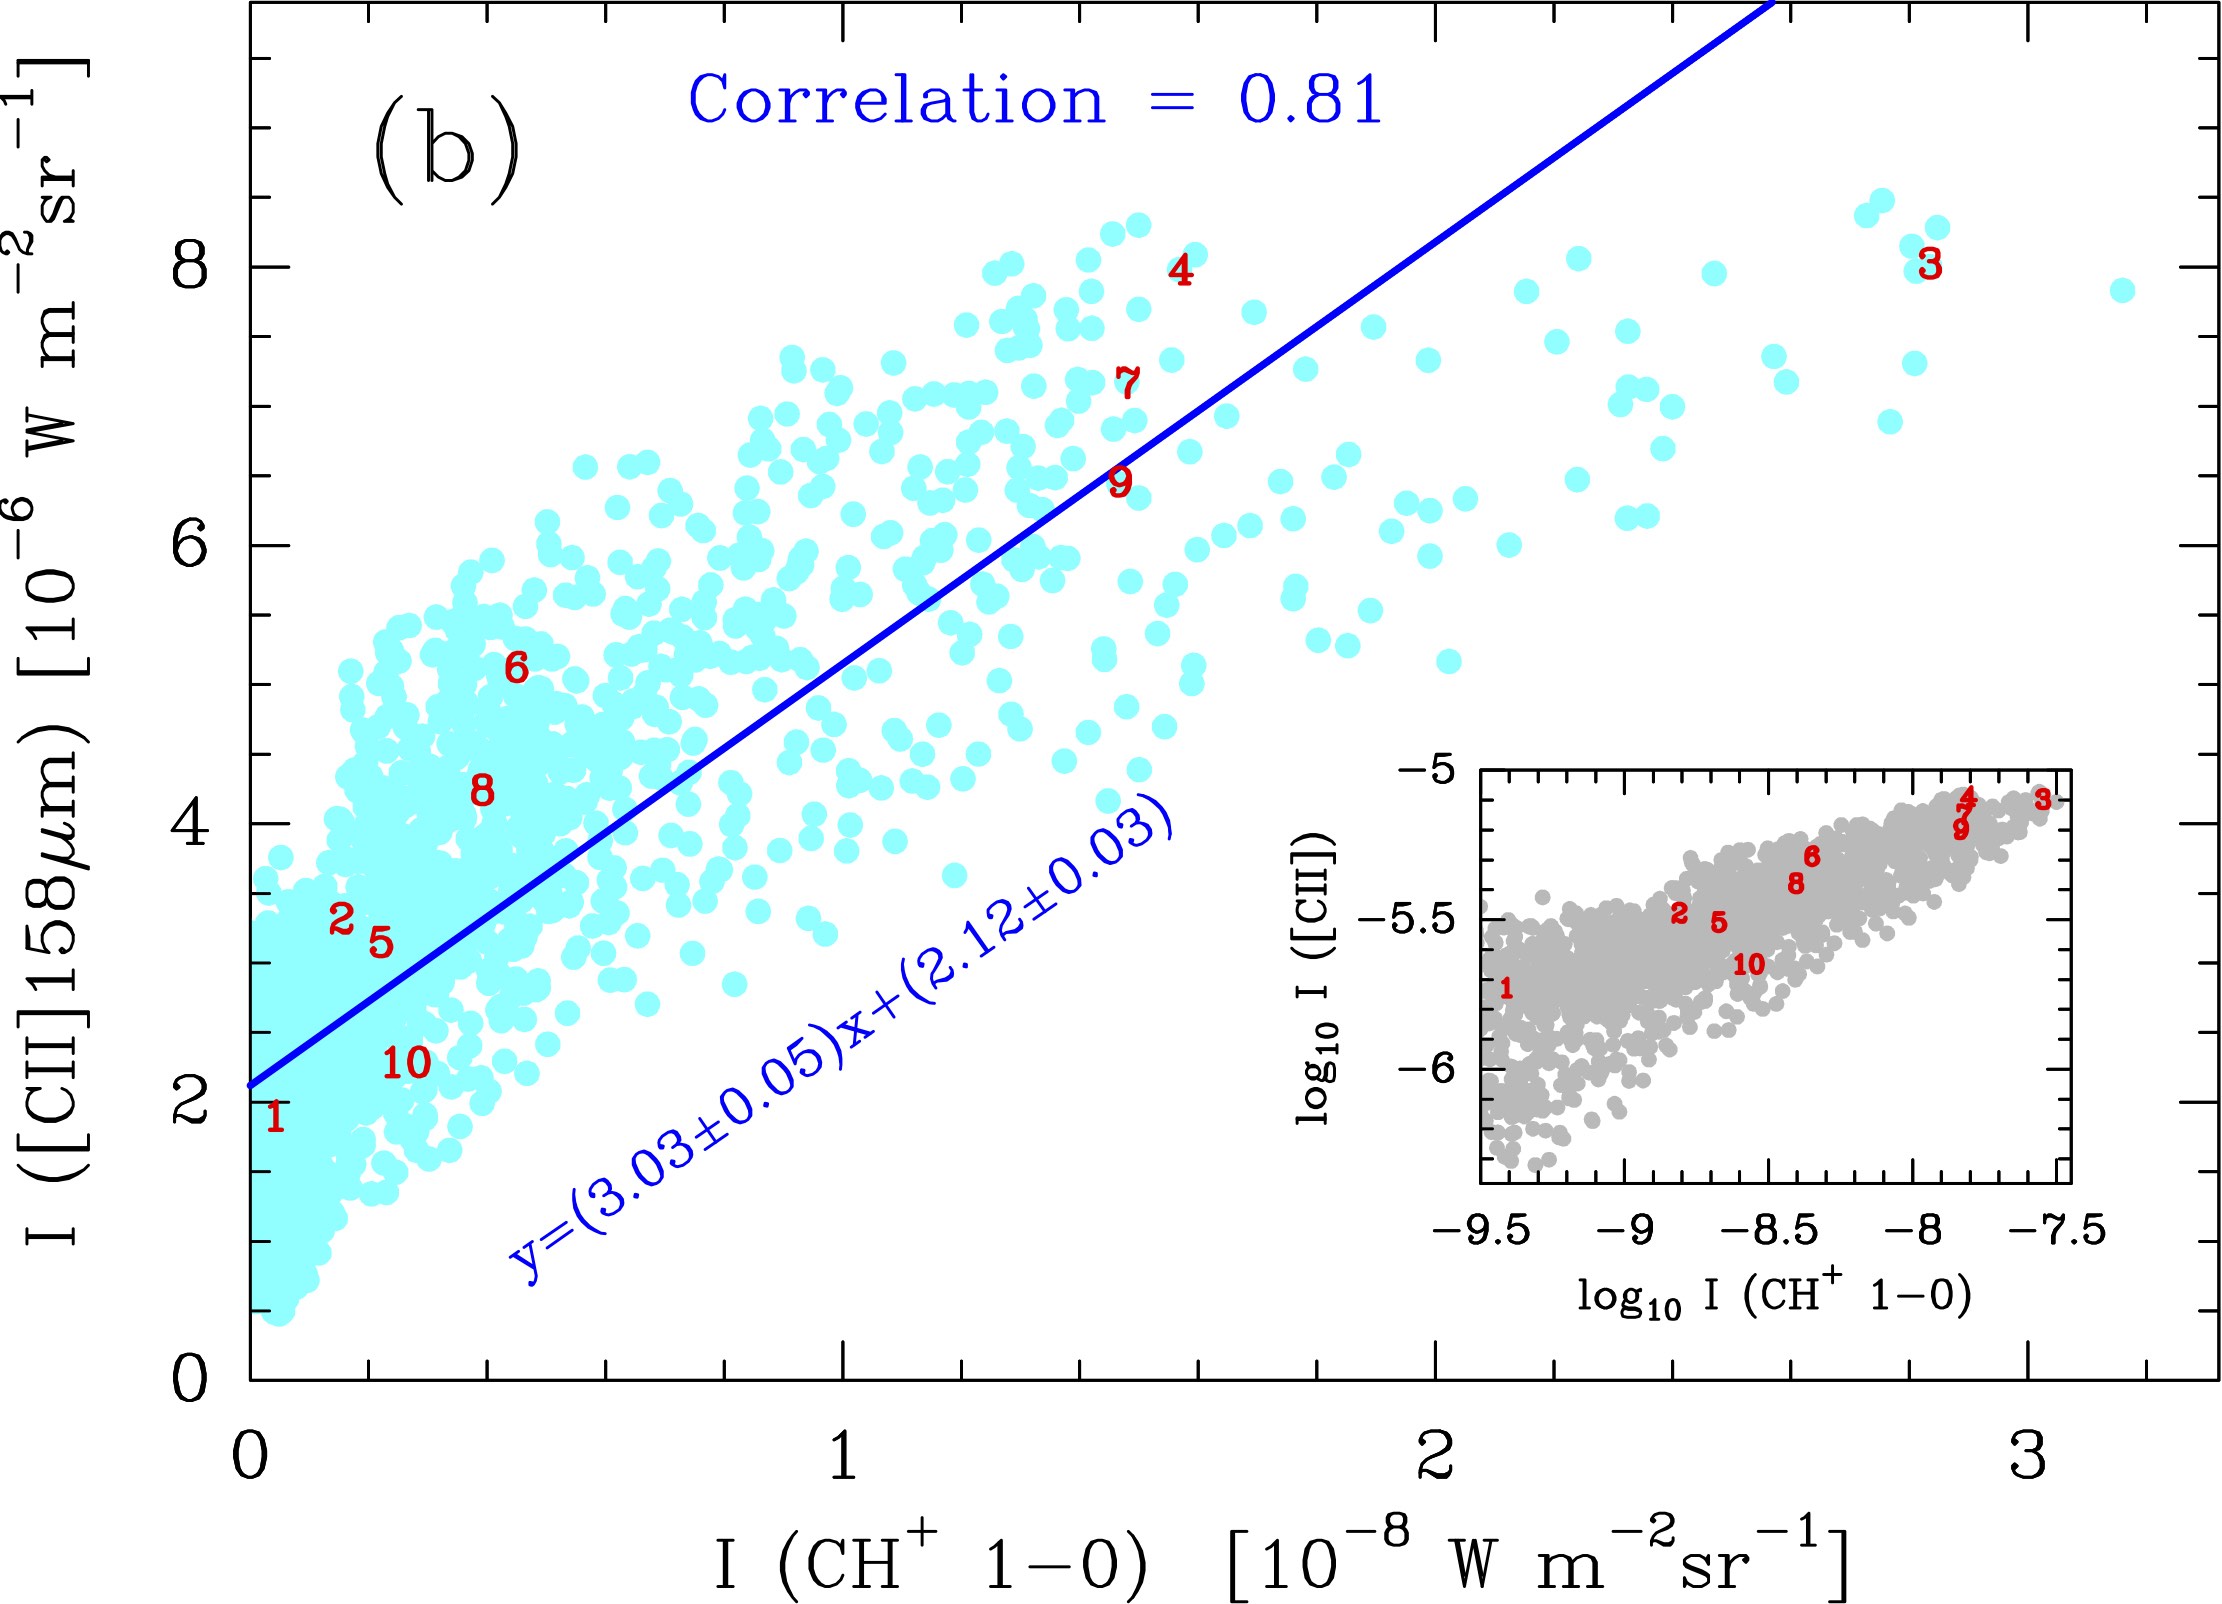
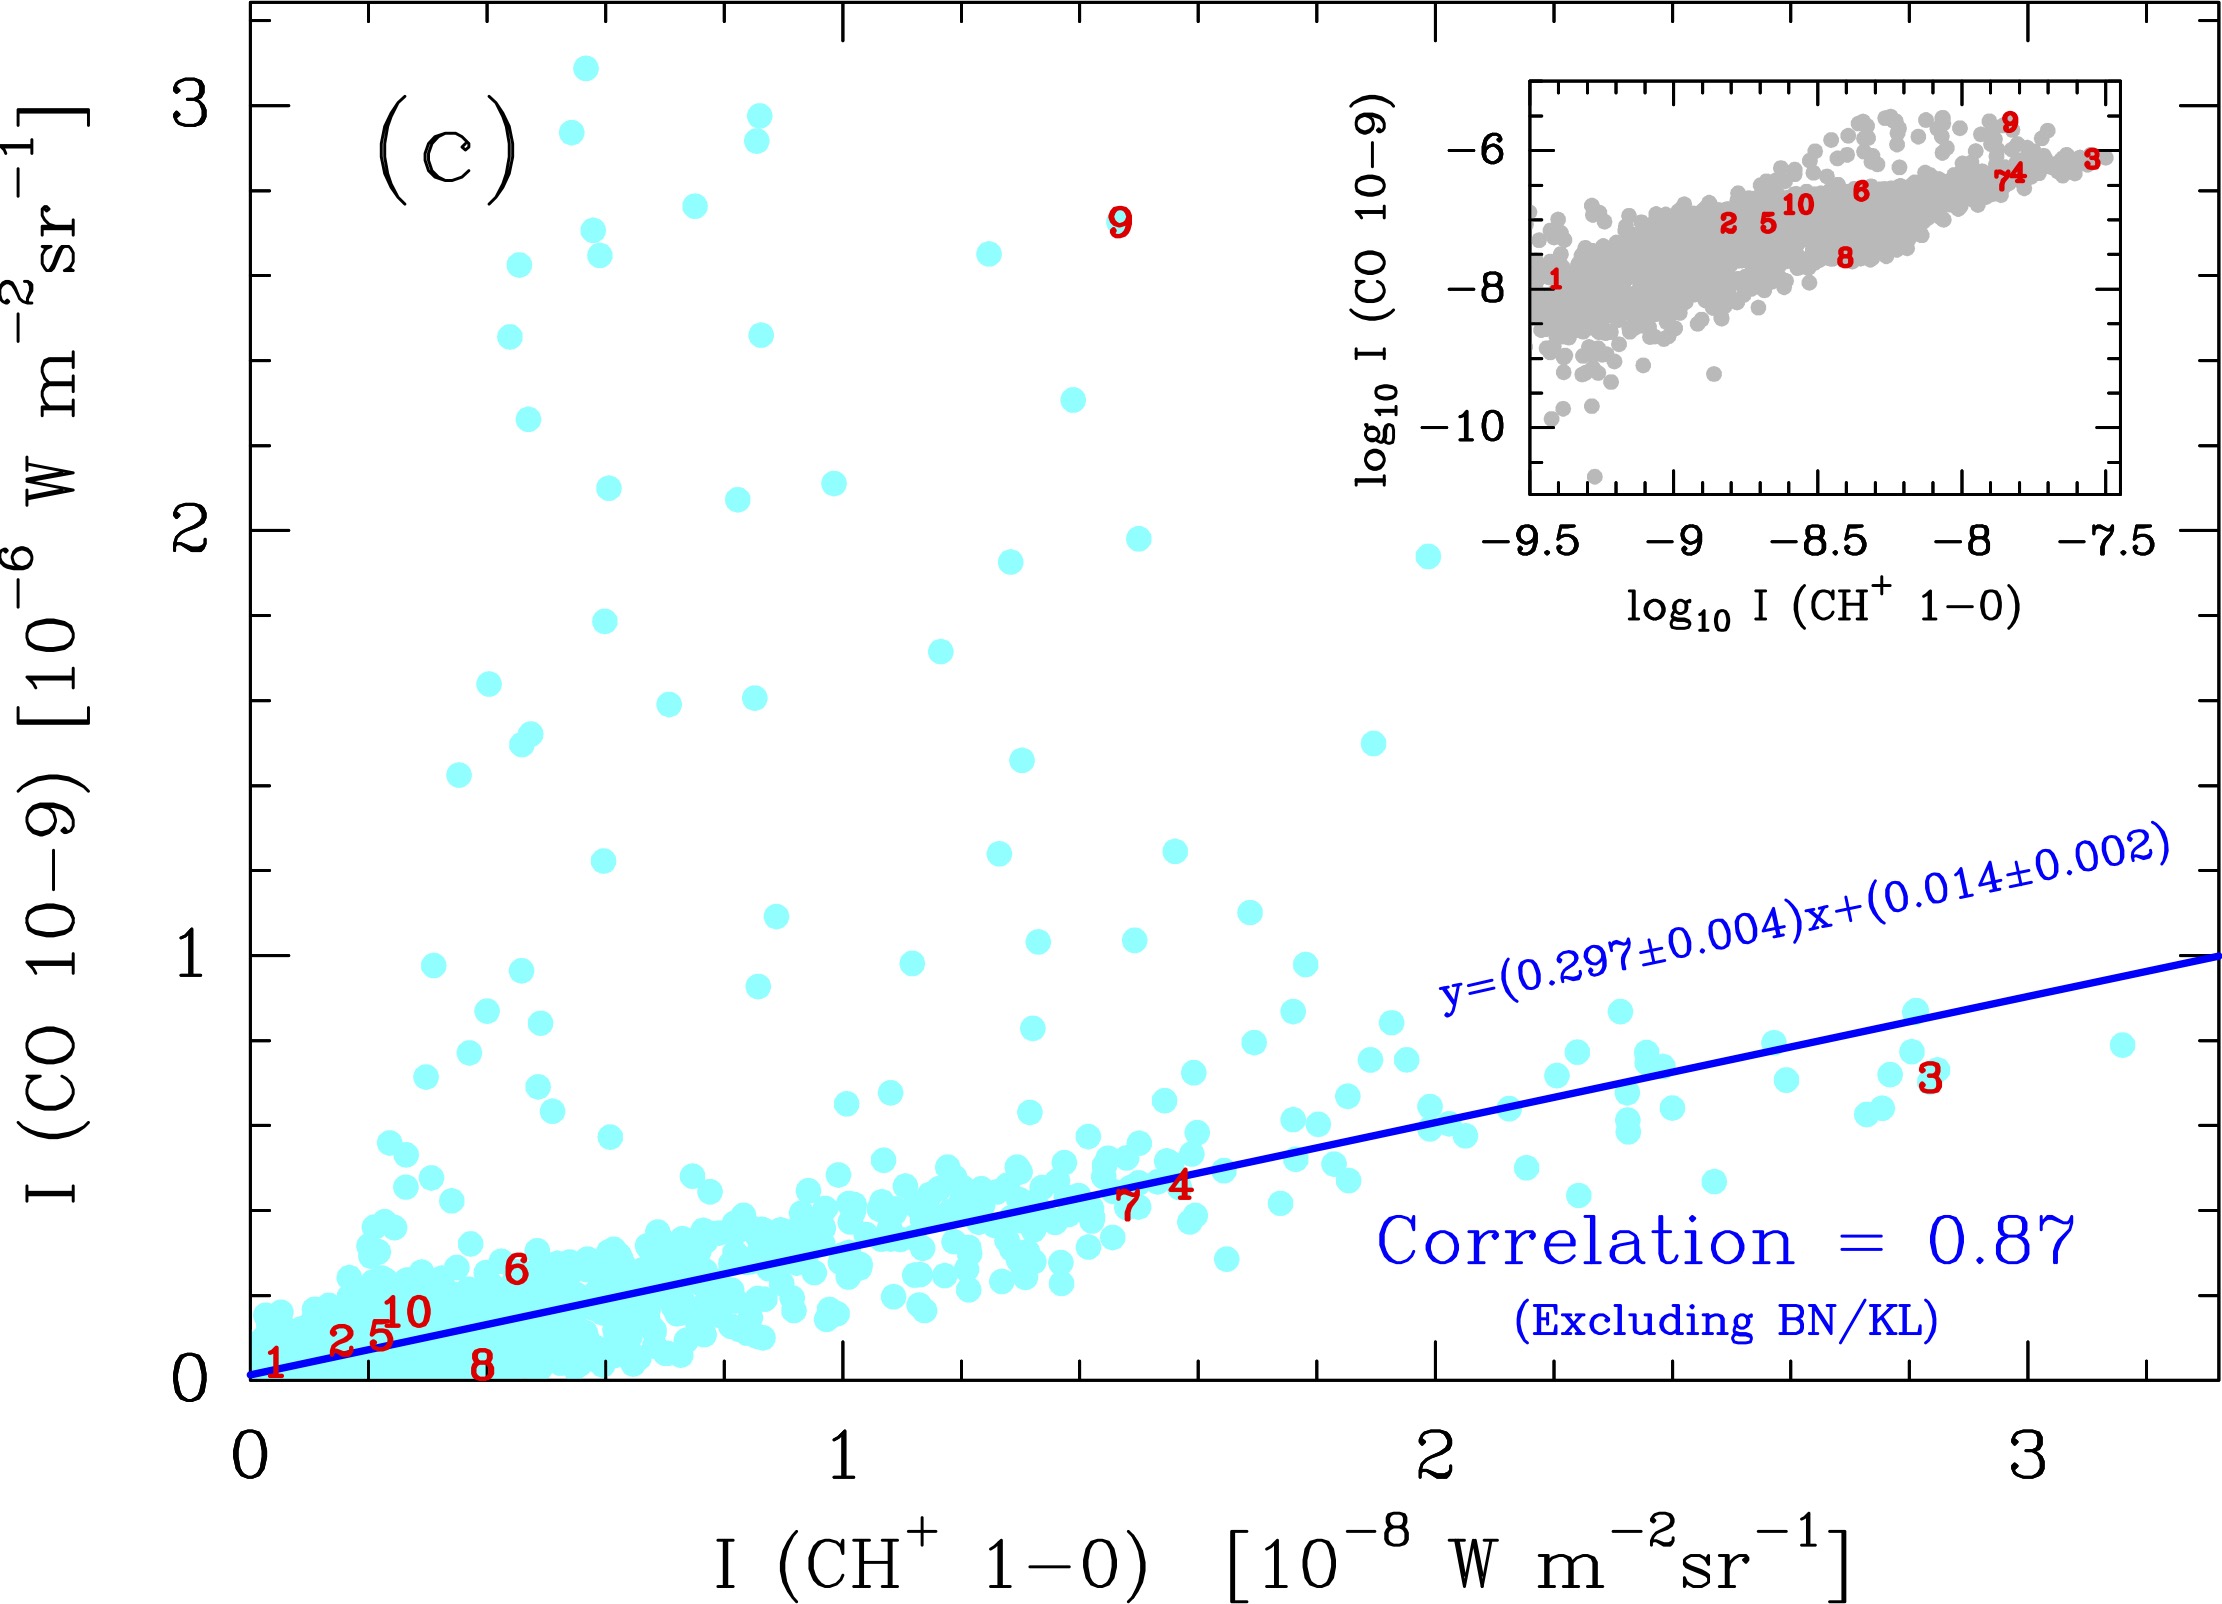
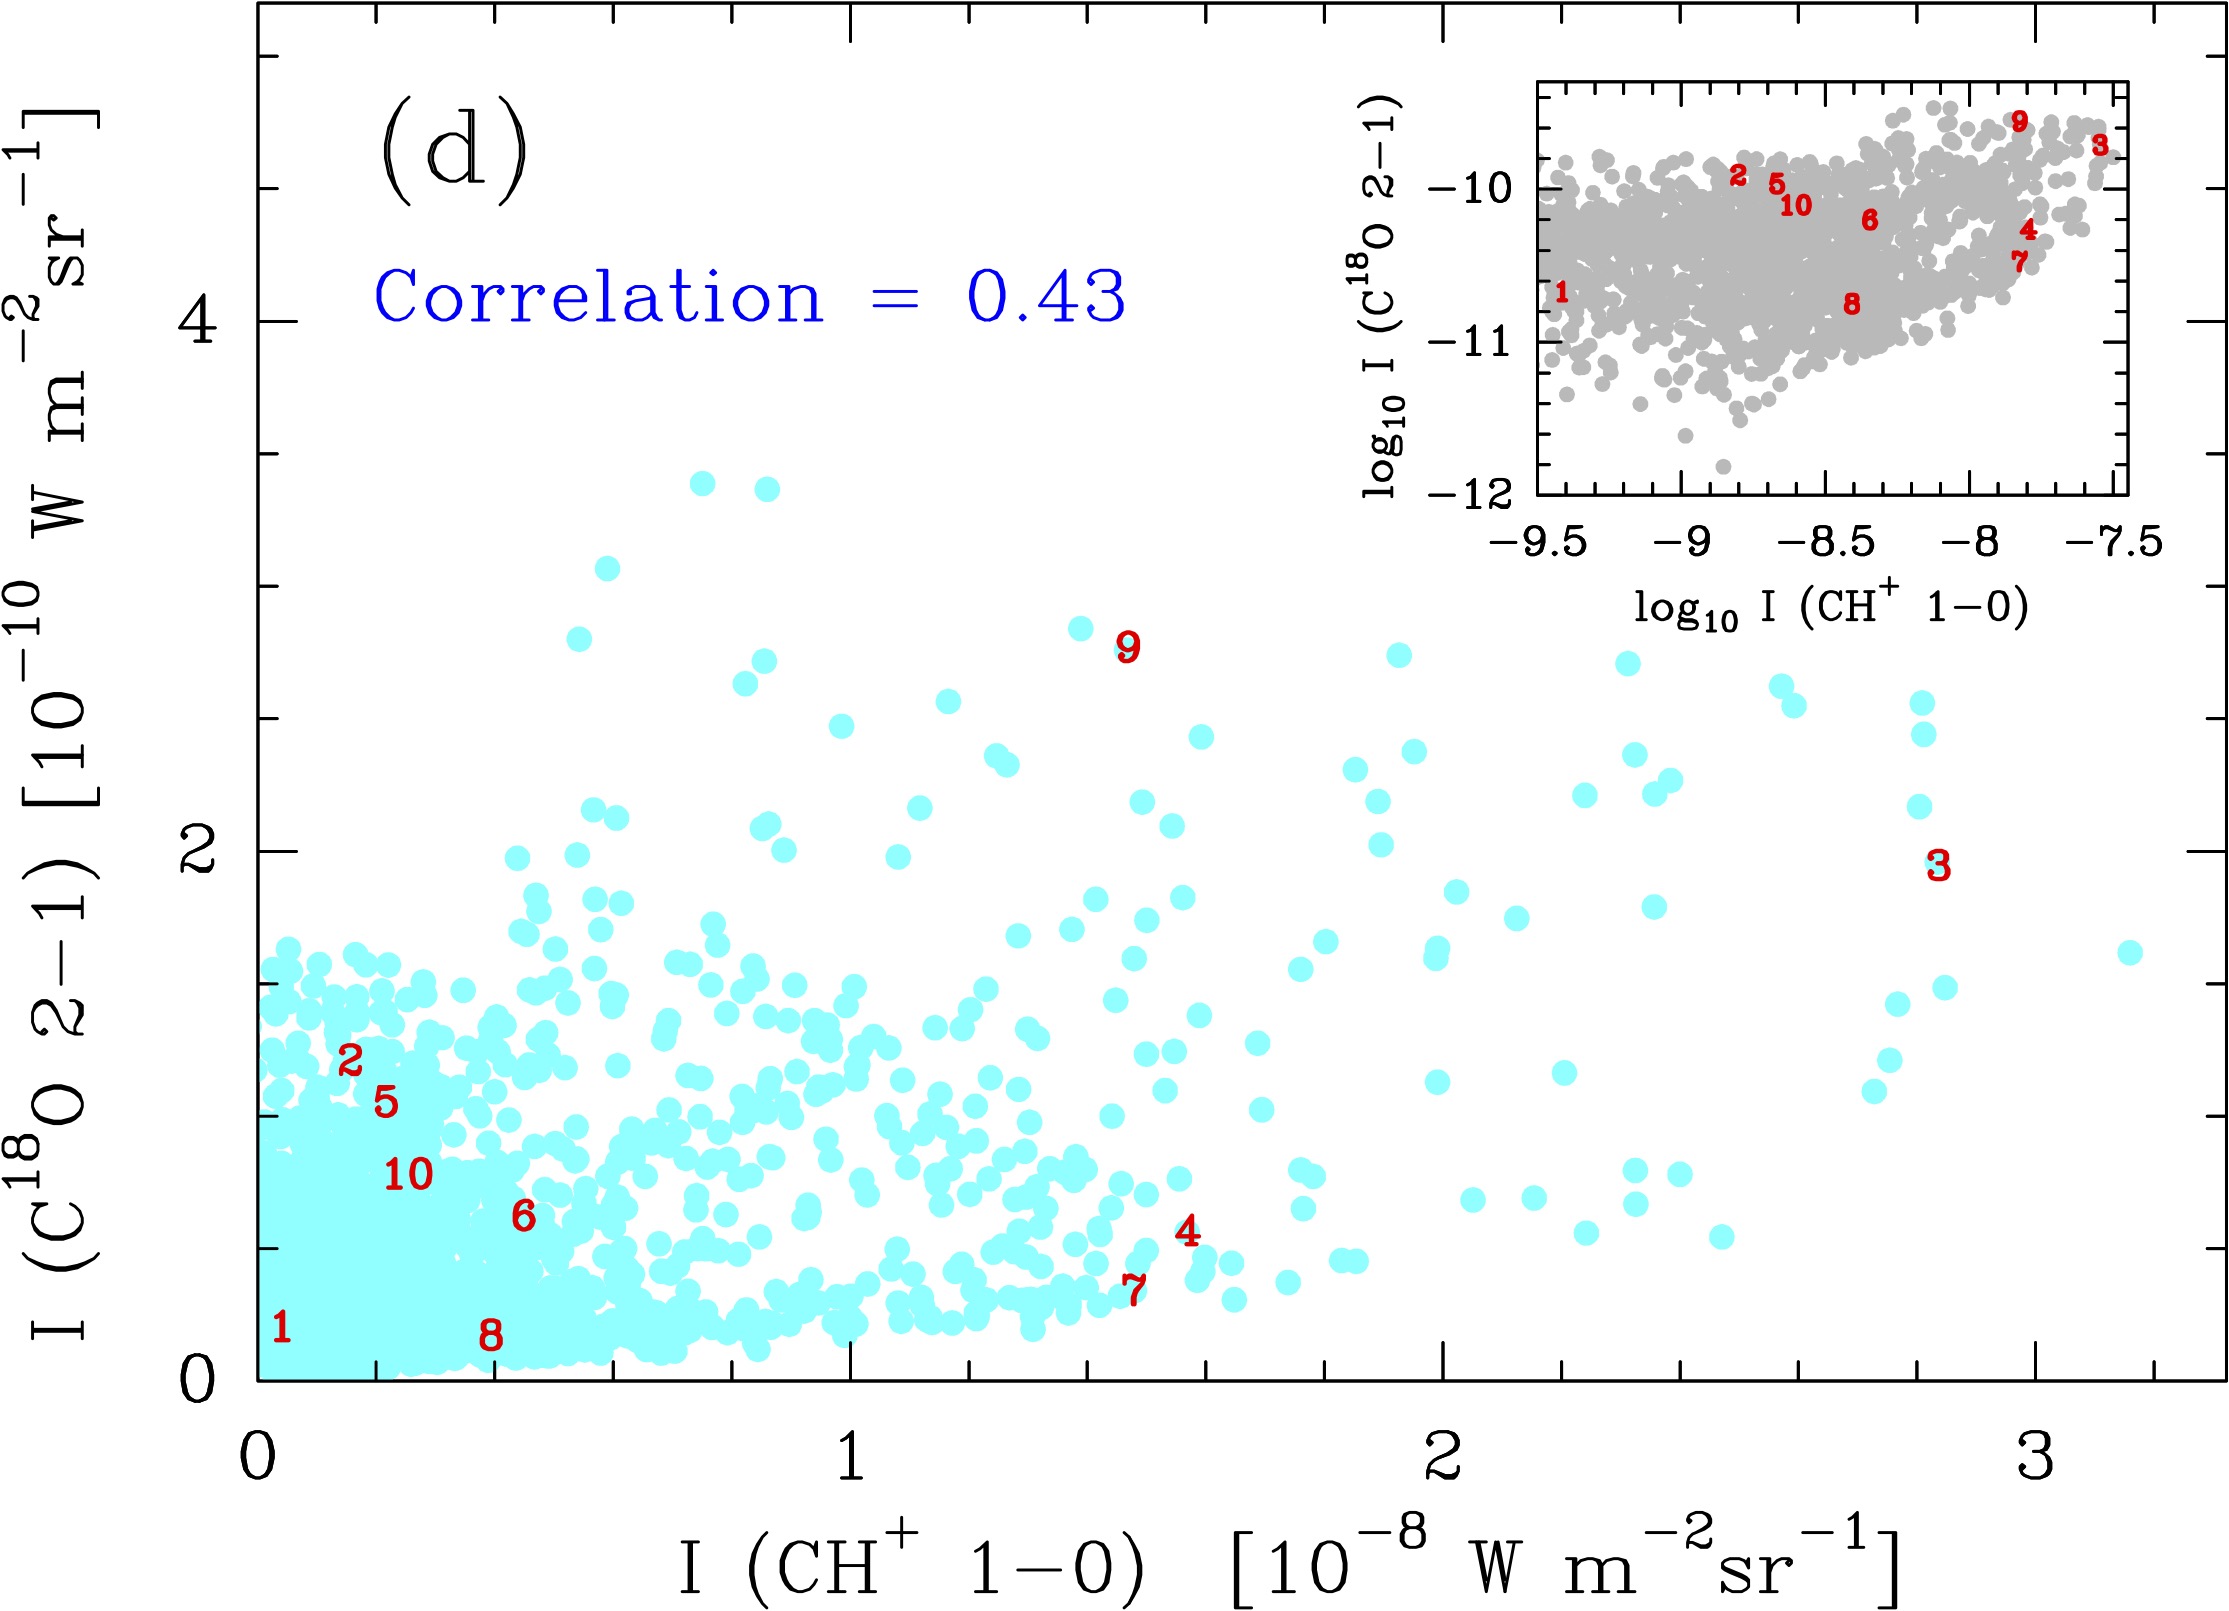
4.3 CH+ J=1-0 intensity correlation plots
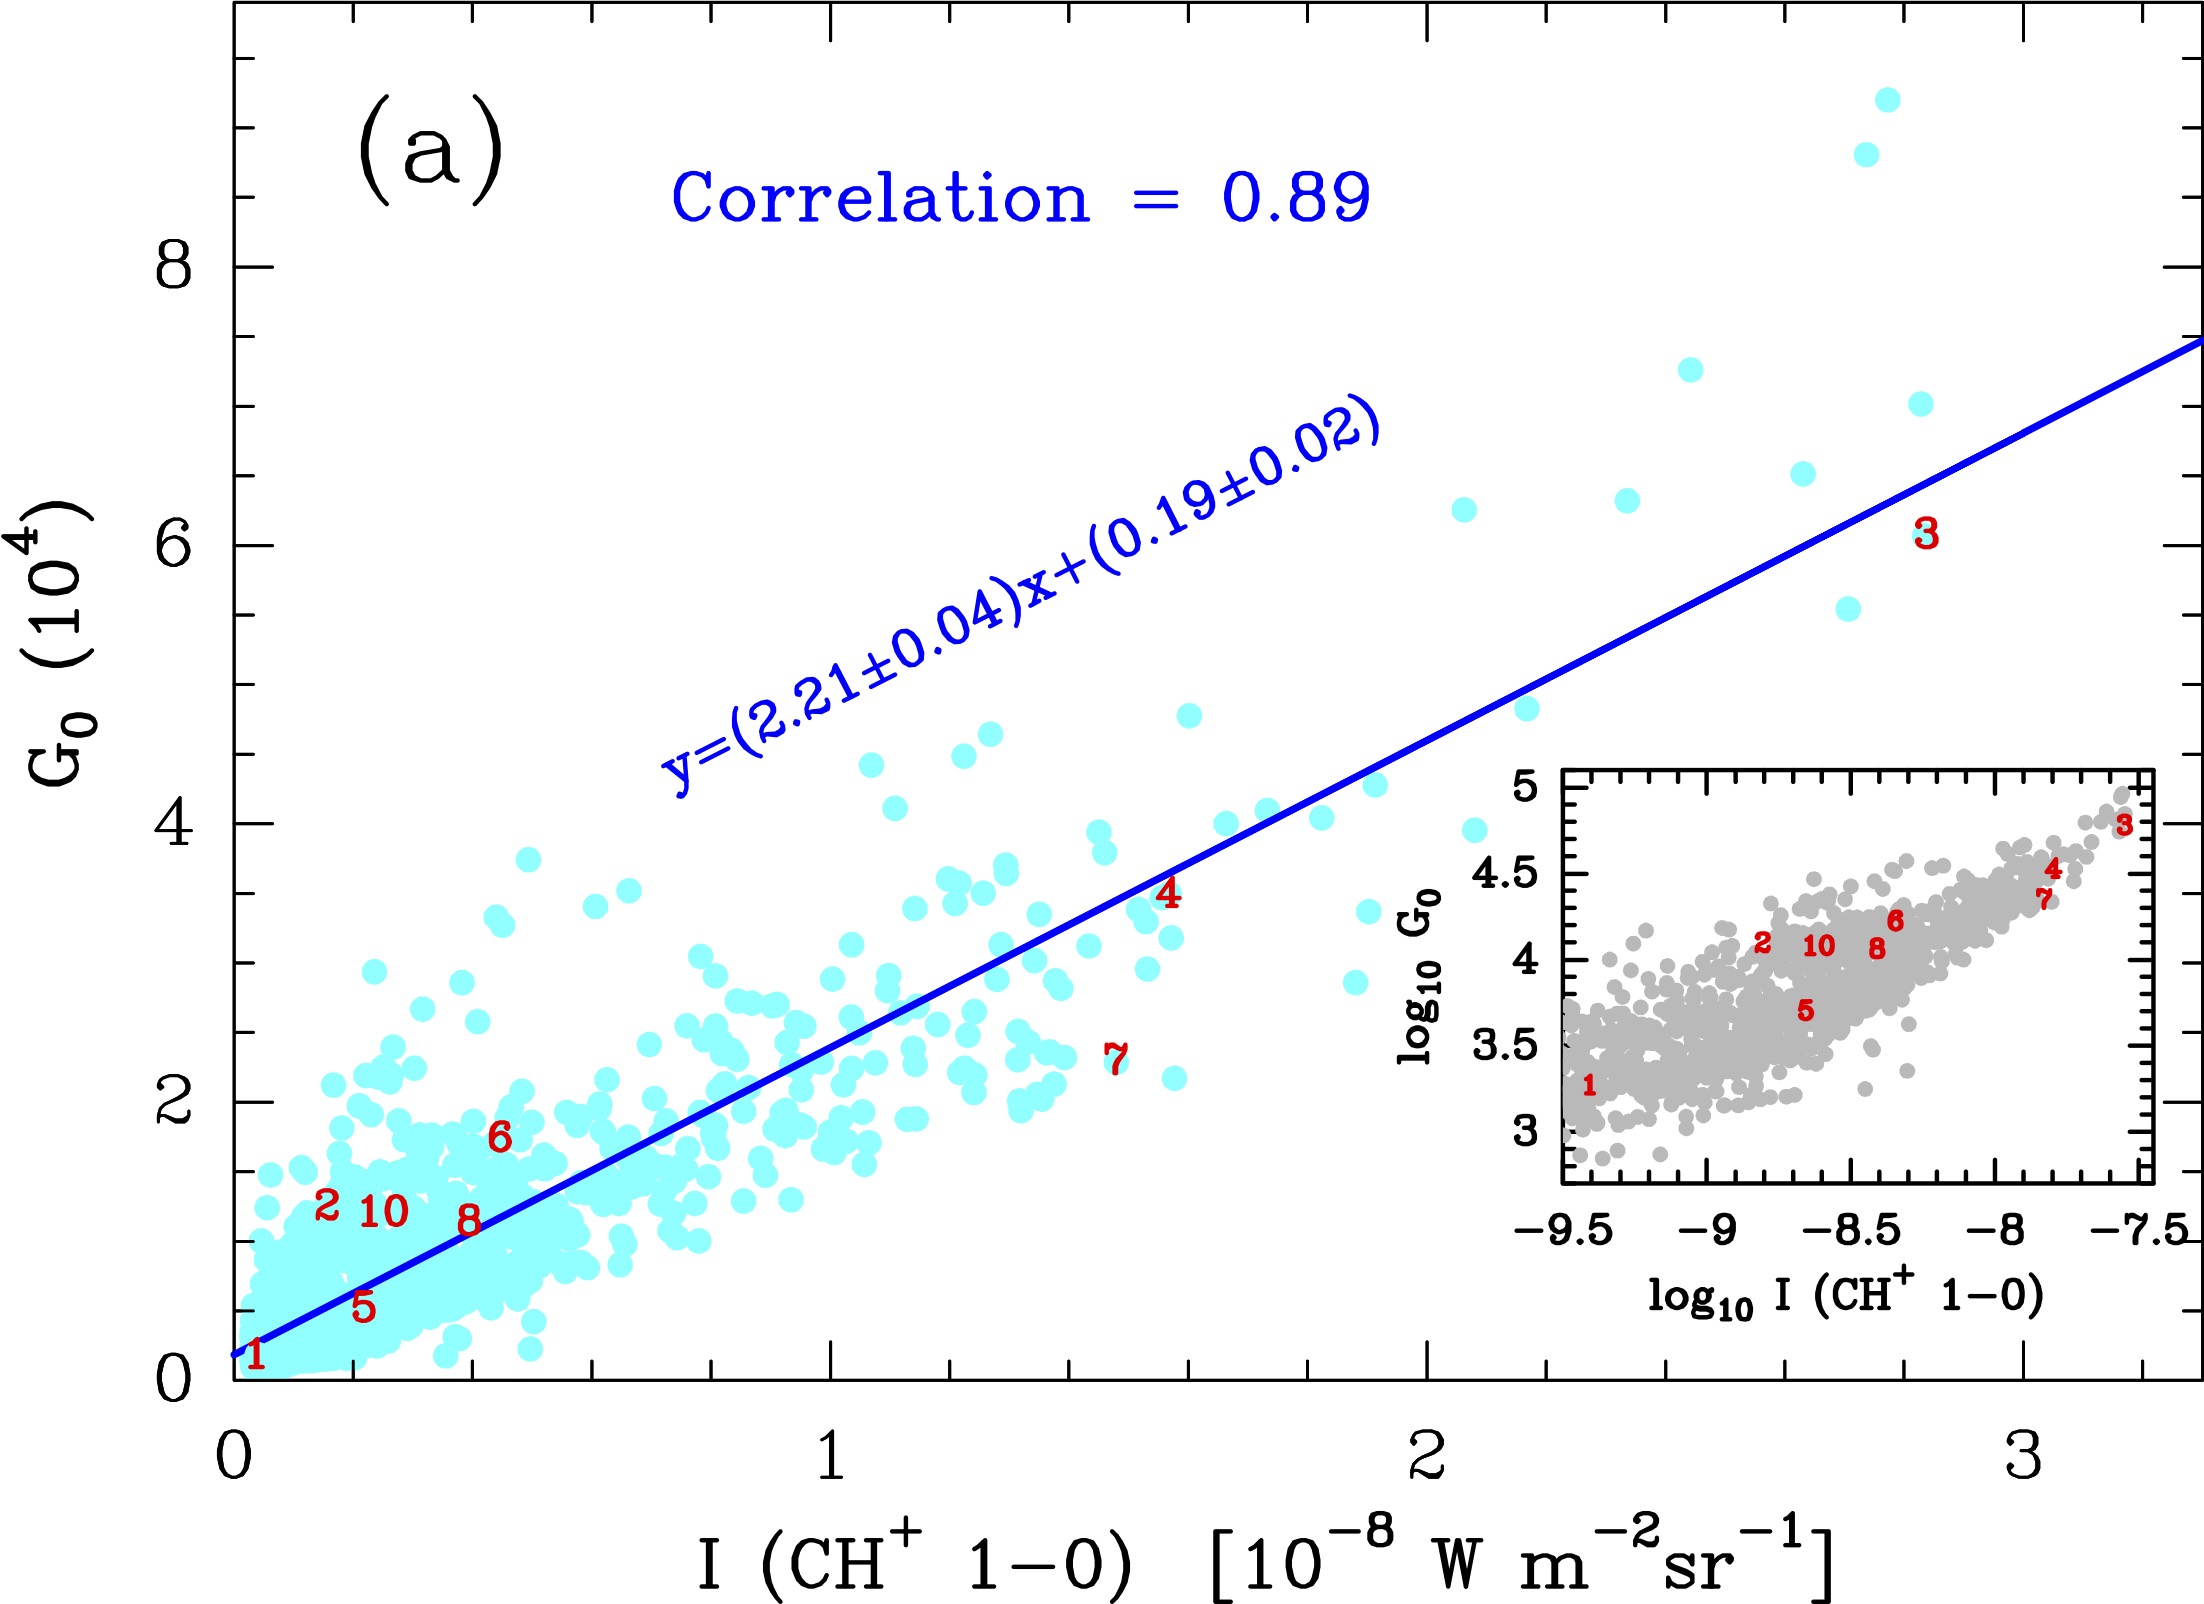
Figure 7 shows correlation plots between the CH+ 1–0 line intensity and other lines or quantities mapped along OMC-1: (a) the strength of the FUV radiation flux, , estimated by Goicoechea et al. (2015b) from FIR luminosities in the region, (b) [C ii] 158 m, (c) CO 10–9, and (d) C18O 2–1 line intensities (all in W m-2 sr-1). The correlation plots are shown in a linear scale (cyan points). The results from a linear fit are shown in blue. The small inset in each panel shows the same data in log–log scale (gray points). These plots use all the line intensity measurements contained in the maps and thus provide robust clues to the origin of the CH+ emission at large scales.
Owing to the proximity of the Trapezium stars, is very high along OMC-1 (103-105). Under these irradiation conditions, the CH+ 1–0 line intensity appears tightly correlated with (Fig. 7a). The CH+ ( 1–0) emission also scales with [C ii] 158 m line intensity (Fig. 7b). This shows again that CH+ arises very close to the edge of the molecular cloud. Indeed, the CH+ emission is much less correlated with the C18O 2–1 emission that, at first order, traces the column density in the colder cloud interior (Fig. 7d). Toward positions such as the Orion Bar PDR, where the [C ii] 158 m line is very bright: ([C ii])810-6 W m-2 sr-1, the C+ versus CH+ correlation starts to decline. Observations of the 13C+ fine-structure lines show that the [C ii] 158 m line actually becomes optically thick toward very bright PDRs (Ossenkopf et al., 2013; Goicoechea et al., 2015b). This may partially explain that the C+ versus CH+ relation becomes less linear when the [C ii] 158 m emission is very bright and opaque. In addition, for moderate densities ( cm-3) and FUV radiation fields (), the intensity of the [C ii] 158 m line is governed by the ratio (e.g., Kaufman et al., 1999). This implies that, in this range of paramenters, the CH+ ( 1–0)/[C ii] 158 m intensity ratio would scale with . Figure 15 (left) shows a map of this intensity ratio. Indeed, the brightest regions in the plot are associated with the highest density PDR layers in the region, cm-3 (also revealed by the HCO+ 6–5/3–2 map in Fig. 6). Hence, the decline of the [C ii] 158 m versus CH+ ( 1–0) emission trend is likely driven by the increase of gas density toward these cloud edges.
Finally, if one excludes the bright CO 10–9 line emission from shocked gas in outflows, that is, positions with 10-6 W m-2 sr-1 in our maps, there is also a good correlation between CH+ 1–0 and CO 10–9 line intensities (Fig. 7c). This is another proof of the FUV-irradiated cloud edge origin of the large scale CO 10–9 emission.
4.4 CH+ and the extended FUV-pumped H2 emission
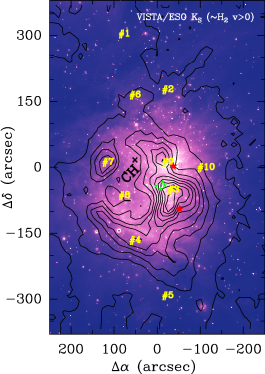
Right panel in Fig. 8 shows the tight spatial correlation between the distribution of the CH+ ( 1–0) emission (black contours) and that of (in color scale). The strongest FUV fluxes (105) appear near Orion S, close to the Trapezium cluster. The Orion Bar and East PDRs are also strongly illuminated ( of a few 104). At the edges of the mapped area, the FUV radiation field is still high (103). Therefore, an intense stellar FUV flux reaches parsec scales in OMC-1 (Stacey et al., 1993; Goicoechea et al., 2015b). These FUV photons radiatively pump H2 molecules to vibrationally excited states (e.g., Hollenbach & Tielens, 1997, and references therein) at the edge of the irradiated cloud, leading to bright near-IR (NIR) H2 ( 1) emission that is detected at large-spatial scales (Luhman et al., 1994). In particular, H2 lines from vibrational levels up to =10 (or 50,000 K) have been detected toward the Orion Bar (e.g., Kaplan et al., 2017).
Among the brightest NIR H2 ( 1) lines is the H2 =1-0 (1) ro-vibrational line. Figure 8 (left) shows a photometric image of OMC-1 taken with the ESO’s Visible and Infrared Survey for Astronomy (VISTA) in the band (Meingast et al., 2016). The filter is centered at =2.15 m and has a width of =0.3 m; and thus covers the H2 =1-0 (2.12 m) and =2-1 (2.24 m) lines. Hence, in addition to the hundred of NIR (proto)stellar point-sources in the field, this image is sensitive to extended emission of interstellar H2 ( 1). Hot shocked gas from protostellar outflows also produce bright, collisionally excited, and nearly thermal H2 ( 1) emission locally (e.g., Rosenthal et al., 2000). The most obvious example in Fig. 8 (left) are H2 Peaks 1 and 2 regions in BN/KL, around position #9 in the maps (P1 and P2 in Fig. 1; see also Bally et al., 2011, and references therein). At large scales, however, the band image is dominated by extended emission from FUV-pumped H2 ( 1) (e.g., Luhman et al., 1994).
PDR models predict that at moderate densities, 105 cm-3, the FUV-pumping contribution to the H2 =1-0 line intensity scales with (e.g., Burton et al., 1990). Only if the gas temperature is 1000 K, collisions will also contribute to populate the vibrational level =1, so we expect that thermal excitation does not dominate the large-scale IR H2 ( 1) emission. Hence, in a first approximation, the extended interstellar emission shown in the image (Fig. 8, left panel) should also reflect variations of along the FUV-irradiated surface of OMC-1. The two images in Fig. 8 display the CH+ 1–0 integrated intensity map in black contours. Although the NIR and submm observations have very different angular resolutions, one clearly infers the presence of CH+ everywhere H2 ( 1) emits. Indeed, the brightest CH+ ( 1–0) emission peaks, associated to regions of high values, are also bright in NIR H2 ( 1) emission (Fig. 8). The observed spatial correlations reflect the tight connection between both the CH+ rotational and H2 ( 1) ro-vibrational emission with the flux of stellar FUV photons.
4.5 Rotationally warm CH+ emission toward the Trapezium
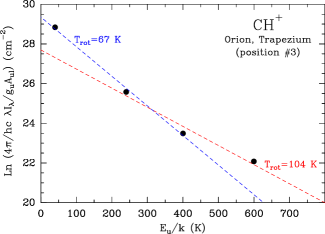
In terms of FUV irradiation, the most extreme conditions are those in the regions between the Trapezium and Orion S, with 105 (Fig. 8, right). These are even harsher conditions than in the prototypical PDR the Orion Bar (position 4). Indeed, with Herschel/PACS we detect CH+ rotational lines up to 5–4 (or 600 K) toward position 3. The intensities of these rotationally excited CH+ lines (a few 10-7 W m-2 sr-1) are a factor of 4 to 8 brighter than toward the Orion Bar (Nagy et al., 2013; Joblin et al., 2018). CH+ rotational lines have very high critical densities, several 109-1010 cm-3. Hence, at the gas densities we infer for the edge of OMC-1 (Section 4.2), one would expect very subthermal excitation; implies weak collisional excitation, in other words, very low rotational temperatures, , similar to those inferred for reactive ions such as CO+ or HOC+ (10-30 K in the Orion Bar; see Fuente et al., 2003; Nagy et al., 2013; Goicoechea et al., 2017). Figure 9 shows the observed CH+ line intensities toward position #3 in the form of a rotational population diagram. Due to the observed curvature of the diagram, the measured line intensities are incompatible with a single rotational temperature. Just for reference, we note that a simple two-temperature fit provides 67 and 104 K, significantly higher than of other reactive ions. Hence, CH+ is rotationally warm. This is consistent with the very short-life of CH+ in dense gas and with the exothermic formation pathway from the reaction of C+ with H2 ( 1). In particular, CH+ can be excited by radiation many times during its short lifetime, and during its mean-free-time for inelastic collisions, so that it remains rotationally warm while it emits (Black, 1998; Goicoechea et al., 2017). This chemical formation pumping enhances the populations of CH+ excited levels (especially for 3; see Godard & Cernicharo, 2013).
5 Discussion
ALMA observations of the Orion Bar have spatially resolved the compressed PDR layers at the edge of the molecular cloud, very close to the H to H2 transition zone. This layer is characterized by high thermal pressures (= 108 cm-3 K, Goicoechea et al., 2016; Joblin et al., 2018), it is the source of H2 ( 1) emission, and the only layers where reactive ions such as CH+ and SH+ can efficiently form, and indeed are observed (Nagy et al., 2013; Goicoechea et al., 2017; Parikka et al., 2017; Joblin et al., 2018). Observations of different PDRs in the Milky Way further suggest a correlation between and the thermal pressure in these compressed layers. In particular, many PDRs seem to lie in the range cm-3 K (Joblin et al., 2018; Wu et al., 2018). Interestingly, this correlation is predicted, almost independently of the initial gas density, by non-stationary hydrodynamical models of photoevaporative PDRs (Bron et al., 2018). The high pressures inferred at the PDR surface, often unbalanced by those of the surrounding environment, would then have a dynamical origin: cloud edge heating, compression, and photoevaporation. These proceses greatly depend on the strength and shape of the stellar UV radiation field (Hill & Hollenbach, 1978; Bertoldi, 1989; Bertoldi & Draine, 1996; Störzer & Hollenbach, 1998; Hosokawa & Inutsuka, 2006; Pellegrini et al., 2009; Bron et al., 2018). ALMA observations of the Orion Bar PDR do suggest the presence of photoevaporative flows of neutral gas (Goicoechea et al., 2016).
5.1 PDR modeling
We have used the Meudon PDR code (e.g., Le Petit et al., 2006; Goicoechea & Le Bourlot, 2007; Bron et al., 2014) to model the cloud edge layers where the observed submm line emission arises. The model simulates a stationary PDR; the penetration of FUV photons, the thermal balance, and the chemistry are computed self-consistently. We adopted an extinction to color-index ratio, , of 5.5 consistent with the flatter extinction curve toward Orion (Cardelli et al., 1989). Regarding CH+ formation, these models include an H2 state-dependent treatment of reaction (1) (see Agúndez et al., 2010; Zanchet et al., 2013; Herráez-Aguilar et al., 2014; Faure et al., 2017). In particular, the CH+ formation rate is computed by summing over all formation rates for each specific state of H2.
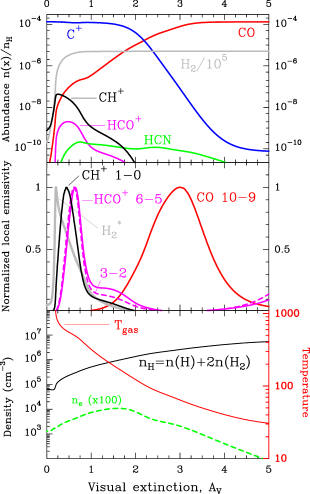
Bron et al. (2018) concluded that, in the frame of stationary PDR models, a better description of these quasi-isobaric layers, typically between = 0 and 5 mag into the cloud, is obtained by constant pressure models instead of the constant density models often used in the literature. With this in mind, in Fig. 10 we show a representative stationary PDR model adapted to the irradiated edge of OMC-1. This is a high-pressure, =108 cm-3 K, isobaric PDR illuminated by the mean FUV radiation flux in the region mapped by HIFI (103). The bottom panel in Fig. 10 shows the predicted physical structure, from =0 to 5 mag of visual extinction into the molecular cloud. The upper panel shows fractional abundances of H2, C+, CH+, CO, HCO+ and HCN with respect to H nuclei. We note that CH+ and HCO+ abundances peak at the edge of the PDR, before the C+ to CO transition layers, that is, closer to the H ii region. Therefore, both CH+ and HCO+ are abundant666HCO+ is also abundant deep inside the shielded molecular cloud, mainly formed by the reaction CO + H HCO+ + H2. in layers where the ionization fraction, driven by the photoionization of carbon atoms, is high, ()10-4. The high electron density in these layers, 30 to 100 cm-3, contributes to the collisional excitation of their rotational levels. The middle panel in Fig. 10 shows the predicted local emissivities of the observed molecular lines, normalized by their emission peak. In the optically thin limit, the actual line intensities will follow the same spatial distribution.
Because of the efficient chemical formation of HCO+ from reactive ions CH+ and CO+ at the PDR surface, before the C+ to CO transition (e.g., Sternberg & Dalgarno, 1995; Goicoechea et al., 2016), the CH+ 1–0 and HCO+ 6–5 lines are predicted to trace hotter gas (500 K in this model), than the CO 10–9 emission. The CO 10–9 line, traces cooler and an order of magnitude denser gas, 106 cm-3, that arises from slightly deeper inside the PDR. Given the relatively high gas densities in these warm PDR layers, the observed submm molecular lines arise from a very thin layer: 1.61016 cm-2510-3 pc1000 AU in this particular model. This is not far from previous claims, based on low-angular resolution observations, for the dense molecular gas confining the H ii region M42 (e.g., Rodríguez-Franco et al., 2001). At the distance to Orion, these spatial scales imply angular thicknesses of only several arcseconds. In other words, they cannot be spatially resolved by single-dish telescopes. This explains the similar morphology of the CH+ 1–0 and CO 10–9 extended emission observed by Herschel. ALMA images of SH+ and HCO+ ( = 3–2) emission do resolve the compressed, warm layers of the Orion Bar PDR (Goicoechea et al., 2016, 2017).
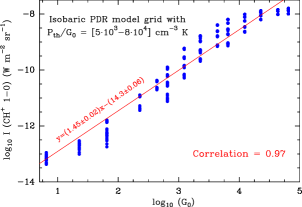
We also analyzed the results of a grid of 1300 stationary, isobaric PDR models, also run with the Meudon code, and searched for a theoretical validation of the observed (CH+ 1-0) versus correlation (Section 4.3). Figure 11 shows results from models that cover a wide parameter space in and , and satisfy the condition / from 5103 to 8104 cm-3 K, the same range obtained from photoevaporative PDR models (Bron et al., 2018) and also suggested by observations (e.g., Joblin et al., 2018; Wu et al., 2018). In this broad parameter space of illumination conditions, models do predict a correlation between incident FUV flux and CH+ 1–0 line intensity. The slope of the predicted correlation, in logarithmic scale, is =1.450.02 (Fig. 11). This value is only slightly above the one from OMC-1 observations, =1.00.1, but covering regions of higher FUV fluxes, 103. This satisfactory agreement suggests that, for a wide range of values, the stationary isobaric PDR model does capture the global properties of the compressed PDR layers at the irradiated edges of OMC-1. It also supports the observational result that the CH+ 1–0 emission traces the strength of the incident FUV flux.
5.2 CH+, an unambiguous tracer of FUV-irradiated gas
The [C ii] 158 m line emission is the most luminous tracer of the extended FUV-irradiated neutral gas in the Milky Way (e.g., Bennett et al., 1994). In some circumstances, however, the interpretation of [C ii] 158 m observations is not trivial: uncertain contribution from H ii ionized gas, multiple velocity components along a given line-of-sight, optical depth effects toward bright and dense PDRs, etc. (see e.g., Ossenkopf et al., 2013; Pabst et al., 2017). The detection of rotational emission from reactive molecular ions such as CH+ or SH+ is an alternative and unambiguous signature of FUV-irradiated dense777We refer to dense molecular gas, cm-3, as opposed to the detection of CH+ ( 1–0) absorption from low-density, cm-3, diffuse interstellar clouds (e.g., Godard et al., 2012) molecular gas (Black, 1998; Nagy et al., 2013; Goicoechea et al., 2017). We have shown that the intensity of the CH+ 1–0 line scales with . Despite the elevated endothermicity of reaction C+ + H2 (=0) CH+ + H, a high FUV photon flux enhances the gas temperature, the column density of FUV-pumped H2 ( 1), and that of CH+ (Sternberg & Dalgarno, 1995; Agúndez et al., 2010; Faure et al., 2017). We conclude that reaction (1) is not only efficient locally, in bright and dense PDR/H ii interfaces such as the Bar. It is also efficient at large spatial scales where CH+ ( 1–0) traces an extended but thin layer of FUV-irradiated molecular gas.
5.3 Observational tracers of the radiative feedback from massive stars and extragalactic link
Compared to the lowest-energy “ 1–0” rotational lines of CO, HCN, HCO+, or N2H+ typically mapped from ground-based telescopes (e.g., Pety et al., 2017; Hacar et al., 2017; Kauffmann et al., 2017), the more excited submm “mid–” lines are better diagnostics of the high-pressure gas in star-forming regions (SFRs). Because FUV radiation and shocks dominate the heating of the warm gas in molecular clouds, mid- lines are more sensitive probes of the radiative and mechanical feedback from stars and protostars. This warm gas component can dominate the line luminosity emitted by SFRs in the Milky Way, and from distant star-forming galaxies as a whole.
Most spectroscopic observations carried out by Herschel toward nearby SFRs (e.g., van Dishoeck et al., 2011) targeted low-mass protostars and their outflows (e.g., Nisini et al., 2010; Kristensen et al., 2012; Herczeg et al., 2012; Goicoechea et al., 2012; Karska et al., 2013; Manoj et al., 2013), as well as more distant high-mass star-forming cores (e.g., Bergin et al., 2010; Etxaluze et al., 2013; van der Tak et al., 2013; Karska et al., 2014; Goicoechea et al., 2015a; Indriolo et al., 2017). These are relatively compact sources, at Herschel’s angular resolution, producing intense FIR high- CO and H2O line emission that arises from hot molecular gas, (CO) 300 K, associated to protostellar outflows. The observed CO rotational emission ladder toward these sources typically peaks at 15 and shows detectable CO emission at 30. Although at the spatial scales of an entire GMC, the filling factor of these protostellar outflows is small, the shape of their CO spectral line energy distribution (SLED) is representative of hot, shock-heated molecular gas. In a broader context, this shock-heated component may dominate the observed FIR high- CO emission from active galactic nuclei (AGN) galaxies in which these lines are readily detected (e.g., Sturm et al., 2010; Hailey-Dunsheath et al., 2012).
The CO line emission measured by Herschel toward less extreme star-forming galaxies typically peaks at 10 (e.g., Kamenetzky et al., 2012, 2014; Indriolo et al., 2017). Hence, most of the mid- CO luminosity emitted at kpc scales likely arises from non-shocked warm molecular gas. In normal (Milky Way type) and starburst galaxies, the observed mid- emission possibly arises from widespread PDR gas, similar to that in the extended irradiated surface of OMC-1, that is, relatively dense molecular gas exposed to FUV radiation from OB-type stars. As in any local PDR, this warm gas component copiously emits at FIR and submm wavelengths (Hollenbach & Tielens, 1997). This emission includes bright CO lines with a SLED peaking at 10 to 15 for strongly irradiated Orion Bar-like PDRs with 103 (Joblin et al., 2018), at 7–6 for lower FUV-radiation fields, 103, such as the extended envelope around Sgr B2 cloud (Etxaluze et al., 2013), or the Horsehead PDR, with 102.
Using OMC-1 as template to quantify the radiative impact of young massive stars on their natal cloud, we see that the FUV flux is still strong enough to drive the gas heating and chemistry of an extended gas component of warm, 100-150 K, molecular gas at pc distances from massive stars. This is seen from the larger extent of the CO 10–9 emission compared to that of C18O 2–1 (Fig. 2). The HCO+ and HCN 6–5 maps reveal that the gas density at the cloud edges are relatively high, 105-106 cm-3, so the thermal pressures are high. Such densities may be related to a particularly dense condensation that gave rise to the Trapezium stars; they may be related to the cloud evolution itself, as a consequence of the global gravitational collapse of OMC-1 (e.g., Hartmann & Burkert, 2007; Hacar et al., 2017); or produced by the FUV-induced compression of the cloud surfaces (e.g., Goicoechea et al., 2016; Bron et al., 2018).
Square-degree maps of the GMCs Orion A and B in the HCN 1–0 line emission have revealed that, despite the high critical density of this transition, several 106 cm-3, most of the emission arises from relatively low-density gas (103 cm-3; Pety et al., 2017; Kauffmann et al., 2017). Therefore, the mere observation of a low-energy but high critical density line does not immediately imply that the emission arises from cold and dense gas, the fuel that ultimately forms stars, as often assumed in the interpretation of extragalactic observations (e.g., Gao & Solomon, 2004; Usero et al., 2015). The very extended HCN ( 1–0) emission detected along GMCs of the Milky Was just reveals emission from weakly collisionally-excited gas ((1–0) ), perhaps assisted by electron excitation if the ionization fraction is high enough due to FUV irradiation (e.g., Goldsmith & Kauffmann, 2017). This may be the case of many galaxies too. Our detection of extended HCN 6–5 emission and large HCO+ 6–5/3–2 intensity ratios in OMC-1, however, does demonstrate the presence warm and dense5 molecular gas at 1 pc2 scales.
The HCN to HCO+ 6–5 line ratio () map of OMC-1 shown in Fig. 15 further differentiates the extended gas illuminated by FUV radiation (0.5), from the very high IR-luminosity regions, such as BN/KL with 2. These are regions hosting on-going massive star-formation and powerful protostellar outflows still buried in large column densities of FIR-emitting dust. In the extragalactic context, ultraluminous infrared galaxies (ULIRGs), that is, merger galaxies characterized by very high star-formation rates and massive nuclear outflows (e.g., González-Alfonso et al., 2017, and references therein) also display elevated 1-2 luminosity ratios (e.g., Krips et al., 2008; Imanishi et al., 2018, and references therein). Pure starburst galaxies, however, show ratios smaller than one (e.g., Salas et al., 2014; Aladro et al., 2015), similar to our observed value for the extended gas in OMC-1.
The recent ALMA detection of CH+ ( 1–0) emission and absorption toward ULIRGs at 2 (Falgarone et al., 2017) demonstrates the surprisingly widespread nature of CH+, also in distant and extreme galaxies. The absorbing CH+ presumably arises from a turbulent diffuse gas reservoir. The emission component, emitted at kiloparsec scales, is interpreted as denser gas affected by a collection of multiple FUV-irradiated shocks (needed to explain the broad line profiles) individually propagating at velocities of km s-1, and driven by galactic winds (Falgarone et al., 2017). Our detection of parsec scale CH+ ( 1–0) emission toward OMC-1, a star-forming cloud core irradiated by FUV photons from just a few young massive stars, provides an example of extended CH+ emission from non-shocked gas ( km s-1). Because the lifetime of CH+ in dense gas is so short, this CH+ emission traces the instantaneous feedback from massive stars. This may be the case of many starburst galaxies producing detectable CH+ rotational emission too.
6 Summary and conclusions
We have presented 85 arcmin2 (0.9 pc 1.4 pc) velocity-resolved maps of the CH+ ( 1–0), CO ( 10–9), H2O (312-221), CH3OH, CH (, 1, 3/2–1, 1/2), HCN ( 6–5 and 13–12), and HCO+ ( 6–5) lines, obtained with the heterodyne instrument Herschel/HIFI toward the closest high-mass star-forming region OMC-1. In combination with archival NIR photometric images tracing the H2 ( 1) emission, and new HCO+ 3–2 and C18O 2–1 line maps taken with the IRAM 30 m telescope, we obtained the following results:
The rotational emission from reactive ion CH+ is very extended. The CH+ ( 1–0) emission spatially correlates with that of [C ii] 158 m and of FUV-pumped H2. The observed correlations imply that the reaction of C+ ions with H2 ( 1) molecules dominates the formation of CH+, not only locally toward dense PDR/H ii interfaces, but also at parsec scales.
The extended CO ( 10–9) and HCO+ (mid-) narrow-line emission (v 3 km s-1) traces a thin layer of warm gas at the surface of the molecular cloud ( 3-6 mag or 1016 cm in thickness) illuminated by FUV radiation from massive stars in the Trapezium cluster. This layer, with a mass density of 120-240 pc-2, accounts for 5 % to 10% of the total gas mass in OMC-1. Using non-LTE excitation models we infer high thermal pressures, cm-3 K, for this gas component. This is consistent with the expected dynamical response of molecular clouds to strong FUV radiation: the cloud edge is heated and compressed, and photoevaporates if the high pressures in the PDR are not balanced by those of the environment (e.g., Bertoldi & Draine, 1996; Bron et al., 2018).
Photoevaporative PDR models predict that the quasi-constant thermal pressure in the compressed PDR layers scales with the strength of the FUV photon flux impinging the cloud (Bron et al., 2018). CH+ turns as a unique tracer of these narrow layers. In this work we have found a spatial correlation between the intensity of the CH+ ( 1–0) line and , ranging from 103 to 105 in OMC-1. The observed correlation is supported, and enlarged to lower values, by isobaric models in the parameter space [5103–8104] cm-3 K where many PDRs seem to lie (Joblin et al., 2018; Wu et al., 2018). This correlation also implies that for moderate gas densities, 105 cm-3, the CH+ ( 1–0)/[C ii] 158 m intensity ratio traces gas density variations at the irradiated cloud surfaces.
We detect bright and rotationally warm, 100 K, CH+ emission toward the most irradiated regions facing the Trapezium cluster.
The detection of excited CH+ lines, up to 5–4, is consistent with its exothermic formation from H2 ( 1), and with the formation pumping
mechanism that enhances the population of CH+ rotationally excited levels
(Godard & Cernicharo, 2013; Faure et al., 2017). The broad 1–0 line-widths are consistent with the high reactivity of the molecule: CH+ can be excited by radiation many times during its short lifetime (a few hours), and during its mean-free-time for elastic and inelastic collisions, so that it remains kinetically hot (large velocity dispersion) and rotationally warm (high ) while it emits (e.g., Black, 1998; Goicoechea et al., 2017).
The detection of extended, parsec-scale CH+ ( 1–0) and narrow-line mid- CO emission in OMC-1, both lines arising from PDR gas and not from fast shocks, probes the radiative interaction between young massive stars and their natal molecular cloud. This radiative feedback alters the dynamics, physical conditions, and chemistry of the most exposed neutral cloud layers. In turn, although not the most massive cloud core component, these PDR layers dominate the line luminosity emitted by GMCs. Similar processes must take place in other clusters hosting more numerous and more massive stars (e.g., Wareing et al., 2018). They likely occur in starburst galaxies as well. There, the PDR line emission from C+, mid- CO, and reactive ions such as CH+ must reach larger spatial scales, and can dominate the emitted line luminosity too.
Acknowledgements.
We thank the Spanish MICIU for funding support under grants AYA2016-75066-C2-1-P and AYA2017-85111-P, and the ERC for support under grant ERC-2013-Syg-610256-NANOCOSMOS.References
- Agúndez et al. (2010) Agúndez, M., Goicoechea, J. R., Cernicharo, J., Faure, A., & Roueff, E. 2010, ApJ, 713, 662
- Aladro et al. (2015) Aladro, R., Martín, S., Riquelme, D., et al. 2015, A&A, 579, A101
- Arab et al. (2012) Arab, H., Abergel, A., Habart, E., et al. 2012, A&A, 541, A19
- Bally (2008) Bally, J. 2008, Overview of the Orion Complex, ed. B. Reipurth, 459
- Bally et al. (2011) Bally, J., Cunningham, N. J., Moeckel, N., et al. 2011, ApJ, 727, 113
- Bally et al. (1987) Bally, J., Langer, W. D., Stark, A. A., & Wilson, R. W. 1987, ApJ, 312, L45
- Becklin & Neugebauer (1967) Becklin, E. E. & Neugebauer, G. 1967, ApJ, 147, 799
- Beckwith et al. (1978) Beckwith, S., Persson, S. E., Neugebauer, G., & Becklin, E. E. 1978, ApJ, 223, 464
- Bennett et al. (1994) Bennett, C. L., Fixsen, D. J., Hinshaw, G., et al. 1994, ApJ, 434, 587
- Benz et al. (2016) Benz, A. O., Bruderer, S., van Dishoeck, E. F., et al. 2016, A&A, 590, A105
- Benz et al. (2010) Benz, A. O., Bruderer, S., van Dishoeck, E. F., et al. 2010, A&A, 521, L35
- Bergin et al. (2010) Bergin, E. A., Phillips, T. G., Comito, C., et al. 2010, A&A, 521, L20
- Berné et al. (2014) Berné, O., Marcelino, N., & Cernicharo, J. 2014, ApJ, 795, 13
- Bertoldi (1989) Bertoldi, F. 1989, ApJ, 346, 735
- Bertoldi & Draine (1996) Bertoldi, F. & Draine, B. T. 1996, ApJ, 458, 222
- Beuther et al. (2007) Beuther, H., Churchwell, E. B., McKee, C. F., & Tan, J. C. 2007, Protostars and Planets V, 165
- Black (1998) Black, J. H. 1998, Faraday Discussions, 109, 257
- Blake et al. (1987) Blake, G. A., Sutton, E. C., Masson, C. R., & Phillips, T. G. 1987, ApJ, 315, 621
- Bron et al. (2018) Bron, E., Agúndez, M., Goicoechea, J. R., & Cernicharo, J. 2018, ArXiv e-prints
- Bron et al. (2014) Bron, E., Le Bourlot, J., & Le Petit, F. 2014, A&A, 569, A100
- Burton et al. (1990) Burton, M. G., Hollenbach, D. J., & Tielens, A. G. G. M. 1990, ApJ, 365, 620
- Cardelli et al. (1989) Cardelli, J. A., Clayton, G. C., & Mathis, J. S. 1989, ApJ, 345, 245
- Carroll & Goldsmith (1981) Carroll, T. J. & Goldsmith, P. F. 1981, ApJ, 245, 891
- Cernicharo et al. (1997) Cernicharo, J., Liu, X.-W., González-Alfonso, E., et al. 1997, ApJ, 483, L65
- Chen et al. (2014) Chen, J.-H., Goldsmith, P. F., Viti, S., et al. 2014, ApJ, 793, 111
- Cuadrado et al. (2017) Cuadrado, S., Goicoechea, J. R., Cernicharo, J., et al. 2017, A&A, 603, A124
- Cuadrado et al. (2015) Cuadrado, S., Goicoechea, J. R., Pilleri, P., et al. 2015, A&A, 575, A82
- Cuadrado et al. (2016) Cuadrado, S., Goicoechea, J. R., Roncero, O., et al. 2016, A&A, 596, L1
- Dalgarno & McCray (1972) Dalgarno, A. & McCray, R. A. 1972, ARA&A, 10, 375
- de Graauw et al. (2010) de Graauw, T., Helmich, F. P., Phillips, T. G., et al. 2010, A&A, 518, L6
- Douglas & Herzberg (1941) Douglas, A. E. & Herzberg, G. 1941, ApJ, 94, 381
- Draine (1995) Draine, B. T. 1995, Ap&SS, 233, 111
- Draine & Katz (1986) Draine, B. T. & Katz, N. 1986, ApJ, 310, 392
- Elitzur & Watson (1978) Elitzur, M. & Watson, W. D. 1978, ApJ, 222, L141
- Etxaluze et al. (2013) Etxaluze, M., Goicoechea, J. R., Cernicharo, J., et al. 2013, A&A, 556, A137
- Falgarone et al. (2010a) Falgarone, E., Godard, B., Cernicharo, J., et al. 2010a, A&A, 521, L15
- Falgarone et al. (2010b) Falgarone, E., Ossenkopf, V., Gerin, M., et al. 2010b, A&A, 518, L118
- Falgarone et al. (1995) Falgarone, E., Pineau des Forets, G., & Roueff, E. 1995, A&A, 300, 870
- Falgarone et al. (2017) Falgarone, E., Zwaan, M. A., Godard, B., et al. 2017, Nature, 548, 430
- Faure et al. (2017) Faure, A., Halvick, P., Stoecklin, T., et al. 2017, MNRAS, 469, 612
- Faure & Tennyson (2001) Faure, A. & Tennyson, J. 2001, MNRAS, 325, 443
- Flower (1999) Flower, D. R. 1999, MNRAS, 305, 651
- Fuente et al. (2008) Fuente, A., García-Burillo, S., Usero, A., et al. 2008, A&A, 492, 675
- Fuente et al. (2003) Fuente, A., Rodrıguez-Franco, A., Garcıa-Burillo, S., Martın-Pintado, J., & Black, J. H. 2003, A&A, 406, 899
- Gao & Solomon (2004) Gao, Y. & Solomon, P. M. 2004, ApJ, 606, 271
- Genzel & Stutzki (1989) Genzel, R. & Stutzki, J. 1989, ARA&A, 27, 41
- Gerin et al. (2016) Gerin, M., Neufeld, D. A., & Goicoechea, J. R. 2016, ARA&A, 54, 181
- Gerin et al. (2015) Gerin, M., Ruaud, M., Goicoechea, J. R., et al. 2015, A&A, 573, A30
- Gibb et al. (2004) Gibb, E. L., Whittet, D. C. B., Boogert, A. C. A., & Tielens, A. G. G. M. 2004, ApJS, 151, 35
- Godard & Cernicharo (2013) Godard, B. & Cernicharo, J. 2013, A&A, 550, A8
- Godard et al. (2012) Godard, B., Falgarone, E., Gerin, M., et al. 2012, A&A, 540, A87
- Godard et al. (2009) Godard, B., Falgarone, E., & Pineau Des Forêts, G. 2009, A&A, 495, 847
- Godard et al. (2014) Godard, B., Falgarone, E., & Pineau des Forêts, G. 2014, A&A, 570, A27
- Goicoechea et al. (2012) Goicoechea, J. R., Cernicharo, J., Karska, A., et al. 2012, A&A, 548, A77
- Goicoechea et al. (2015a) Goicoechea, J. R., Chavarría, L., Cernicharo, J., et al. 2015a, ApJ, 799, 102
- Goicoechea et al. (2017) Goicoechea, J. R., Cuadrado, S., Pety, J., et al. 2017, A&A, 601, L9
- Goicoechea & Le Bourlot (2007) Goicoechea, J. R. & Le Bourlot, J. 2007, A&A, 467, 1
- Goicoechea et al. (2016) Goicoechea, J. R., Pety, J., Cuadrado, S., et al. 2016, Nature, 537, 207
- Goicoechea et al. (2006) Goicoechea, J. R., Pety, J., Gerin, M., et al. 2006, A&A, 456, 565
- Goicoechea et al. (2015b) Goicoechea, J. R., Teyssier, D., Etxaluze, M., et al. 2015b, ApJ, 812, 75
- Goldsmith et al. (1997) Goldsmith, P. F., Bergin, E. A., & Lis, D. C. 1997, ApJ, 491, 615
- Goldsmith & Kauffmann (2017) Goldsmith, P. F. & Kauffmann, J. 2017, ApJ, 841, 25
- Goldsmith et al. (2012) Goldsmith, P. F., Langer, W. D., Pineda, J. L., & Velusamy, T. 2012, ApJS, 203, 13
- González-Alfonso et al. (2017) González-Alfonso, E., Fischer, J., Spoon, H. W. W., et al. 2017, ApJ, 836, 11
- González-Alfonso et al. (2002) González-Alfonso, E., Wright, C. M., Cernicharo, J., et al. 2002, A&A, 386, 1074
- GRAVITY collaboration et al. (2018) GRAVITY collaboration, Karl, M., Pfuhl, O., et al. 2018, ArXiv e-prints
- Großschedl et al. (2018) Großschedl, J. E., Alves, J., Meingast, S., et al. 2018, A&A, 619, A106
- Habing (1968) Habing, H. J. 1968, Bull. Astron. Inst. Netherlands, 19, 421
- Hacar et al. (2017) Hacar, A., Alves, J., Tafalla, M., & Goicoechea, J. R. 2017, A&A, 602, L2
- Hacar et al. (2018) Hacar, A., Tafalla, M., Forbrich, J., et al. 2018, A&A, 610, A77
- Haid et al. (2018) Haid, S., Walch, S., Seifried, D., et al. 2018, MNRAS, 478, 4799
- Hailey-Dunsheath et al. (2012) Hailey-Dunsheath, S., Sturm, E., Fischer, J., et al. 2012, ApJ, 755, 57
- Hartmann & Burkert (2007) Hartmann, L. & Burkert, A. 2007, ApJ, 654, 988
- Herczeg et al. (2012) Herczeg, G. J., Karska, A., Bruderer, S., et al. 2012, A&A, 540, A84
- Herráez-Aguilar et al. (2014) Herráez-Aguilar, D., Jambrina, P. G., Menéndez, M., et al. 2014, Physical Chemistry Chemical Physics (Incorporating Faraday Transactions), 16, 24800
- Herrmann et al. (1997) Herrmann, F., Madden, S. C., Nikola, T., et al. 1997, ApJ, 481, 343
- Hierl et al. (1997) Hierl, P. M., Morris, R. A., & Viggiano, A. A. 1997, J. Chem. Phys., 106, 10145
- Hill & Hollenbach (1978) Hill, J. K. & Hollenbach, D. J. 1978, ApJ, 225, 390
- Hogerheijde et al. (1995) Hogerheijde, M. R., Jansen, D. J., & van Dishoeck, E. F. 1995, A&A, 294, 792
- Hollenbach & Tielens (1997) Hollenbach, D. J. & Tielens, A. G. G. M. 1997, ARA&A, 35, 179
- Hosokawa & Inutsuka (2006) Hosokawa, T. & Inutsuka, S.-i. 2006, ApJ, 646, 240
- Imanishi et al. (2018) Imanishi, M., Nakanishi, K., & Izumi, T. 2018, ApJ, 856, 143
- Indriolo et al. (2017) Indriolo, N., Bergin, E. A., Goicoechea, J. R., et al. 2017, ApJ, 836, 117
- Jiménez-Serra et al. (2008) Jiménez-Serra, I., Caselli, P., Martín-Pintado, J., & Hartquist, T. W. 2008, A&A, 482, 549
- Joblin et al. (2018) Joblin, C., Bron, E., Pinto, C., et al. 2018, A&A, 615, A129
- Joulain et al. (1998) Joulain, K., Falgarone, E., Pineau des Forets, G., & Flower, D. 1998, A&A, 340, 241
- Kamenetzky et al. (2012) Kamenetzky, J., Glenn, J., Rangwala, N., et al. 2012, ApJ, 753, 70
- Kamenetzky et al. (2014) Kamenetzky, J., Rangwala, N., Glenn, J., Maloney, P. R., & Conley, A. 2014, ApJ, 795, 174
- Kaplan et al. (2017) Kaplan, K. F., Dinerstein, H. L., Oh, H., et al. 2017, ApJ, 838, 152
- Karska et al. (2013) Karska, A., Herczeg, G. J., van Dishoeck, E. F., et al. 2013, A&A, 552, A141
- Karska et al. (2014) Karska, A., Herpin, F., Bruderer, S., et al. 2014, A&A, 562, A45
- Kauffmann et al. (2017) Kauffmann, J., Goldsmith, P. F., Melnick, G., et al. 2017, A&A, 605, L5
- Kaufman et al. (1999) Kaufman, M. J., Wolfire, M. G., Hollenbach, D. J., & Luhman, M. L. 1999, ApJ, 527, 795
- Krips et al. (2008) Krips, M., Neri, R., García-Burillo, S., et al. 2008, ApJ, 677, 262
- Kristensen et al. (2012) Kristensen, L. E., van Dishoeck, E. F., Bergin, E. A., et al. 2012, A&A, 542, A8
- Krumholz et al. (2014) Krumholz, M. R., Bate, M. R., Arce, H. G., et al. 2014, Protostars and Planets VI, 243
- Kwan & Scoville (1976) Kwan, J. & Scoville, N. 1976, ApJ, 210, L39
- Langer & Penzias (1990) Langer, W. D. & Penzias, A. A. 1990, ApJ, 357, 477
- Le Petit et al. (2006) Le Petit, F., Nehmé, C., Le Bourlot, J., & Roueff, E. 2006, ApJS, 164, 506
- Lesaffre et al. (2007) Lesaffre, P., Gerin, M., & Hennebelle, P. 2007, A&A, 469, 949
- Luhman et al. (1994) Luhman, M. L., Jaffe, D. T., Keller, L. D., & Pak, S. 1994, ApJ, 436, L185
- Manoj et al. (2013) Manoj, P., Watson, D. M., Neufeld, D. A., et al. 2013, ApJ, 763, 83
- McKee & Ostriker (2007) McKee, C. F. & Ostriker, E. C. 2007, ARA&A, 45, 565
- Meingast et al. (2016) Meingast, S., Alves, J., Mardones, D., et al. 2016, A&A, 587, A153
- Melnick & Kaufman (2015) Melnick, G. J. & Kaufman, M. J. 2015, ApJ, 806, 227
- Melnick et al. (2010) Melnick, G. J., Tolls, V., Neufeld, D. A., et al. 2010, A&A, 521, L27
- Menten et al. (2007) Menten, K. M., Reid, M. J., Forbrich, J., & Brunthaler, A. 2007, A&A, 474, 515
- Morris et al. (2016) Morris, P. W., Gupta, H., Nagy, Z., et al. 2016, ApJ, 829, 15
- Nagy et al. (2017) Nagy, Z., Choi, Y., Ossenkopf-Okada, V., et al. 2017, A&A, 599, A22
- Nagy et al. (2013) Nagy, Z., Van der Tak, F. F. S., Ossenkopf, V., et al. 2013, A&A, 550, A96
- Naylor et al. (2010) Naylor, D. A., Dartois, E., Habart, E., et al. 2010, A&A, 518, L117
- Nisini et al. (2010) Nisini, B., Benedettini, M., Codella, C., et al. 2010, A&A, 518, L120
- O’Dell (2001) O’Dell, C. R. 2001, ARA&A, 39, 99
- O’Dell et al. (2009) O’Dell, C. R., Henney, W. J., Abel, N. P., Ferland, G. J., & Arthur, S. J. 2009, AJ, 137, 367
- Ossenkopf et al. (2013) Ossenkopf, V., Röllig, M., Neufeld, D. A., et al. 2013, A&A, 550, A57
- Pabst et al. (2017) Pabst, C. H. M., Goicoechea, J. R., Teyssier, D., et al. 2017, A&A, 606, A29
- Parikka et al. (2017) Parikka, A., Habart, E., Bernard-Salas, J., et al. 2017, A&A, 599, A20
- Pellegrini et al. (2009) Pellegrini, E. W., Baldwin, J. A., Ferland, G. J., Shaw, G., & Heathcote, S. 2009, ApJ, 693, 285
- Peng et al. (2012) Peng, T.-C., Wyrowski, F., Zapata, L. A., Güsten, R., & Menten, K. M. 2012, A&A, 538, A12
- Pety et al. (2017) Pety, J., Guzmán, V. V., Orkisz, J. H., et al. 2017, A&A, 599, A98
- Pilbratt et al. (2010) Pilbratt, G. L., Riedinger, J. R., Passvogel, T., et al. 2010, A&A, 518, L1
- Pilleri et al. (2014) Pilleri, P., Fuente, A., Gerin, M., et al. 2014, A&A, 561, A69
- Pineau des Forets et al. (1986) Pineau des Forets, G., Flower, D. R., Hartquist, T. W., & Dalgarno, A. 1986, MNRAS, 220, 801
- Pineda et al. (2013) Pineda, J. L., Langer, W. D., Velusamy, T., & Goldsmith, P. F. 2013, A&A, 554, A103
- Poglitsch et al. (2010) Poglitsch, A., Waelkens, C., Geis, N., et al. 2010, A&A, 518, L2
- Rahner et al. (2017) Rahner, D., Pellegrini, E. W., Glover, S. C. O., & Klessen, R. S. 2017, MNRAS, 470, 4453
- Rodríguez-Franco et al. (1998) Rodríguez-Franco, A., Martin-Pintado, J., & Fuente, A. 1998, A&A, 329, 1097
- Rodríguez-Franco et al. (2001) Rodríguez-Franco, A., Wilson, T. L., Martín-Pintado, J., & Fuente, A. 2001, ApJ, 559, 985
- Rosenthal et al. (2000) Rosenthal, D., Bertoldi, F., & Drapatz, S. 2000, A&A, 356, 705
- Salas et al. (2014) Salas, P., Galaz, G., Salter, D., et al. 2014, ApJ, 797, 134
- Schmid-Burgk et al. (1989) Schmid-Burgk, J., Densing, R., Krugel, E., et al. 1989, A&A, 215, 150
- Simón-Díaz et al. (2006) Simón-Díaz, S., Herrero, A., Esteban, C., & Najarro, F. 2006, A&A, 448, 351
- Stacey et al. (1993) Stacey, G. J., Jaffe, D. T., Geis, N., et al. 1993, ApJ, 404, 219
- Sternberg & Dalgarno (1995) Sternberg, A. & Dalgarno, A. 1995, ApJS, 99, 565
- Störzer & Hollenbach (1998) Störzer, H. & Hollenbach, D. 1998, ApJ, 495, 853
- Sturm et al. (2010) Sturm, E., Verma, A., Graciá-Carpio, J., et al. 2010, A&A, 518, L36
- Tahani et al. (2016) Tahani, K., Plume, R., Bergin, E. A., et al. 2016, ApJ, 832, 12
- Tan et al. (2014) Tan, J. C., Beltrán, M. T., Caselli, P., et al. 2014, Protostars and Planets VI, 149
- Tercero et al. (2010) Tercero, B., Cernicharo, J., Pardo, J. R., & Goicoechea, J. R. 2010, A&A, 517, A96
- Ungerechts et al. (1997) Ungerechts, H., Bergin, E. A., Goldsmith, P. F., et al. 1997, ApJ, 482, 245
- Usero et al. (2015) Usero, A., Leroy, A. K., Walter, F., et al. 2015, AJ, 150, 115
- Valdivia et al. (2017) Valdivia, V., Godard, B., Hennebelle, P., et al. 2017, A&A, 600, A114
- van der Tak et al. (2013) van der Tak, F. F. S., Chavarría, L., Herpin, F., et al. 2013, A&A, 554, A83
- van der Tak et al. (2012) van der Tak, F. F. S., Ossenkopf, V., Nagy, Z., et al. 2012, A&A, 537, L10
- van Dishoeck et al. (2013) van Dishoeck, E. F., Herbst, E., & Neufeld, D. A. 2013, Chemical Reviews, 113, 9043
- van Dishoeck et al. (2011) van Dishoeck, E. F., Kristensen, L. E., Benz, A. O., et al. 2011, PASP, 123, 138
- Wareing et al. (2018) Wareing, C. J., Pittard, J. M., Wright, N. J., & Falle, S. A. E. G. 2018, MNRAS, 475, 3598
- Wilson et al. (2001) Wilson, T. L., Muders, D., Kramer, C., & Henkel, C. 2001, ApJ, 557, 240
- Wu et al. (2018) Wu, R., Bron, E., Onaka, T., et al. 2018, A&A, 618, A53
- Yang et al. (2010) Yang, B., Stancil, P. C., Balakrishnan, N., & Forrey, R. C. 2010, ApJ, 718, 1062
- Zanchet et al. (2013) Zanchet, A., Godard, B., Bulut, N., et al. 2013, ApJ, 766, 80
- Zinnecker & Yorke (2007) Zinnecker, H. & Yorke, H. W. 2007, ARA&A, 45, 481
- Ziurys & Turner (1986) Ziurys, L. M. & Turner, B. E. 1986, ApJ, 300, L19
- Zuckerman (1973) Zuckerman, B. 1973, ApJ, 183, 863
Appendix A Complementary Tables
| vLSR (km s-1)a: | Line: | ||||||
|---|---|---|---|---|---|---|---|
| Position | CH+ 1–0 | [C ii] 158 m | CO 10–9 | CO 2–1 | 13CO 2–1 | C18O 2–1 | HCO+ 3–2 |
| 8.3(3) | 8.5(1) | 8.8(1) | 9.2(1) | 9.3(1) | 9.3(1) | 9.3(1) | |
| 9.2(3) | 8.7(1) | 9.3(1) | 9.2(1) | 9.3(1) | 9.3(1) | 9.3(1) | |
| 8.9(1) | 9.2(1) | 9.2(1) | 9.0(1) | 8.4(1) | 8.5(1) | 8.6(1) | |
| 10.6(1) | 10.4(1) | 10.7(1) | 10.1(1) | 10.2(1) | 10.3(1) | 10.3(1) | |
| 8.7(1) | 8.4(1) | 9.2(1) | 9.3(1) | 9.4(1) | 9.2(1) | 9.0(1) | |
| 9.8(1) | 9.3(1) | 9.4(2) | 9.4(1) | 9.2(1) | 9.3(1) | 9.4(1) | |
| 10.8(1) | 10.7(1) | 10.9(1) | 10.4(1) | 10.6(1) | 10.4(1) | 10.6(1) | |
| 10.9(1) | 10.3(1) | 10.5(9) | 9.9(1) | 9.7(2) | 9.4(2) | 9.3(1) | |
| 10.2(1) | 9.0(1) | 7.8(1) | 9.0(1) | 9.8(1) | 9.8(1) | 9.6(1) | |
| 8.3(1) | 8.5(1) | 8.8(1) | 8.4(1) | 8.5(1) | 8.4(1) | 8.2(1) | |
| Averageb | 10(3) | 9.3(9) | 9.6(8) | 9.4(6) | 9.4(7) | 9.3(6) | 9.3(7) |
| v (km s-1)a: | Line: | ||||||
|---|---|---|---|---|---|---|---|
| Position | CH+ 1–0 | [C ii] 158 m | CO 10–9 | CO 2–1 | 13CO 2–1 | C18O 2–1 | HCO+ 3–2 |
| 4.9(7) | 4.4(1) | 2.3(1) | 3.9(1) | 2.6(1) | 2.2(1) | 2.7(1) | |
| 4.4(6) | 4.1(2) | 1.8(1) | 4.0(1) | 2.5(1) | 2.0(1) | 2.5(1) | |
| 5.7(1) | 4.9(1) | 4.4(1) | 4.9(1) | 3.8(1) | 3.2(2) | 3.8(1) | |
| 5.3(1) | 4.0(1) | 3.4(1) | 4.1(1) | 2.6(1) | 2.1(1) | 3.2(1) | |
| 4.8(2) | 3.6(1) | 2.3(1) | 4.8(1) | 3.8(1) | 4.1(1) | 3.4(1) | |
| 4.1(1) | 2.9(1) | 2.2(1) | 3.3(1) | 2.1(1) | 1.8(1) | 2.3(1) | |
| 4.4(1) | 4.2(1) | 3.5(1) | 4.6(1) | 3.5(1) | 3.2(2) | 3.0(1) | |
| 6.5(1) | 5.5(1) | 4.7(2) | 4.6(1) | 3.2(1) | 4.4(3) | 5.3(2) | |
| 6.8(2) | 3.6(1) | 38.6(1) | 24.0(4) | 6.3(1) | 3.5(1) | 6.4(1) | |
| 4.4(2) | 3.4(1) | 3.5(1) | 5.0(1) | 3.3(1) | 3.3(1) | 3.5(1) | |
| Averageb | 4.9(7) | 4.1(7) | 3.0(1) | 4.4(5) | 3.0(6) | 2.9(9) | 3.3(8) |
| (K km s-1)a: | Line: | ||||||
|---|---|---|---|---|---|---|---|
| Position | CH+ 1–0 | [C ii] 158 m | CO 10–9 | CO 2–1 | 13CO 2–1 | C18O 2–1 | HCO+ 3–2 |
| 1.7(2) | 332.1(4) | 57.0(2) | 209.8(1) | 64.7(1) | 8.2(1) | 11.3(3) | |
| 2.2(3) | 349(12) | 53.5(2) | 216.3(1) | 67.1(2) | 10.7(1) | 22.5(3) | |
| 47.2(1) | 1048(3) | 408(1) | 446(3) | 111.0(1) | 17.6(1) | 75.5(2) | |
| 26.5(1) | 1081(2) | 324.6(3) | 384.0(7) | 56.5(1) | 5(1) | 27.6(2) | |
| 3.8(1) | 392(4) | 53.5(2) | 268.3(1) | 72.6(1) | 9.8(1) | 10.0(2) | |
| 7.1(1) | 492(1) | 153.0(2) | 255.6(2) | 57.6(5) | 5.5(1) | 18.8(3) | |
| 24.8(1) | 810(17) | 255.5(4) | 363(2) | 40.0(2) | 2.6(1) | 16.9(3) | |
| 6.7(1) | 508(8) | 10.5(4) | 175.3(1) | 17.6(1) | 1.6(1) | 7.9(3) | |
| 25.2(4) | 752(5) | 3626.3 | 1920(20) | 181(3) | 18.5(3) | 102(1) | |
| 4.0(1) | 290(1) | 87.1(5) | 265.8(2) | 52.8(1) | 6.8(1) | 20.5(3) | |
| Averageb | 14(15) | 589(292) | 156(133) | 287(85) | 60(24) | 8(5) | 23(19) |
Appendix B Complementary Figures
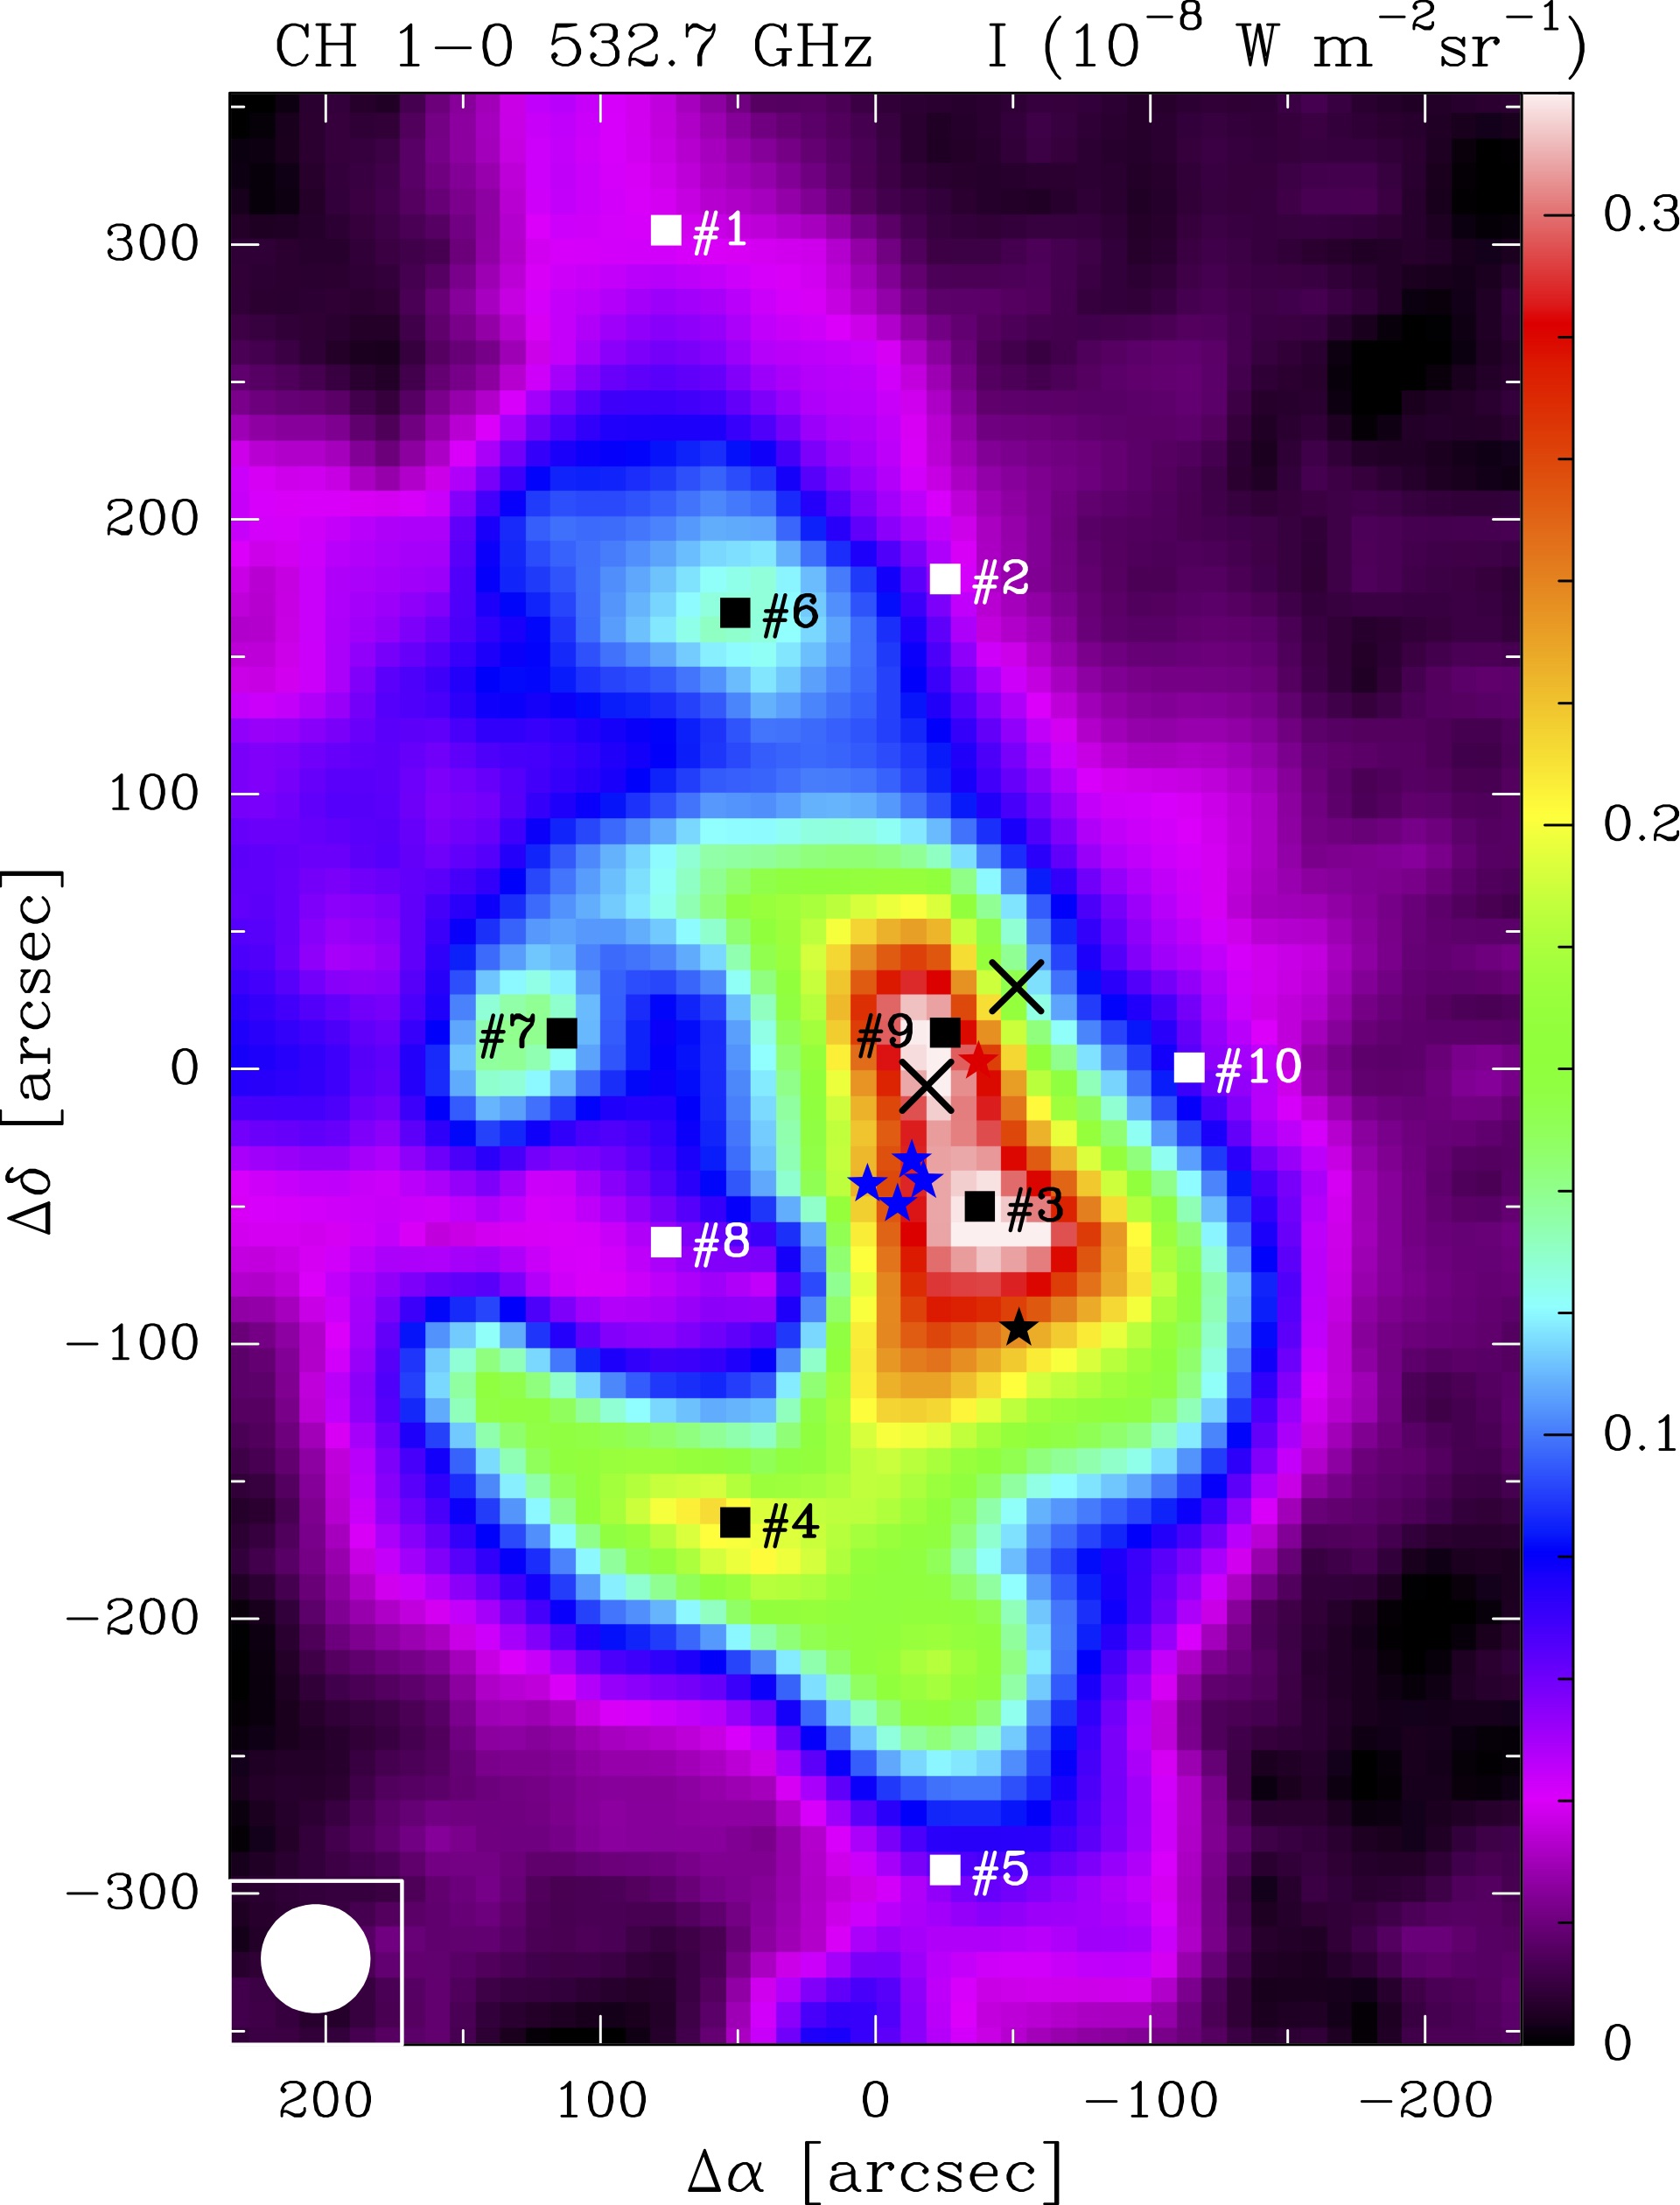
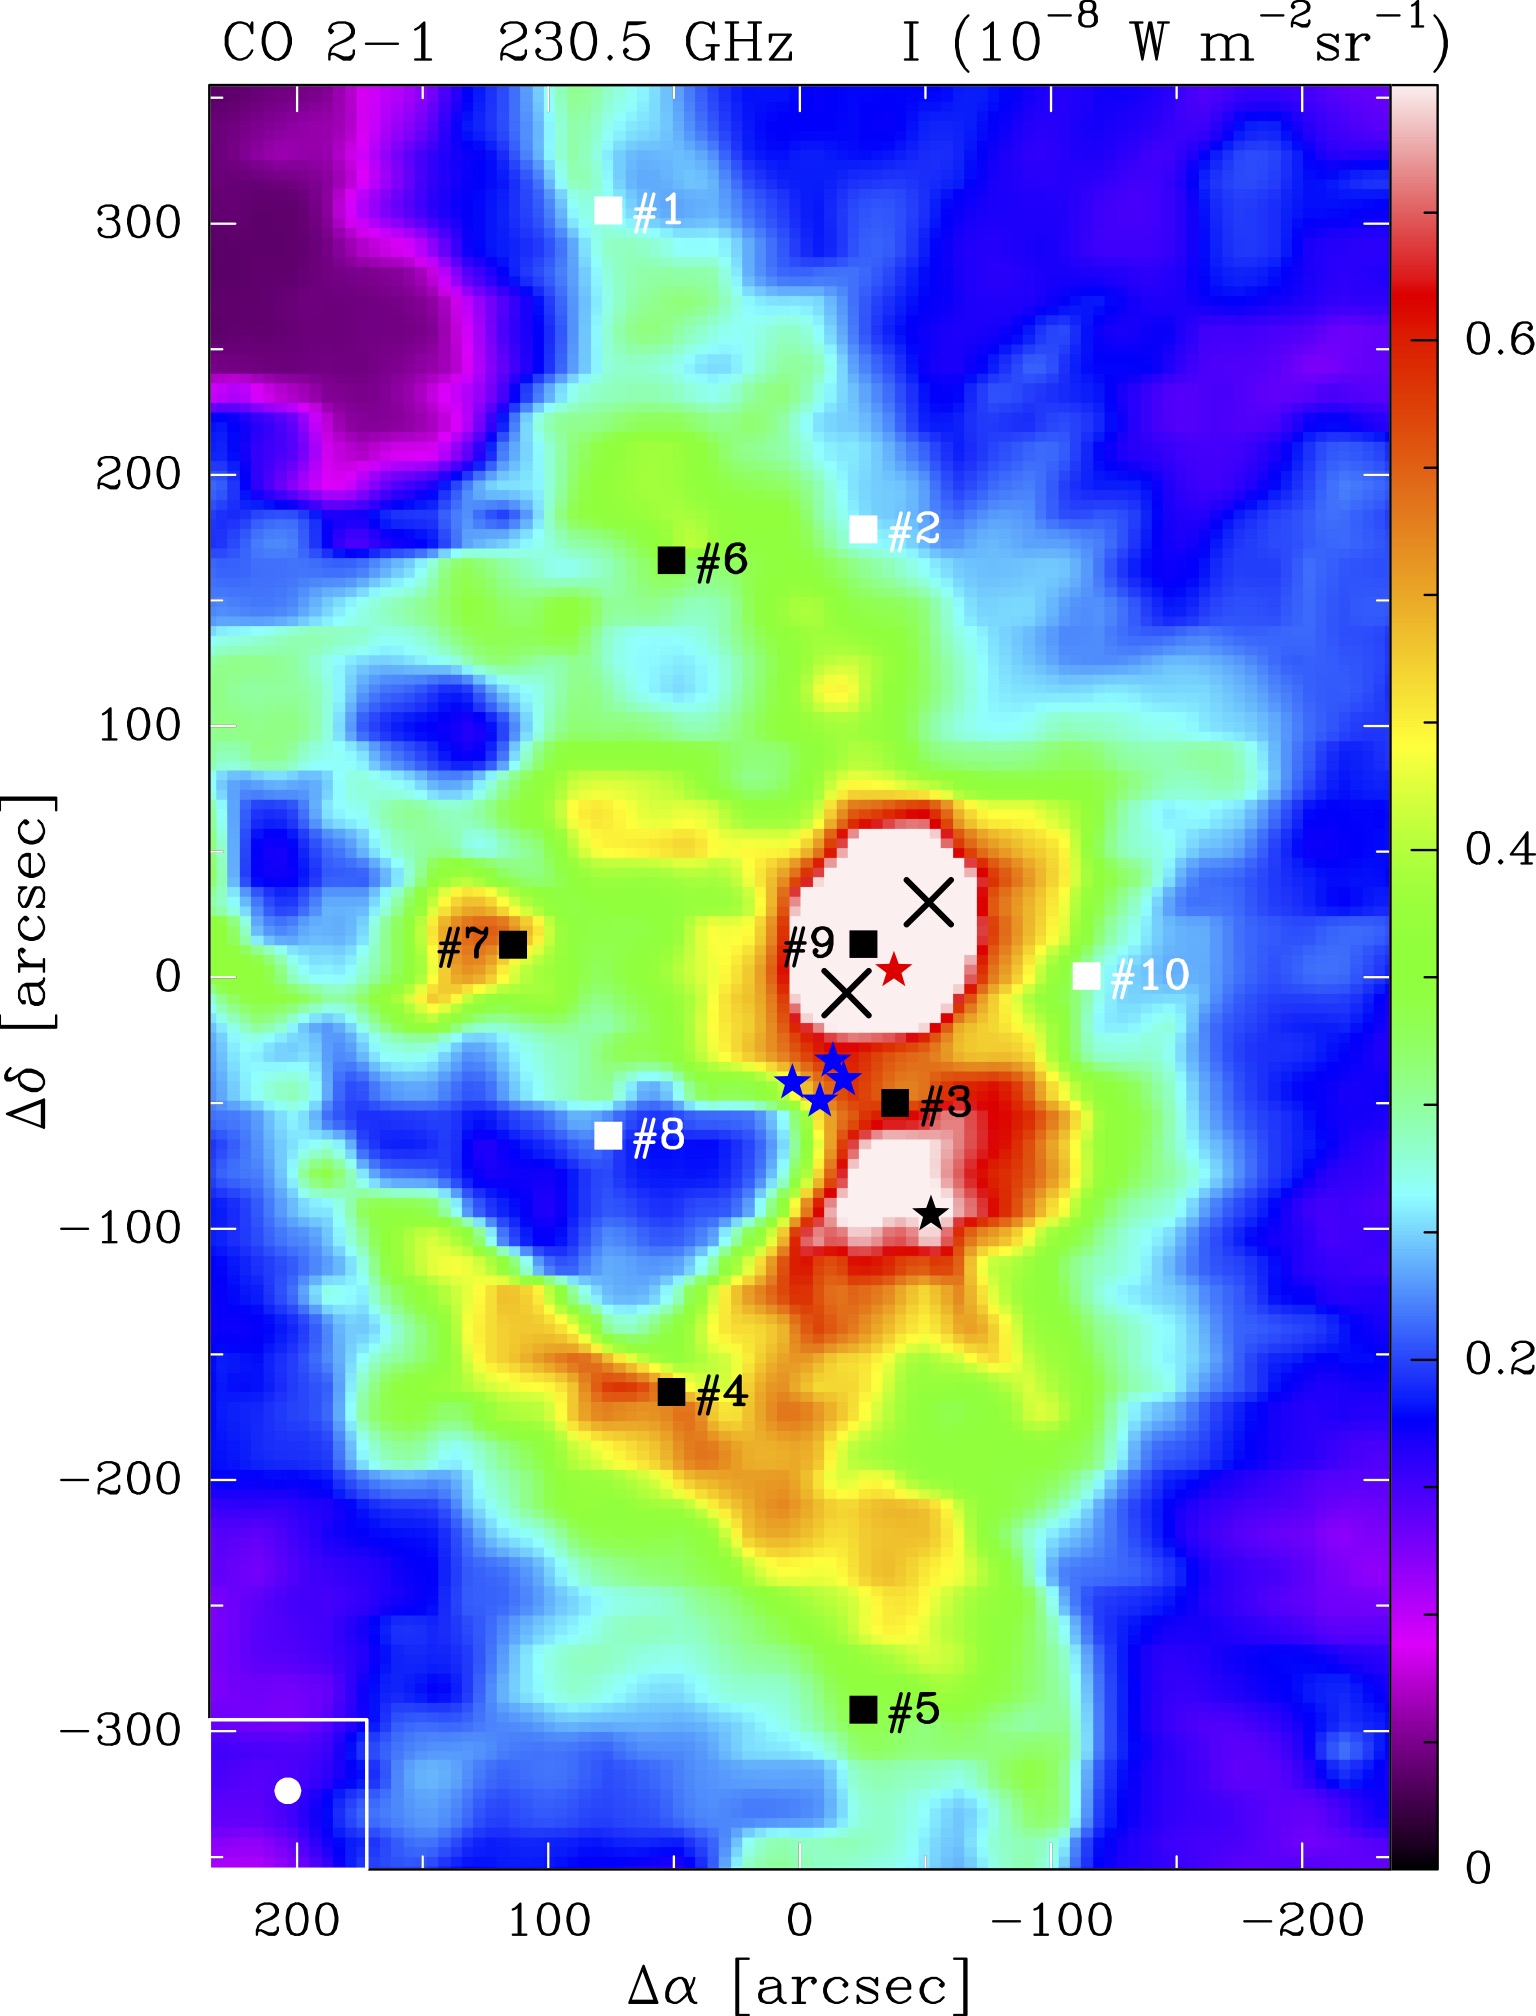
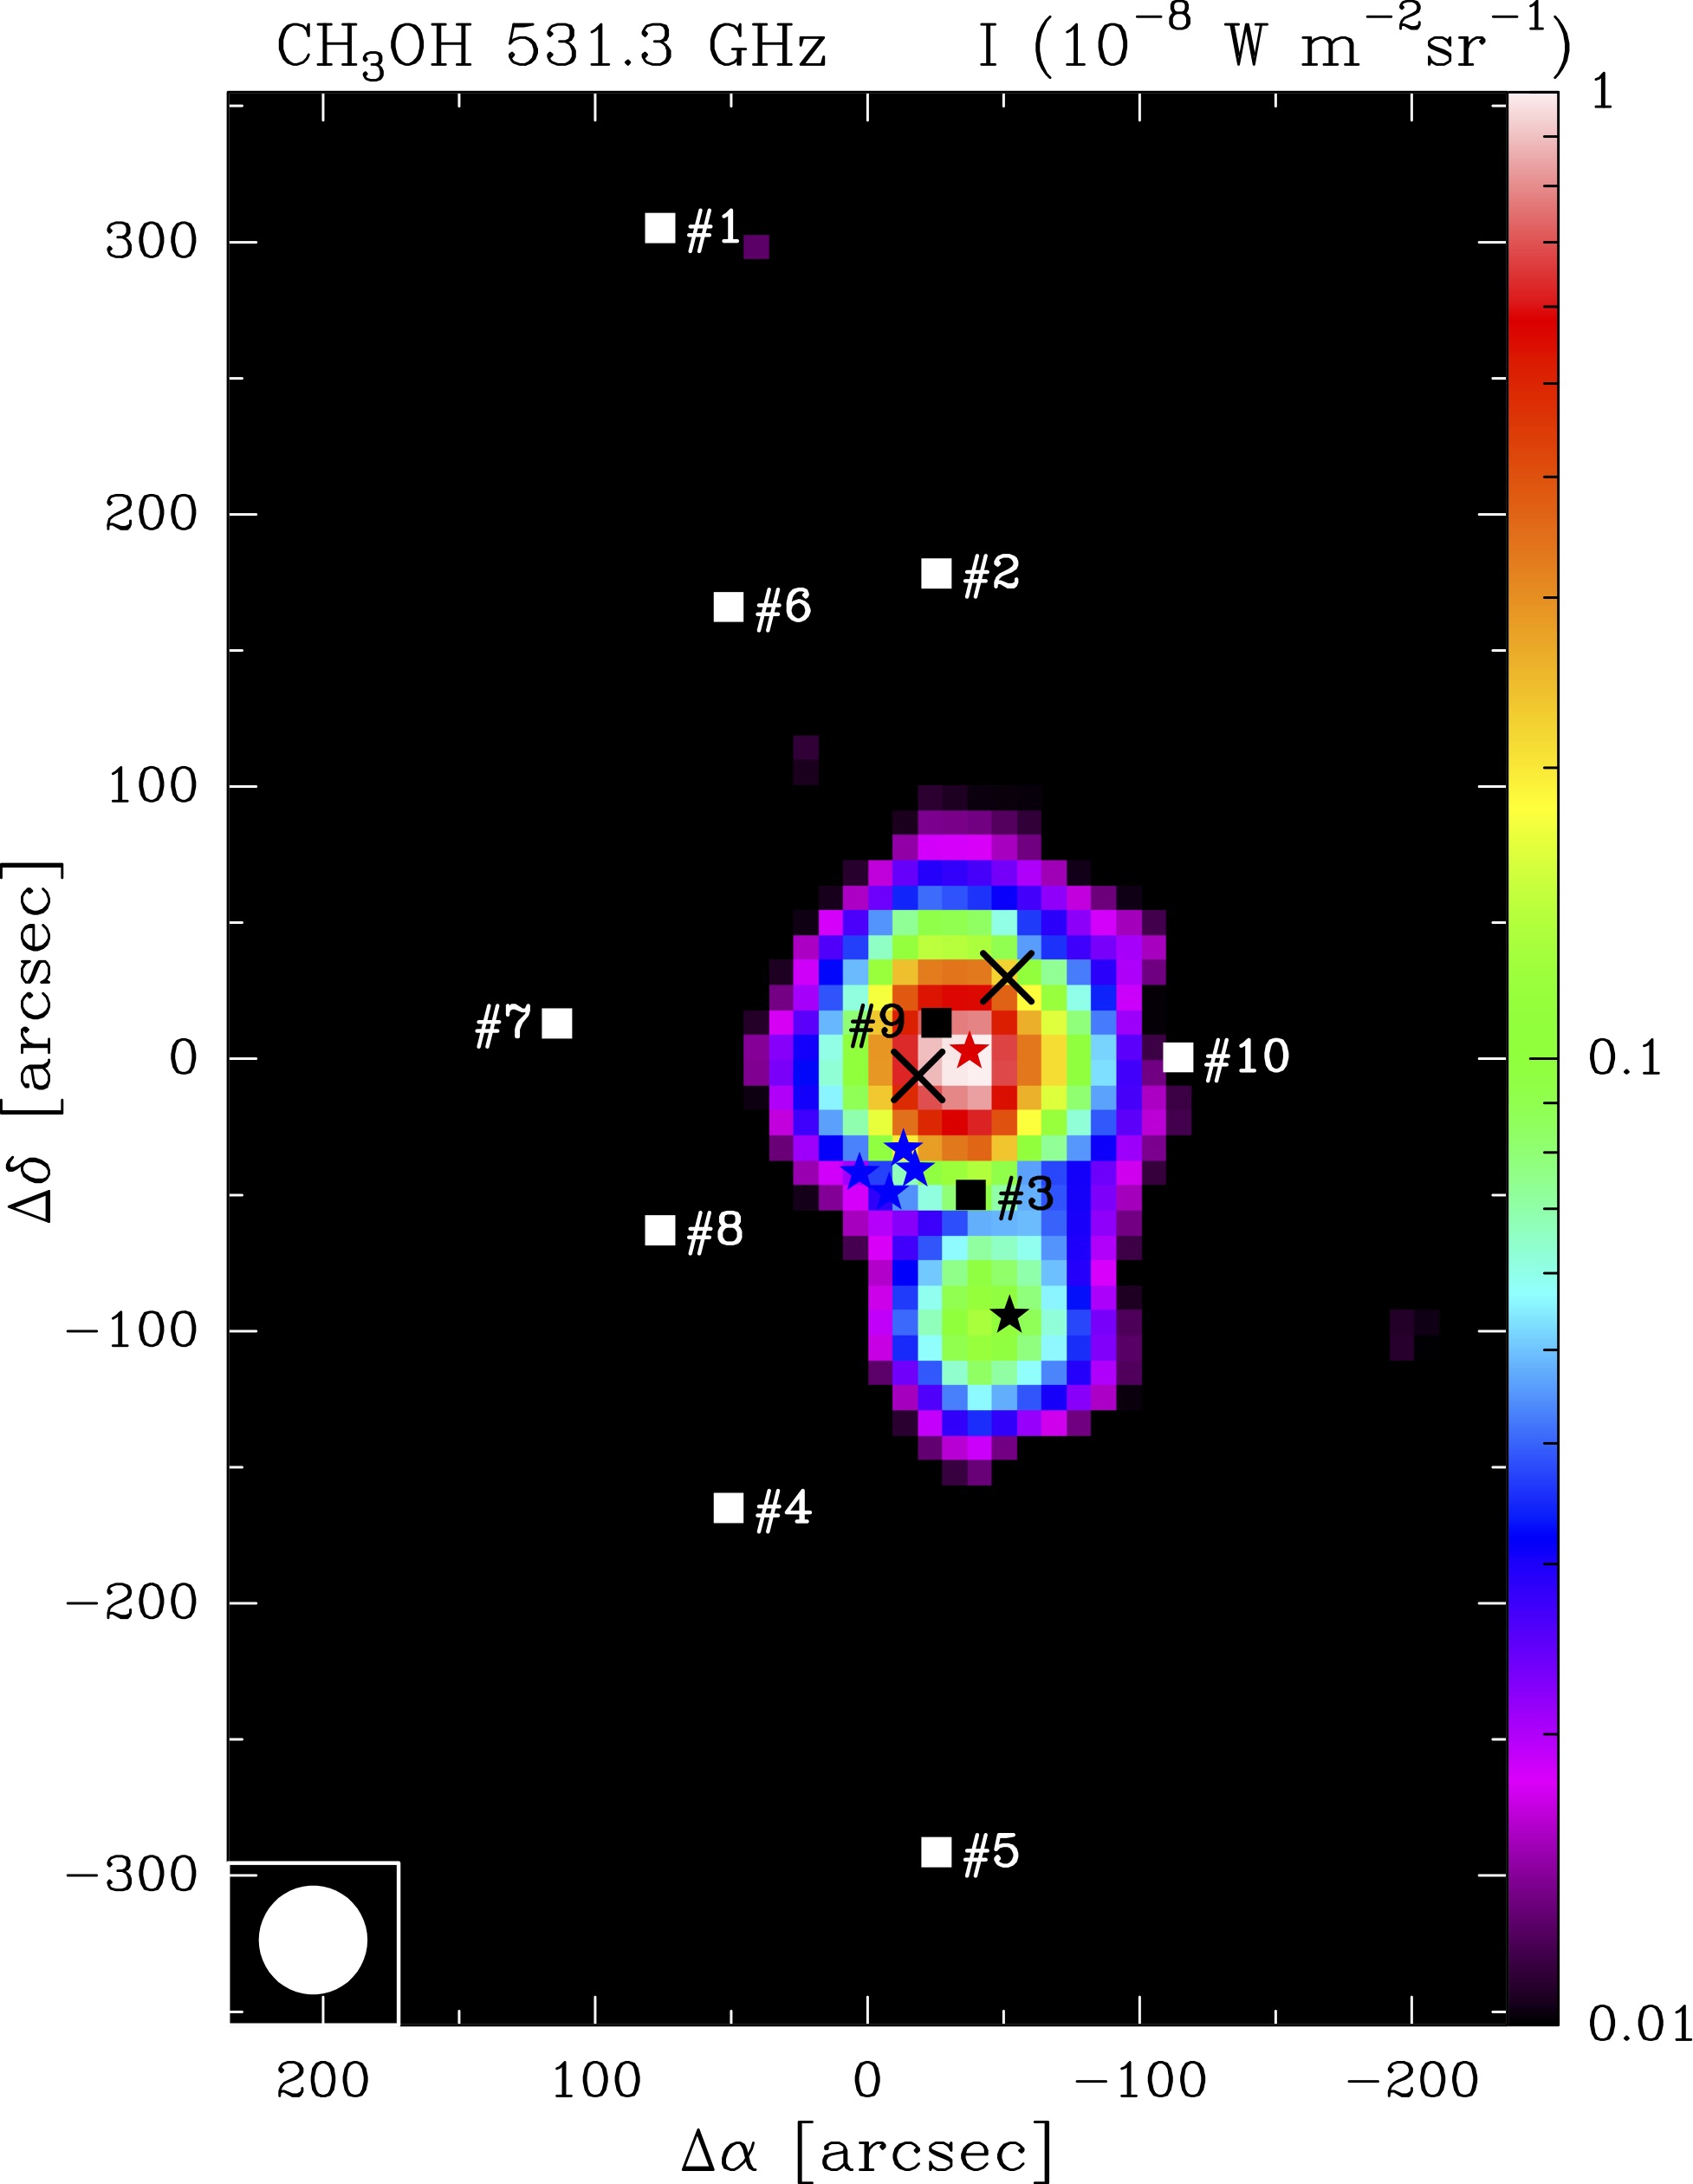
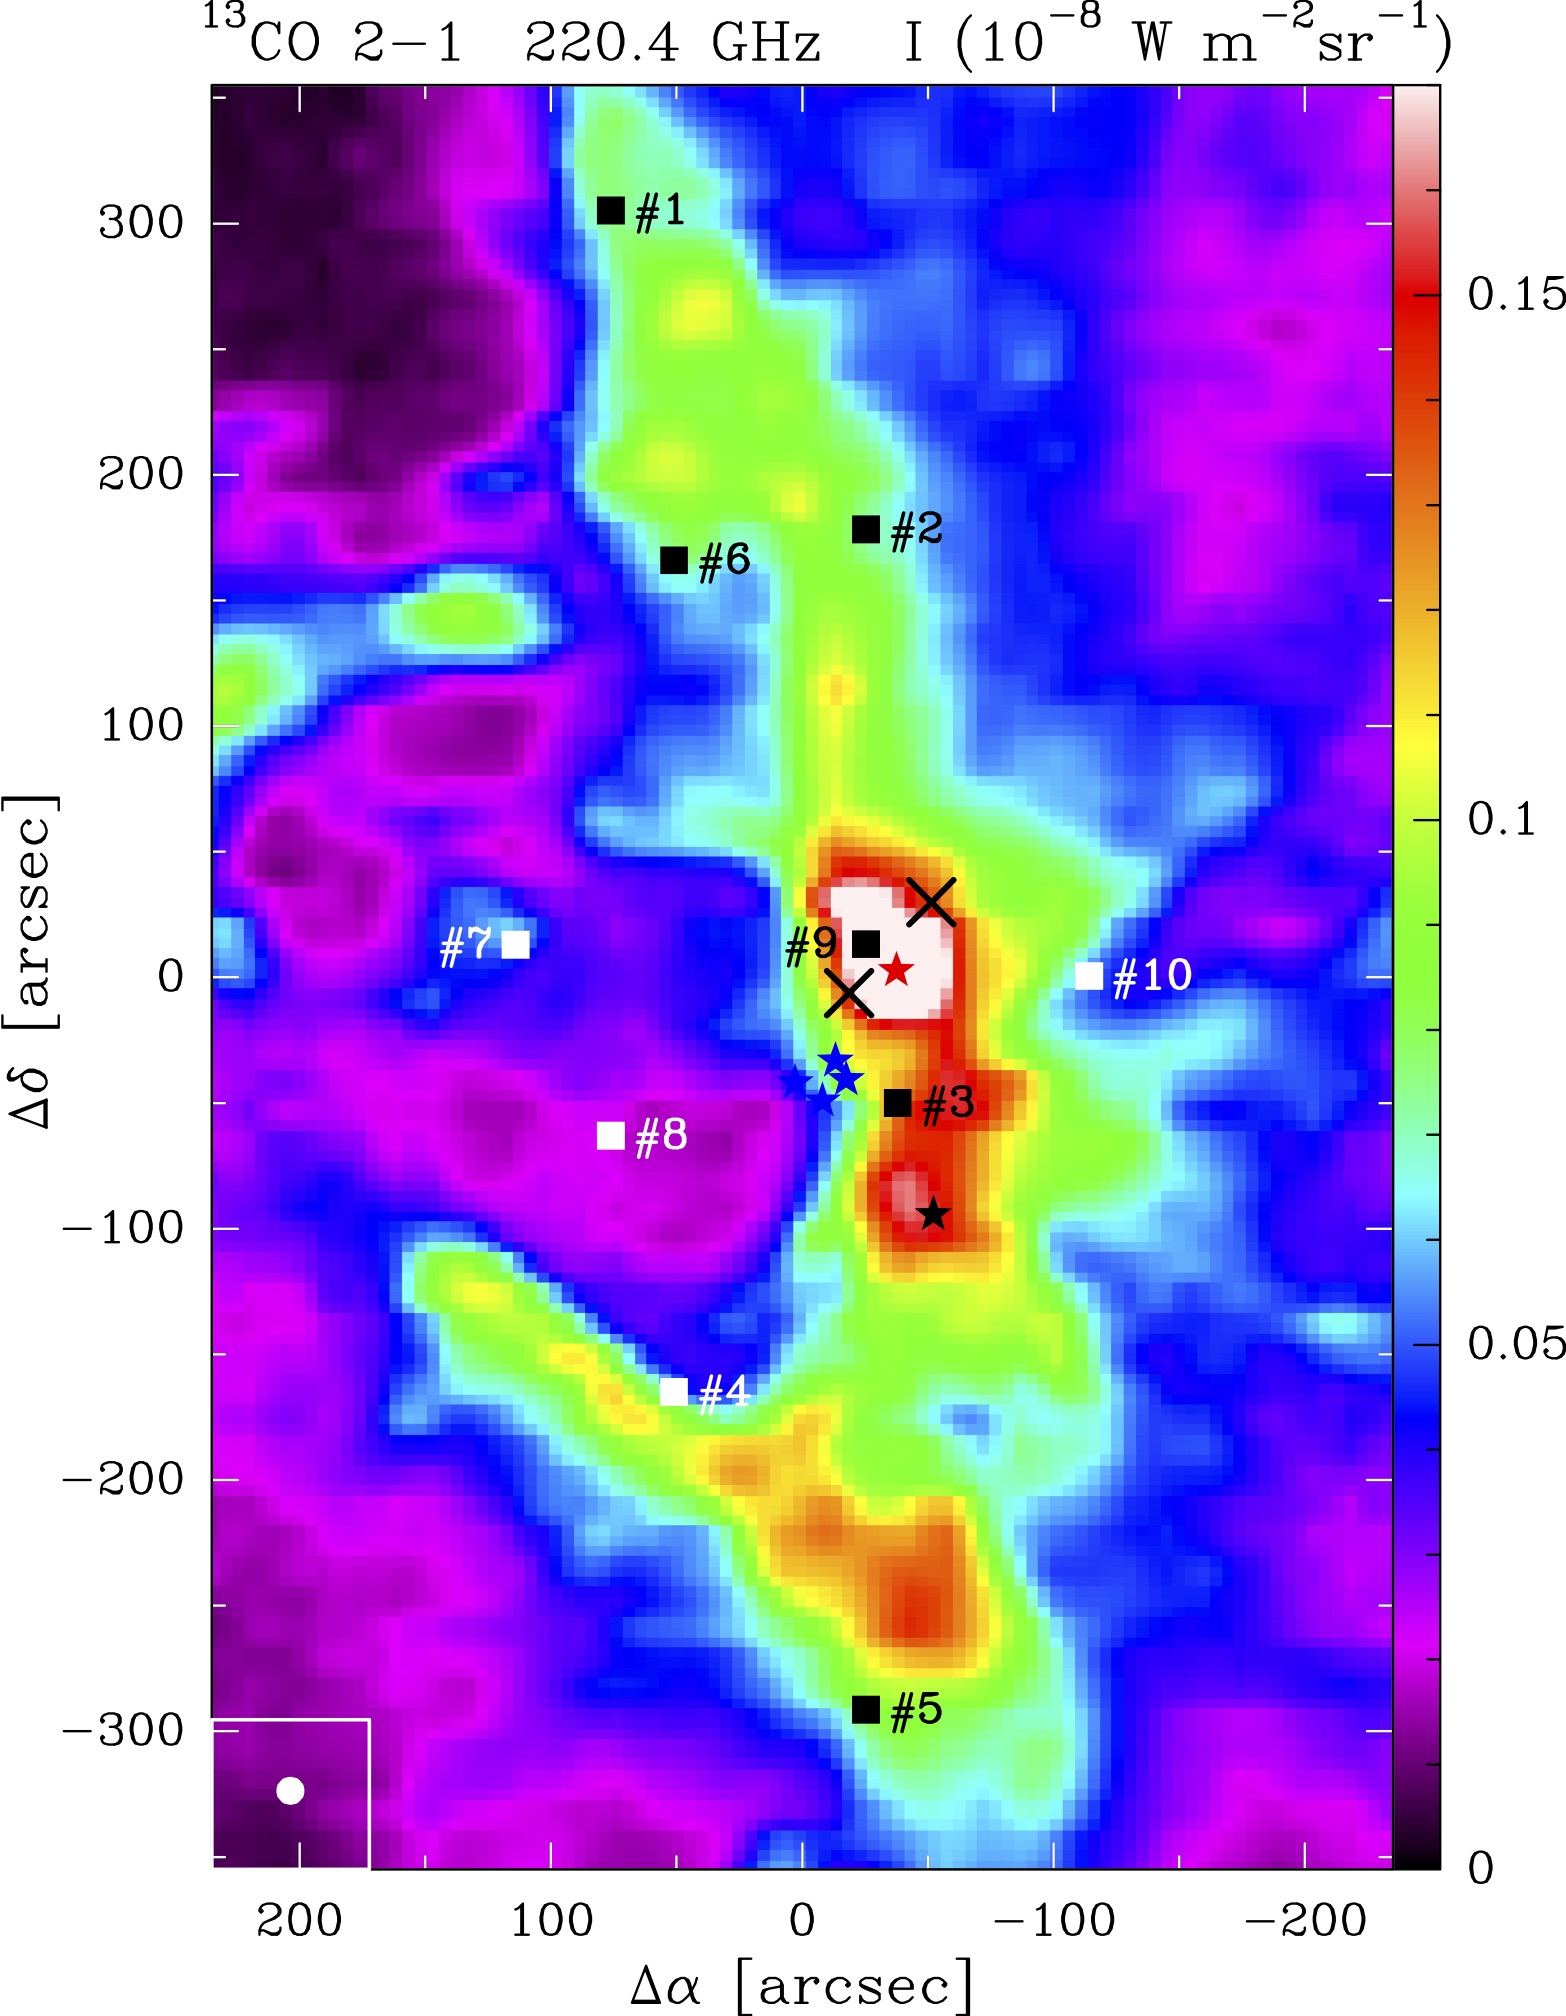
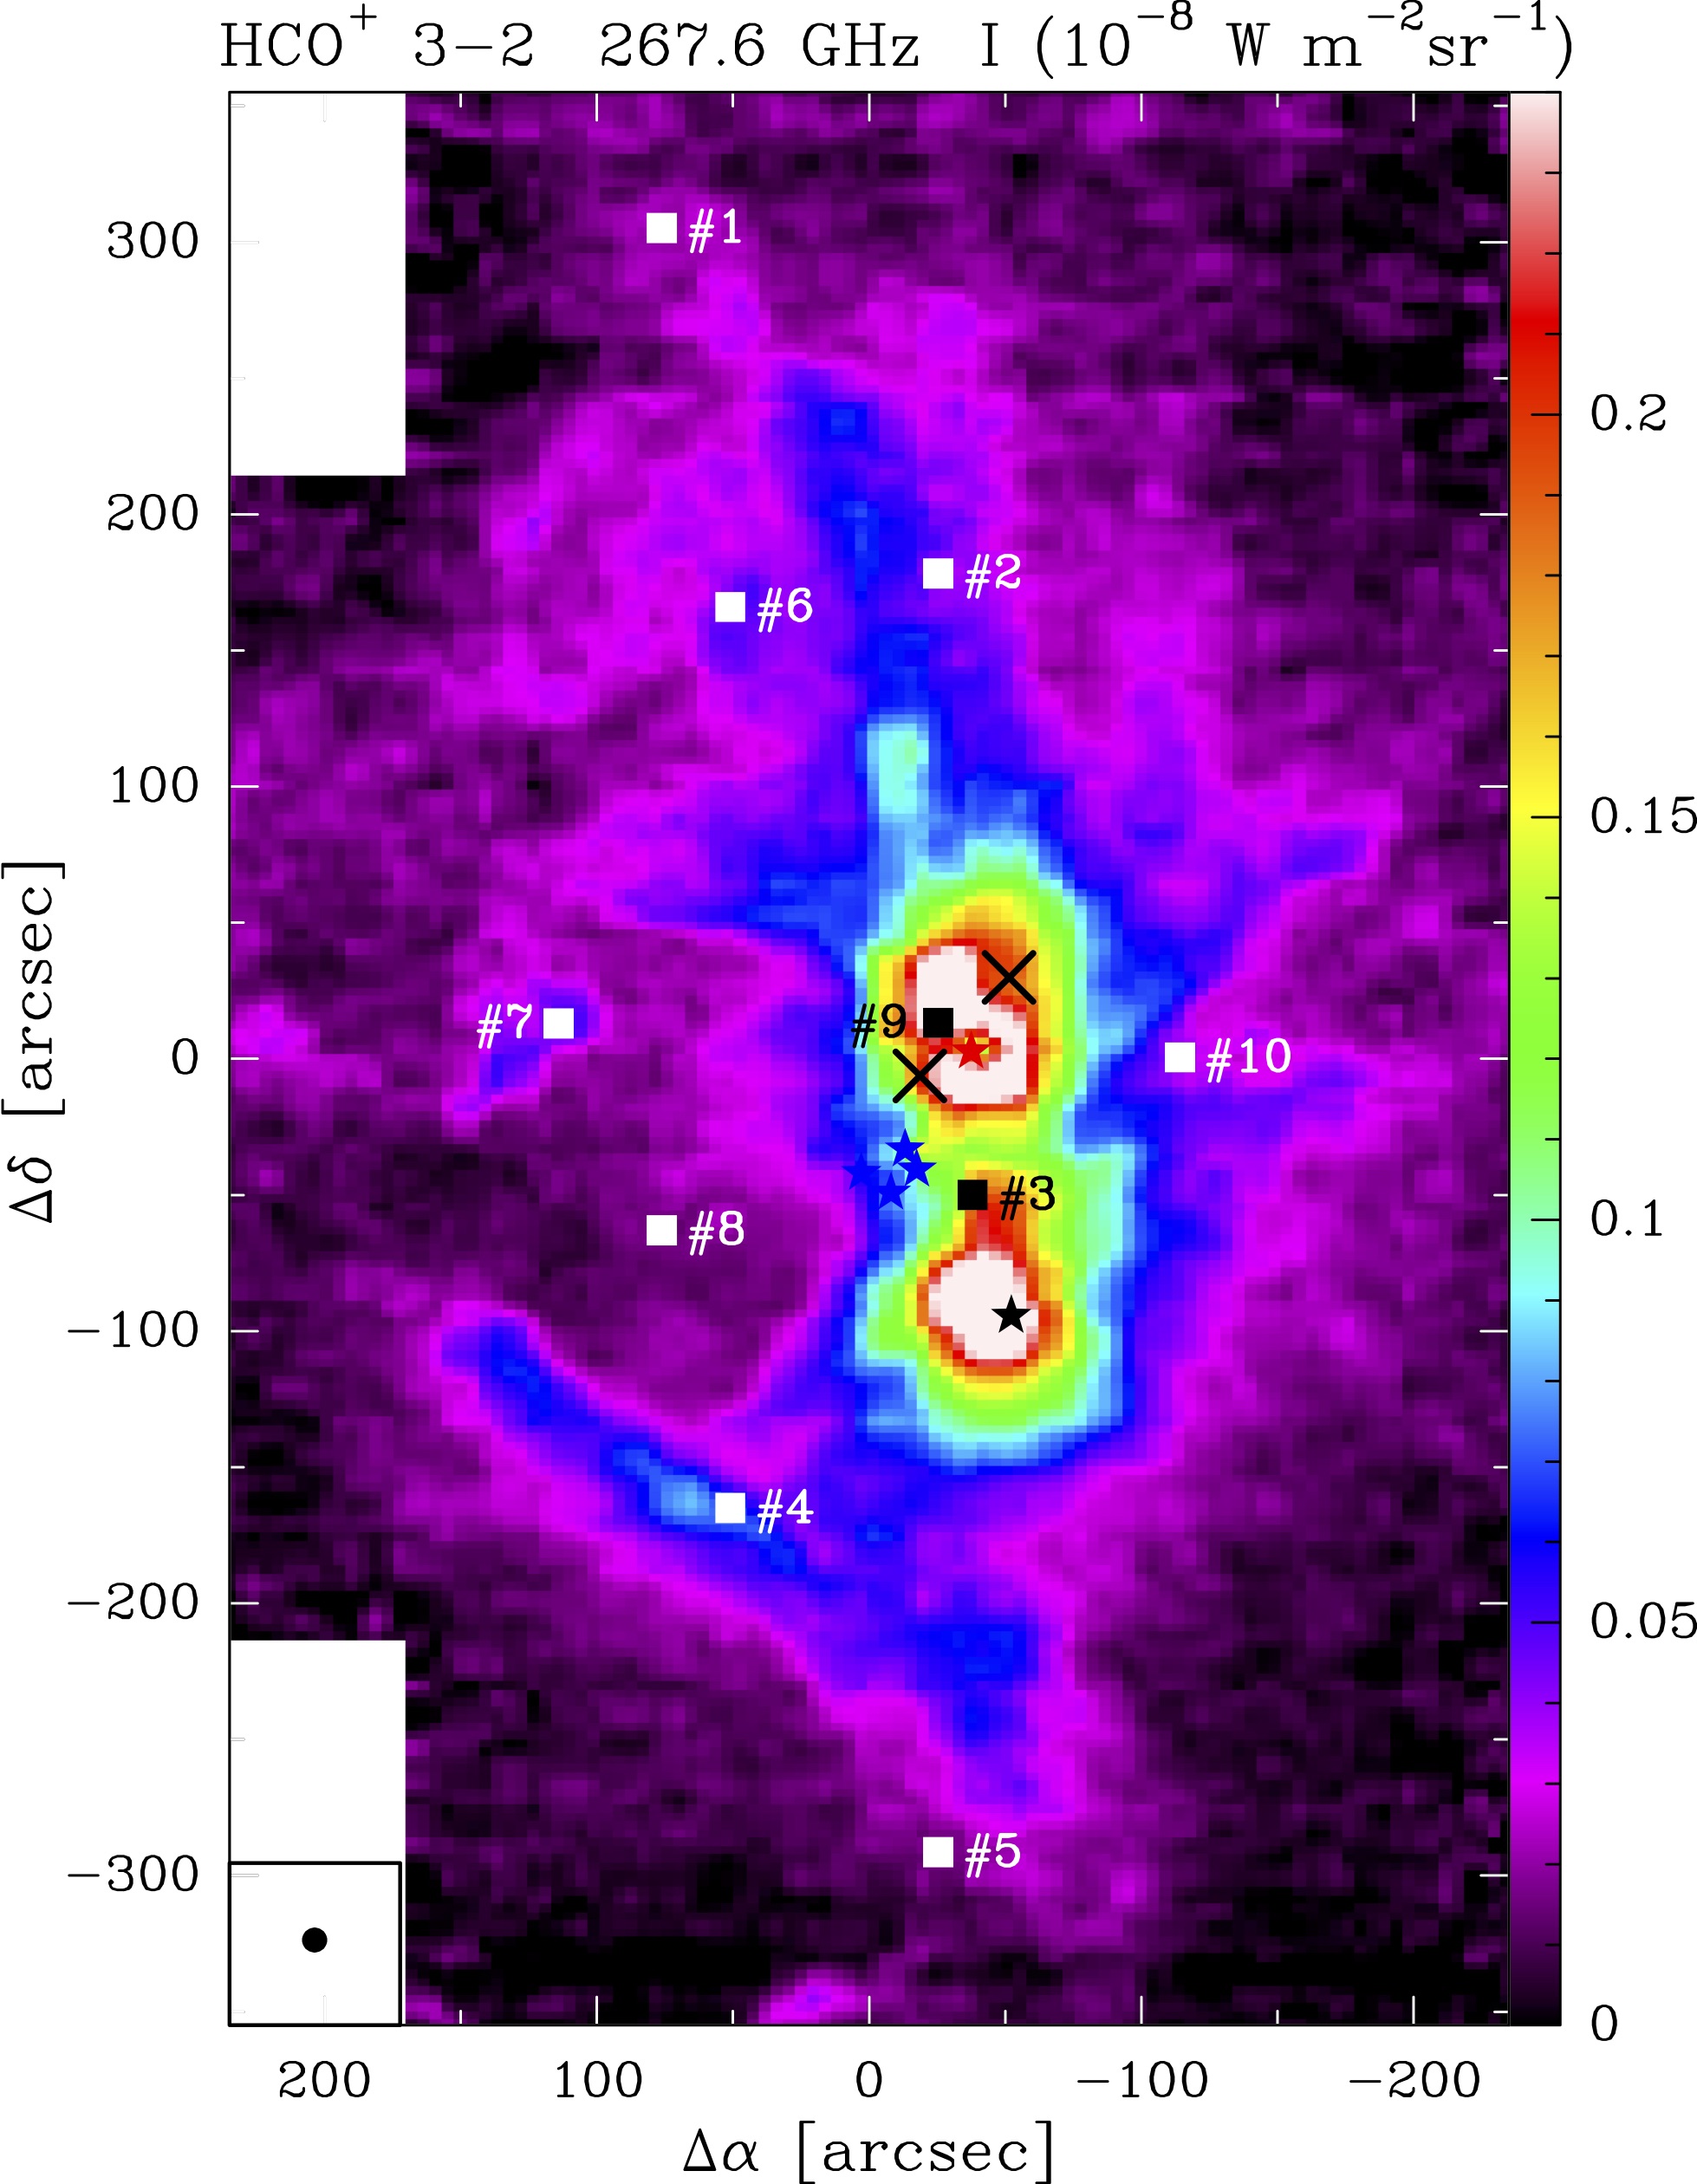
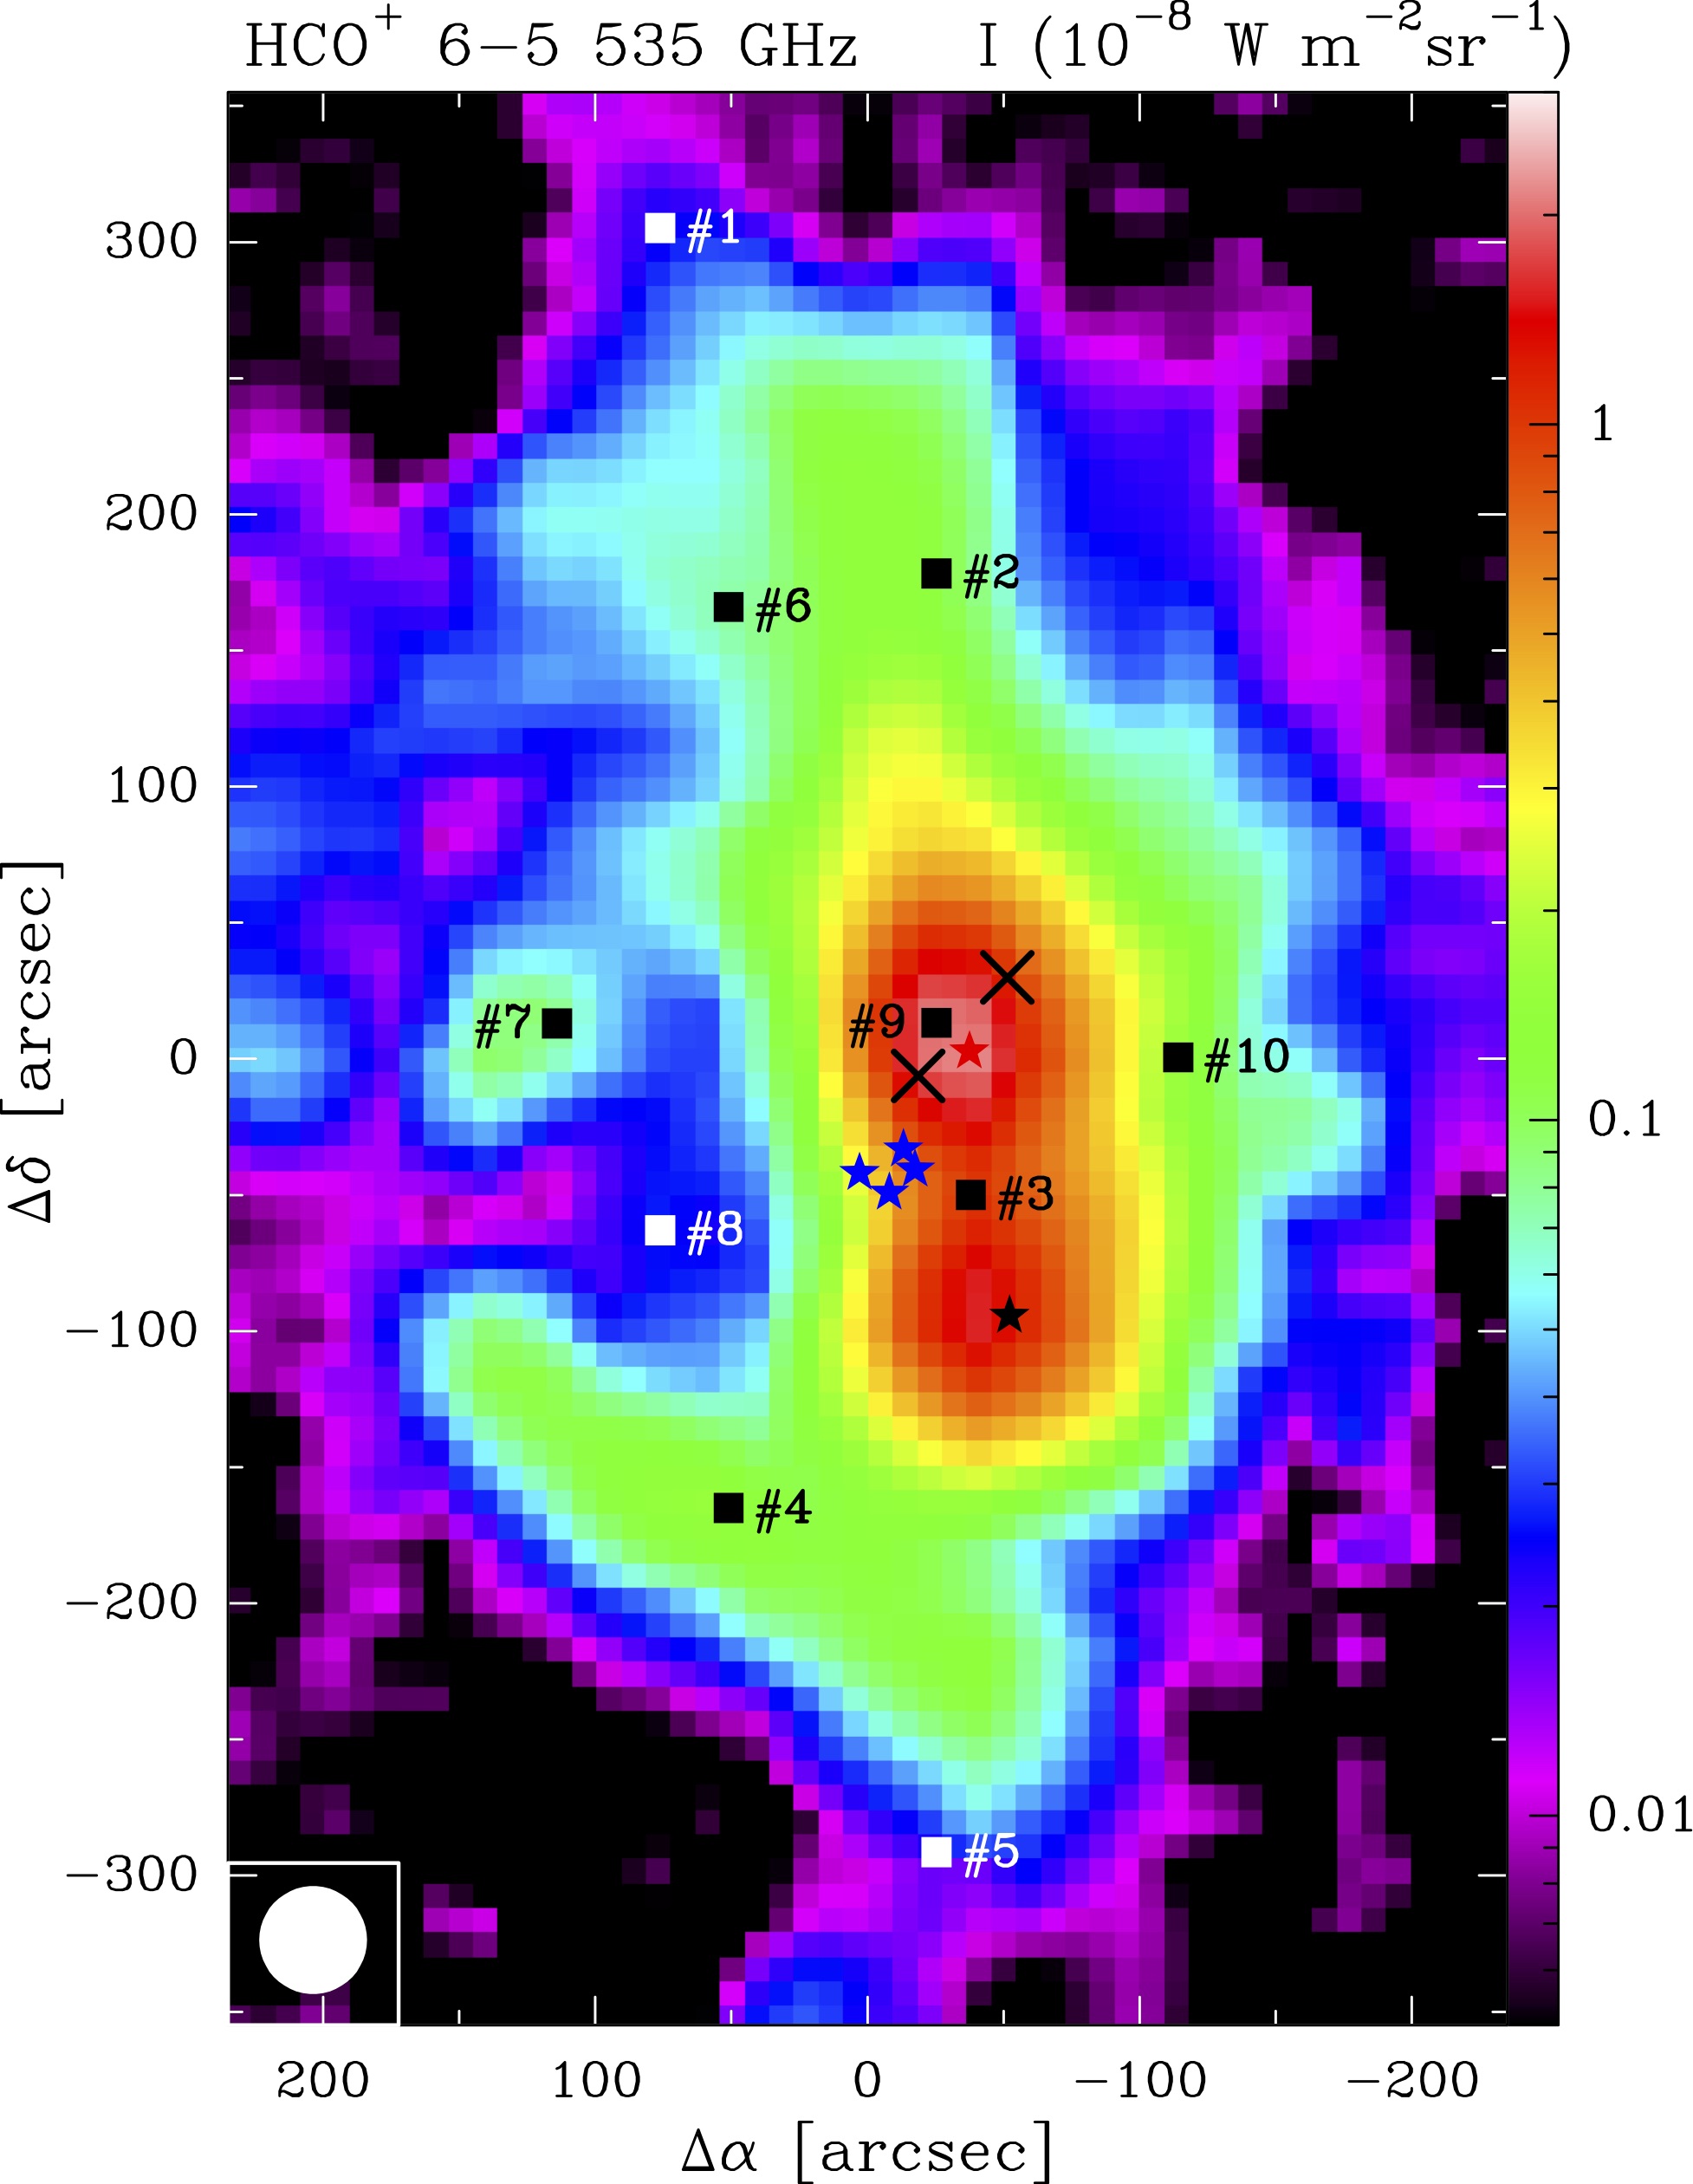
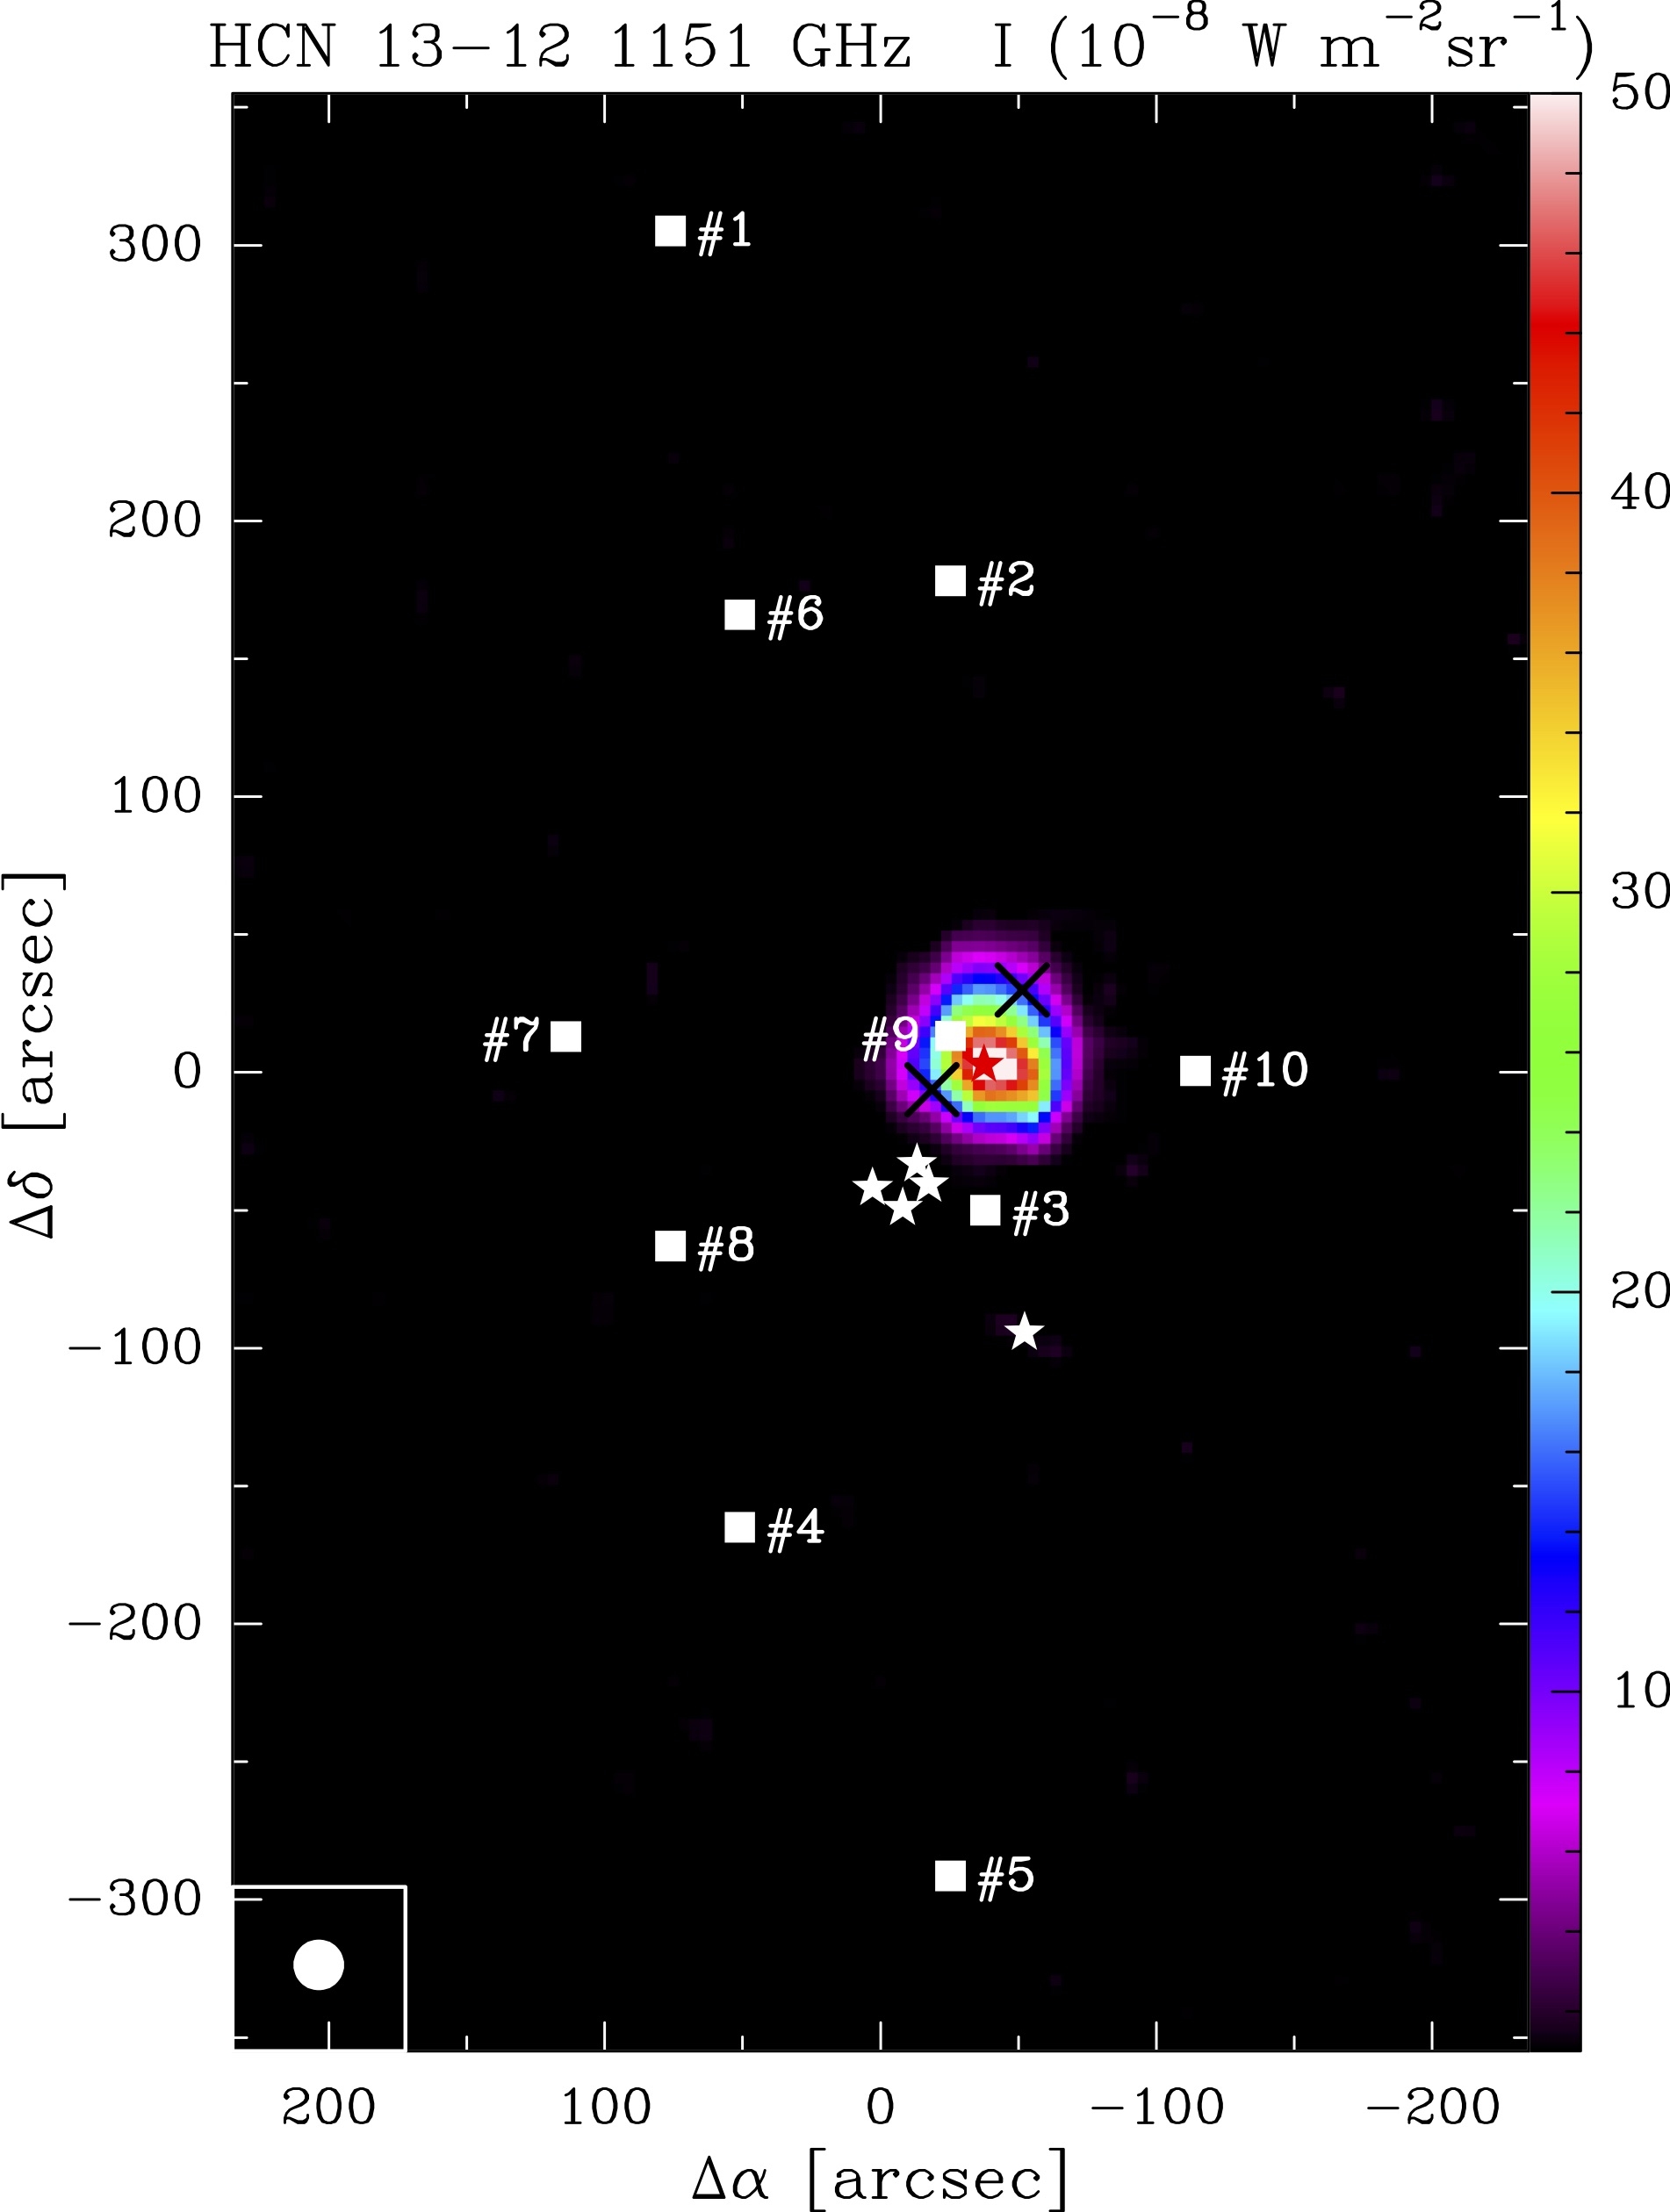
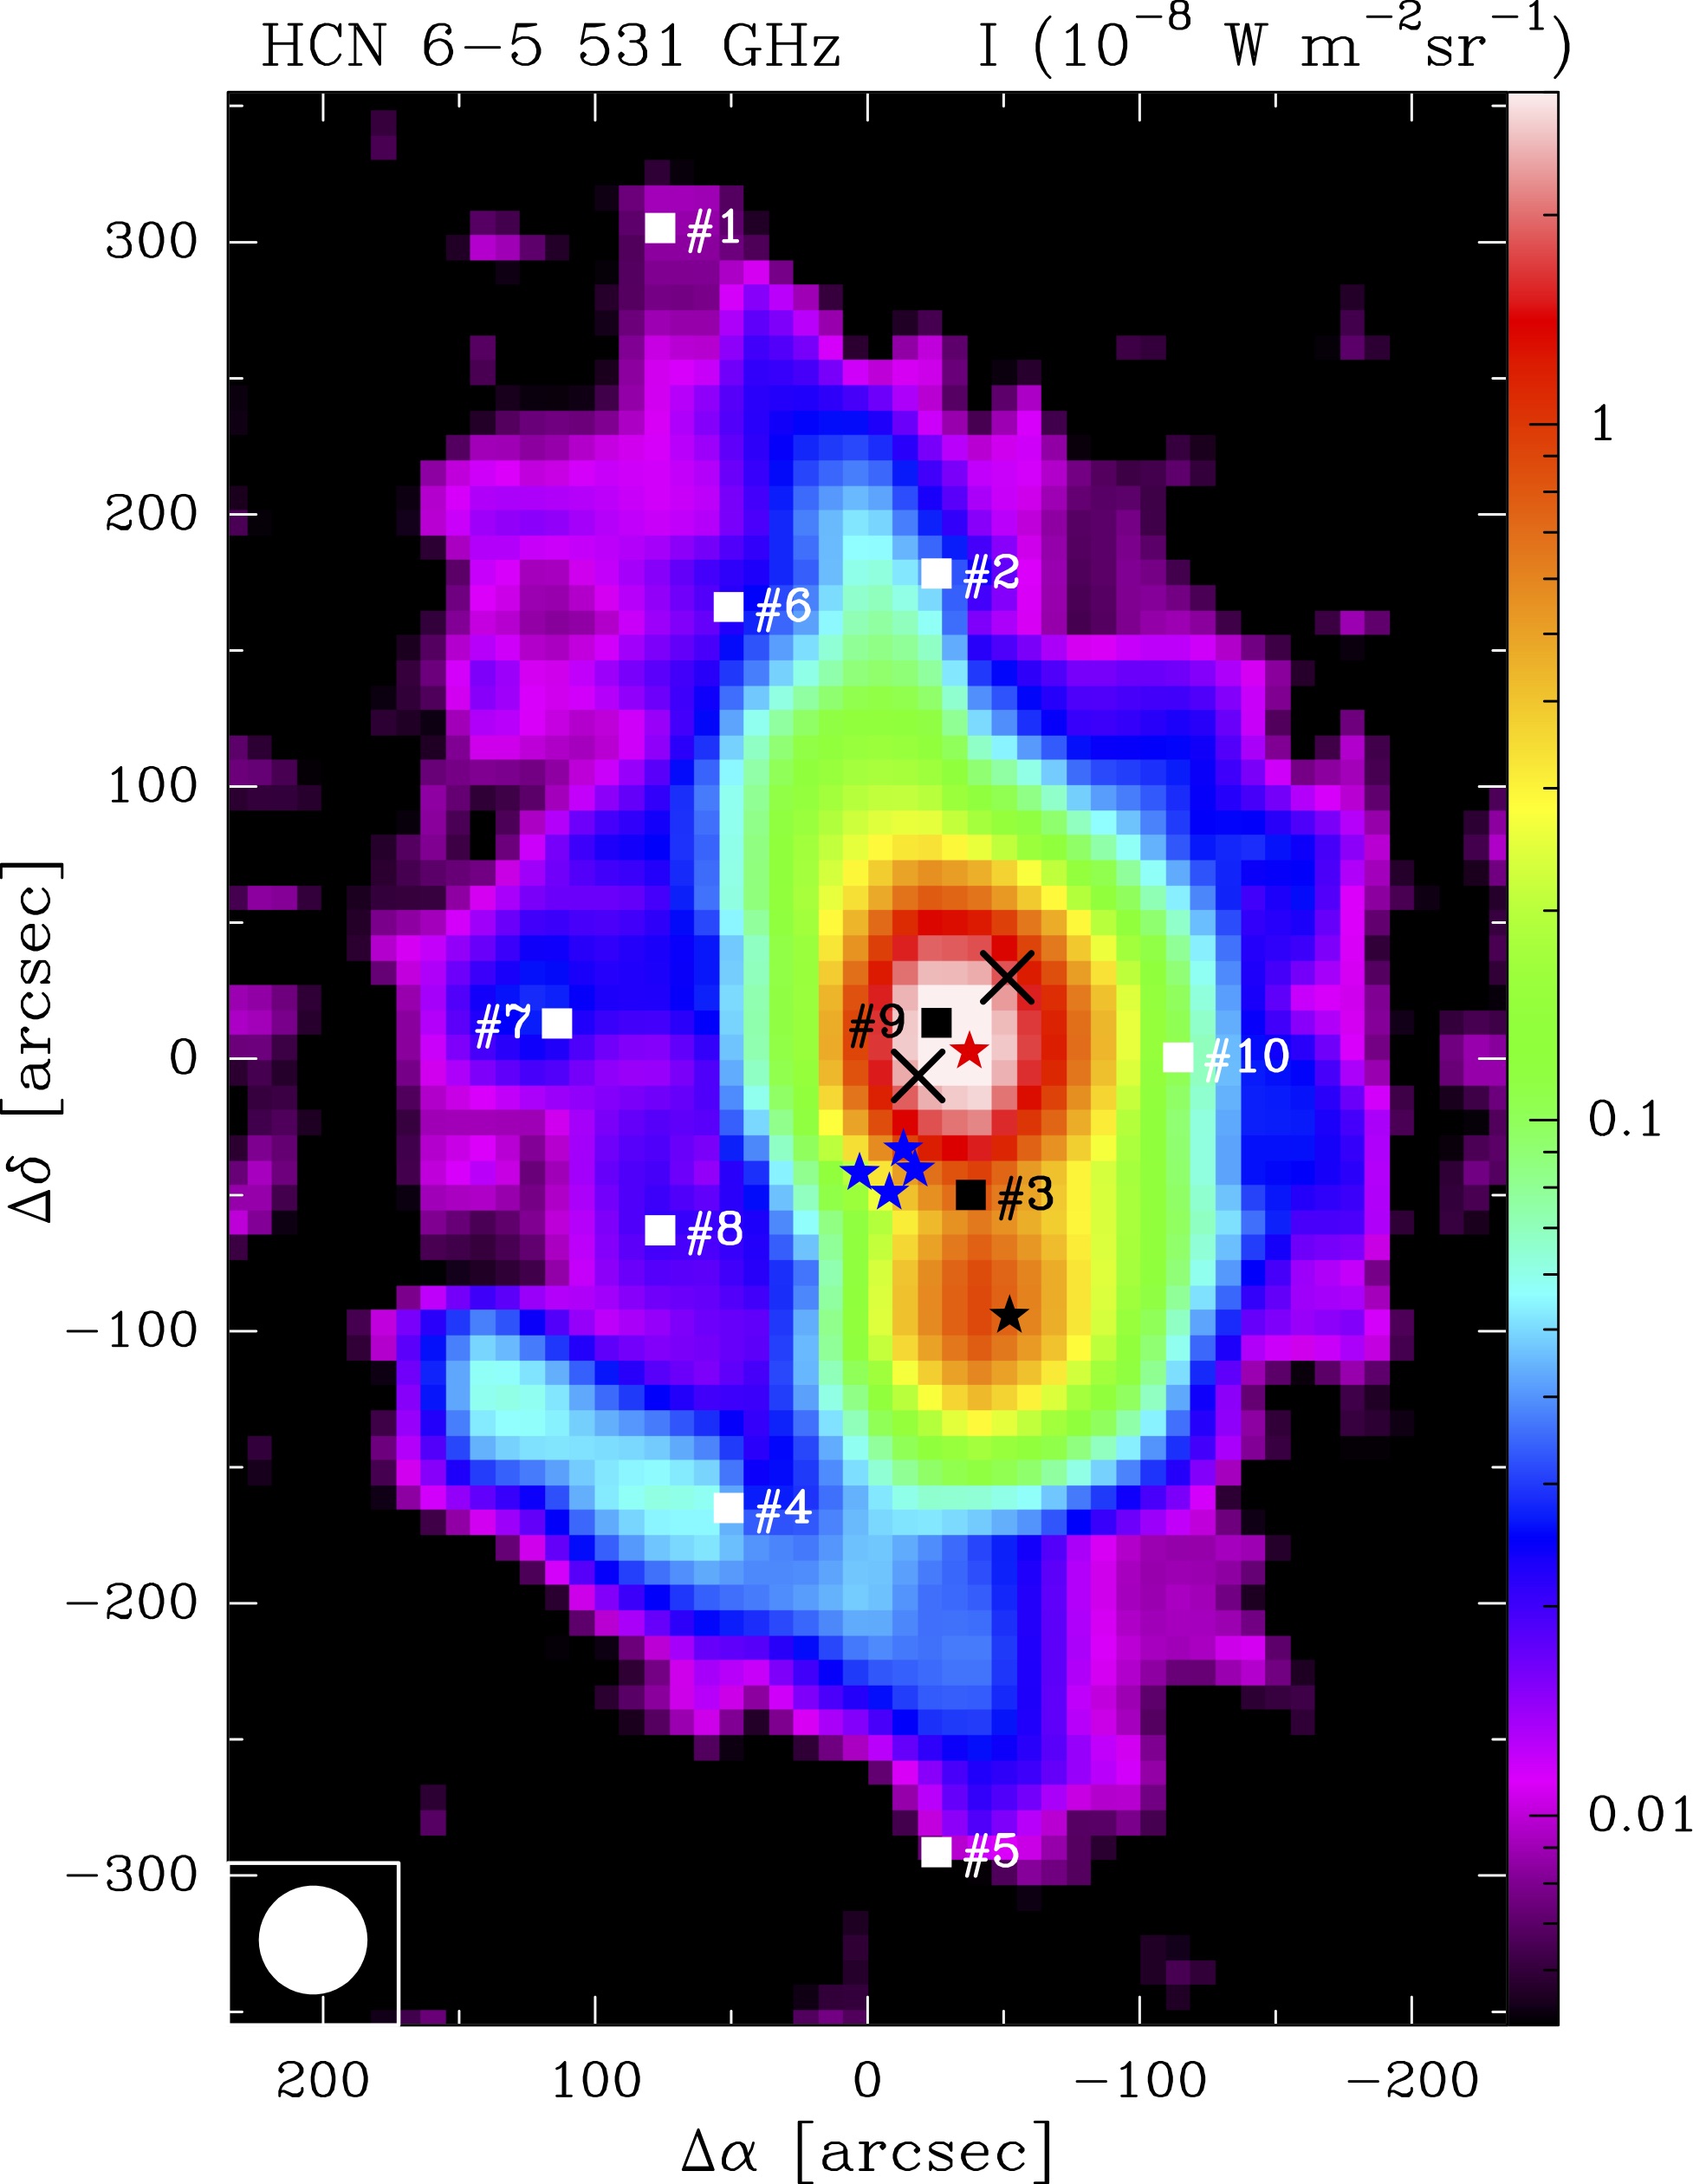
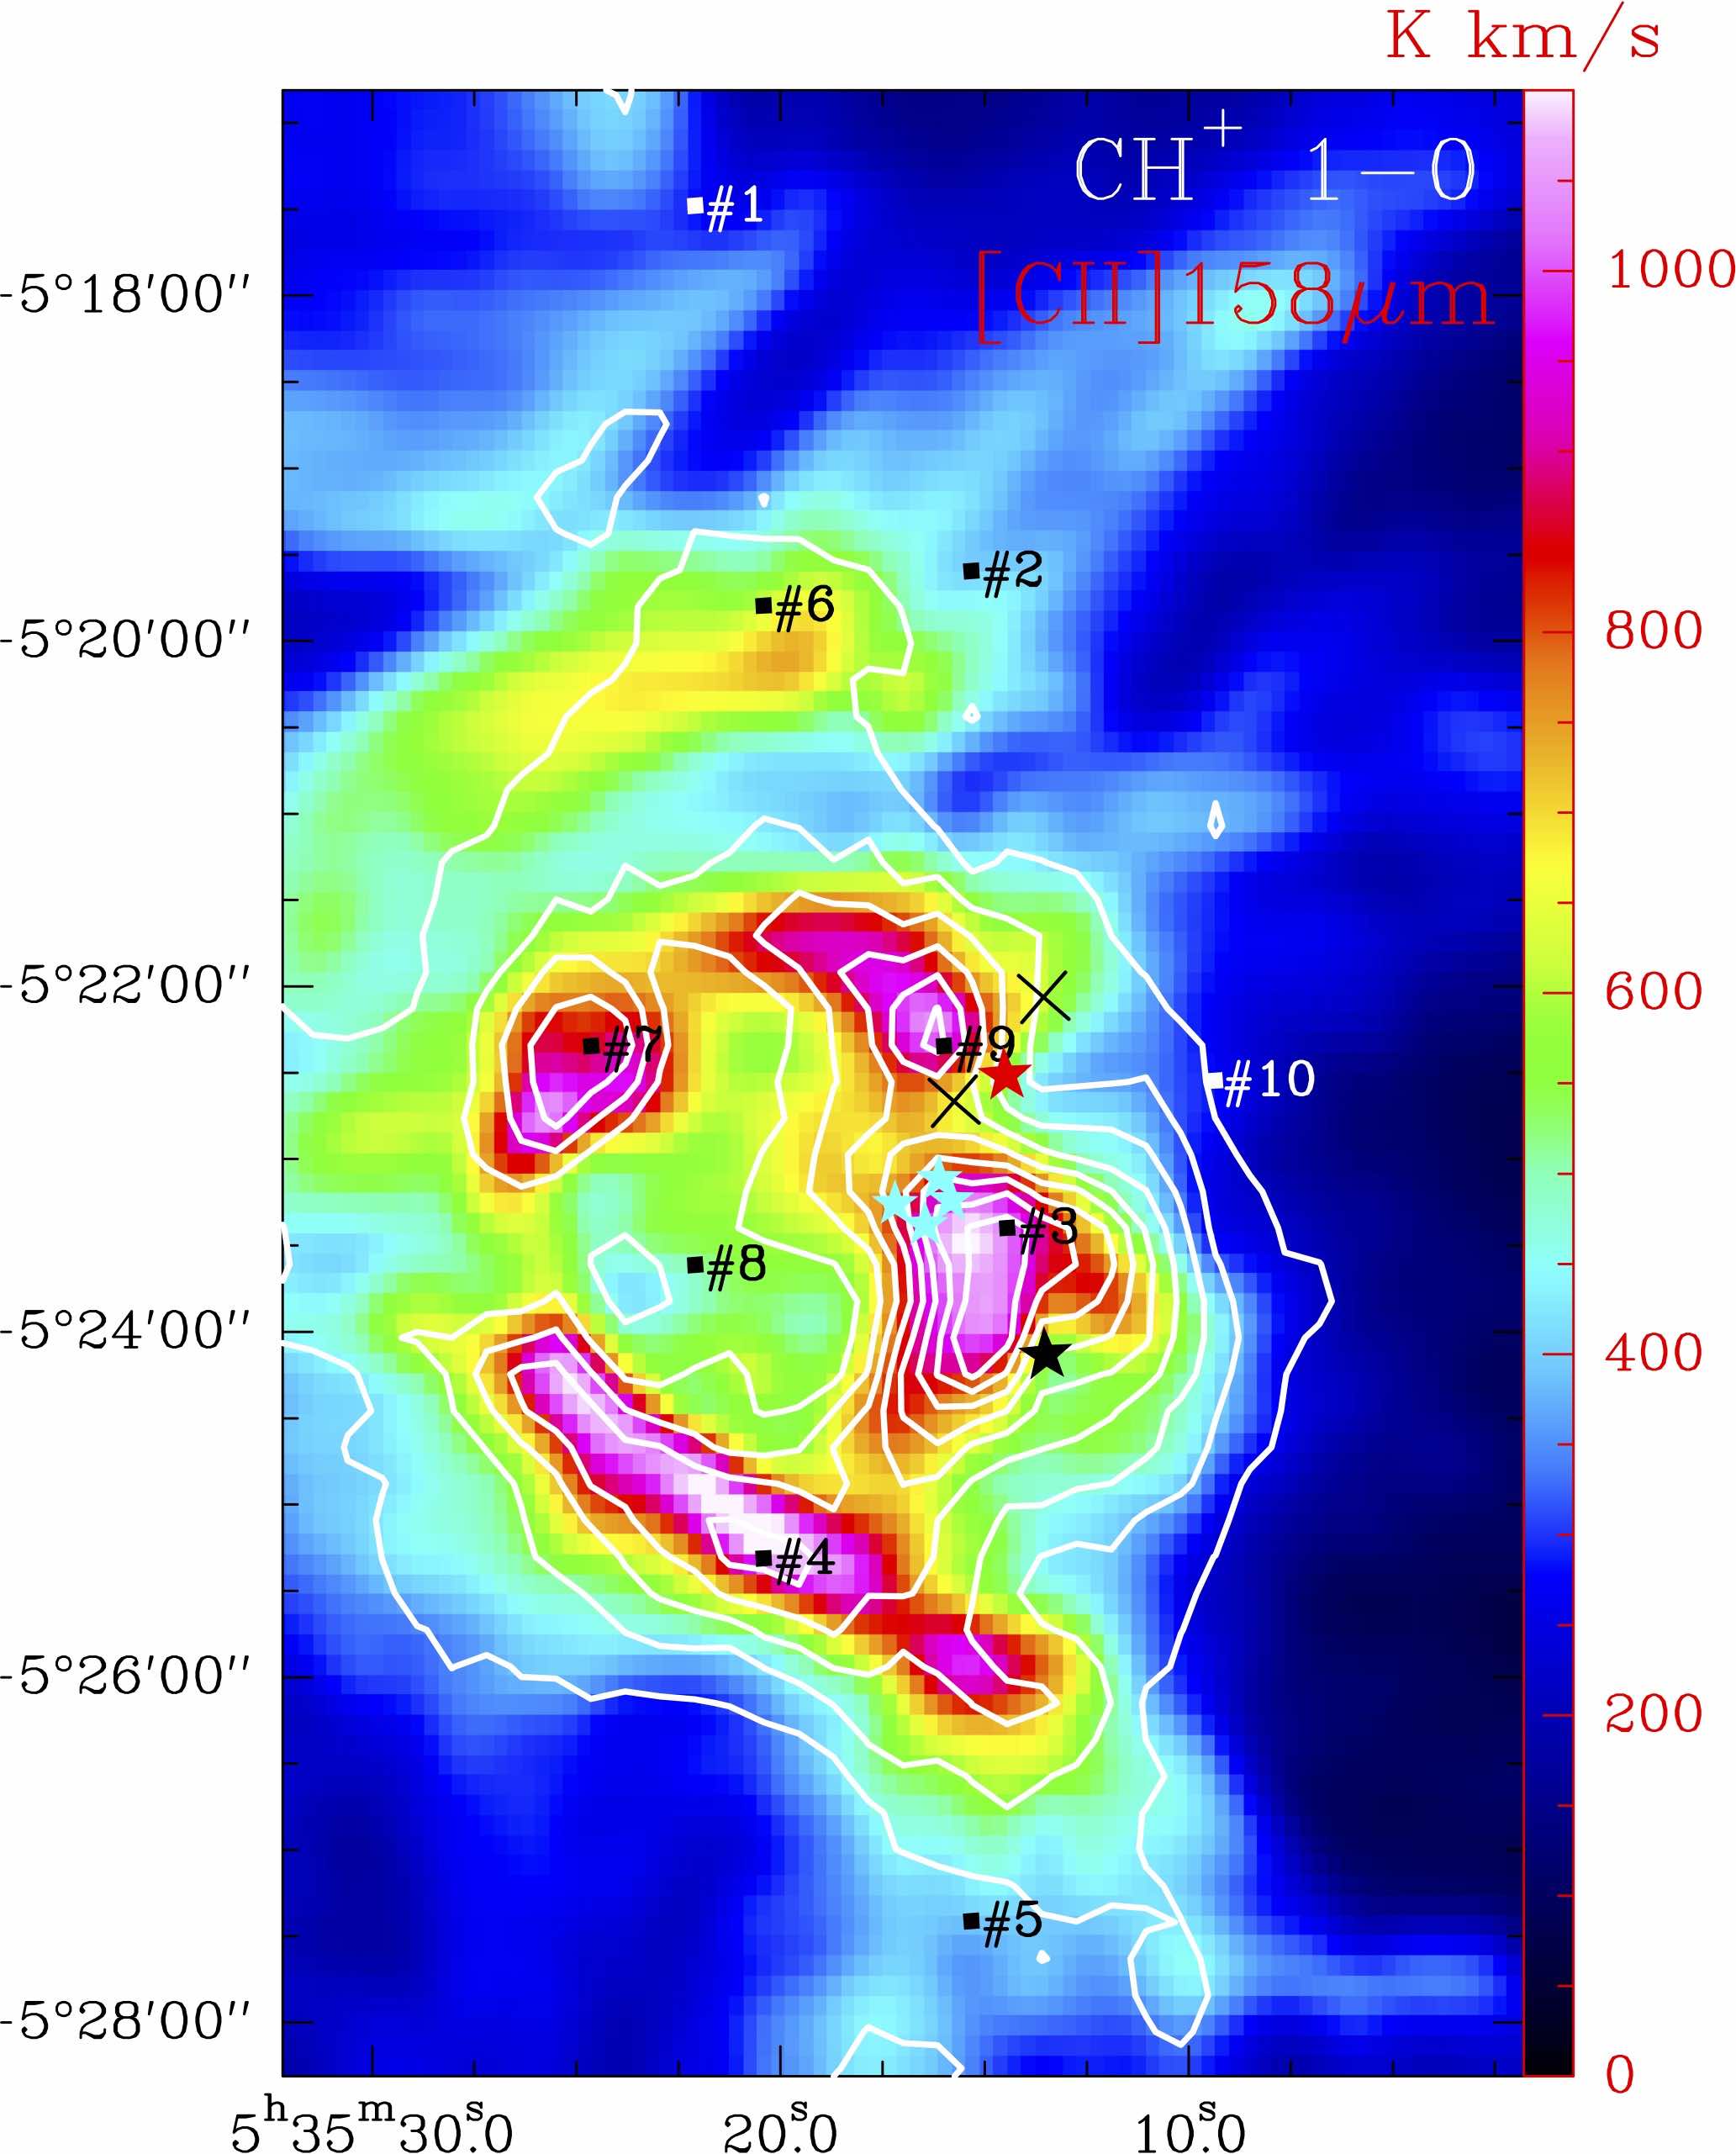
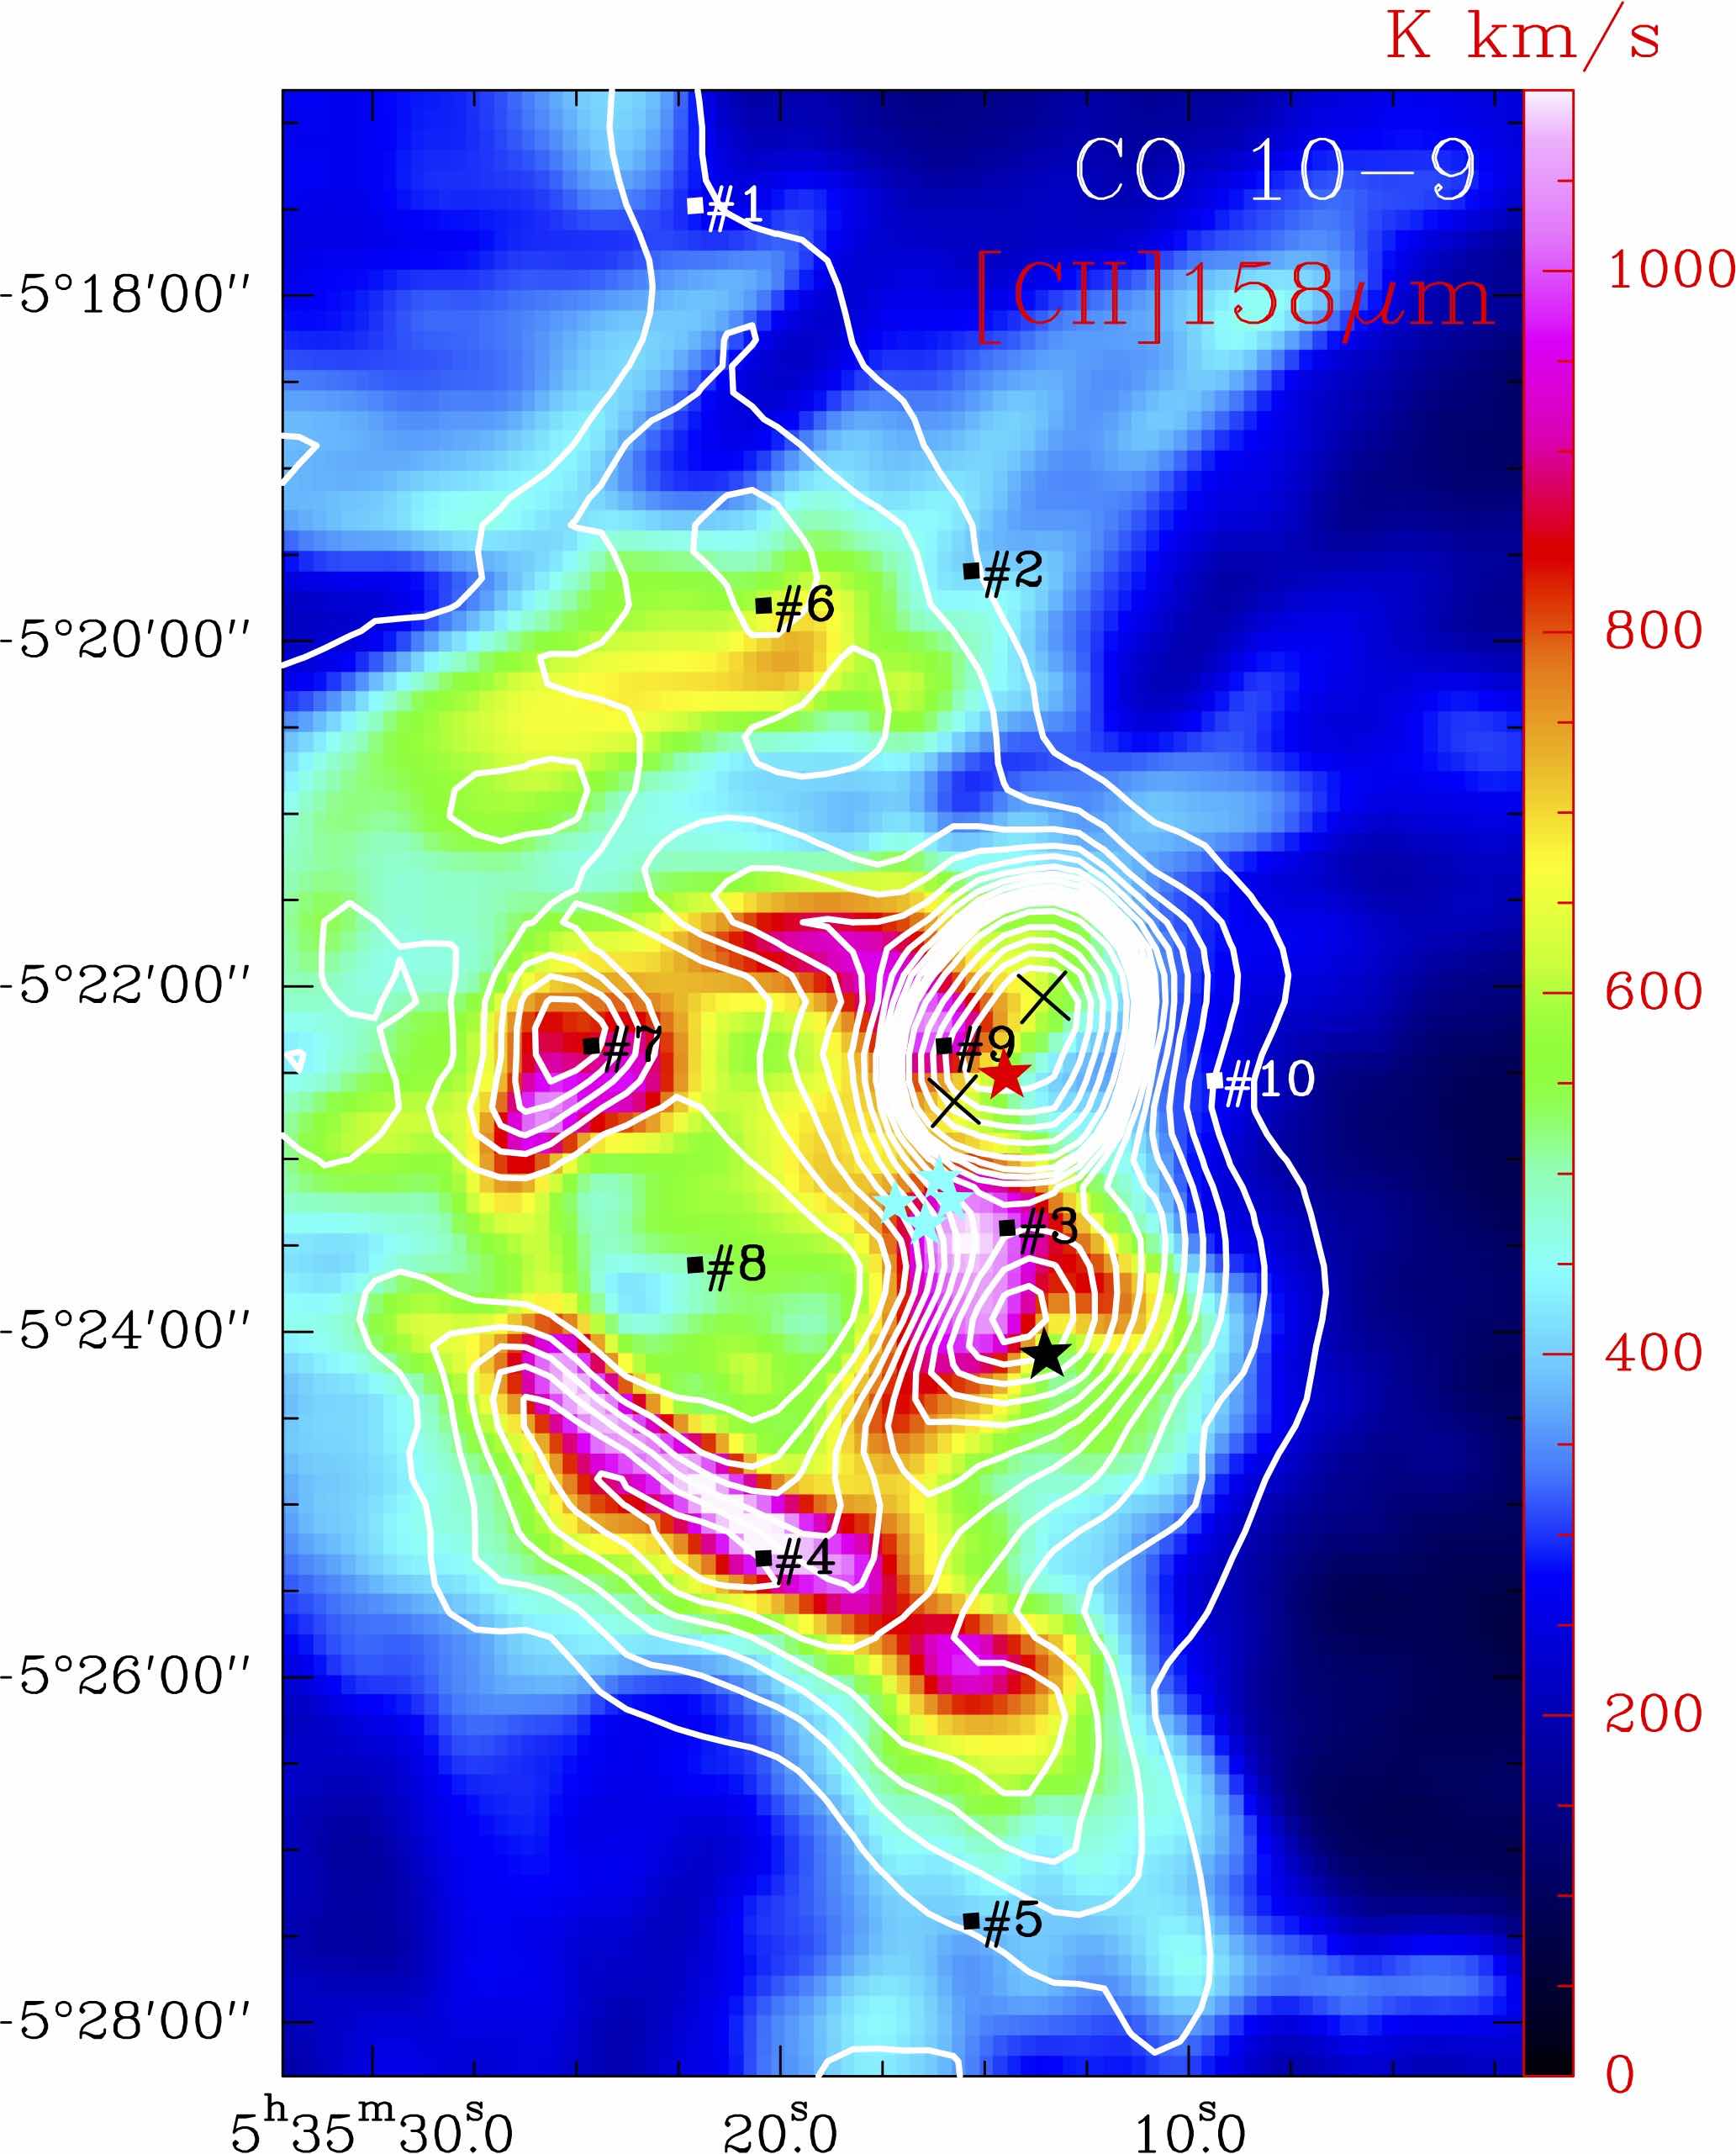
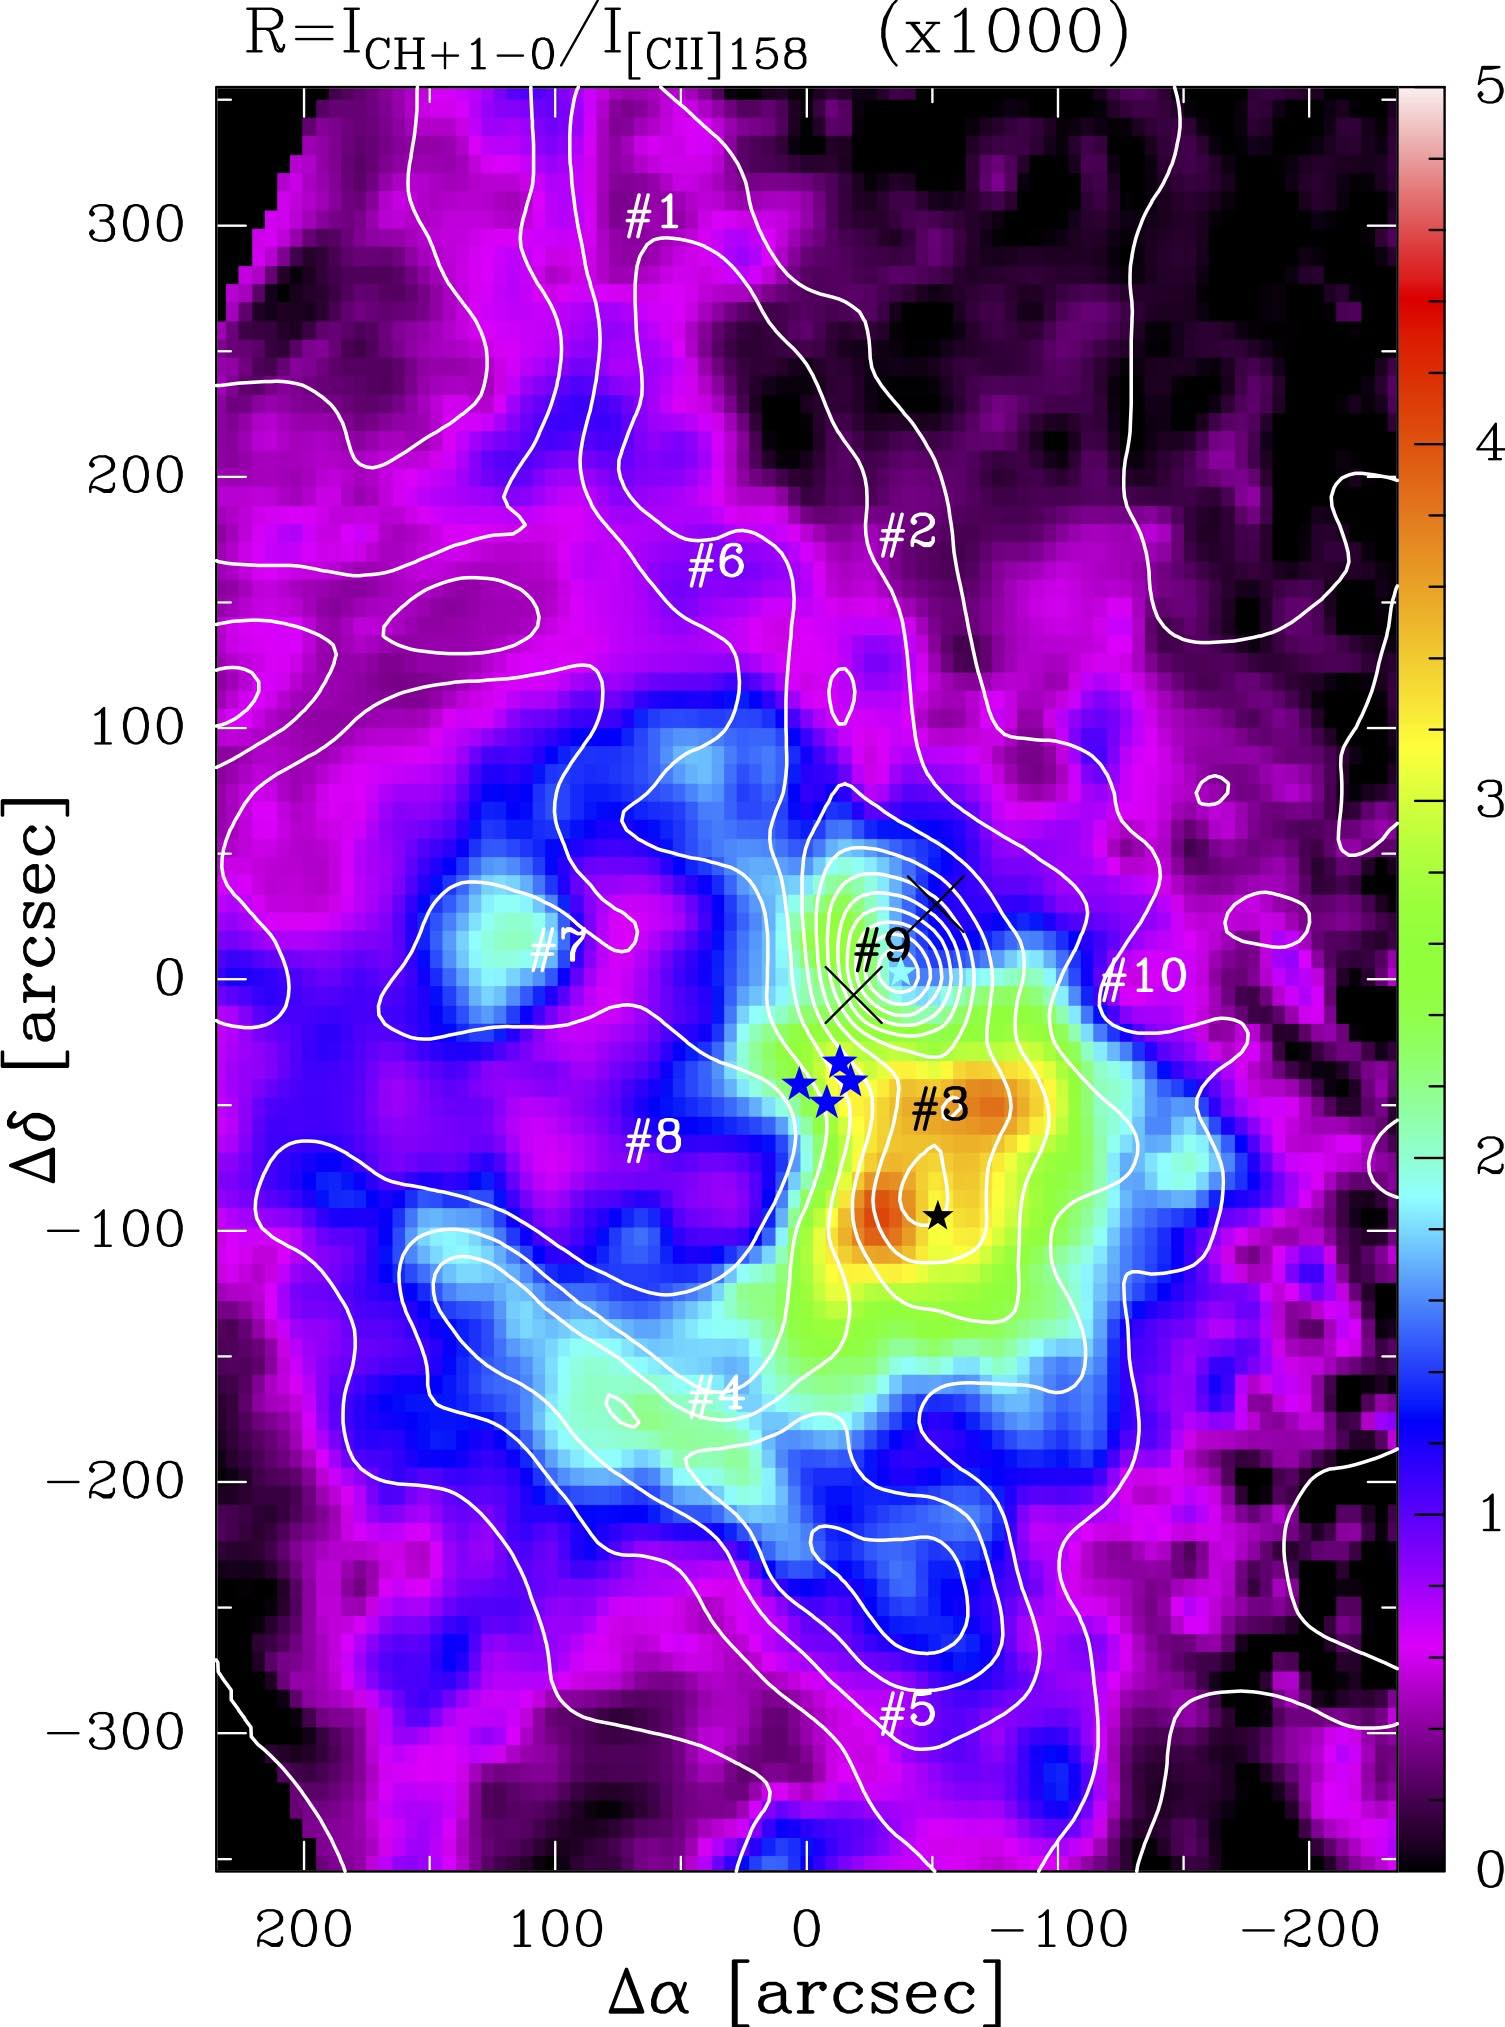
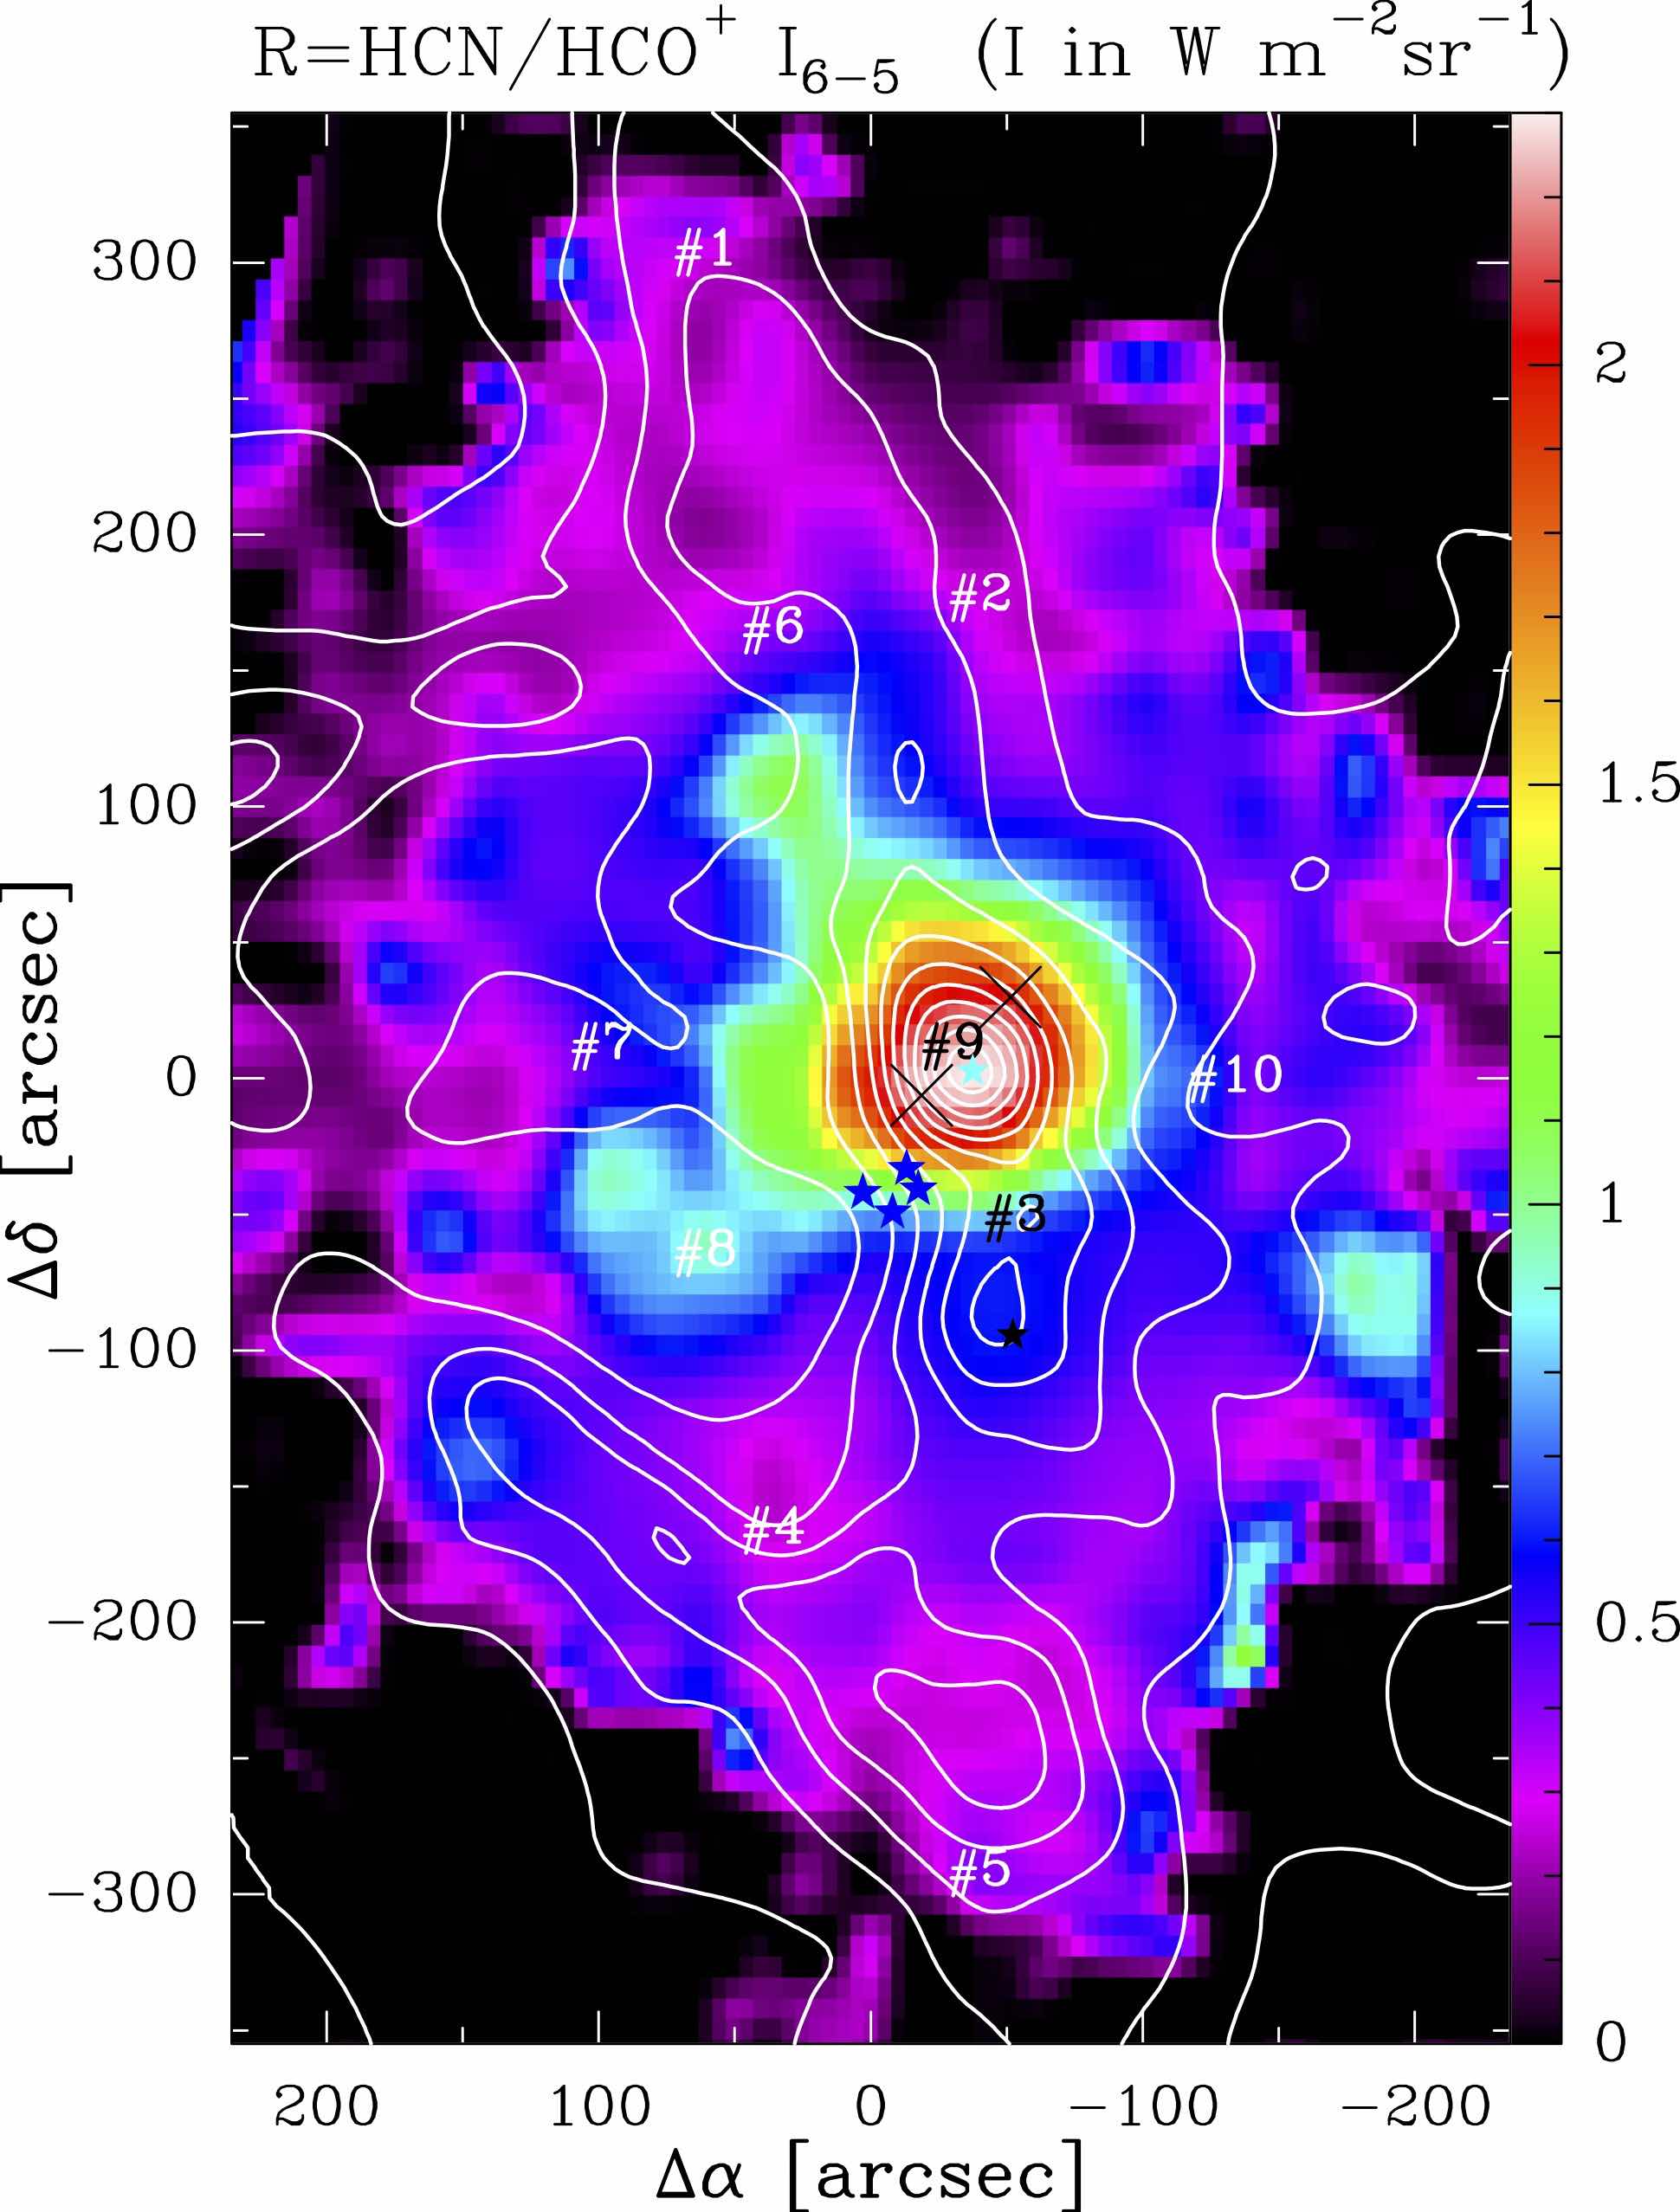
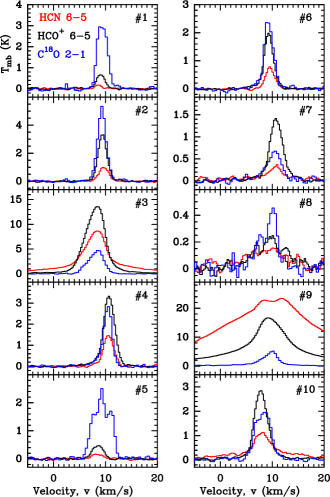
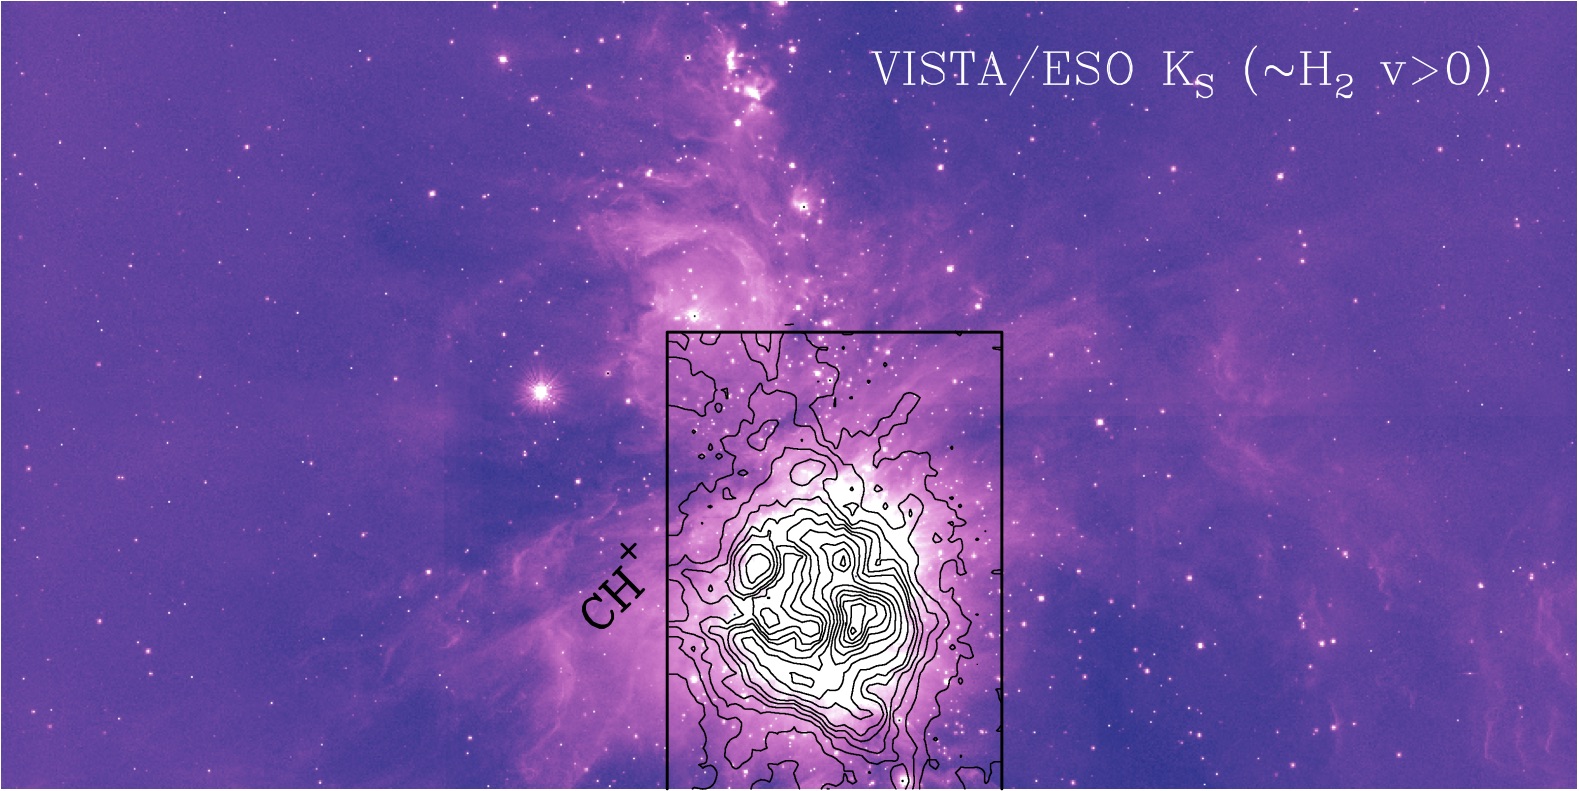
Appendix C Warm gas mass from CO = 10–9
In Sect. 4.2 we estimated the mass contained in the high pressure molecular PDR layers, (H2). In particular, we integrate the column density equations for optically thin line emission
| (2) |
over the OMC-1 map. refers to the CO 10–9 line integrated intensity in K km s-1. We assume that the rotational temperature at each position of the map, , is the same as (2–1). Because the CO 2–1 line emission is optically thick through most of the field, we can determine at each pixel of the map from the line peak temperature, (2–1) (see Fig. 18), using
| (3) |
where /() is the equivalent brightness temperature, , and is the temperature of the cosmic microwave background. If the CO 10–9 emission is slightly optically thick, line opacity 1, we add an optical depth correction = , where
| (4) |
is calculated from observations. Once we created a map of the warm CO column density by the CO = 10–9 emission, we convert it to a total gas column density map through = (CO)(CO) 10-4(CO) using a representative value for the CO abundance in the PDR. The mass of the warm PDR molecular gas in OMC-1 is then , where is the pixel area, is the H atom mass, and is the mean molecular weight. For this mass estimation we used the CO 2–1 and 10–9 maps convolved to 27′′.