ALICE Overwatch: Online monitoring and data quality assurance using HLT data
Abstract
ALICE Overwatch is a project started in late 2015 to provide augmented online monitoring and data quality assurance utilizing time-stamped QA histograms produced by the ALICE High Level Trigger. The system receives the data via ZeroMQ, stores it for later review, enriches it with detector specific functionality, and visualizes it via a web application. These provided capabilities are complementary to the existing Data Quality Monitoring system. In addition to basic visualization, additional processing options are accessible to the user, including requests for data within a particular time range or reprocessing of a particular run with different processing parameters. For example, the first ten minutes of a particular run could be investigated for a transient hot trigger channel.
Due to similarities between the Overwatch architecture and that which will be used for Quality Control (QC) in LHC Run 3 and beyond, Overwatch will also be utilized to develop and test various QC components during LHC Run 2. Some of the areas of QC development include a new trending and alarm framework. We report on the project’s design, development, and status.
1 Introduction
ALICE (A Large Ion Collider Experiment) alice is the dedicated heavy-ion experiment at the Large Hadron Collider (LHC), with the goal of studying the properties of the deconfined state of matter known as the Quark-Gluon Plasma. Given the high particle-multiplicity physics environment, large data rates, and complexity of the detectors, effective data-quality monitoring is an integral part of recording useful physics data. For the ALICE collaboration, this important task has been successfully addressed during LHC Run 1 and 2 by the data-quality monitoring (DQM) system known as AMORE aliceDQM .
Despite the success of AMORE, there are still remaining open questions related to data-quality monitoring within ALICE, particularly with regard to the increased data rates in LHC Run 3 and beyond due to the continuous readout of the ALICE apparatus. In order to address these questions, we can leverage the ALICE High Level Trigger (HLT) HLTWhitePaper ; HLTRun2Performance , which provides substantial additional processing power beyond that available in AMORE. There are two main questions that must be investigated in order to determine the usefulness of an HLT-based online monitoring system. First, what novel data-quality monitoring capabilities could be implemented during Run 2 by taking advantage of this additional processing power? Second, looking further forward, ALICE is planning major upgrades for Run 3, which include a substantial software project known as o2TDR – since the current HLT operates in a similar manner as , what experiences related to operating a quality assurance (QA) system in such an environment could be developed while still in Run 2?
In an effort to address these questions, the ALICE Overwatch project111Online Visualization of Emerging tRends and Web Accessible deTector Conditions using the HLT. overwatchSoftware was started in November 2015 to monitor and visualize the QA information provided by the ALICE HLT. The project handles all steps from receiving the initial data to displaying enhanced visualizations of processed data through a web application. To further enhance the utility of this project for different users, a plugin system allows for ALICE detectors to customize processing, trending, and visualizing the data.
In comparison to the existing DQM system, Overwatch provides complementary functionality, with a focus on providing information most useful to expert level users. By taking advantage of the preprocessed and time-stamped nature of the HLT data, Overwatch is able to provide certain unique capabilities within ALICE. In particular, the data received by Overwatch has already been highly preprocessed by the HLT, such that the data rate is substantially reduced compared to the raw ALICE data rate. Overwatch stores GB/year, with the volume increasing with each year of data taking. Given this manageable volume of data, Overwatch is able to store it persistently. The time-stamping of the data enables unique exploration of the evolution of data quality within a particular run, fill, or longer time period. Moreover, such time-series data could be useful for training machine learning models for automated QA monitoring.
2 ALICE Overwatch
The Overwatch architecture illustrating the workflow from data collected in ALICE to final visualization in the Overwatch web application is shown in Fig. 1. The entire process starts when particles are detected and recorded by the ALICE apparatus. Every recorded event is sent to the HLT. Within the HLT, the data are reconstructed and compressed, and the output is stored, as well as provided for further processing and analysis. Of particular significance to Overwatch are the detector specific QA components which are distributed throughout the HLT and run in parallel to process the reconstructed data and extract information relevant for each detector. Each distributed component is provided a subset of the reconstructed data, and the output is sent to a group of centralized mergers per detector via the ZeroMQ (ZMQ) messaging library zeroMQSoftware . The QA component outputs are merged and are made available for further processing via ZMQ. The model for data flow from the QA components through the output of the data mergers is compatible with that of .
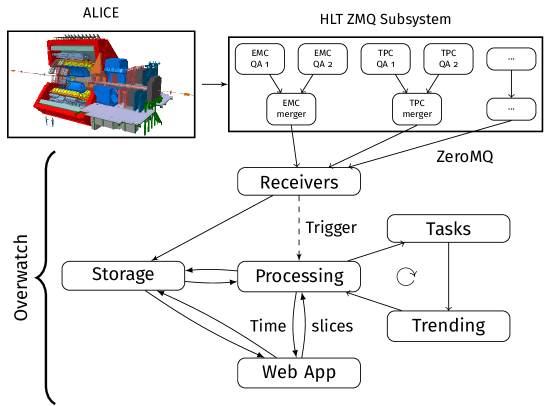
The Overwatch receiver component is written in C++ c++11Software and makes requests for data to the HLT data mergers approximately every minute. However, the round-robin nature of how the data are distributed to the QA components means that the time resolution is on the order of a few minutes, with a strong dependence on the properties and processing rate of a particular component HLTWhitePaper . The messages provided via ZMQ consist of metadata, as well as collections of ROOT-based objects. TH1-derived histograms are the primary type of data received, although other more complicated objects, such as TObjArray, are also utilized. Each request contains cumulative data, such that the difference between the objects in the currently received message and the previous message corresponds to the data that was collected in the time between the requests. Objects are only reset at the beginning of each run, which typically last on the order of several hours. In 2015, the Electromagnetic Calorimeter (EMCal) implemented a QA component, while the Time Projection Chamber (TPC) added a QA component in 2016. The HLT itself also provides some QA information generated during the data reconstruction. As an example of the information provided by a detector, during the 2015 Pb–Pb data taking period, the EMCal QA component provided tower energy spectra, number of triggers vs. position, and median vs. maximum tower energy to characterize the event background, as well as a number of other histograms. All of these were provided as a function of different regions in the detector. It is worth noting that the data volume depends heavily on the data taking period and the detectors themselves, with some payloads as small as kB/request, while others are larger than MB/request.
A number of processing actions are performed upon the newly received data. These actions are managed by the Overwatch processing module, which is written in Python pythonSoftware , utilizes PyROOT ROOT ; ROOTSoftware , and is generally responsible for transforming the data into more easily comprehensible forms. The received data is organized and metadata related to the run and the available subsystems (detectors) are extracted. The histograms and other objects available for each subsystem are also classified and sorted into related groups for visualization purposes. Overwatch then enters into the main processing routine which adds additional context, extracts derived information, and stores enhanced visualizations (such as highlighting trigger regions within a detector to aid in identifying channels which fire too frequently). This step also has the capability to extract derived values as the data are processed for trending purposes. Afterwards, the trended information is processed in a similar manner to the originally received data. The output of the processing and trending includes metadata related to the runs and included subsystems, as well as JSON and image representations of the processed data.
This information is then made available through the web application, where the data are organized and displayed in the main view according to run and subsystem. The web application back end is written in Python and is built with the Flask microframework flaskSoftware . The front end is built on top of Google’s Polymer library polymerSoftware and JSRoot jsRoot ; jsRootSoftware . Within a selected run and subsystem, the data are displayed according to their previously classified groups, along with any information extracted from the displayed object. Predefined data exploration capabilities are provided for the displayed data, as will be illustrated in Sec. 2.1. To further enable data exploration beyond the capabilities provided by Overwatch, the underlying unprocessed ROOT files are also made accessible to the user.
A typical example of the Overwatch web application interface is shown in Fig. 2. The main object is a histogram which represents the number of triggers vs. position in the EMCal integrated over the length of an entire run. The white gaps which are surrounded by data are caused by disabled trigger channels. Overwatch enhances this visualization by superimposing a black grid which corresponds to trigger regions within the calorimeter. Such additional content improves the user experience by allowing identification of whether a particular trigger region is firing too frequently (ie. “hot”) at a glance. Since this visualization of the data utilizes JSRoot, further investigation of each trigger is possible by zooming in. Additional EMCal histograms are available via the list on the left.

While there are some standard capabilities that will be used by all detectors and therefore can be implemented by the main Overwatch packages, each detector has a unique set of requirements. Consequently, Overwatch implements a plugin system to allow each detector to customize the processing, trending, and visualization of their data to meet their needs. This is implemented through the dynamic loading of detector specific Python modules. Each function call is then redirected to the module if the relevant step is implemented. This approach allows each detector to add any arbitrary functionality that is required. An example result of this system can be seen in Fig. 2, where the black grid was superimposed on the displayed data via a detector plugin in the processing module.
2.1 Time slices and reprocessing
Beyond the basic functionality described above, the most important Overwatch features revolve around taking advantage of the time-stamped persistently stored data. To utilize the time-stamps, Overwatch allows the user to request that data within a user specified start and end time be reprocessed, thereby only using information within that time window. This is a major data exploration feature in Overwatch, enabling characterization of the time dependence of the data quality. This capability is known as time slices.
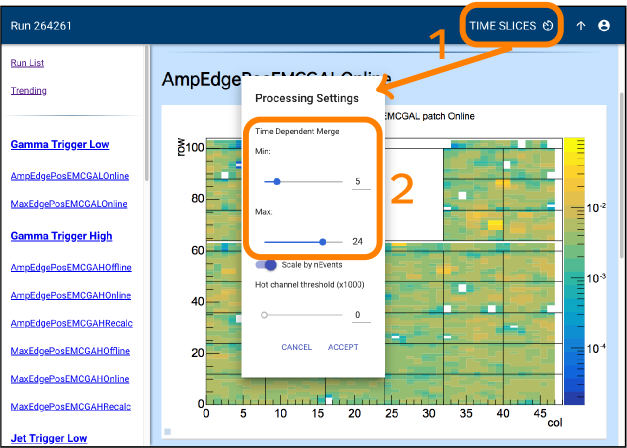
Overwatch exposes this functionality directly to the user through the web application interface shown in Fig. 3. To create a new time slice, the user selects the highlighted “time slices” button, which opens a new panel. This panel allows the user to specify the minimum and maximum times of their time slice, as shown in the second highlighted region. After processing the data within the specified time window, the results are then displayed in the same page. These results are stored and cached based on the input parameters to allow for immediate results and an improved user experience if the time slice has already been processed.
To illustrate the value of this approach, consider the case of a histogram which measures the occurrence of large amplitude hits in a detector vs. their position. Even if the histogram indicates that a channel had some large amplitude entries, the user doesn’t necessarily know the cause. However, if they have some external information, such as the knowledge that the electronics initialization at the start of run can cause large amplitude spikes that have no impact on the data quality of the run, time slices allow the user to directly check whether these large amplitude entries are problematic. The user would simply deselect the first few minutes of the run, and if the large amplitude counts disappear, then the data quality for that run is still good.
The time slice reprocessing is performed by the exact same code as the standard Overwatch processing, including all detector plugins – it just utilizes different input data corresponding to the selected time window. This procedure can then be generalized further to allow the user to specify any exposed set of processing parameters. Such an approach adds a new dimension to the data exploration capabilities provided by Overwatch, enabling the extraction of custom information, as well as the selection of different areas of the parameter space which might be otherwise inaccessible behind other data.
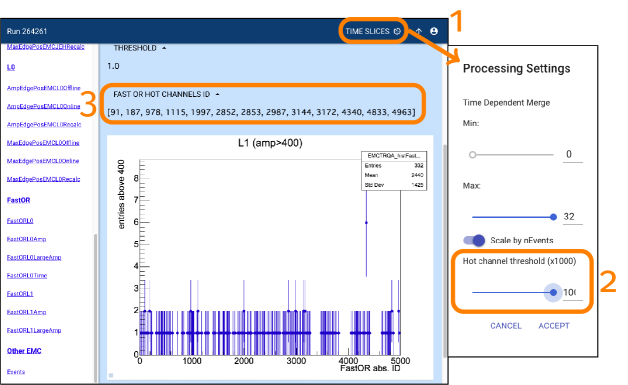
As an example, consider again a histogram which measures the occurrence of large amplitude hits in a detector vs. their position. If there has been a particularly noisy run, the user can extract all channels (bins) whose entries are above a user specified threshold in order to take further actions. Figure 4 illustrates just such a histogram from the EMCal and demonstrates how these reprocessing capabilities can be used. The user first selects the reprocessing and time slices button, which is labeled with “time slices” and is highlighted in the first selection. This opens a panel to direct the reprocessing. The user can select their desired threshold for maximum number of counts, as shown in the second highlighted selection. Once submitted, the data will be reprocessed, and the identifiers of the hot channels are displayed in a list inside of the third highlight, alongside the original histogram. With this information, a detector expert can take the appropriate actions to address the identified channels. As with all other parts of Overwatch, these capabilities are extensible, such that new reprocessing options can be added by any detector subsystems. Options which are not relevant for the currently displayed histogram will be disabled. Note that it is also acceptable to specify a time slice window along with other reprocessing options.
3 Outlook towards Run 3
While most of the Overwatch infrastructure will shut down at the end of 2018 with the completion of LHC Run 2, it can still provide substantial contributions before the run is completed, as well as afterwards. As noted in Sec. 2, the data model for the HLT QA data is compatible with that of . Furthermore, the Overwatch architecture to handle and process data closely matches the design of the ALICE Quality Control (QC) project for data-quality monitoring in . Although Overwatch processes much less data than will be handled during Run 3, the strong similarities demonstrate that Overwatch can inform future developments. Consequently, in addition to maintaining the project’s existing capabilities, Overwatch is being utilized to develop experiences and prototypes necessary for in Run 3 while still in Run 2. The focus of these efforts is on the trending and alarms subsystems in Overwatch. The existing systems have fairly basic capabilities, so new developments are ongoing which attempt to satisfy the requirements of both Run 2 and Run 3. The practical knowledge, and perhaps the code itself, will help inform the development of the corresponding systems within the QC project.
Post Run 2, Overwatch can continue to provide valuable experience by taking advantage of the persistently stored data. This data can be replayed as if it was just received from the HLT. For any QC related developments, prototypes can be quickly implemented through the Overwatch plugin system, allowing testing of new ideas with real data. The time-stamped nature of the data can also be useful as time-series data for training machine learning models. Such capabilities ensure that Overwatch will continue to make contributions beyond 2018.
4 Conclusions
ALICE Overwatch is a project developed in Python and C++ to process and visualize quality assurance data that is produced by taking advantage of the additional processing power of the ALICE High Level Trigger. Overwatch uses this persistently stored, time-stamped data, to provide unique data-quality monitoring capabilities within ALICE. A plugin system is provided for detectors to customize the processing, trending, and visualization of the stored TB-sized Run 2 dataset. The output of this processing is displayed in a web application which facilitates data exploration through reprocessing based on user specified parameters, as well as within time slices. Due to the similarity between the architecture of Overwatch and the Quality Control project for ALICE , the capabilities and experiences described here can be used to inform the development of the QC system, with a particular focus on the trending and alarms subsystems.
Acknowledgments
We thank Markus Fasel, Mikolaj Krzewicki, Mateusz Ploskon, and David Rohr for useful discussions, advice, and help in starting the project that became Overwatch. We also thank the ALICE QA Tools and WP7 working groups for useful discussions and advice. This work was supported in part by the U.S. Department of Energy, Office of Science, Office of Nuclear Physics under Grant number DE-SC004168.
References
- (1) ALICE Collaboration, Journal of Instrumentation 3, S08002 (2008)
- (2) B. von Haller, A. Telesca, S. Chapeland, F. Carena, W. Carena, V.C. Barroso, F. Costa, E. Denes, R. Divià, U. Fuchs et al., Journal of Physics: Conference Series 331, 022030 (2011)
- (3) ALICE Collaboration, In preparation (2018)
- (4) M. Krzewicki, V. Lindenstruth, for the ALICE Collaboration, Journal of Physics: Conference Series 898, 032056 (2017)
- (5) P. Buncic, M. Krzewicki, P. Vande Vyvre, Tech. Rep. CERN-LHCC-2015-006. ALICE-TDR-019 (2015), https://cds.cern.ch/record/2011297
- (6) R. Ehlers, J. Mulligan, ALICE Overwatch [software] v1.0 (2018), https://doi.org/10.5281/zenodo.1309376
- (7) ZeroMQ Project, Zeromq [software, v 4.2.5 (2018), http://zeromq.org/intro:get-the-software
- (8) ISO/IEC 14882:2011 Information technology — Programming languages — C++ (International Organization for Standardization, 2011)
- (9) Python project, Python [software], v. 3.6.6 (2018), https://www.python.org/downloads/release/python-366/
- (10) R. Brun, F. Rademakers, Nucl. Instrum. Meth. A389, 81 (1997)
- (11) ROOT project, Root [software], v 6.10/08 (2018), https://root.cern.ch/content/release-61008
- (12) Pallets Project, Flask [software], v 1.0.2 (2018), https://github.com/pallets/flask/releases/tag/1.0.2
- (13) Polymer Project, Polymer [software] v1.0 (2018), https://www.polymer-project.org/1.0/start/
- (14) B. Bellenot, S. Linev, Journal of Physics: Conference Series 664, 062033 (2015)
- (15) B. Bellenot, S. Linev, JavaScript ROOT [software], v. 5.5.0 (2018), https://github.com/root-project/jsroot/releases/tag/5.5.0