Calibrating the James Webb Space Telescope filters as star formation rate indicators.
Abstract
We have calibrated the 6.5 m James Webb Space Telescope (JWST) mid-infrared filters as star formation rate indicators, using JWST photometry synthesized from Spitzer spectra of 49 low redshift galaxies, which cover a wider luminosity range than most previous studies. We use Balmer decrement corrected luminosity and synthesized mid-infrared photometry to empirically calibrate the Spitzer, WISE and JWST filters as star formation rate indicators. Our Spitzer and WISE calibrations are in good agreement with recent calibrations from the literature. While mid-infrared luminosity may be directly proportional to star formation rate for high luminosity galaxies, we find a power-law relationship between mid-infrared luminosity and star formation rate for low luminosity galaxies (). We find that for galaxies with a luminosity of (corresponding to a star formation rate of ), the corresponding JWST mid-infrared luminosity is between and . Power-law fits of JWST luminosity as a function of luminosity have indices between 1.17 and 1.32. We find that the scatter in the JWST filter calibrations decreases with increasing wavelength from 0.39 to 0.20 dex, although F1000W is an exception where the scatter is just 0.24 dex.
1 INTRODUCTION
Galaxies grow via both star formation and galaxy mergers, so star formation rate (SFR) measurements are crucial for understanding galaxy evolution. SFR measurements can utilize spectra and imaging of both emission lines and continuum, and include (but are not limited to) line emission from and and continuum emission in the ultraviolet (UV), infrared (IR) and radio. These wavebands trace the presence or recent death of high mass stars with short lifetimes () (e.g., Kennicutt, 1998; Kennicutt & Evans, 2012; Davies et al., 2015, and references therein). UV and luminosities as a function of SFR can be predicted from theory (e.g., Kennicutt, 1998, and references therein), but both can suffer greatly from dust attenuation, which can result in large uncertainties and systematics in measured SFRs. Mid-infrared (MIR) emission from dust and polycyclic aromatic hydrocarbons (PAHs) associated with star formation suffers little from dust obscuration, making it a potentially powerful SFR indicator. The main contaminant in MIR SFR calibrations is dust heated by old stellar populations that are unassociated with recent star formation, although the significance of this effect becomes less important for shorter MIR wavelengths (e.g., Calzetti et al., 2010; Kennicutt & Evans, 2012). Critically, MIR SFR indicators require empirical calibration.
The 6.5 m James Webb Space Telescope (JWST), will be the most sensitive MIR telescope built to date, and will be able to measure SFRs for galaxies at . JWST’s Mid-Infrared Instrument (MIRI) spans wavelengths between 5 - 30 using 9 filters with effective wavelengths of; 5.6 , , , , , , , and (Bouchet et al., 2015). For point sources with exposure times of , JWST has a sensitivity of for (signal-to-noise ratio of 10), far deeper than Spitzer and WISE, which have sensitivities and respectively (Glasse et al., 2015).
In this letter we calibrate the JWST mid-infrared filters as SFR indicators. As JWST has yet to be launched, we calibrate the JWST mid-infrared filters using photometry synthesized from Spitzer spectra of low redshift galaxies (Brown et al., 2014, 2017). To validate our approach, we also calibrate the Spitzer and WISE mid-infrared filters using the same methods and spectra, enabling direct comparison with prior literature. Battisti et al. (2015) have also calibrated six MIRI filters using a sample of high luminosity galaxies with SFRs of 1 - 10 , whereas our calibrations are made using lower luminosity galaxies that cover a wider luminosity range.
Throughout this letter we use AB magnitudes, and a Hubble constant of (Bonvin et al., 2017). We also adopt a Kroupa (2001)111In this paper we convert from to SFR using: for a Kroupa (2001) (Kennicutt et al., 2009). To convert from Salpeter (1955) IMF and Chabrier (2003) IMF to Kroupa (2001) IMF, the multiplicative factor is 0.70 and 1.20 respectively (Kennicutt et al., 2009; Jaskot et al., 2015). initial mass function (IMF) for this letter, where we use the Kennicutt et al. (2009) conversion from to SFR for a Kroupa (2001) IMF. Throughout this paper we use luminosities in units of , which is consistent with several recent SFR calibration papers (e.g., Kennicutt et al., 2009; Jarrett et al., 2011; Battisti et al., 2015; Brown et al., 2017; Cluver et al., 2017).
2 SAMPLE SELECTION AND EMISSION LINE MEASUREMENTS
To calibrate MIR SFR indicators, we need a sample of galaxies with accurate MIR luminosities and accurate measurements of a SFR indicator that can be calibrated from theory (i.e., , UV and TIR). We use the Brown et al. (2014) galaxy spectra and accompanying optical emission line measurements (Brown et al., 2017) to calibrate the JWST MIRI filters as SFR indicators. Brown et al. (2014) use matched aperture photometry to rescale the optical and mid-infrared spectroscopy, thus mitigating aperture bias. The median rescale factors for our sample of 49 galaxies for Spitzer , and filters are 1.50, 1.52 and 1.18 respectively, and at have a range of 0.88 - 4.70 (Brown et al., 2014). The sample galaxies are at redshifts of and have absolute magnitudes of . We refer the reader to Brown et al. (2014) for photometric data of the galaxies and to Appendix A of Brown et al. (2014) for IRS spectra of the galaxies.
The optical emission line fluxes are taken from Brown et al. (2017), which utilize optical spectra first presented in Moustakas & Kennicutt (2006) and Moustakas et al. (2010). Following Moustakas et al. (2010), these revised emission line fluxes were determined using modified versions of pPXF (Cappellari & Emsellem, 2004) and GANDALF222Gas and Absorption Line Fitting Algorithm (Sarzi et al., 2006; Falcon-Barroso et al., 2006). (Sarzi et al., 2006) to model the stellar continuum and emission lines respectively. The Brown et al. (2014) sample contains 129 galaxies, but limiting this sample to those galaxies with nebular emission lines that satisfy a signal-to-noise threshold of five for and reduces the sample to 82 galaxies.
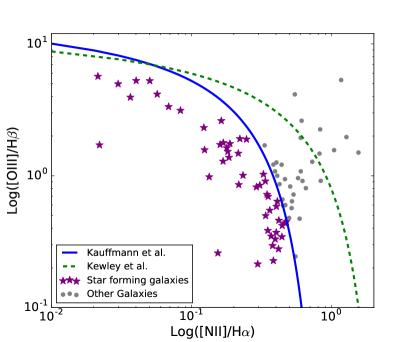
To separate active galactic nuclei (AGNs) and low ionization nuclear emission-line regions (LINERS) from star forming galaxies, we use the Baldwin, Phillips and Terlevich (Baldwin et al., 1981, BPT) diagnostic diagram. Figure 1 shows the BPT diagram for our sample, along with the Kewley et al. (2001) and Kauffmann et al. (2003) criteria for selecting star forming galaxies. We have used the empirical Kauffmann et al. (2003) criterion as it is more conservative, rejecting more galaxies that could potentially be AGNs or LINERs than Kewley et al. (2001). This reduces our sample size from 82 galaxies to 49 star forming galaxies.
Our SFR calibrations are anchored to luminosities, which must be corrected for dust extinction. We used the extinction law of Cardelli et al. (1989) for nebular emission and the Calzetti et al. (2000) starburst attenuation curve for the stellar continuum (although we don’t use the dust corrected stellar continuum in this particular paper). We adopt the intrinsic emission line flux ratios of Osterbrock (1989) for Case B recombination with an effective temperature of K and electron density of = 102 cm-3, giving an H to H ratio of 2.86.
3 JWST PHOTOMETRY
As JWST has yet to be launched and take observations, our SFR calibrations rely on photometry we have synthesized from Spitzer MIR spectroscopy of nearby galaxies (Brown et al., 2014). As Brown et al. (2014) includes MIR spectroscopy from Spitzer and MIR photometry from Spitzer and WISE, we can validate our approach by determining new SFR calibrations for Spitzer and WISE with synthesized photometry and directly comparing to the Brown et al. (2017) calibrations that used directly measured photometry. Galaxy luminosities are determined using (synthesized) apparent magnitudes and distances, with redshift independent distances being used when available (all taken from the compilation of Brown et al., 2017). It should be noted that our sample has considerable overlap with that of Brown et al. (2017), but does not include the Brown et al. (2017) galaxies that do not have Spitzer MIR spectroscopy.
Synthetic apparent magnitudes were determined using:
| (1) |
where is the filter response function (electrons per incident photon), is the energy of a photon with frequency , is the galaxy SED and is an AB magnitude zero source, with a flux density of 3631 Jy (e.g., Hogg et al., 2002).
For SFRs measured using photometry, it is common to use and defined using the apparent magnitude and the effective wavelength of the filter. This definition differs from Equation 1, and is given by;
| (2) |
where the is the apparent magnitude. For JWST we use the effective wavelengths defined by Bouchet et al. (2015) while for Spitzer and WISE we use the effective wavelengths provided by Brown et al. (2017).
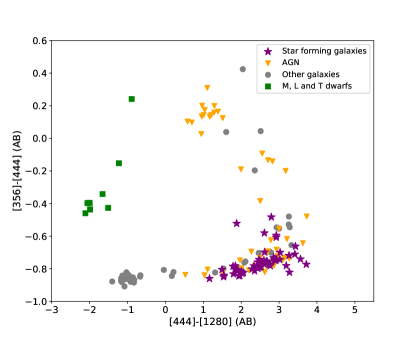
To summarize the properties of our sample and for comparisons to prior literature, in Figure 2 we show a color-color diagram derived using MIRI and NIRcam filter curves (Greene et al., 2017), which is similar to the WISE color-color diagram of Jarrett et al. (2011). We used all 129 galaxies from Brown et al. (2014) plus 16 additional AGN spectra from Brown et al. (in preparation).
New infrared SEDs for brown dwarfs and quasars were created by combining archival Akari and Spitzer spectra333http://cassis.sirtf.com/atlas/welcome.shtml and http://www.ir.isas.jaxa.jp,444The archival spectra used in Figure 2 are GJ1111, epsIndBa+Bb, J0036+1821, LHS3003, vB10, G196-3A, BRI0021-0214, J042348-0414, GJ1001A, 3C 273, 3C 351, Mrk 509, Mrk 876, PG 0052+251, PG 1211+143, PG 1415+451, PG 2349-014, Ton 951, 3C 120, Ark 120, Mrk 110, Mrk 279, Mrk 290, Mrk 590 and Mrk 817. These were selected under the conditions that the spectra of a specific object appear in both archives and the Spitzer and Akari spectra had consistent flux densities at . Unsurprisingly, the JWST color-color diagram closely resembles the WISE color-color diagram and illustrates the (well-known) utility of MIR photometry to select passive galaxies, star forming galaxies, brown dwarfs and quasars. A complete discussion of JWST color selection of different types of celestial object is beyond the scope of this letter, but will be expanded on in a future work.
4 MIR FILTER CALIBRATIONS
To validate the methods we use to calibrate the JWST MIRI filters, we first calibrate the WISE, Spitzer IRAC and Spitzer MIPS MIR filters using photometry synthesized from the Brown et al. (2014) spectra. These filters have been previously calibrated in the prior literature, which allows us to cross check our methodology.
To calibrate a specific wavelength (or filter) as a SFR indicator, we model the relationship between the luminosity (at the relevant wavelength) and Balmer decrement corrected (). We used the least squares method to do this, which assumed a Gaussian scatter of the data about the line of best fit. The relationship between luminosity and MIR luminosity is often modeled with a power-law (e.g., Wu et al., 2005; Zhu et al., 2008; Kennicutt et al., 2009; Jarrett et al., 2013; Lee et al., 2013; Brown et al., 2014; Cluver et al., 2014; Battisti et al., 2015; Brown et al., 2017; Cluver et al., 2017, and references therein), and thus we also use this parameterization.
As illustrated in Figure 3 and Table 1, for galaxies with a luminosity of , we find the corresponding WISE and Spitzer is between and . We find that the relationship between MIR luminosity and star formation rate is a power-law with indices in the range of 1.22 to 1.31. The WISE W4 normalizations and power-law indices agree to within 0.11 and 0.04 dex, respectively, of the Brown et al. (2017) estimates. Our Spitzer normalizations and power-law indices agree to within 0.08 and 0.08 dex respectively of the Brown et al. (2017) estimates. These agreements build confidence in our methods, and their utilization for the JWST MIRI filters. Brown et al. (2017) include a number of dwarf galaxies in their sample that don’t have MIR spectroscopy (and are thus excluded from our study), and we believe this is the main reason for the small systematic difference between our fits and those of Brown et al. (2017), where we measure slightly smaller power-law indices. The dwarf galaxies extend to lower luminosities than covered by the sample we use for our calibrations.
The power-law fits for Spitzer and filters determined by other studies (eg., Wu et al., 2005; Zhu et al., 2008) have smaller indices than those of Brown et al. (2017) fits and our fits. One reason for this discrepancy is we cover a broader range of luminosities than much of prior literature, going down to . Some studies also adopt a power-law index of 1, however dust content varies with galaxy mass (e.g., Calzetti et al., 2000), so this assumption is (at best) an approximation. For studies that use mostly high luminosity galaxies, the power-law indices are noticeably shallower, and create discrepancies when extrapolated to low luminosity dwarf galaxies (e.g., Wu et al., 2005; Kennicutt et al., 2009).
We used statistics to determine the uncertainties of our fits of luminosity vs relationship. The 1 scatter about the line of best bit was determined by finding the range above and below fit that encompassed 68% of the data. We present both the MIR scatter and the scatter, , with the latter providing an estimate of the accuracy of MIR measurements of star formation. Brown et al. (2017) also measure the 1 scatter about their calibration lines ( and ) and we measure comparable scatter to Brown et al. (2017) for our calibrations. It should be noted that the scatter in the power-law fit is dominated by the true scatter of galaxies about the best-fit relationship, rather than being dominated by random errors (i.e., distance errors and photometric uncertainties) or systematic errors (i.e., Hubble constant errors, filter curve errors and zero point errors).
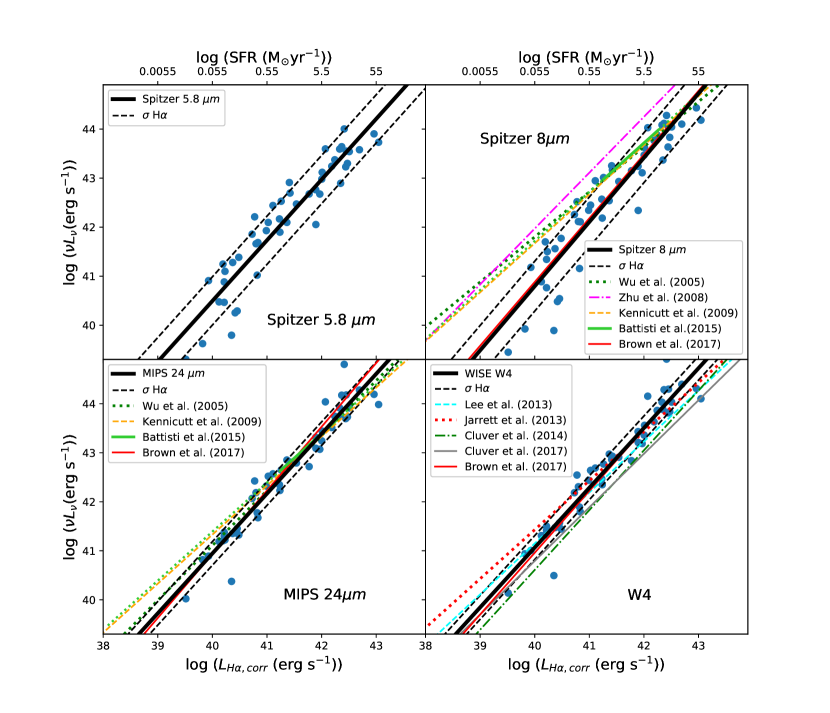
Figure 4 shows our SFR calibrations for six of the nine JWST MIRI filters. In Figure 4, we also plot our relations and those of Brown et al. (2017) for comparable Spitzer filters. We find good agreement for the F770W and F2550W filters with the normalizations and power-law indices agreeing within 0.05 dex and 0.01 respectively of our Spitzer calibrations. This builds confidence in our measurements for these wavelengths as well as the other 7 JWST MIRI filters.
| Indicator | Fit to log() | (dex) | (dex) | Effective Wavelength |
|---|---|---|---|---|
| Spitzer | (40.49 0.10) + (1.24 0.06) | 0.40 | 0.49 | |
| Spitzer | (40.80 0.11) + (1.31 0.08) | 0.39 | 0.51 | |
| Spitzer MIPS | (40.95 0.09) + (1.22 0.07) | 0.20 | 0.24 | |
| WISE W3 | (41.37 0.13) + (1.24 0.08) | 0.31 | 0.38 | |
| WISE W4 | (41.07 0.07) + (1.22 0.06) | 0.20 | 0.24 | |
| JWST F560W | (40.50 0.09) + (1.22 0.08) | 0.38 | 0.47 | |
| JWST F770W | (40.78 0.13) + (1.32 0.07) | 0.39 | 0.52 | |
| JWST F1000W | (40.64 0.10) + (1.17 0.05) | 0.24 | 0.28 | |
| JWST F1130W | (40.87 0.12) + (1.26 0.08) | 0.30 | 0.37 | |
| JWST F1280W | (40.78 0.08) + (1.24 0.05) | 0.30 | 0.37 | |
| JWST F1500W | (40.74 0.09) + (1.21 0.05) | 0.24 | 0.29 | |
| JWST F1800W | (40.86 0.09) + (1.20 0.07) | 0.24 | 0.29 | |
| JWST F2100W | (40.92 0.09) + (1.20 0.07) | 0.21 | 0.25 | |
| JWST F2550W | (41.00 0.10) + (1.23 0.07) | 0.20 | 0.24 |
For galaxies with a luminosity of , the corresponding JWST MIRI luminosity is between and . Power-law fits of the data have indices between 1.17 and 1.32. Normalization and power-law fits, their uncertainties and scatter are all presented in Table 1.
Using the less conservative Kewley et al. (2001) BPT criteria, and after the removal of known AGN (such as IC 5298, NGC 1614, NGC 3079 and NGC 5033 etc.) and extreme outliers, we find normalizations and indices agree to within 0.13 dex and 0.02 of the power-law fits we previously determined using Kauffmann et al. (2003) BPT selection criteria. We thus conclude our calibrations have a weak dependence on the chosen BPT criterion, with SFRs decreasing by 20% (at fixed MIR luminosity) if we replace the Kauffmann et al. (2003) criterion with the Kewley et al. (2001) criterion.
Figure 4 and Table 1 illustrate that the 1 scatter of the data about the power-law fits decreases with increasing wavelength from 0.38 dex for F560W to 0.20 dex for F2550W. This scatter is comparable to the scatter we measure for the Spitzer and WISE filters as well as the scatter measured by Brown et al. (2017) and Cluver et al. (2017) for filters of comparable wavelengths. The scatter is high in the shorter wavelength filters due to silicate absorption and peaks in PAH emission, including strong features at and (e.g., Brandl et al., 2006; Cluver et al., 2014). Longer wavelengths are dominated by blackbody radiation from warm dust, resulting in less scatter.
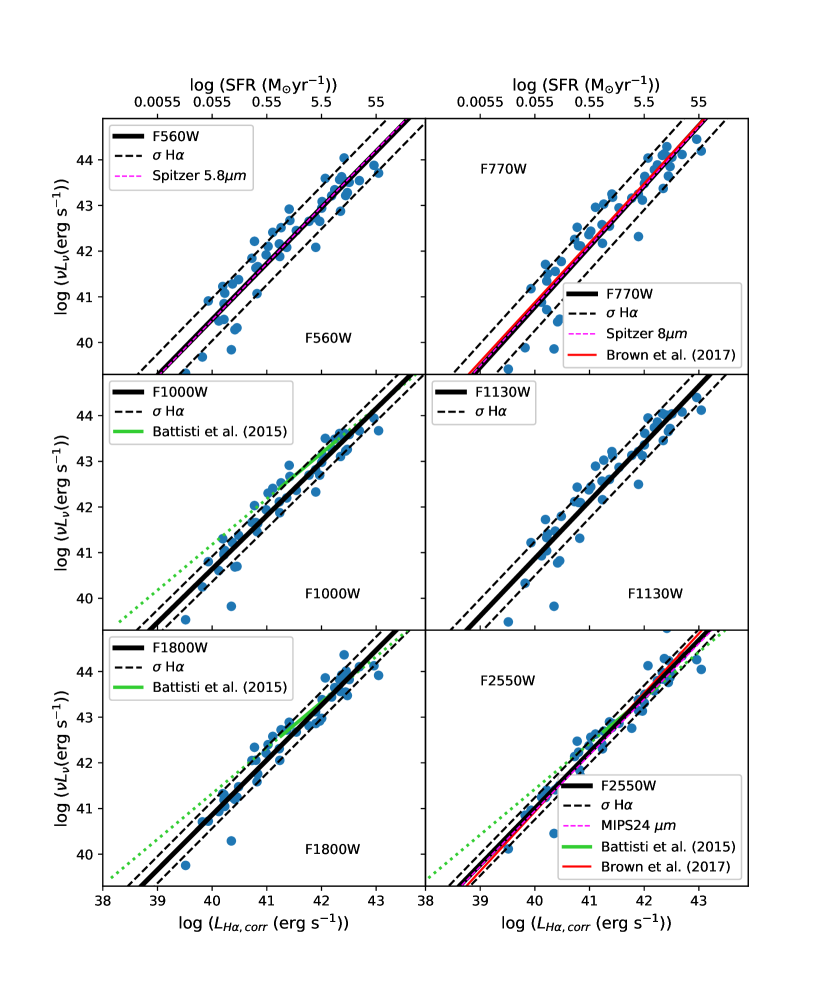
While the scatter generally deceases with increasing wavelength, the F1000W filter has a relatively low scatter of 0.24 dex, which is significantly less than filters with comparable effective wavelengths. This may be due to being in the sweet spot where PAH emission is canceled out by silicate absorption.
Brown et al. (2017) SFR calibrations included a number of dwarf galaxies with Spitzer and WISE photometry but no Spitzer IRS spectroscopy. That said, we observe scatter that is comparable to Brown et al. (2017) for the relevant wavelengths, even though we have used higher luminosity galaxies to calibrate the MIRI filters as SFR indicators. Our best fits have comparable normalization and power-law indices as the relevant Brown et al. (2017) fits (when applicable), so extrapolations of our relations should apply to dwarf galaxies. We conclude that the longer wavelength JWST MIRI filters, along with the F1000W filter, will provide the most accuracate SFR measurements.
In Figure 4 there are several low luminosity outliers (e.g., UGCA 166 and Mrk 475) and these are also seen in the Brown et al. (2017) calibrations. Lower luminosity galaxies used for the Brown et al. (2017) calibrations do fall along their power-law relations, so we don’t believe the outliers in Figure 4 imply a breakdown of the overall power-law relation. As noted earlier, we were unable to include the lowest luminosity galaxies from Brown et al. (2017) in our calibrations as they lack Spitzer IRS spectroscopy.
Our calibrations can be directly compared to those of Battisti et al. (2015), who presented calibrations of SFR indicators in wavelength range, including calibrations of six MIRI filters, some of which are plotted in Figure 4. To compare our calibrations with those of Battisti et al. (2015) we use their conversion factors that correspond to . Our sample includes relatively low luminosity galaxies whereas the Battisti et al. (2015) sample is focused on galaxies with SFRs of with a few galaxies with SFRs . Battisti et al. (2015) have assumed that SFR is directly proportional to MIR luminosity, with a conversion factor that is determined via fits of synthetic observations of a redshifted composite spectrum. While this assumption may be correct for galaxies with high luminosity, we find that the relationship between luminosity and star formation rate is a power-law. This can be clearly seen in Figure 4 where our relationship and that of Battisti et al. (2015) intercept at higher luminosities, while at lower luminosities the relationships from Battisti et al. (2015) are higher in MIR luminosity than our calibrations. From this we conclude that the calibrations from Battisti et al. (2015) will provide an accurate SFR measurement for higher luminosity galaxies, however our calibrations are more accurate for lower luminosity galaxies (i.e., dwarf galaxies). An obvious extension to our work will be to calibrate the JWST MIRI filters for a wider luminosity range, including high luminosity galaxies that fall in the range where prior calibrations have adopted a one-to-one relationship between MIR luminosity and SFR.
5 SUMMARY
We have calibrated the JWST, Spitzer and WISE MIR filters as SFR indicators using photometry synthesized from Spitzer spectra and Balmer decrement corrected luminosities, measured with scanned long-slit spectroscopy (Moustakas & Kennicutt, 2006; Moustakas et al., 2010; Brown et al., 2014, 2017). Our galaxy sample covers a wide range of luminosities and thus our calibrations extend to lower luminosities than other studies such as Battisti et al. (2015). We verified our approach by comparing our Spitzer and WISE calibrations with those from the literature.
For Spitzer, WISE and JWST we find galaxies with an luminosity of , the corresponding MIR is between and . We find that the relationship between luminosity in MIR filters is approximated by power-laws with indices between 1.17 and 1.32. For the MIRI filters, the 1 scatter of the data about our power-law fits is between 0.39 and 0.20 dex, which are comparable to the scatter measured by Brown et al. (2017) for equivalent wavelength filters. This scatter decreases with increasing wavelength as PAHs emission and silicate absorption dominate at shorter wavelengths, whereas longer wavelengths have are dominated by blackbody radiation from dust. The exception to this is the filter (F1000W) which has a scatter of just 0.24 dex, which is significantly less than other JWST filters with comparable effective wavelengths.
References
- Baldwin et al. (1981) Baldwin, J. A., Phillips, M. M., & Terlevich, R. 1981, Publications of the Astronomical Society of the Pacific, 93, 5
- Battisti et al. (2015) Battisti, A. J., Calzetti, D., Johnson, B. D., & Elbaz, D. 2015, The Astrophysical Journal, 800, 143
- Bonvin et al. (2017) Bonvin, V., Courbin, F., Suyu, S. H., et al. 2017, Monthly Notices of the Royal Astronomical Society, 465, 4914
- Bouchet et al. (2015) Bouchet, P., Garcia-Marin, M., Lagage, P.-O., et al. 2015, Astronomical Society of the Pacific, 127, 1
- Brandl et al. (2006) Brandl, B. R., Bernard-Salas, J., Spoon, H. W. W., et al. 2006, The Astrophysical Journal, 653, 1129
- Brown et al. (2014) Brown, M. J. I., et al. 2014, ApJS, 212, 18
- Brown et al. (2017) —. 2017, ApJ, 847, 136
- Calzetti et al. (2000) Calzetti, D., Armus, L., Bohlin, R. C., et al. 2000, The Astrophysical Journal, 533, 682
- Calzetti et al. (2010) Calzetti, D., Wu, S.-Y., Hong, S., et al. 2010, The Astrophysical Journal, 714, 1256
- Cappellari & Emsellem (2004) Cappellari, M., & Emsellem, E. 2004, PASP, 116, 138
- Cardelli et al. (1989) Cardelli, J. A., Clayton, G. C., & Mathis, J. S. 1989, ApJ, 345, 245
- Chabrier (2003) Chabrier, G. 2003, Publications of the ASP, 115, 763
- Cluver et al. (2017) Cluver, M. E., Jarrett, T. H., Dale, D. A., Smith, J.-D. T., August, T., & Brown, M. J. I. 2017, ApJ, 850, 68
- Cluver et al. (2014) Cluver, M. E., et al. 2014, The Astrophysical Journal, 782, 90
- Davies et al. (2015) Davies, L. J. M., Robotham, A. S. G., Driver, S. P., et al. 2015, Monthly Notices of the Royal Astronomical Society, 452, 616
- Falcon-Barroso et al. (2006) Falcon-Barroso, J., et al. 2006, Monthly Notices of the Royal Astronomical Society, 369, 529
- Glasse et al. (2015) Glasse, A., Rieke, G. H., Bauwens, E., et al. 2015, Publications of the Astronomical Society of the Pacific, 127, 686
- Greene et al. (2017) Greene, T. P., et al. 2017, Journal of Astronomical Telescopes, Instruments, and Systems, 3, 035001
- Hogg et al. (2002) Hogg, D. W., Baldry, I. K., Blanton, M. R., & Eisenstein, D. J. 2002, Cornell University Library
- Jarrett et al. (2011) Jarrett, T. H., et al. 2011, The Astrophysical Journal, 735, 112
- Jarrett et al. (2013) —. 2013, The Astrophysical Journal, 145, 6
- Jaskot et al. (2015) Jaskot, A. E., Oey, M. S., Salzer, J. J., Sistine, A. V., Bell, E. F., & Haynes, M. P. 2015, The Astrophysical Journal, 808, 66
- Kauffmann et al. (2003) Kauffmann, G., Heckman, T. M., White, S. D. M., et al. 2003, Monthly Notices of the Royal Astronomical Society, 341, 33
- Kennicutt (1998) Kennicutt, R. C. 1998, Annual Review of Astronomy and Astrophysics, 36, 189
- Kennicutt & Evans (2012) Kennicutt, R. C., & Evans, N. J. 2012, Annual Review of Astronomy and Astrophysics, 50, 531
- Kennicutt et al. (2009) Kennicutt, R. C., Jr.1, 2, C.-N. H., et al. 2009, The Astrophysical Journal, 703, 1672–1695
- Kewley et al. (2001) Kewley, L. J., Dopita, M. A., Sutherland, R. S., et al. 2001, The Astrophysical Journal, 556, 121
- Kroupa (2001) Kroupa, P. 2001, Monthly notices of the Royal Astronomical Society, 322, 231
- Lee et al. (2013) Lee, J. C., Hwang, H. S., & Ko, J. 2013, The Astrophysical Journal, 774, 62
- Moustakas et al. (2010) Moustakas, J., Jr, R. C. K., Tremonti, C. A., Dale, D. A., Smith, J.-D. T., & Calzetti, D. 2010, The Astrophysical Journal Supplement Series, 190, 233
- Moustakas & Kennicutt (2006) Moustakas, J., & Kennicutt, Jr., R. C. 2006, ApJS, 164, 81
- Osterbrock (1989) Osterbrock, D. E. 1989, Astrophysics of gaseous nebulae and active galactic nuclei (University Science Books)
- Salpeter (1955) Salpeter, E. E. 1955, The Astrophysical Journal, 121, 161
- Sarzi et al. (2006) Sarzi, M., et al. 2006, MNRAS, 366, 1151
- Wu et al. (2005) Wu, H., Cao, C., Hao, C.-N., Liu, F.-S., Wang, J.-L., Xia, X.-Y., Deng, Z.-G., & Young, C. K.-S. 2005, Astrophysical Journal, Letters, 632, L79
- Wu et al. (2005) Wu, J., II, N. J. E., Gao, Y., et al. 2005, The Astrophysical Journal, 635, 173
- Zhu et al. (2008) Zhu, Y.-N., Wu, H., Cao, C., & Li, H.-N. 2008, The Astrophysical Journal, 686, 155