Unsupervised learning with GLRM feature selection reveals novel traumatic brain injury phenotypes
Abstract
Baseline injury categorization is important to traumatic brain injury (TBI) research and treatment. Current categorization is dominated by symptom-based scores that insufficiently capture injury heterogeneity. In this work, we apply unsupervised clustering to identify novel TBI phenotypes. Our approach uses a generalized low-rank model (GLRM) model for feature selection in a procedure analogous to wrapper methods. The resulting clusters reveal four novel TBI phenotypes with distinct feature profiles and that correlate to 90-day functional and cognitive status.
1 Introduction
Traumatic brain injury (TBI) is a leading cause of death and disability in the United States, with an estimated 2.8 million new cases annually [1]. In the United States alone, more than 5.2 million individuals currently live with TBI-related disabilities spanning a diverse array of neurobehavioral symptoms such as cognitive, emotional, and motor impairments [2].
Significant heterogeneity exists within the spectrum of TBI relative to cause, severity, pathology, and prognosis. This heterogeneity represents a major challenge to phenotype categorization which is important to TBI research directed at understanding the underlying physiological mechanisms of injury and recovery, and therapeutic development. Currently, TBI is predominantly categorized by symptom-based scores such as the Glasgow Coma Scale (GCS), which is the primary selection criteria for inclusion in most TBI clinical trials [3]. However, there is a consensus among TBI researchers that GCS derived categories are insufficient to capture the complexity of brain injury and do not adequately correlate with long term outcomes [3, 4].
Unsupervised machine learning is a promising method for data-driven phenotype discovery that may improve current TBI categorization. Unsupervised methods have previously been used to identify patient sub-populations for several diseases [5, 6, 7] and have recently been applied within the limited context of mild TBI [8, 9]. In the work presented here, we sought to extend the use of unsupervised learning in TBI to identify sub-populations with homogeneous clinical characteristics for a broad range of injury severity. Our approach, described in detail below, uses a two-stage pipeline. In the first stage, we perform automated feature selection via generalized low-rank model (GLRM) analysis in a manner analogous to wrapper methods used in supervised learning contexts. In the second stage, the selected feature set is used to cluster the entire dataset.
2 Methods
2.1 Study cohort data
Analysis was conducted on data from the Citicoline Brain Injury Treatment Trial (COBRIT; NCT00545662), a clinical trial of 1,213 TBI patients [10, 11] 111data available through https://fitbir.nih.gov/. Patients were between the ages of 18 and 70 years old, had been diagnosed with a non-penetrating TBI, and had a positive baseline CT scan. Baseline data was acquired prior to injury or within 24 hours after injury and included CT scans, physiological measurements, vital signs, medical history, demographics, laboratory test results, drug screening, and injury information. Where reported, multiple physiological measurements were averaged into a single value. All categorical features were consolidated into a maximum of three categories based on category frequency and dummy coded. Patients with missing values for any baseline feature were excluded, leaving 991 for this study. Outcome data included 12 assessments of 90 day functional and cognitive status. Only patients with complete outcome data were used for analysis of cluster to outcome association (n = 771 at 90 days).
2.2 Generalized Low-Rank Model feature selection
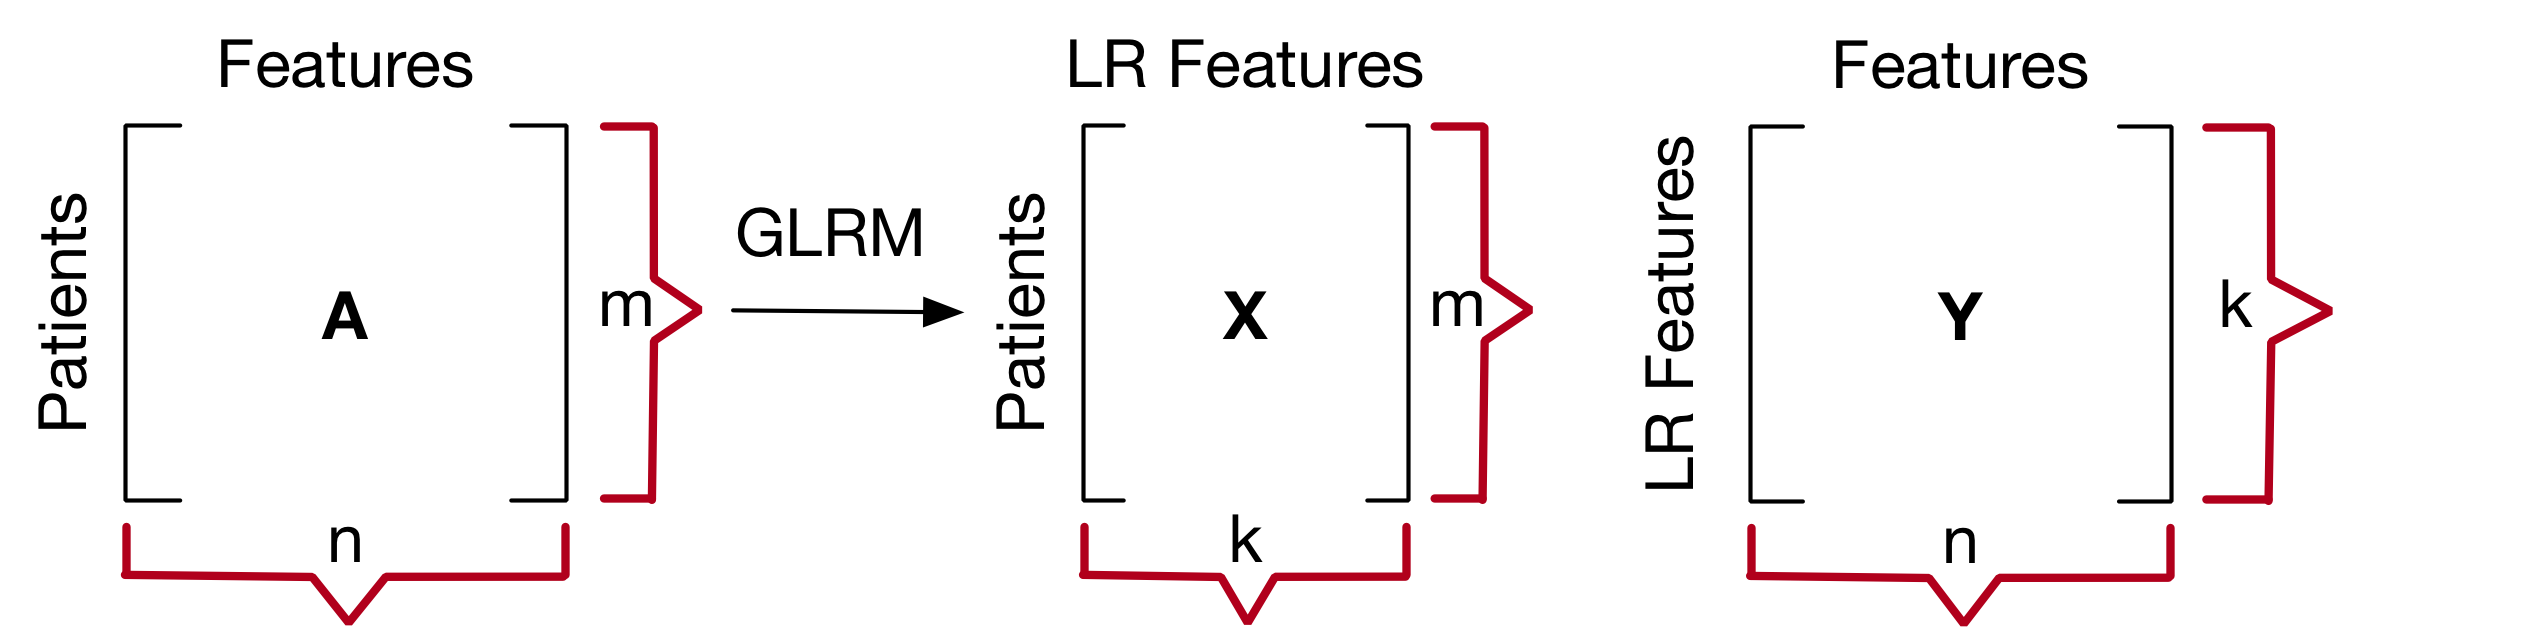
A GLRM decomposes an matrix, , into matrices and such that is approximately equal to under the constraint that the number, , of linearly independent columns in (i.e. the rank) satisfies (see Figure 1). Importantly for biomedical applications, GLRM’s can represent high-dimensional data of mixed data types in a transformed lower-dimensional space [12]. We used a GLRM to decompose the patient data matrix, , composed of patient rows and clinical feature columns. We fixed our low-rank model at rank , and used quadratic and hinge loss functions to approximate numerical and binary features, respectively [12]. We applied L1-norm regularization on to reduce the size of the feature set contributing to the low rank decomposition, resulting in the following loss function:
| (1) |
where the L1-regularization parameter, , is greater than zero, and indicates column of . The quadratic loss function was scaled by the inverse variance, , of each feature, , to compensate for unequal scaling in different features. Regularization produces a column-sparse matrix, , where the number of non-zero columns, , is small relative to the total column number, . If is a zero vector, then feature from is not used in the formulation of any of the low-rank features which suggests it was relatively uninformative in approximating [13, 14, 15]. Therefore, for a given choice of , we select the features from the original input space for which there is at least one non-zero entry in the column . In this manner, the GLRM is utilized for feature reduction, rather than transformation into a lower dimensional space.
2.3 Clustering method
Given a feature set, we calculated the pairwise dissimilarity between observations using Gower’s measure [16] to form a dissimilarity matrix. Gower’s measure was selected because it accommodates mixed data types. Weights were added to binary features in pairwise Gower’s coefficient calculations such that both binary and numerical features were weighted proportionally on average. The partitioning around medoids (PAM) algorithm was used to cluster the dissimilarity matrix [17].
2.4 Cross-validation feature selection procedure
To avoid over-fitting, we implemented a -fold cross-validation feature selection procedure to tune the GLRM regularization parameter, (see Algorithm 1). For each fold, an optimal parameter is determined on the trainig folds. Features are then selected using GLRM on the validation fold. The final feature set was taken as the intersection of features selected across the validation folds.
2.5 Cluster analysis
Training and validation cluster stability was assessed by comparing the similarity of cluster membership between observation pairs in the training and validation folds, respectively, with their cluster membership in the full dataset using the Pairwise Similarity Index. The Pairwise Similarity Index for two equal length sets of clustering labels, Set A and Set B, is the percent of total observation pairs that belong to the same cluster in both Set A and Set B.
2.6 Statistical Analysis
To compare differences in feature values between clusters, group-wise comparisons were assessed using the Kruskal-Wallis test for non-parametric one-way analysis of variance. When the Kruskal-Wallis test indicated overall significance, the Holm multiple comparison test was used to determine specific group differences where applicable. Pearson’s chi-squared test was used to compare distributions of categorical variables. Statistical comparisons were considered significant when p values were < 0.05 or as determined by the Holm’s test statistic for multiple comparisons.
3 Results
From the 98 features available in the COBRIT dataset, our feature selection process retained 13: net fluid intake; heart rate; blood count measures of hematocrit, hemoglobin, platelets, white blood cells; blood levels of glucose and the liver enzyme aspartate aminotransferase (AST); and clotting indicators prothrombin time (PT), partial thromboplastin time (PTT) and PT International Normalized Ratio (INR); presence of abnormal mesencephalic cisterns on the CT scan (whether blood-filled, compressed or obliterated); indicator of falling as injury mechanism. The necessity of each feature was evaluated by randomly shuffling its values between patients, clustering the data and comparing the results to the clusters obtained using the non-shuffled values via the Jaccard similarity and pairwise similarity index. This process was repeated 500 times. Only INR was found to be unnecessary and was removed for the final analysis.
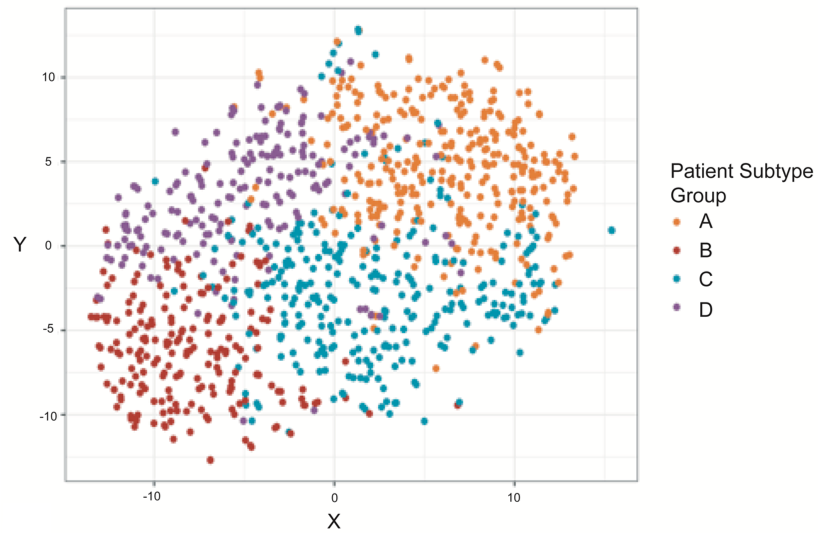
The full dataset of 991 patients was clustered using the remaining 12 features resulting in four distinct patient phenotypes, as shown in Figure 2. Statistically significant differences between clusters were found for all 12 baseline features (Appendix Table 1). At 90 days, there were significant differences between clusters on 9 out of 12 of the outcome assessment scores (Appendix, Table 2). For comparison, when patients were grouped by their GCS score at baseline, the current clinical standard, no significant baseline feature or 90 day outcome differences were detected between groups.
4 Discussion & conclusion
We identified 4 TBI patient phenotypes using unsupervised machine learning. Each phenotype possess a unique baseline feature profile which corresponded to differences in long-term outcomes. Comparatively, when categorized by GCS score, distinct feature profiles are not observed and categories did not correlate with long-term outcomes. Methodologically, we used a GLRM to identify important features from the original input space. This is advantageous for biomedical applications because it enables feature reduction to control over-fitting, while retaining interpretable clinical features. The selected features plausibly influence TBI outcome. Platelet and hemoglobin counts, hematocrit, PT, PTT, & net fluid intake contribute to coagulation which is common in TBI and is associated with poor outcomes [18, 19, 20]. High net fluid intake, low complete blood count measures and prolonged PT/PTT duration are indicative of possible hemorrhage [21], which may have occurred in patients with abnormal mesencephalic cisterns which were more represented in subtype B. Abnormal cistern imaging, elevated AST levels, and increased white blood cell counts have been associated with TBI in previous research [8, 22, 23]. Falling as injury cause, the only selected non-physiological feature, is associated with intracranial pressures that differ from other injury mechanisms [24, 25].
Study limitations include: all patients had positive CT findings, which is not true of all TBIs; baseline features did not include genetic data or other neuroimaging modalities; phenotype profile and patient outcome realations are only correlative. These areas are considerations for our future research.
Our results demonstrate that unsupervised machine learning may advance TBI translational research. With refinement, we anticipate that data-derived patient phenotypes will supplement existing clinical assessments for TBI patient classification in clinical trials and provide clinical decision support.
References
- Taylor et al. [2017] Christopher A. Taylor, Jeneita M. Bell, Matthew J. Breiding, and Likang Xu. Traumatic Brain Injury–Related Emergency Department Visits, Hospitalizations, and Deaths — United States, 2007 and 2013. MMWR. Surveillance Summaries, 66(9):1–16, mar 2017. ISSN 1546-0738. doi: 10.15585/mmwr.ss6609a1.
- Thurman et al. [1999] D J Thurman, C Alverson, K a Dunn, J Guerrero, and J E Sniezek. Traumatic brain injury in the United States: A public health perspective. The Journal of head trauma rehabilitation, 14(6):602–15, 1999. ISSN 0885-9701. doi: 10.1097/00001199-199912000-00009.
- Saatman et al. [2008] Kathryn E. Saatman, Ann-Christine Duhaime, Ross Bullock, Andrew I.R. Maas, Alex Valadka, and Geoffrey T. Manley. Classification of Traumatic Brain Injury for Targeted Therapies. Journal of Neurotrauma, 25(7):719–738, 2008. ISSN 0897-7151. doi: 10.1089/neu.2008.0586.
- Hawryluk and Bullock [2016] Gregory W.J. Hawryluk and M. Ross Bullock. Past, Present, and Future of Traumatic Brain Injury Research. Neurosurgery Clinics of North America, 27(4):375–396, oct 2016. ISSN 10423680. doi: 10.1016/j.nec.2016.05.002.
- Alizadeh et al. [2000] Ash A. Alizadeh, Michael B. Eisen, R. Eric Davis, Chi Ma, Izidore S. Lossos, Andreas Rosenwald, Jennifer C. Boldrick, Hajeer Sabet, Truc Tran, Xin Yu, John I. Powell, Liming Yang, Gerald E. Marti, Troy Moore, James Hudson, Lisheng Lu, David B. Lewis, Robert Tibshirani, Gavin Sherlock, Wing C. Chan, Timothy C. Greiner, Dennis D. Weisenburger, James O. Armitage, Roger Warnke, Ronald Levy, Wyndham Wilson, Michael R. Grever, John C. Byrd, David Botstein, Patrick O. Brown, and Louis M. Staudt. Distinct types of diffuse large B-cell lymphoma identified by gene expression profiling. Nature, 403(6769):503–511, 2000. ISSN 0028-0836. doi: 10.1038/35000501.
- Gamberger et al. [2016] D. Gamberger, B. Ženko, A. Mitelpunkt, and N. Lavrač. Homogeneous clusters of Alzheimer’s disease patient population. BioMedical Engineering Online, 15, 2016. ISSN 1475925X. doi: 10.1186/s12938-016-0183-0.
- Li et al. [2015] Li Li, Wei-Yi Cheng, Benjamin S. Glicksberg, Omri Gottesman, Ronald Tamler, Rong Chen, Erwin P. Bottinger, and Joel T. Dudley. Identification of type 2 diabetes subgroups through topological analysis of patient similarity. Science Translational Medicine, 7(311):311ra174–311ra174, oct 2015. ISSN 1946-6234. doi: 10.1126/scitranslmed.aaa9364.
- Nielson et al. [2017] Jessica L Nielson, Shelly R Cooper, John K Yue, Marco D Sorani, Tomoo Inoue, Esther L Yuh, Pratik Mukherjee, Tanya C Petrossian, Jesse Paquette, Pek Y Lum, Gunnar E Carlsson, Mary J Vassar, Hester F Lingsma, Wayne A Gordon, Alex B Valadka, David O Okonkwo, Geoffrey T Manley, Adam R Ferguson, and TRACK-TBI TRACK-TBI Investigators. Uncovering precision phenotype-biomarker associations in traumatic brain injury using topological data analysis. PloS one, 12(3):e0169490, 2017. ISSN 1932-6203. doi: 10.1371/journal.pone.0169490.
- Si et al. [2018] Bing Si, Gina Dumkrieger, Teresa Wu, Ross Zafonte, David W. Dodick, Todd J. Schwedt, and Jing Li. A Cross-Study Analysis for Reproducible Sub-classification of Traumatic Brain Injury. Frontiers in Neurology, 9:606, aug 2018. ISSN 1664-2295. doi: 10.3389/fneur.2018.00606.
- Zafonte et al. [2009] Ross Zafonte, William T. Friedewald, Shing M. Lee, Bruce Levin, Ramon Diaz-Arrastia, Beth Ansel, Howard Eisenberg, Shelly D. Timmons, Nancy Temkin, Thomas Novack, Joseph Ricker, Randall Merchant, and Jack Jallo. The Citicoline Brain Injury Treatment (COBRIT) Trial: Design and Methods. Journal of Neurotrauma, 26(12):2207–2216, 2009. ISSN 0897-7151. doi: 10.1089/neu.2009.1015.
- Zafonte et al. [2012] R.D. Zafonte, E. Bagiella, B.M. Ansel, T.A. Novack, W.T. Friedewald, D.C. Hesdorffer, S.D. Timmons, J. Jallo, H. Eisenberg, T. Hart, J.H. Ricker, R. Diaz-Arrastia, R.E. Merchant, N.R. Temkin, S. Melton, and S.S. Dikmen. Effect of citicoline on functional and cognitive status among patients with traumatic brain injury: Citicoline Brain Injury Treatment Trial (COBRIT). JAMA - Journal of the American Medical Association, 308(19), 2012. ISSN 00987484 15383598. doi: 10.1001/jama.2012.13256.
- Udell et al. [2016] Madeleine Udell, Corinne Horn, Reza Zadeh, and Stephen Boyd. Generalized Low Rank Models. Foundations and Trends R @BULLET in Machine Learning, 9(1):1–118, 2016. doi: 10.1561/2200000055.
- Witten and Tibshirani [2010] Daniela M Witten and Robert Tibshirani. A framework for feature selection in clustering. Journal of the American Statistical Association, 105(490):713–726, 2010. ISSN 01621459. doi: 10.1198/jasa.2010.tm09415.
- Witten et al. [2009] Daniela M Witten, Robert Tibshirani, and Trevor Hastie. A penalized matrix decomposition, with applications to sparse principal components and canonical correlation analysis. Biostatistics (Oxford, England), 10(3):515–34, jul 2009. ISSN 1468-4357. doi: 10.1093/biostatistics/kxp008.
- Shen and Huang [2007] Haipeng Shen and Jianhua Z Huang. Sparse Principal Component Analysis via Regularized Low Rank Matrix Approximation. Accepted by Journal of Multivariate Analysis, 2007.
- Gower [1971] J. C. Gower. A General Coefficient of Similarity and Some of Its Properties. Biometrics, 27(4):857, dec 1971. ISSN 0006341X. doi: 10.2307/2528823. URL https://www.jstor.org/stable/2528823?origin=crossrefhttp://www.jstor.org/stable/2528823?origin=crossref.
- Kaufman et al. [1990] Leonard. Kaufman, Peter J. Rousseeuw, and Wiley InterScience (Online service). Finding groups in data : an introduction to cluster analysis. Wiley, 1990. ISBN 9780470316801.
- Harhangi et al. [2008] B. S. Harhangi, E. J. O. Kompanje, F. W. G. Leebeek, and A. I. R. Maas. Coagulation disorders after traumatic brain injury. Acta Neurochirurgica, 150(2):165–175, feb 2008. ISSN 0001-6268. doi: 10.1007/s00701-007-1475-8.
- Hulka et al. [1996] F Hulka, R J Mullins, and E H Frank. Blunt brain injury activates the coagulation process. Archives of surgery (Chicago, Ill. : 1960), 131(9):923–7; discussion 927–8, sep 1996. ISSN 0004-0010.
- Stein and Smith [2004] Sherman C. Stein and Douglas H. Smith. Coagulopathy in traumatic brain injury, 2004. ISSN 15416933.
- Talving et al. [2009] Peep Talving, Rodd Benfield, Pantelis Hadjizacharia, Kenji Inaba, Linda S. Chan, and Demetrios Demetriades. Coagulopathy in Severe Traumatic Brain Injury: A Prospective Study. The Journal of Trauma: Injury, Infection, and Critical Care, 66(1):55–62, jan 2009. ISSN 0022-5282. doi: 10.1097/TA.0b013e318190c3c0. URL https://insights.ovid.com/crossref?an=00005373-200901000-00007.
- Rovlias and Kotsou [2001] Aristedis Rovlias and Serafim Kotsou. The blood leukocyte count and its prognostic significance in severe head injury. Surgical Neurology, 55(4):190–196, apr 2001. ISSN 0090-3019. doi: 10.1016/S0090-3019(01)00414-1.
- Härtl et al. [1997] Roger Härtl, Max B. Medary, Maximilian Ruge, Karl E. Arfors, and Jam Ghajar. Early White Blood Cell Dynamics after Traumatic Brain Injury: Effects on the Cerebral Microcirculation. Journal of Cerebral Blood Flow & Metabolism, 17(11):1210–1220, nov 1997. ISSN 0271-678X. doi: 10.1097/00004647-199711000-00010.
- Post and Hoshizaki [2012] Andrew Post and T Blaine Hoshizaki. Mechanisms of brain impact injuries and their prediction: A review, 2012. ISSN 14770350.
- Yanagida et al. [1989] Y Yanagida, S Fujiwara, and Y Mizoi. Differences in the intracranial pressure caused by a ’blow’ and/or a ’fall’–an experimental study using physical models of the head and neck. Forensic science international, 41(1-2):135–45, 1989. ISSN 0379-0738.
Appendix
| Subtype A | Subtype B | Subtype C | Subtype D | |||||
| Clinical Features Continuous | Median | IQR | Median | IQR | Median | IQR | Median | IQR |
|---|---|---|---|---|---|---|---|---|
| Platelet count (1000/) | 219.0 | 80.0 | 181.5 | 91.3 | 216.0 | 80.0 | 177.4 | 71.1 |
| Hemoglobin (g/dL) | 14.1 | 1.8 | 10.3 | 2.2 | 13.0 | 1.9 | 11.1 | 1.9 |
| AST (IU/L) | 33.0 | 19.0 | 83.5 | 96.3 | 50.0 | 60.5 | 40.0 | 28.8 |
| Net Fluid Intake (L) | 1.7 | 1.5 | 5.7 | 4.1 | 3.1 | 2.2 | 3.4 | 2.4 |
| Heart Rate (bpm) | 81.0 | 14.3 | 103.5 | 17.8 | 97.5 | 15.5 | 79.5 | 12.9 |
| Glucose (mg/dL) | 120.5 | 29.8 | 152.8 | 45.1 | 136.0 | 35.4 | 134.8 | 38.3 |
| White Blood Cell Count (1000/) | 11.6 | 5.4 | 16.5 | 6.9 | 14.3 | 5.2 | 12.5 | 5.5 |
| Hematocrit (%) | 41.0 | 4.5 | 32.5 | 5.5 | 39.0 | 5.0 | 35.3 | 4.9 |
| Prothrombin Time (sec) | 13.0 | 2.9 | 14.8 | 3.1 | 10.9 | 2.9 | 13.8 | 3.4 |
| Partial Thromboplastin Time (sec) | 26.5 | 4.3 | 28.5 | 5.5 | 25.0 | 3.9 | 27.0 | 4.4 |
| Clinical Features Binary | % Count | % Count | % Count | % Count | ||||
| Abnormal Mesencephalic Cisterns (CT Finding) | 15.9% (50) | 44.1% (90) | 25.2% (72) | 63.1% (118) | ||||
| Fall Injury Mechanism | 28.3% (89) | 90.0% (184) | 78.3% (224) | 35.2% (66) | ||||
| Subtype A | Subtype B | Subtype C | Subtype D | ||||||
| Primary Outcomes | Median | IQR | Median | IQR | Median | IQR | Median | IQR | p-value |
|---|---|---|---|---|---|---|---|---|---|
| Glasgow Outcome Scale Extended | 6 | 1 | 4 | 3 | 5 | 2 | 4 | 3 | <0.0001 |
| California Verbal Learning Test | 49 | 17 | 39 | 21 | 47 | 20 | 42 | 20 | <0.0001 |
| Processing Speed Index | 26 | 28 | 24 | 30 | 29 | 27 | 23.5 | 30.3 | 0.0044 |
| Trial Making A | 43 | 18 | 29 | 40 | 39 | 21 | 37 | 27.3 | <0.0001 |
| Trail Making B | 42 | 19 | 33 | 40 | 39 | 28 | 37.5 | 26.5 | <0.0001 |
| Digit Span | 9 | 3 | 8 | 3 | 9 | 4 | 9 | 3.8 | 0.0328 |
| Stroop Part 1 | 45.5 | 15.3 | 51 | 18 | 49 | 17 | 48 | 16 | 0.0005 |
| Stroop Part 2 | 112 | 42 | 112 | 63 | 110 | 52 | 106.5 | 52.5 | 0.5319 |
| Controlled Oral Word Association Test | 38 | 14 | 31 | 15 | 34 | 15 | 34.5 | 14.3 | <0.0001 |
| Secondary Outcomes | Median | IQR | Median | IQR | Median | IQR | Median | IQR | p-value |
| Disability Rating Scale | 0 | 1 | 4 | 6 | 1 | 3 | 1 | 4 | <0.0001 |
| Satisfaction with Life Scale | 24 | 12 | 21 | 10.8 | 23 | 11 | 23 | 11 | 0.6702 |
| Brief Symptoms Inventory-18 Global Severity Index | 56 | 19.8 | 57 | 14.8 | 55 | 18 | 56 | 15.5 | 0.7566 |