19.3
Collective plasmonic excitations in double-layer silicene at finite temperature
Abstract
We explore the temperature-dependent plasmonic modes of an n-doped double-layer silicene system which is composed of two spatially separated single layers of silicene with a distance large enough to prevent the interlayer electron tunneling. By applying an externally applied electric field, we numerically obtain the poles of the loss function within the so-called random phase approximation, to investigate the effects of temperature and geometry on the plasmon branches in three different regimes: topological insulator, valley-spin polarized metal, and band insulator. Also, we present the finite-temperature numerical results along with the zero-temperature analytical ones to support a discussion of the distinct effects of the external electric field and temperature on the plasmon dispersion. Our results show that at zero temperature both the acoustic and optical modes decrease by increasing the applied electric field and experience a discontinuity at the valley-spin polarized metal phase as the system transitions from a topological insulator to a band insulator. At finite temperature, the optical plasmons are damped around this discontinuity and the acoustic modes may exhibit a continuous transition. Moreover, while the optical branch of plasmons changes non-monotonically and noticeably with temperature, the acoustic branch dispersion displays a negligible growth with temperature for all phases of silicene. Furthermore, our finite-temperature results indicate that the dependency of two plasmonic branches on the interlayer separation is not affected by temperature at long wavelengths; the acoustic mode energy varies slightly with increasing the interlayer distance, whereas the optical mode remains unchanged.
I Introduction
The advent of two-dimensional (2D) materials has sparked a considerable scientific interest due to their unique properties and their potential for applications in electronic, spintronic, valleytronic, optoelectronic and plasmonic devices. Silicene, the silicon counterpart of graphene has received much attention in recent years both theoreticallyGuzmán-Verri and Lew Yan Voon (2007); Cahangirov et al. (2009); Enriquez et al. (2012); Kaltsas and Tsetseris (2013); Lew Yan Voon et al. (2016); Huang et al. (2013); Barati et al. (2018) and experimentallyKara et al. (2009); Nakano and Ikuno (2016); Sugiyama et al. (2010); Lin et al. (2012); Feng et al. (2012); Chiappe et al. (2012); Jamgotchian et al. (2012); Fleurence et al. (2012); Meng et al. (2013); Lalmi et al. (2010). Like graphene, silicene is an atomically thin sheet of silicon atoms arranged in a honeycomb structure; however, unlike graphene, silicene does not hold a planar structure. A small out of plane buckling of the silicene structure due to the hybridization results in a system of two sublattices (A and B) which lie in two parallel planes separated by a vertical distance Ni et al. (2012); Drummond et al. (2012); Cahangirov et al. (2009). The novel properties of graphene arise from its band structure in which the valence and conduction bands meet at Dirac points ( and ) in the first Brillouin zone with a well-defined linear energy dispersion relation around these points: with and being the carrier momentum. The strong spin-orbit interaction in silicene along with the buckled structure induces a nonzero band gap, , of about a few meV. The buckled structure of silicene provides new possibility to establish a potential difference between sublattices A and B by applying an external out-of-plane electric field, . Interestingly, this feature allows tuning the band gap of silicene and discriminating between the different phases, topological insulator (TI), valley-spin polarized metal (VSPM) and band insulator (BI), which are clearly benefits over graphene.
Furthermore, for the biased silicene-like materials, some valley-dependent properties can be expected in the presence of an exchange field. Having the extra spin and valley degrees of freedom, makes silicene very rich in behavior. Silicene can be effectively used as a source of nearly 100% spin-polarized electronsTsai et al. (2013) and as a valley-selective spin filterZhai and Jin (2016); Wu and Meng (2015); Soodchomshom (2014). Moreover, silicene can probably be capable of being integrated into the current silicon-based electronics which makes it a promising material for future electronics applicationsTao et al. (2015).
Considerable progress in fabrication techniques has promised synthesis of double-layer 2D structures. A double-layer structure is composed of two parallel electron or hole gas systems which are kept in a close vicinity and coupled through the Coulomb interaction. This class of 2D structures demand special attention due to exciting many-body phenomena, such as the coupled collective excitations, Coulomb drag, fractional quantized Hall effectNarozhny and Levchenko (2016); Zheng and MacDonald (2012, 1993) and more, that they can display. The interlayer interaction accounts for unique effects in correlated double-layer systems which have been extensively investigated in double-layer GaAs-based quantum wells, double-layer graphene and double-layer phosphorene structuresSaberi-Pouya et al. (2016); Vazifehshenas and Salavati-fard (2015); Güven and Tanatar (1997); Gorbachev et al. (2012); Hwang and Das Sarma (2009); Peres et al. (2011); Suen et al. (1992); Kim et al. (2011); Flensberg and Hu (1995).
Plasmons, the collective excitations of an interacting electron or hole gas system, can be pictured as different modes of charge density oscillations. Plasmon branches are the central concepts of the rapidly developing field of plasmonics which deals with light-matter (photon-surface plasmon) interactions and their technologically significant consequences. The plasmonic dispersion relations which reveal the wave vector-dependent modes can be theoretically obtained from zeros of the dynamical dielectric function of the systemDas Sarma and Madhukar (1981); Vazifehshenas et al. (2010) and may be observed by inelastic light scattering spectroscopy, frequency domain far-infrared spectroscopy or inelastic electron scattering spectroscopyHwang and Das Sarma (2009). The well-behaved plasmon modes are lying outside the single-particle excitation (SPE) region, however, those modes entering this region experience the Landau damping.
The plasma oscillations of a single-layer silicene (SLS) have already been calculated both at zero temperature and finite temperature with and without a perpendicularly applied electric fieldWu et al. (2015); Tabert and Nicol (2014); Iurov et al. (2017a, b). It has been shown that, in an extrinsic SLS, the plasma oscillations follow a behavior in the long-wavelength limit at zero temperature for all values of electric field (i.e. all different phases). In addition, the location of the long-wavelength plasmon branch as a function of the applied electric field depends on the position of the Fermi energy with respect to the spin-split bands.Tabert and Nicol (2014); Chang et al. (2014) These results resemble those of single-layer graphene (SLG) and single-layer gapped graphene (SLGG) with and , respectively. Moreover, the presence of a small gap in SLGG and various combinations of two gaps in SLS leads to the splitting of the plasmon branch and the appearance of new undamped plasmon modes.Pyatkovskiy (2009); Iurov et al. (2017a) On the other hand, in the case of SLG, plasmons decay into particle-hole pairs in the interband portion of the SPE region, while for SLS both intra- and interband dampings can be occurred by tuning the external electric field. Tabert and Nicol (2014) The extrinsic (doped) finite-temperature plasmons of SLS have also been studied: as temperature increases from , the plasmon energy first lowers, reaching to a minimum value and then bounces back in both cases of SLS and SLGG.Iurov et al. (2017b); Patel et al. (2015)
Similar calculations were performed at zero temperature when both electric and magnetic (exchange) fields were appliedVan Duppen et al. (2014). It is worth pointing out that an exchange field can be induced by positioning ferromagnetic adatoms Qiao et al. (2010) on the surface or by employing a ferromagnetic substrate Haugen et al. (2008); Yokoyama (2014). In the presence of these fields, the SPE region is given a spin-valley texture which results in the spin-polarized plasmons with zero but finite exchange field, and valley-spin-polarized plasmons when both fields are finite. However, it was mentioned that the magnetic field strongly affected the plasmon branch intensity such that it was unlikely to be experimentally observable. Also, the typical behavior of long-wavelength plasmons in 2D systems was preserved when the magnetic field was turned on. For shorter wavelengths, although the plasmon dispersion looked different in the presence of a strong magnetic field, it was still possible to tune plasmons to display an approximate behaviorVan Duppen et al. (2014). In a recent work, the plasmon-phonon coupling in a valley-spin polarized SLS was investigated and the dispersion relations of hybrid modes were discussedMirzaei et al. (2018).
Plasma oscillations have also been studied in a doped double-layer graphene both at zero Stauber and Gómez-Santos (2012); Profumo et al. (2012); Gumbs et al. (2016); Hwang and Das Sarma (2009); Hwang and Das Sarma (2007); Das Sarma and Hwang (2009) and finite Vazifehshenas et al. (2010); Van Tuan and Khanh (2013); Badalyan and Peeters (2012) temperatures within the so-called random phase approximation (RPA). At zero temperature and in the limit of small wave vectors, the plasmon dispersion of the in-phase (optical) branch obeys the relation and is independent of the interlayer separation, . On the other hand, the out-of-phase (acoustic) branch has a dispersion and depends upon layer distance as . This long-wavelength behavior of plasmons is identical to that of the conventional double-layer 2D electron gas despite of different dependence on the electron density. Moreover, the plasmonic dispersion for larger wave vectors calculated within the RPA for both systems differs from one another.Hwang and Das Sarma (2009); Hwang and Das Sarma (2007); Das Sarma and Hwang (2009) At finite temperature, the frequency of the acoustic mode decreases down to and then increases afterwards. However, the slope of the growth/decline highly depends upon the value of the wave vector. The variation of optical mode energy with temperature is not uniform; it is fair to say that at low wave vectors, the optical branch mimics the behavior of the acoustic branch while at large wave vectors, the frequency of this branch generally increases with increasing temperature.Vazifehshenas et al. (2010); Van Tuan and Khanh (2013)
In this paper, we consider an n-doped double-layer silicene (DLS) system in which two parallel single layers of silicene are placed in a dielectric environment at a distance from one another which is short enough to make an effective interaction between them but far enough to guarantee that there will be no electron tunneling. We investigate the effect of temperature on both plasmon branches with and without the presence of a perpendicular electric field within different regimes. We also study the dependence of the plasmon frequencies on the interlayer distance.
II Theory
II.1 Low-Energy Hamiltonian
Focusing on low-energy phenomena, the effective Hamiltonian of a buckled honeycomb structure with an effective intrinsic spin-orbit coupling (SOC) strength ( throughout this paper), in the presence of a perpendicular electric field, around the Dirac point , is given by:Kane and Mele (2005); Ezawa (2013); Liu et al. (2011)
| (1) |
Where distinguishes the two inequivalent valleys with representing point. is the 2D wave vector measured relative to the Dirac points. and are Pauli matrices corresponding to (sublattice) pseudospin (written in A-B basis) and the real spin of the system, respectively. They are given as:
| (2) |
Further, is the Fermi velocity of the electrons, reported to be m/s for siliceneEzawa (2012). Finally shows the on-site potential difference between the two sublattices. This low-energy model works quite well for energies between -800 and +800 meVEzawa (2012).
The effects of intrinsic Rashba SOC and electric field induced Rashba SOC are not considerable Van Duppen et al. (2014) and are neglected in the Hamiltonian 1. Consequently, spin states are decoupled and the eigenvalues obtained from 1 are labeled by valley () and spin () indexes:
| (3) |
Where, and indexes over the conduction (particle) and valence (hole) bands, respectively. It is also helpful to introduce and . As it can be seen from the above equation, in the absence of an external electric field, there exists a band gap of . When is turned on and (TI regime), the bands become spin-split, representing two energy gaps determined by and . At (VSPM regime), the lower band gap closes, however, by further increase of , it opens up again (BI regime).
II.2 Collective Excitations
For a double-layer system, the location of the undamped plasmon collective modes, in the space, is determined by the zeros of the dielectric tensor, generalized from the single-layer dynamical dielectric function Das Sarma and Madhukar (1981). For systems with high electron density it is reasonable to employ the RPA to calculate the dielectric tensor Vazifehshenas et al. (2010). In this approach, the aforementioned tensor is given by Das Sarma and Madhukar (1981); Hwang and Das Sarma (2009)
| (4) |
where and specify the two layers, is the Fourier component of the bare 2D Coulomb interaction between electrons in layers and and is the non-interacting dynamical polarization function associated with th layer. For a double-layer system consisting of two identical layers separated by a distance we have (intralayer interaction) and (interlayer interaction) Das Sarma and Madhukar (1981) in which is the effective fine structure constant, expressed as with being the effective background dielectric constant (throughout this paper we set which corresponds to ). Finally, is given byPyatkovskiy (2009):
| (5) |
Here, is the Fermi-Dirac distribution function with being the chemical potential which equals to the Fermi energy at . It is important to notice that the upper limit of integration over is restricted by the low-energy condition. Hence, in the case of identical layers, the plasmon modes can be obtained from the zeros of following relation
| (6) |
The dynamical dielectric function is generally a complex function of such that explicitly has a positive imaginary part which guarantees the dynamical physical functions to be retarded. For undamped plasmon excitations in the space, both real ( and imaginary () parts of dielectric function are equal to zero. However, there can be points where but which indicates the existence of collective modes at these points but with a finite lifetime due to the nonzero value of . These types of plasmons decay into particle-hole excitation states. For those points of the plane where , the single-particle excitations (SPE) are possible, i.e. a photon with a wave vector and frequency can excite a particle-hole pair in the system. These regions in the space are called SPE spectrum; any collective mode presents in SPE will eventually decay (known as the Landau damping). SPE spectrum can be studied as two separate regions corresponding to the inter- and intra-band pair-creation excitations.
At and in the limit of low energies and momenta, the non-interacting polarization function of Eq. (5) has the following analytical form:Pyatkovskiy (2009); Chang et al. (2014); Van Duppen et al. (2014)
| (7) |
For , Eqs. (6) and (7) give the corresponding plasmon frequencies as:
| (8) | ||||
| (9) |
where , , , , are all dimensionless parameters.
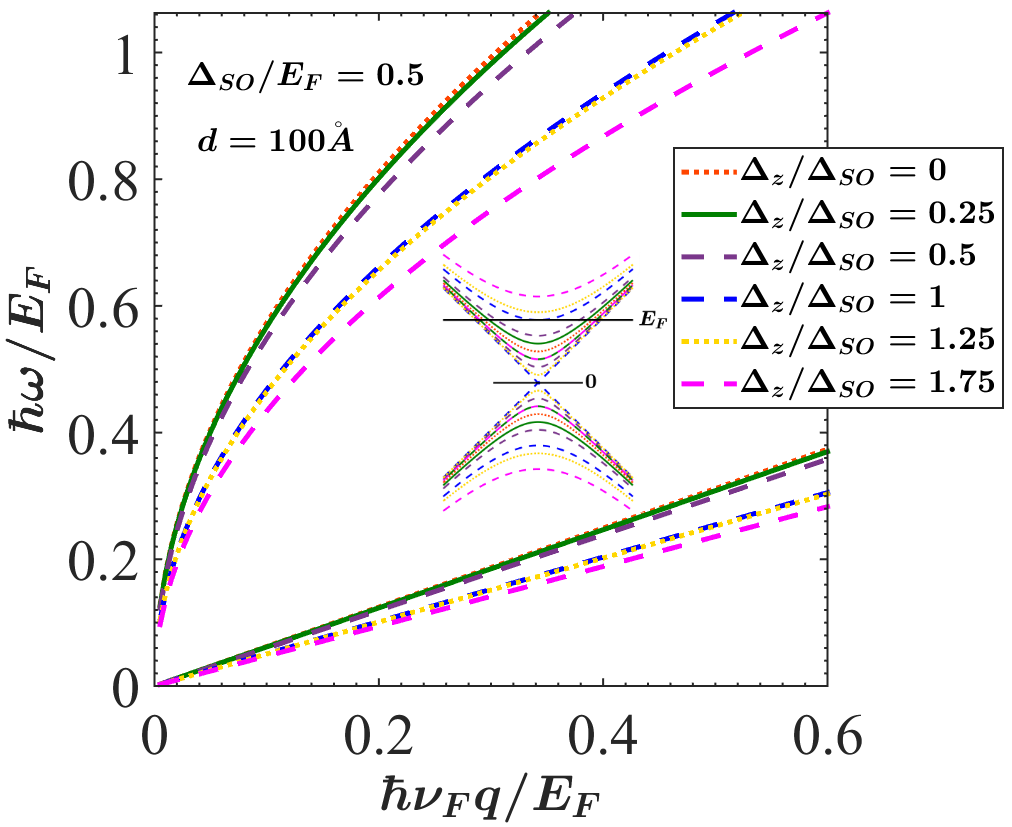
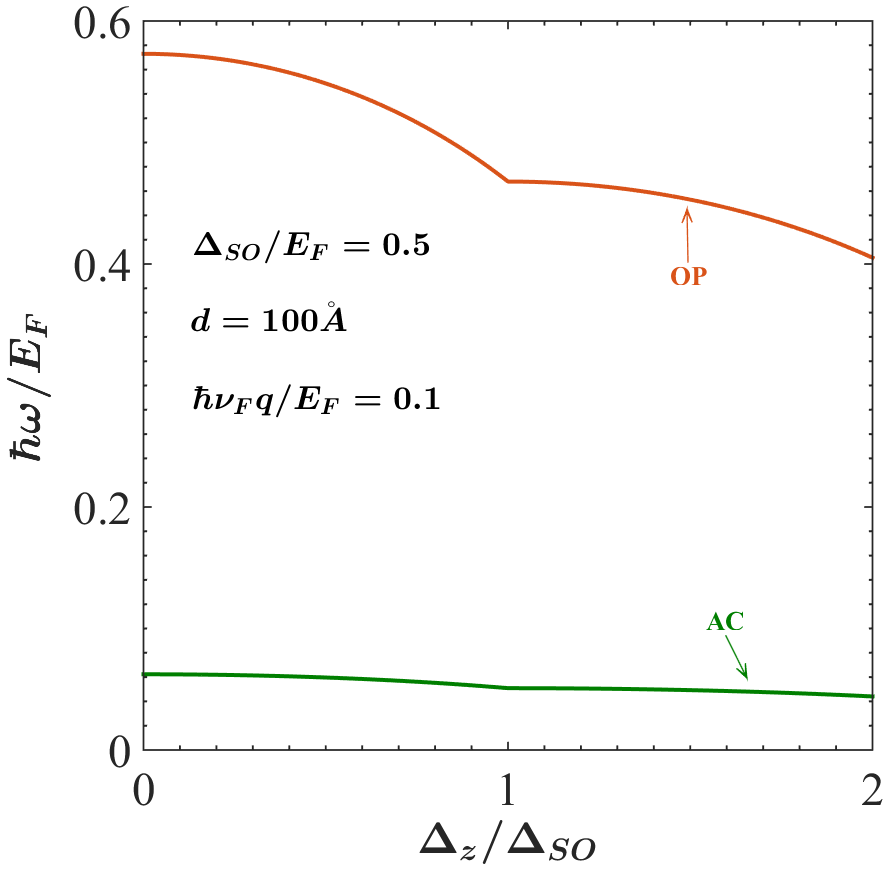
Eqs. (8) and (9) reproduce the well-known behavior of plasmons in a double-layer system Hwang and Das Sarma (2009) which is shown in Fig. 1 for , and varying . The linear (non-linear) branch corresponds to the acoustic (optical) plasmon modes. Here, the Fermi energy sits above both gaps in the TI regime () and only above the lower gap in the BI regime (). For the latter, Eqs. (8) and (9) show that the plasmon dispersion depends only on the lower band gap and the upper band gap plays no role. For this given configuration, the frequencies of both branches decrease as the potential difference increases. However, Fig. 2 shows a discontinuity in the dispersion relations of both branches (which is more pronounced for the optical branch) as the system transitions from TI to BI through the VSPM phase ().
III Results and discussion
The spectral weight associated to a particular plasmon mode is directly proportional to and is known as the loss function. This quantity which can be measured experimentally (e.g. in inelastic electron scattering experiments), gives a measure of the absorption of radiation and is an indication of the plasmon creation in the system. Thus, the loss function in the space provides us with branches (poles of the loss function), which identifies both damped and undamped plasmons. In fact, the long-lived plasmons (those are outside the SPE regions), are -function peaks of the loss function, while the damped plasmons (those are inside SPE regions), correspond to the broadened peaks of the loss function Hwang and Das Sarma (2009).
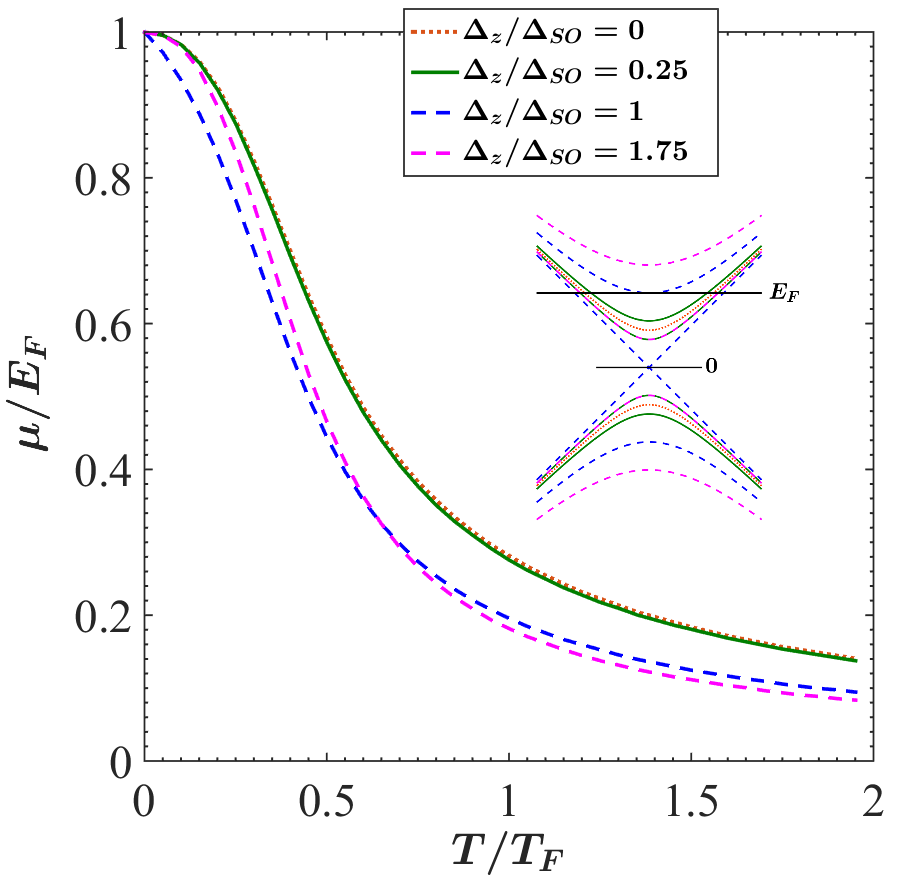
In this section, we first study the effect of temperature and band gap variations on the SPE regions. In this respect, we need to numerically calculate Eq. (5). Note that, for , the effect of temperature on the chemical potential, , must be taken into account. This can be done by assuming that the number of carriers of the system is fixed, and changes, accordingly. Fig. 3 demonstrates the dependence of on calculated by using numerical methods for and different values of .
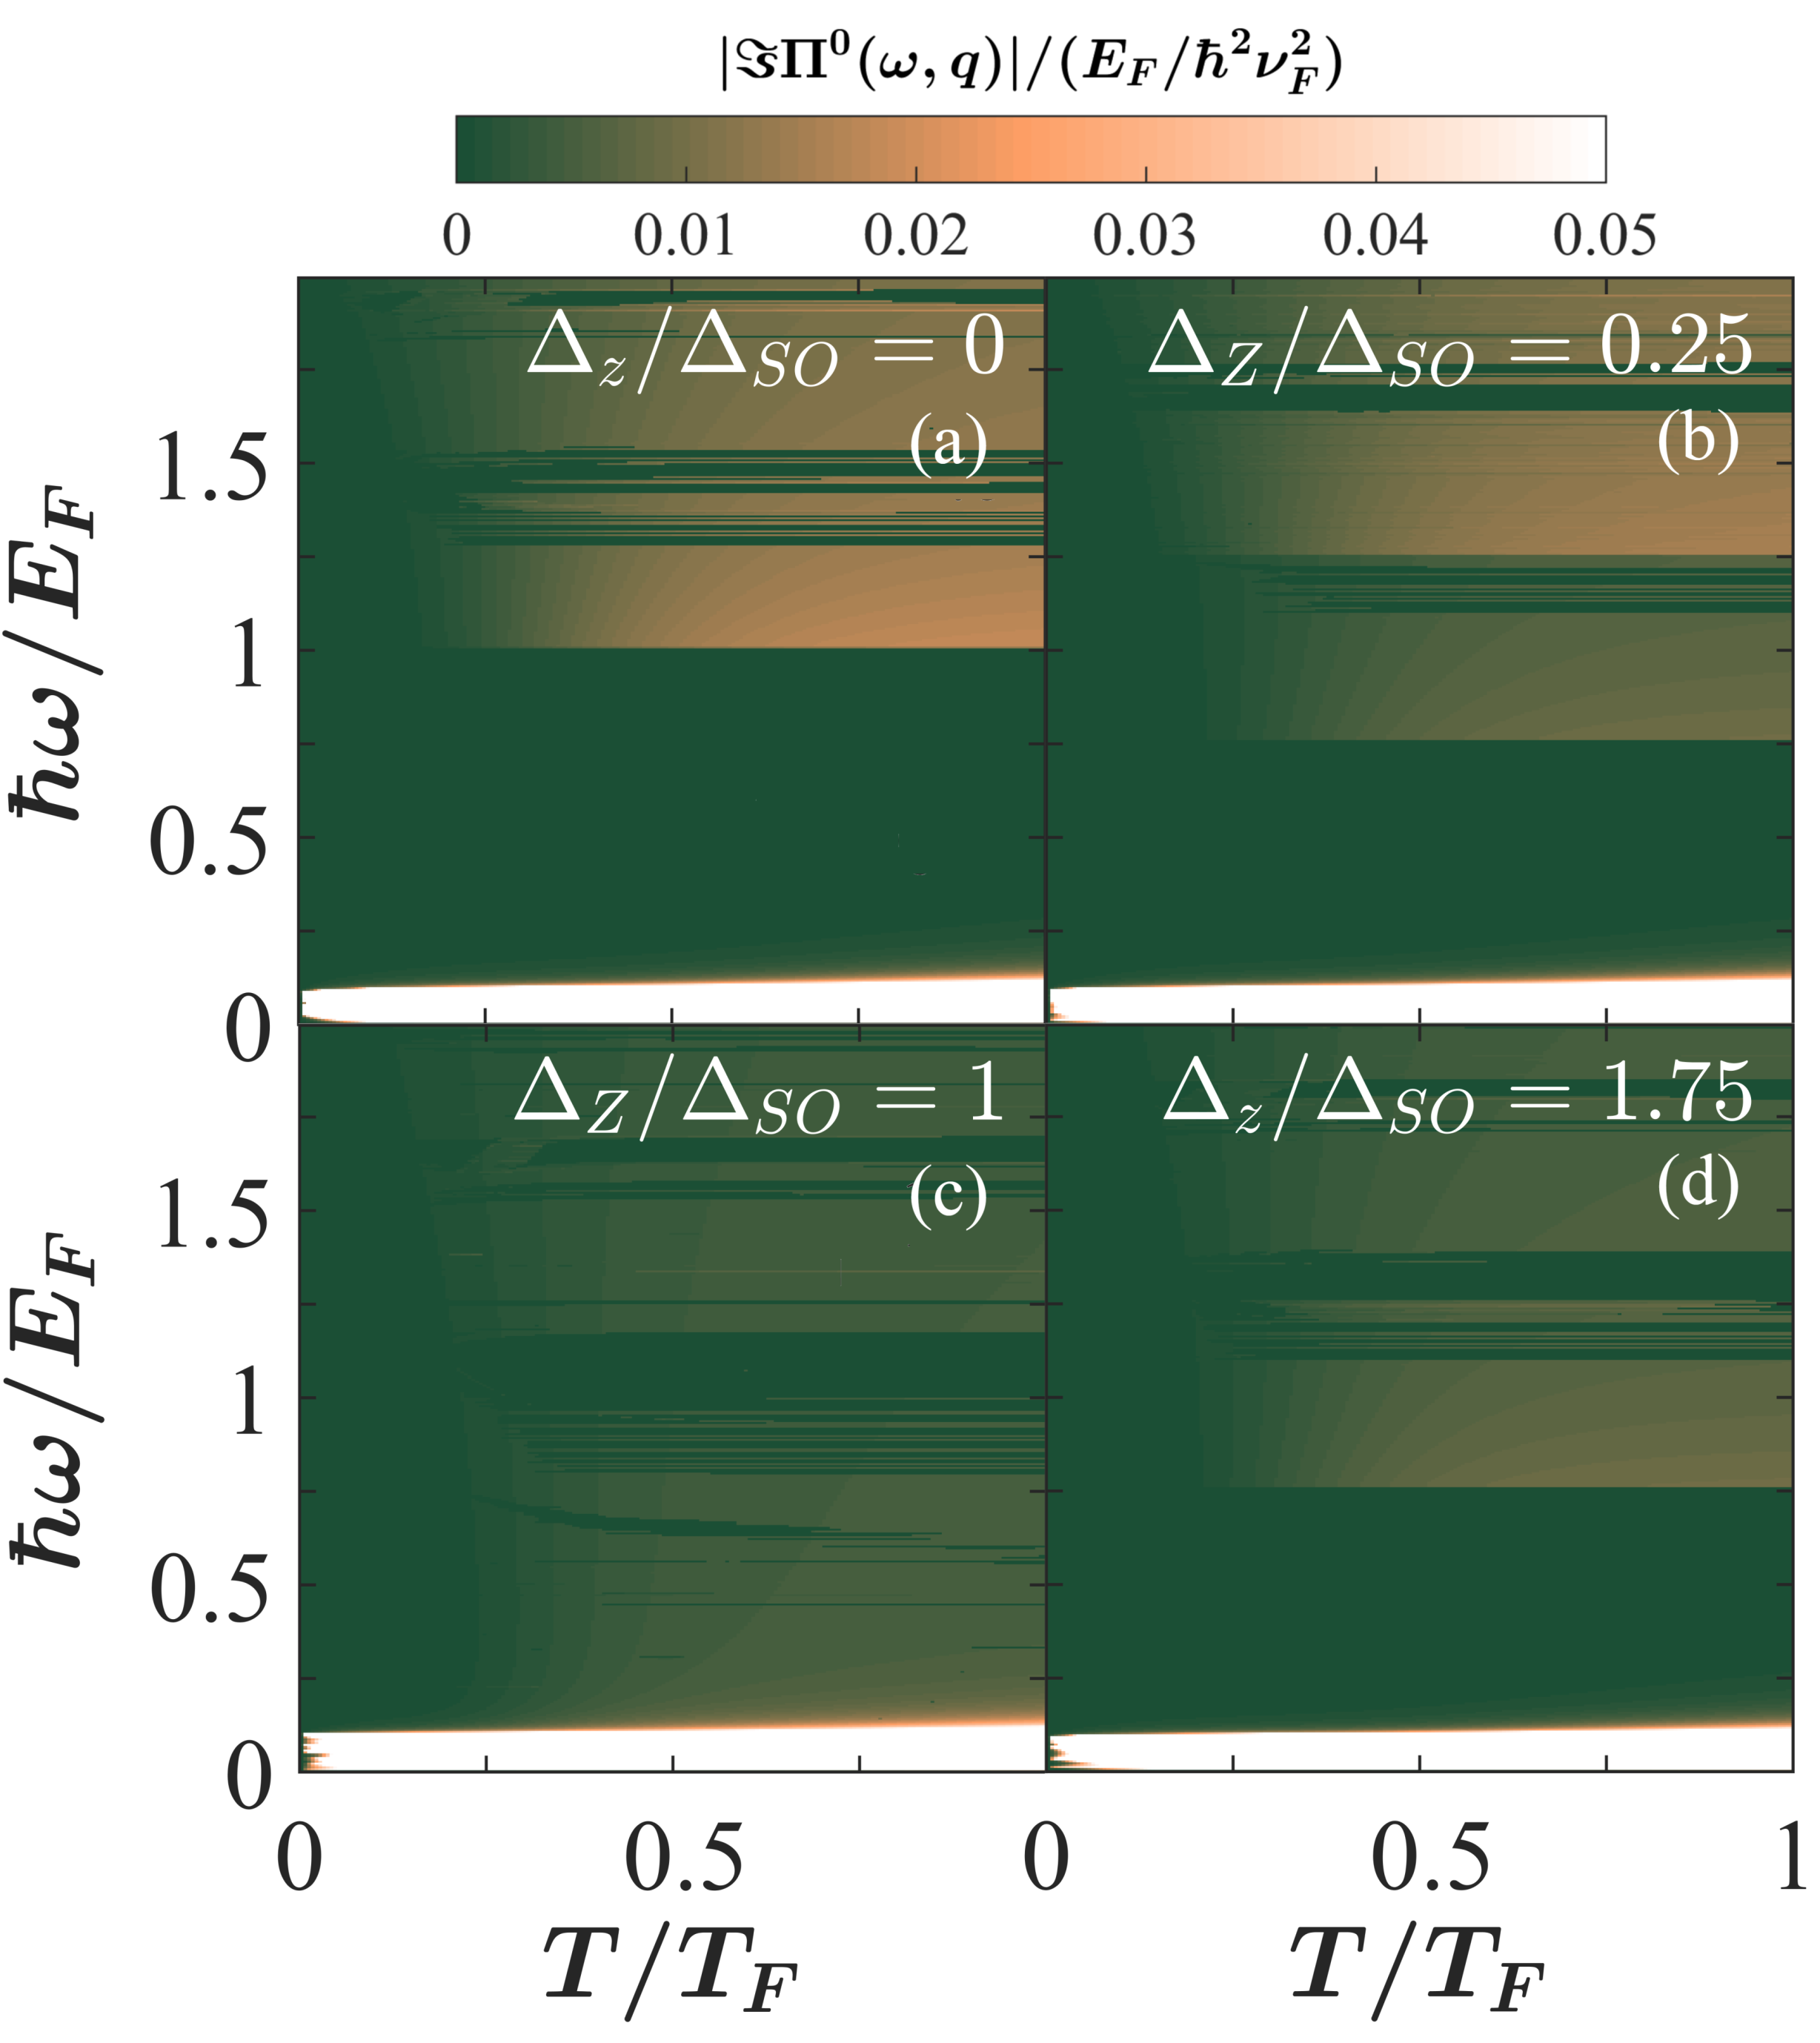
To investigate the SPE regions in silicene, we plot the imaginary part of the dynamical polarization function for at and , respectively (see Figs. 4 and 5). The layers are apart by (this value is used for the rest of calculations, as well) and the applied electric field varies and .
The SPEInter and SPEIntra regions are above and below the line, respectively. The SPE boundaries are determined analytically at Tabert and Nicol (2014), whereas at finite temperature, they can be expressed approximately as:
| (10) |
At a given , determines the threshold energy for onset of an interband pair excitation, while () gives us the maximum (minimum) allowed energy transfer in an intraband transition. The zero- and finite-temperature SPE boundaries are displayed in Fig. 4 by the solid blue and dotted magenta curves, respectively for four different values of applied electric field. As Figs. 4(a) and 5(a) show at the SPE region is gapped and formation of undamped plasmons is possible in the system. When (Figs. 4(b-d) and Figs. 5(b-d)), the band structure is spin-split and polarization function can be interpreted as the summation of two gapped subsystems with band gaps and Tabert and Nicol (2014). So, similar to case Tabert and Nicol (2014); Van Duppen et al. (2014), SPEInter region is divided into two parts such that the lower (upper) boundary corresponds to . With increasing , SPE boundary moves toward the line while the other one moves away. Furthermore, the intraband boundary, which is located slightly below the line, moves toward the line very slowly as increases. Thus the SPE gap becomes smaller. This pattern continues until , where the lower boundary of SPEInter and the SPEIntra boundary meet approximately at the line resulting in closure of the SPE gap as it is shown in Figs. 4(c) and 5(c). Consequently, at the possibility of undamped plasmon formation is negligible (except for small , and as it will be shown later). Fiqs. 4(d) and 5(d) show that as grows beyond the , the SPE gap opens again: the SPEInter and SPEIntra boundaries both move away from the line. Comparing Figs. 4 and 5 suggests that when the temperature increases from to , similar to the case of SLGG at finite temperature (Patel et al., 2015), the boundaries are changed only slightly such that the extent of SPE gap decreases by temperature very slowly; this can be explained by the fact that single-particle transitions are more probable at higher temperaturesPatel et al. (2015).
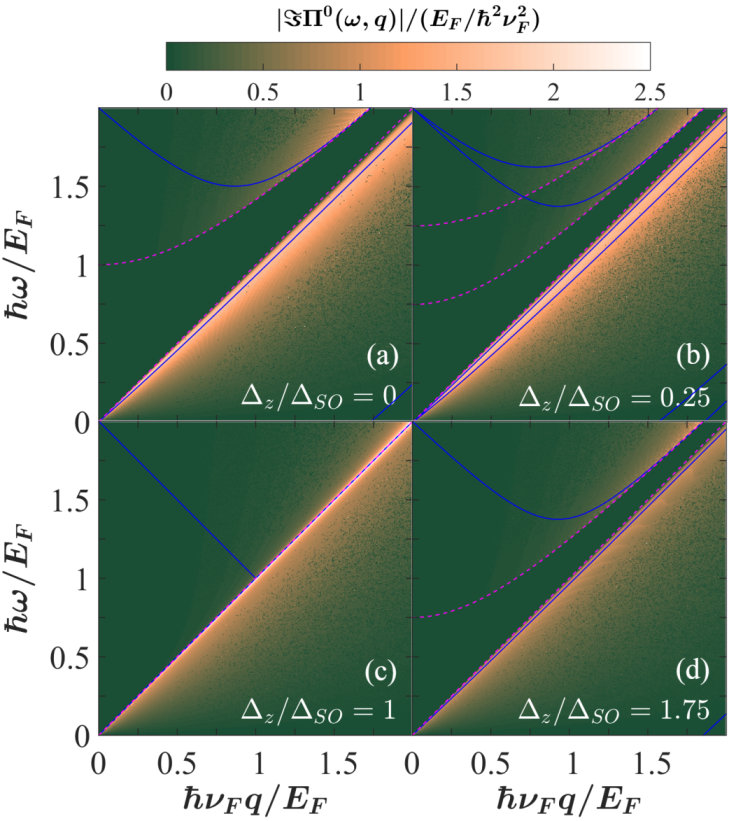
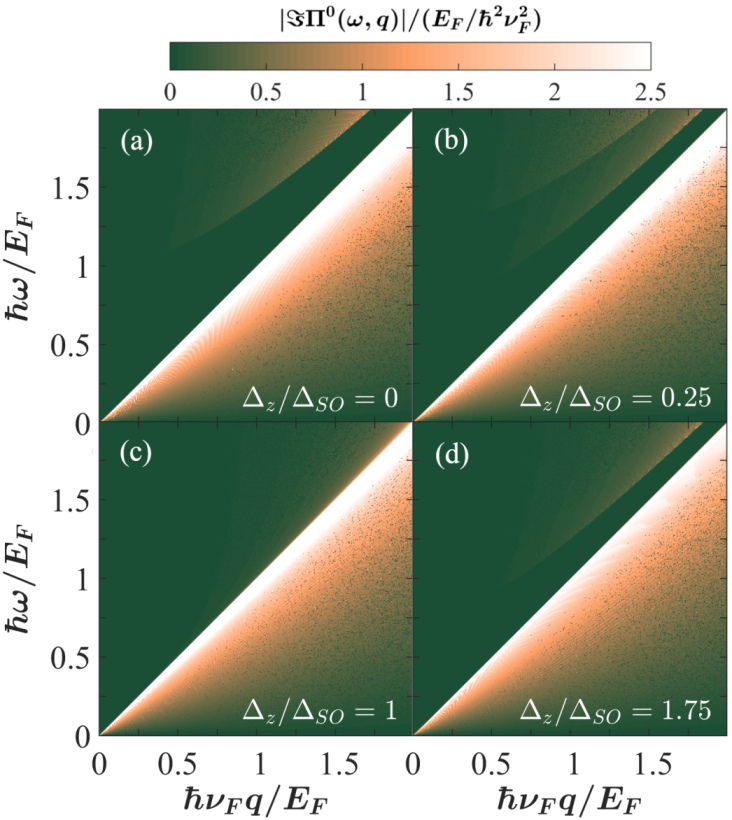
Moreover, in panels (a,b,d) of Figs. 4 and 5, the interband boundaries are not discernible before but for values after that, that seems to be consistent with Eq. (LABEL:Boundary) and the intraband SPE boundary shows consistency with this equation, as well. For Panels c where , Eq. (LABEL:Boundary) implies that the interband () and intraband boundaries lie along line suggesting there is no SPE gap available for long-lived plasmons. This point will be discussed later on.
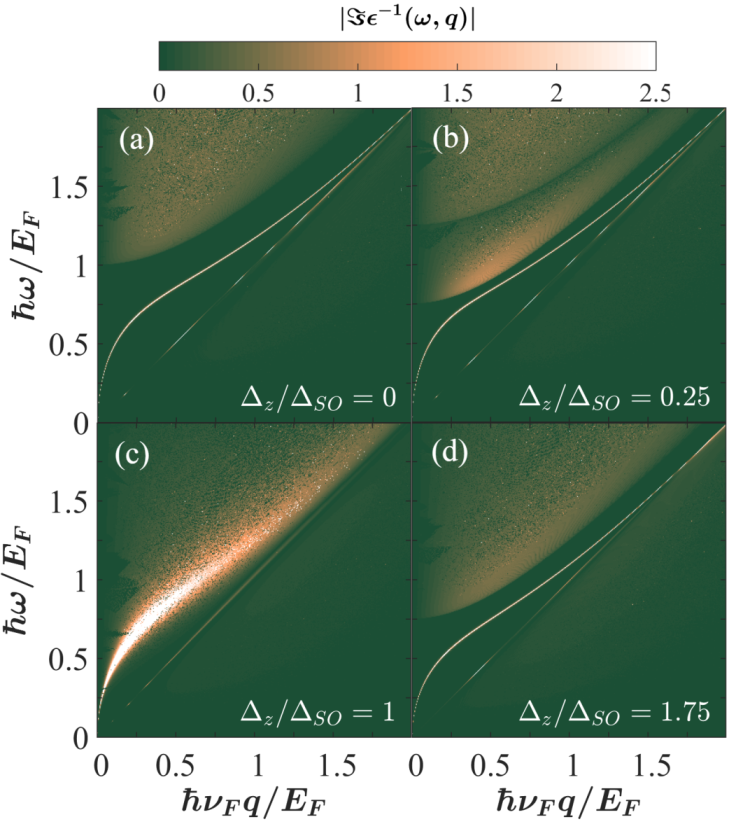
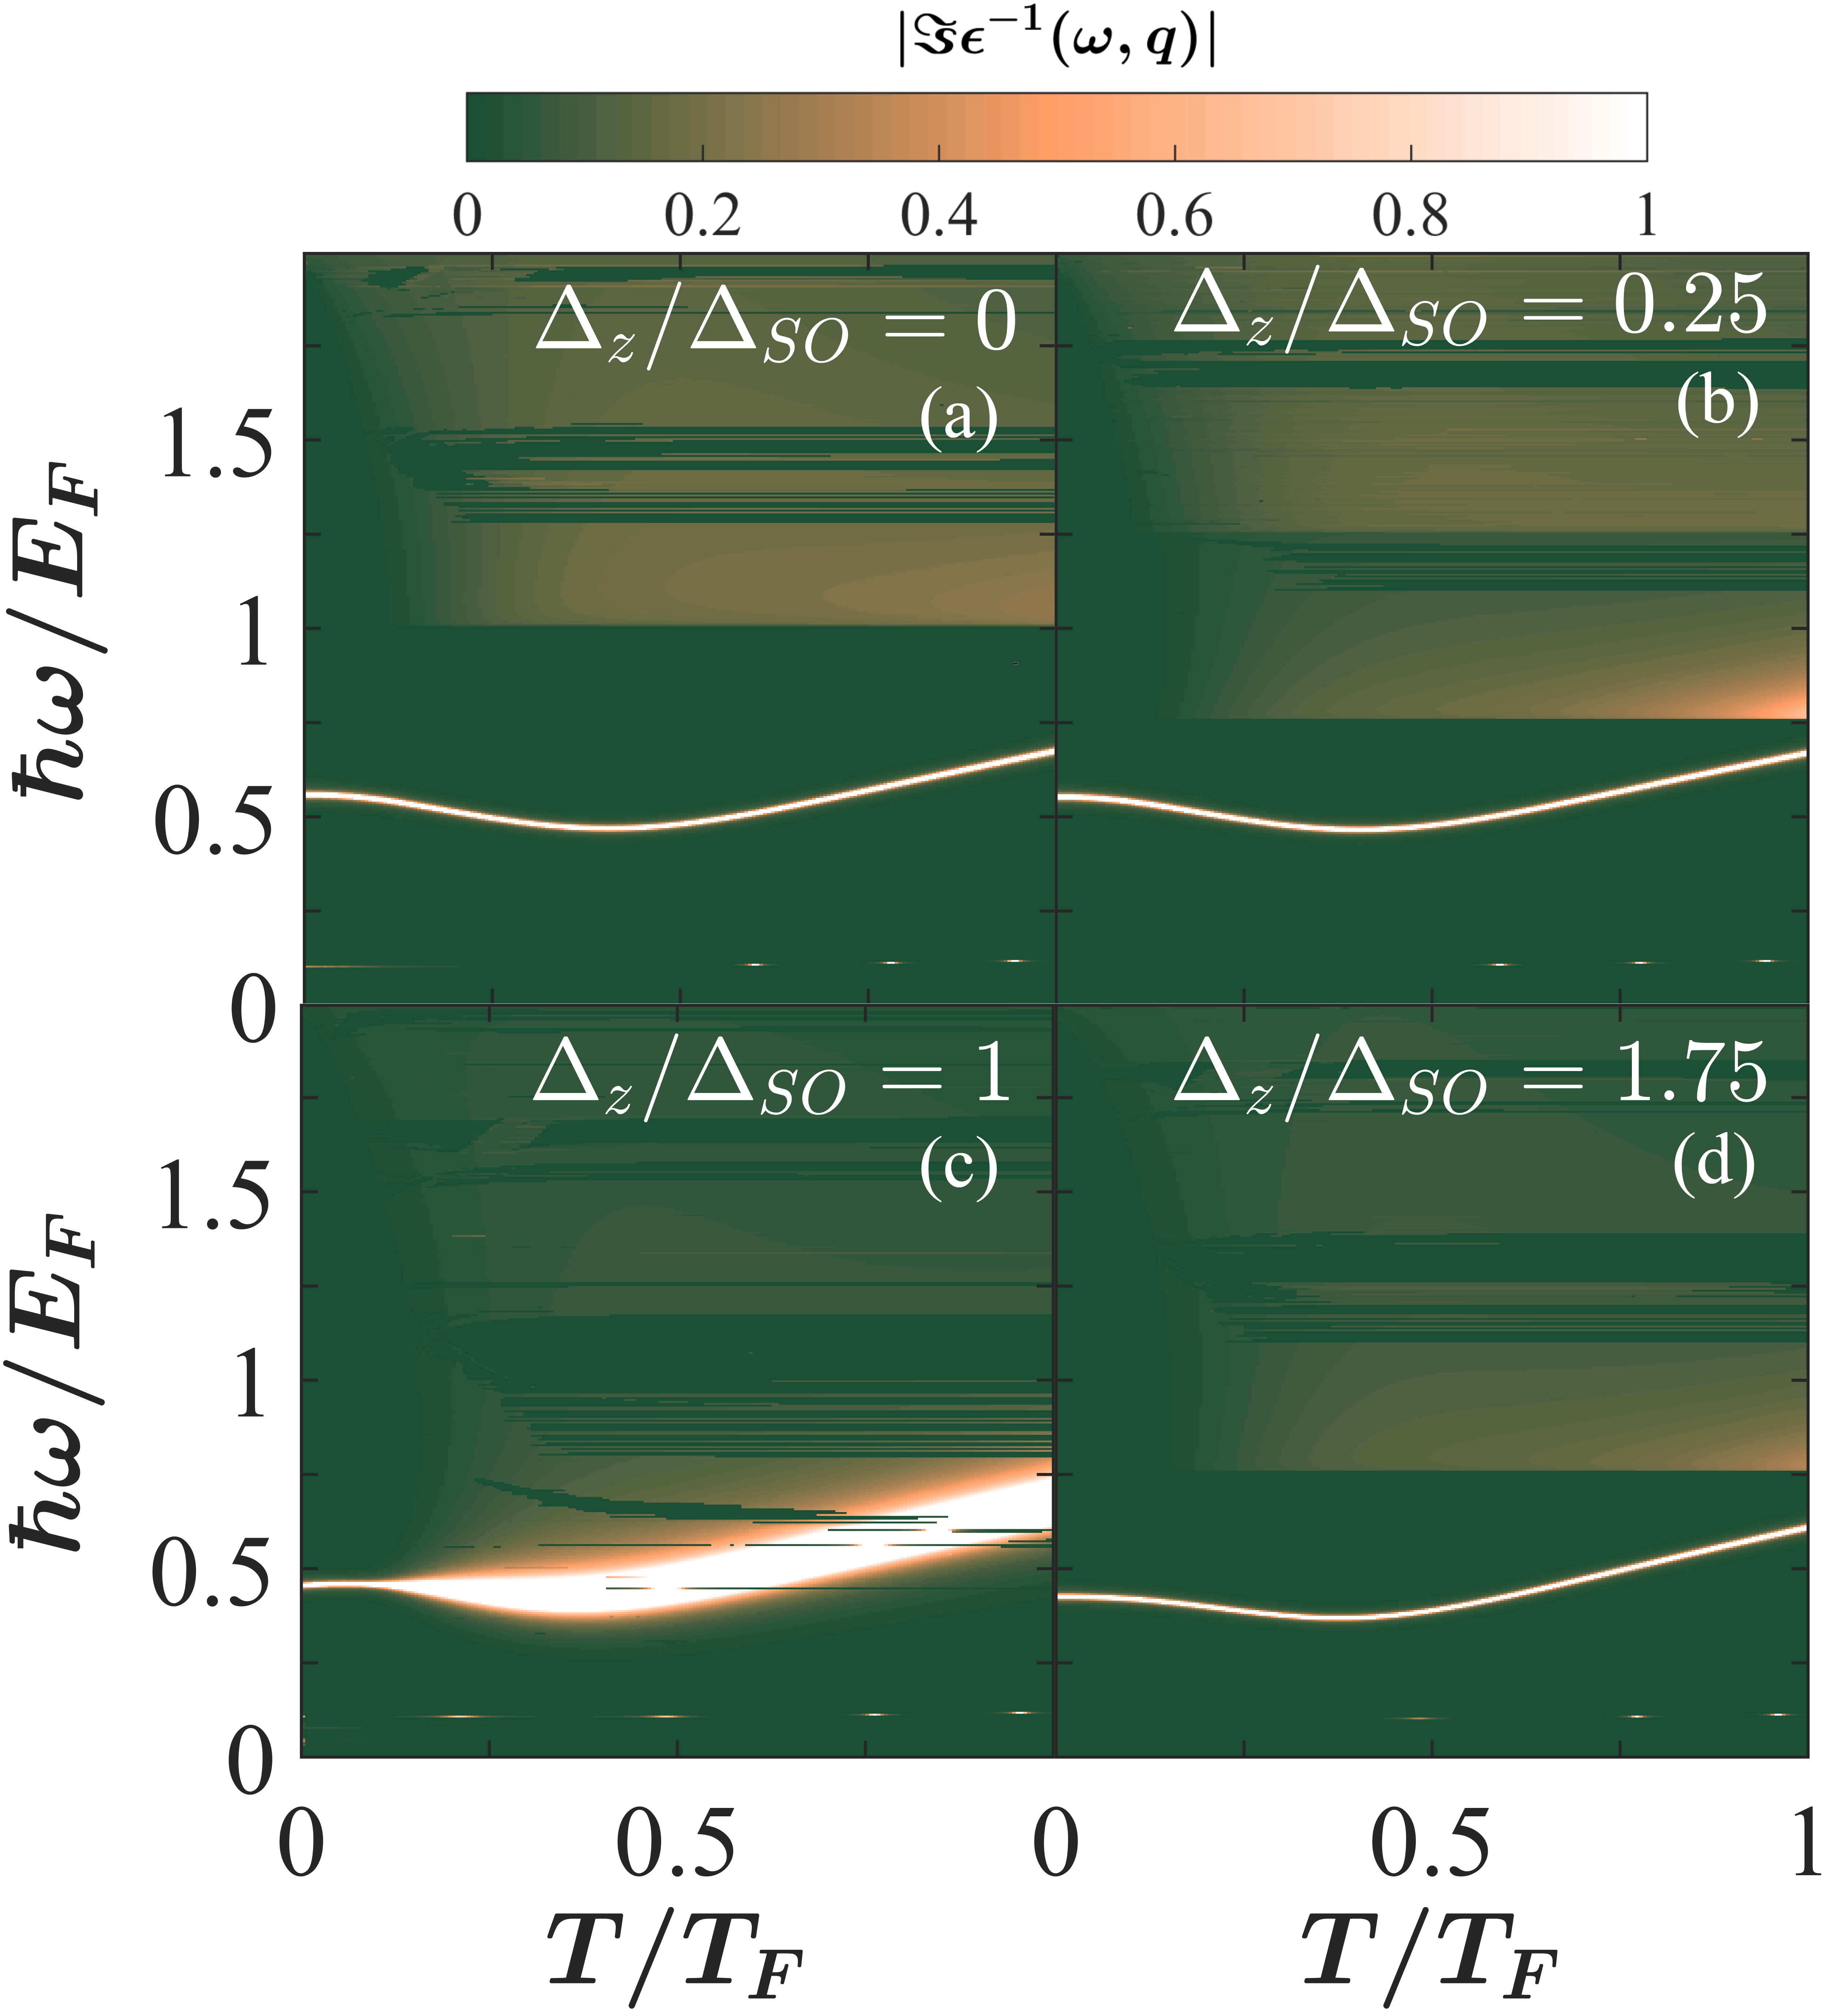
In order to study the behavior of the finite-temperature plasmonic dispersion in a DLS, we numerically calculate and plot the temperature-dependent DLS loss function, , in the space, for several parameters that affect the band structure. In Fig. 6, the loss function is plotted at for the same parameters as in Fig. 4. As this figure shows, the undamped acoustic and optical plasmon modes exist in the SPE gap for and with the acoustic branches having very weak intensity. For , on the other hand, the acoustic and optical branches are broadened for most values of displayed here. Since the SPE gap is almost closed and consequently, the plasmons are damped, there exist narrower peaks only for small ’s indicating the undamped plasmons.
for the same parameters as Fig. 6 but at is depicted in Fig. 7 where the emergence of new optical modes can be observed. When (panel (a)), there is only one (undamped) optical branch. However, for (panel (b)) and (panel (d)) where both band gaps of silicene layers are nonzero, a new undamped optical branch is observed in the vicinity of the SPE’s boundary at higher values of . Moreover, a new damped mode appears in the weaker damping region of SPE continuum which is not extended from the undamped branch, continuously. Such splitting is not obtained for the acoustic branch. At (panel (c)), we see a similar trend for both branches as observed in Fig. 6(c). However, the branches are generally more broadened because the electron-hole pair excitations are facilitated by increasing temperature.
Plots of the analytical zero-temperature loss function for the same parameters used for Fig. 6 are shown in Fig. 8. The results resemble those in Fig. 6 except for (VSPM phase) where the undamped optical plasmons are present for a wider range of wave vectors.
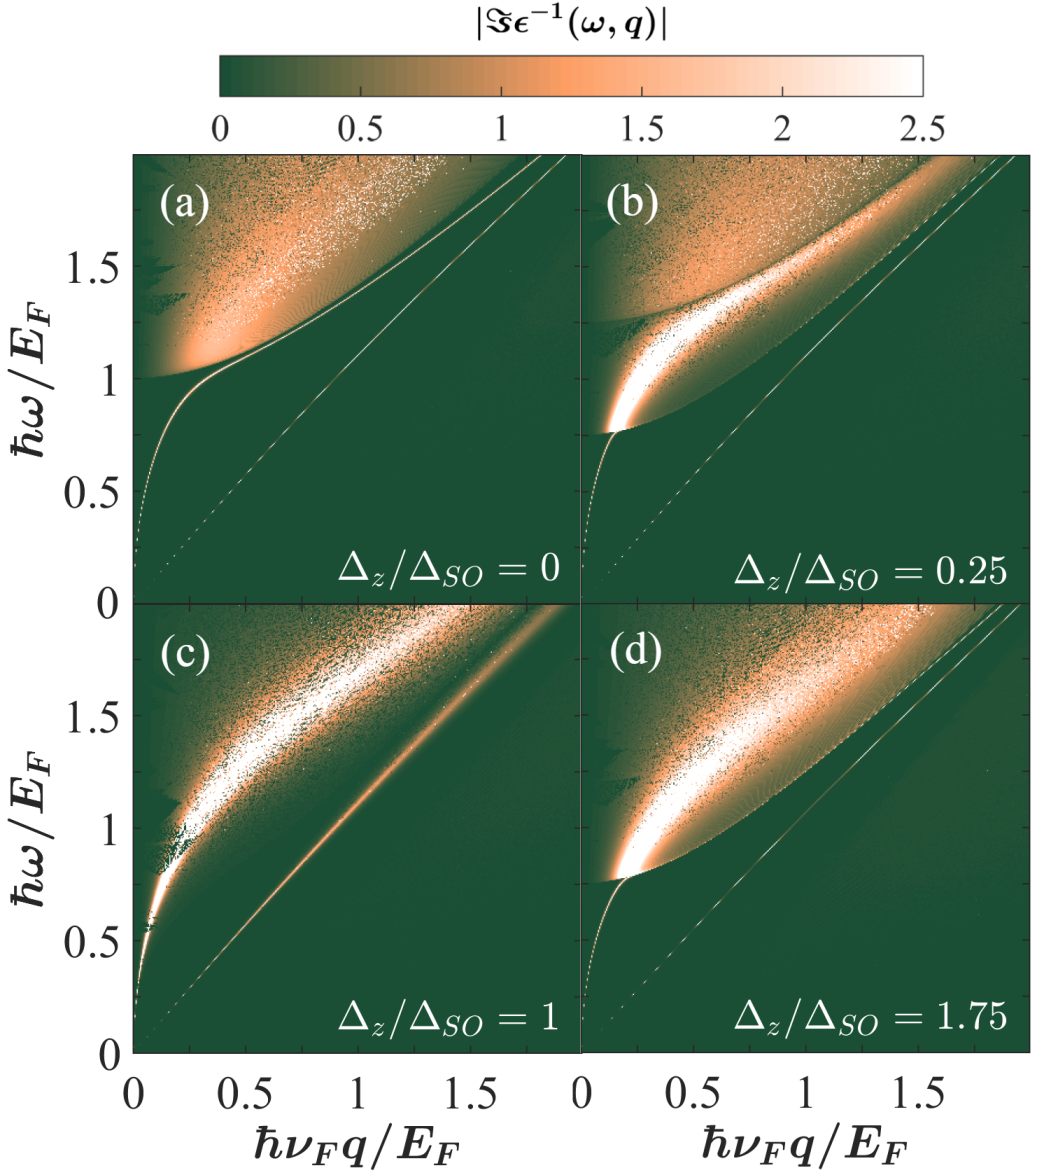
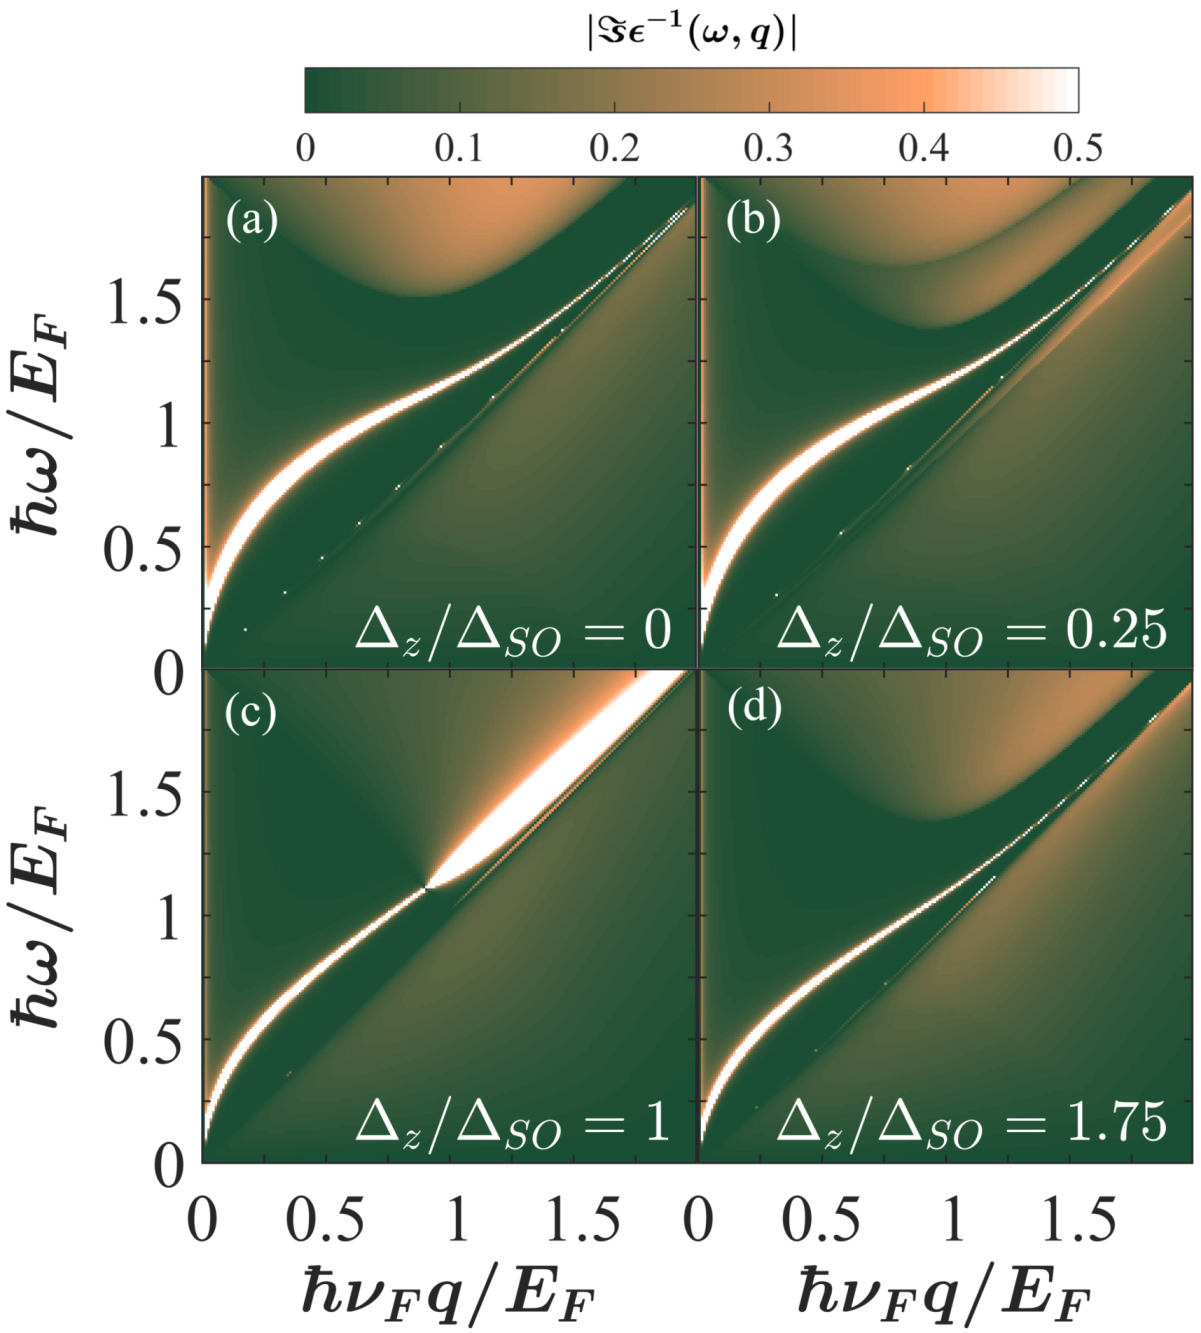
Fig. 9 illustrates the DLS loss function, , over the plane, at a given , for different valuse of and with . The upper and lower pronounced branches correspond to the optical and acoustic modes, respectively. Fig. 10 displays the extent of the SPE boundaries for the same parameters. As it can be observed from these figures, the optical branches are positioned in the SPE gap and, therefore, remain undamped for all presented values of , except for the VSPM phase. Furthermore, the frequency of the optical branch decreases with increasing temperature and reaches a minimum value around but after that it bounces off at higher temperatures. The behavior of optical plasmons for this studied DLS is similar to the plasmon dispersion of SLGG where the plasmon frequencies follow first a decreasing and then an increasing trend with a minimum at for all band gap values Patel et al. (2015) and similar to the double-layer graphene at small wave vectorsVan Tuan and Khanh (2013). Recently, it has been shown that the temperature-dependent plasmons of SLS, SLG and single-layer n-doped and p-doped molybdenum disulfide can also exhibit such a behavior. Iurov et al. (2017a)
In Fig. 9(c), for , the optical branch follows a similar temperature trend as the other phases, but Fig. 10(c) shows that there is almost no gap left for the undamped plamons to reside. However, for and low temperatures, SPEInter boundary sits higher than the approximate interband SPE boundary. Thus, as can be seen, for , the optical branch has a well-defined delta function-like peak which is a characteristic of undamped plasmons. Beyond this temperature, however, the peak is extremely broadened which indicates damping of plasmons at higher temperatures. Moreover, Fig. 9 demonstrates the fact that the spectral weight of acoustic mode is insignificant compared to that of optical mode; this is an obstacle in experimentally observing the acoustic mode. Applying a more distinguishing color limit to all panels of Fig. 9, reveals that the acoustic branches located in close proximity of SPEIntra boundary, grow negligibly with temperature which may not be of experimental significance. This figure also displays that as temperature rises, the interband boundary changes a bit where the intraband boundary moves slightly to higher frequencies.
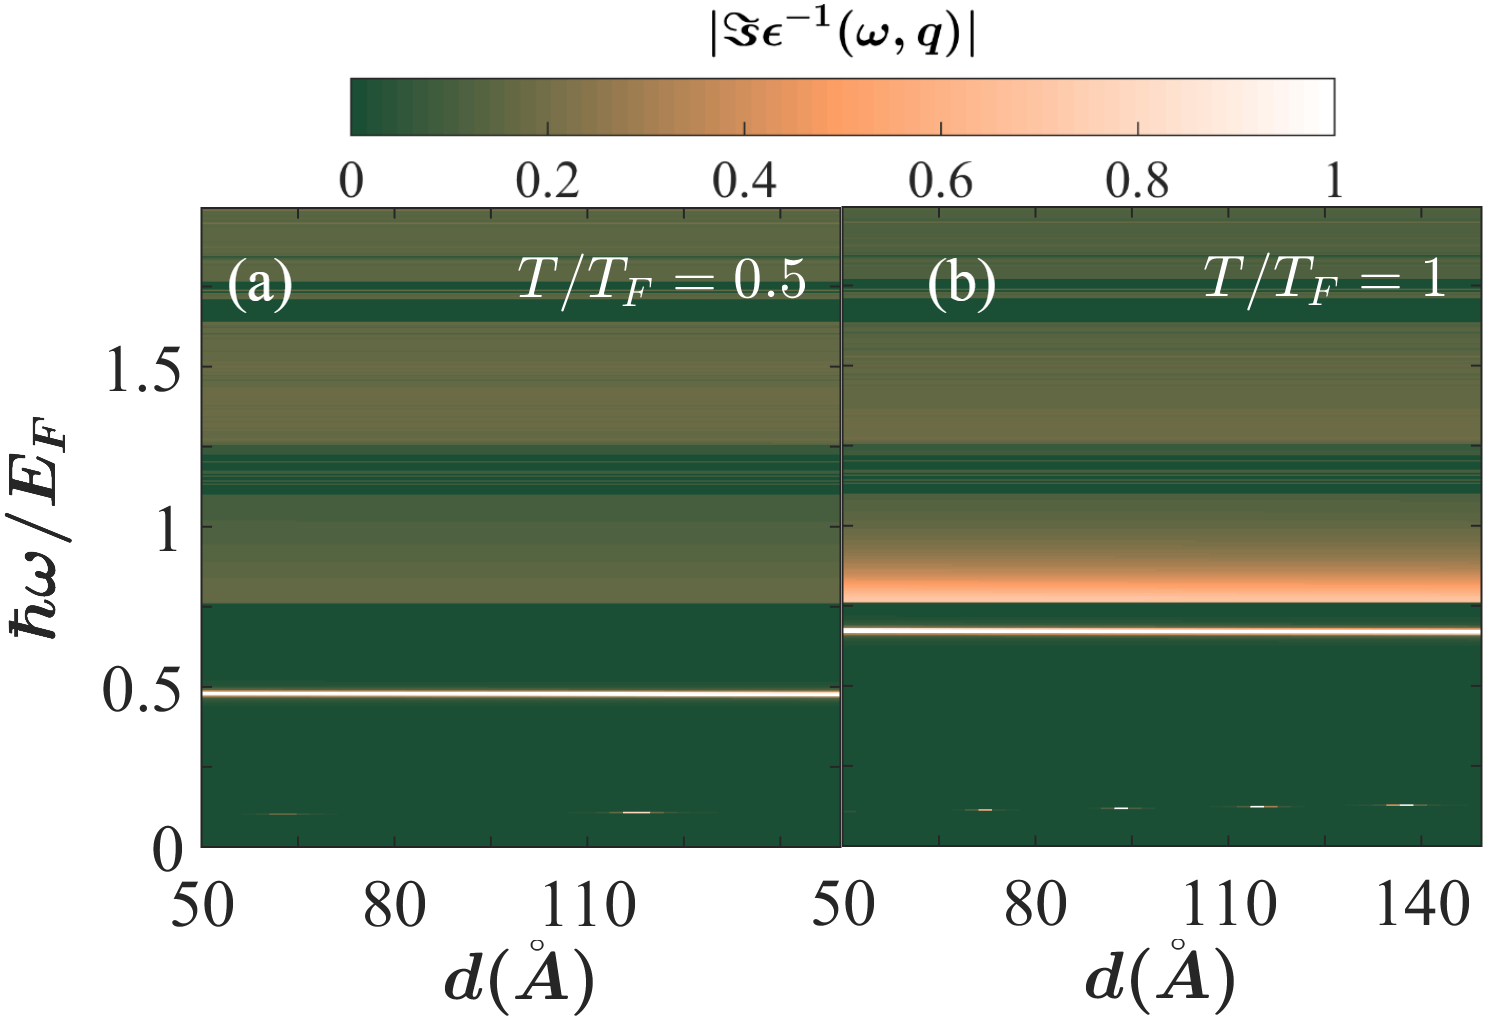
To investigate the effect of spatial separation between two layers on the DLS plasma oscillation modes, we plot in the plane at for and in Fig. 11 at two different temperatures, and . The interlayer separation varies from 50 Å up to 150 Å in this figure. As demonstrated, for all the presented separation values at both temperatures, the undamped acoustic and optical modes exist (with a very weak acoustic mode spectral weight). Fig. 11 suggests that, the finite-temperature optical modes are not affected by changing the spatial separation between the layers, similar to the zero-temperature case. On the other hand, applying a more distinguishing colormap displays that the frequency of acoustic plasmons increases slightly with for both temperatures such that dispersion has a slightly higher slope. This growth, is also observed at which is evident from the d-dependence of Eq. (9). Our results here may not be easily observed in experiment, though.
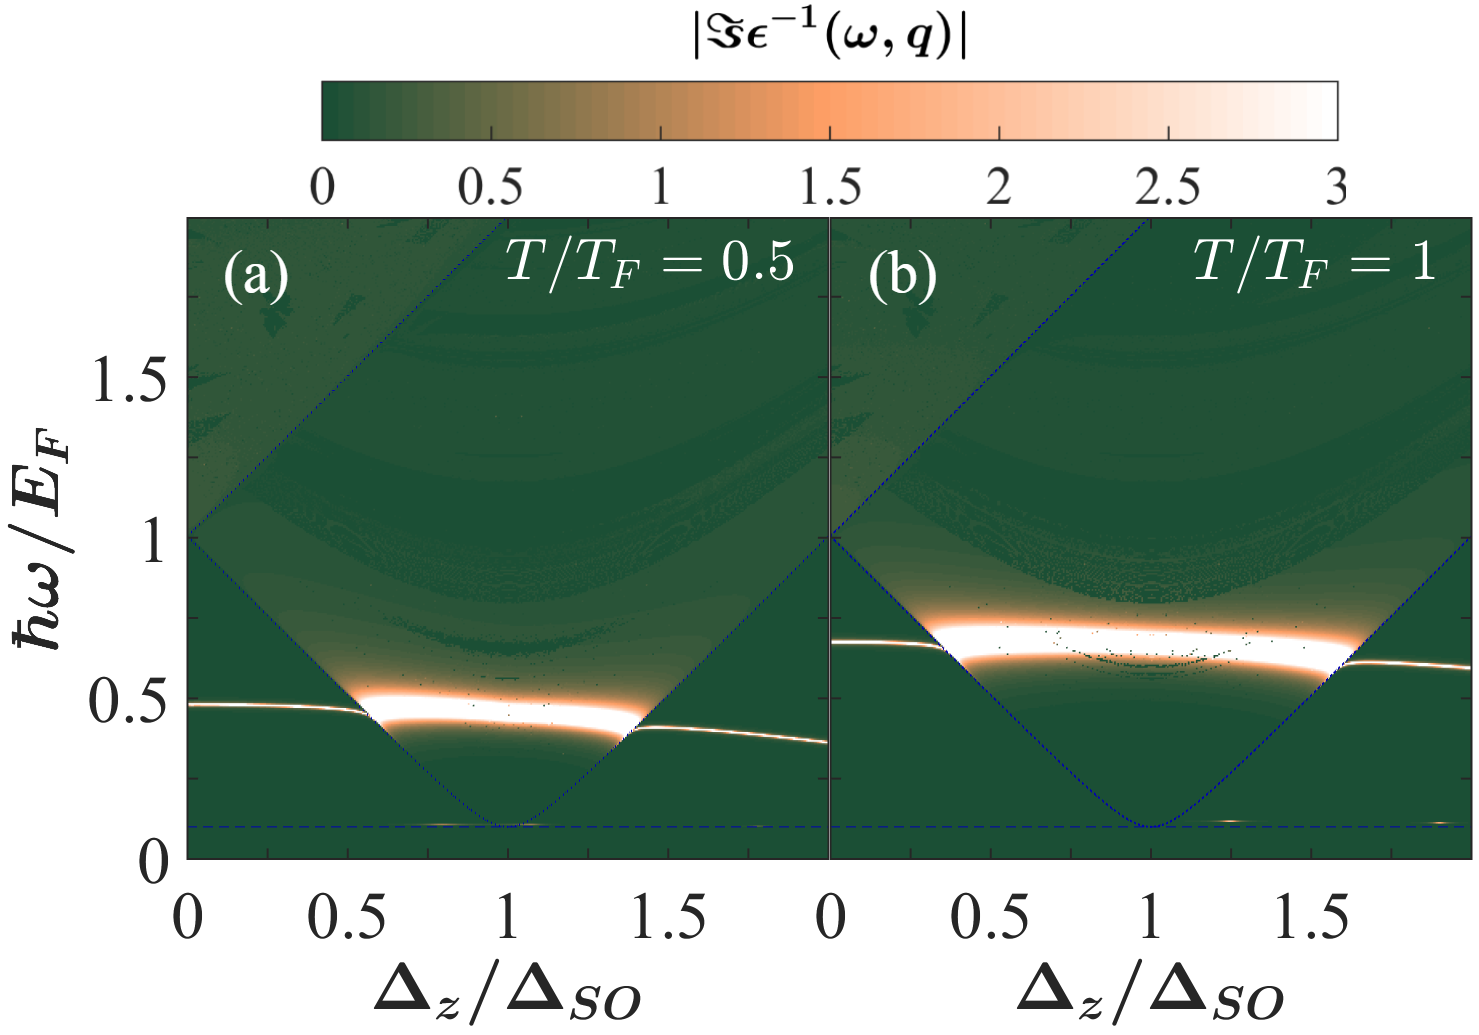
In order to study the effect of an external electric field on the finite-temperature DLS plasmons, the loss function is plotted in Fig. 12 for with and at where dotted blue curves determine the SPE boundaries of Eq. (LABEL:Boundary). At both temperatures, the optical plasmon frequency decreases as increases quite similar to the trend for (see Fig. 2). Moreover, the optical plasmon branch enters the SPE region for a certain interval of around and this interval is extended as the temperature increases from up to . It can also be seen that the damped part of the optical plasmon branch is not extended continuously from the undamped part and it really seems more like a separate mode; for the acoustic branch however, such discontinuity can not be observed as it enters and exits the SPE region.
IV Conclusion
To summarize, we have studied the finite-temperature plasmons of an n-doped double-layer 2D system consisting of silicene sheets with and . We have considered all three phases of silicene (TI, VSPM and BI) by applying an external electric field to the system. For comparison, the zero- temperature results have been presented. By calculating the poles of the loss function, both the optical and acoustic plasmon branches have been obtained. To illustrate the finite-temperature SPE regions, we have plotted the imaginary part of the polarization function, as well. Our calculations for a DLS with have shown that as the temperature is raised from up to , the optical plasmon frequency first decreases and then increases smoothly for the different values of (TI), (TI), (VSPM) and (BI). However, the acoustic modes change negligibly with temperature. Moreover, for a DLS with at finite temperature, similar to the zero-temperature analytical results at long wavelengths, the optical plasmon dispersion is unaffected by changing the layer separation, at both and , while the acoustic plasmon dispersion exhibits a small growth. The effect of external electric field has also been studied for and at a given and a decreasing trend has been observed for the optical plasmon dispersion as varies from to and a Landau damping behavior obtained around . The corresponding zero-temperature results have displayed a discontinuity at VSPM phase for both optical and acoustic plasmons.
References
- Guzmán-Verri and Lew Yan Voon (2007) G. G. Guzmán-Verri and L. C. Lew Yan Voon, Phys. Rev. B 76, 075131 (2007).
- Cahangirov et al. (2009) S. Cahangirov, M. Topsakal, E. Aktürk, H. Şahin, and S. Ciraci, Phys. Rev. Lett. 102, 236804 (2009).
- Enriquez et al. (2012) H. Enriquez, S. Vizzini, A. Kara, B. Lalmi, and H. Oughaddou, J. Phys. Condens. Matter 24, 314211 (2012).
- Kaltsas and Tsetseris (2013) D. Kaltsas and L. Tsetseris, Phys. Chem. Chem. Phys. 15, 9710 (2013).
- Lew Yan Voon et al. (2016) L. C. Lew Yan Voon, J. Zhu, and U. Schwingenschlögl, Appl. Phys. Rev. 3, 040802 (2016).
- Huang et al. (2013) S. Huang, W. Kang, and L. Yang, Appl. Phys. Lett. 102, 133106 (2013).
- Barati et al. (2018) M. Barati, T. Vazifehshenas, T. Salavati-fard, and M. Farmanbar, J. Phys. Condens. Matter 30, 155307 (2018).
- Kara et al. (2009) A. Kara, C. Léandri, M. E. Dávila, P. De Padova, B. Ealet, H. Oughaddou, B. Aufray, and G. Le Lay, J. Supercond. Nov. Magn. 22, 259 (2009).
- Nakano and Ikuno (2016) H. Nakano and T. Ikuno, Appl. Phys. Rev. 3, 040803 (2016).
- Sugiyama et al. (2010) Y. Sugiyama, H. Okamoto, T. Mitsuoka, T. Morikawa, K. Nakanishi, T. Ohta, and H. Nakano, J. Am. Chem. Soc. 132, 5946 (2010).
- Lin et al. (2012) C. L. Lin, R. Arafune, K. Kawahara, N. Tsukahara, E. Minamitani, Y. Kim, N. Takagi, and M. Kawai, Appl. Phys. Express 5, 5 (2012).
- Feng et al. (2012) B. Feng, Z. Ding, S. Meng, Y. Yao, X. He, P. Cheng, L. Chen, and K. Wu, Nano Lett. 12, 3507 (2012).
- Chiappe et al. (2012) D. Chiappe, C. Grazianetti, G. Tallarida, M. Fanciulli, and A. Molle, Adv. Mater. 24, 5088 (2012).
- Jamgotchian et al. (2012) H. Jamgotchian, Y. Colignon, N. Hamzaoui, B. Ealet, J. Y. Hoarau, B. Aufray, and J. P. Bibérian, J. Phys. Condens. Matter 24, 172001 (2012).
- Fleurence et al. (2012) A. Fleurence, R. Friedlein, T. Ozaki, H. Kawai, Y. Wang, and Y. Yamada-Takamura, Phys. Rev. Lett. 108, 245501 (2012).
- Meng et al. (2013) L. Meng, Y. Wang, L. Zhang, S. Du, R. Wu, L. Li, Y. Zhang, G. Li, H. Zhou, W. A. Hofer, and H.-J. Gao, Nano Lett. 13, 685 (2013).
- Lalmi et al. (2010) B. Lalmi, H. Oughaddou, H. Enriquez, A. Kara, S. Vizzini, B. Ealet, and B. Aufray, Appl. Phys. Lett. 97, 223109 (2010).
- Ni et al. (2012) Z. Ni, Q. Liu, K. Tang, J. Zheng, J. Zhou, R. Qin, Z. Gao, D. Yu, and J. Lu, Nano Lett. 12, 113 (2012).
- Drummond et al. (2012) N. D. Drummond, V. Zólyomi, and V. I. Fal’ko, Phys. Rev. B 85, 075423 (2012).
- Tsai et al. (2013) W.-F. Tsai, C.-Y. Huang, T.-R. Chang, H. Lin, H.-T. Jeng, and A. Bansil, Nat. Commun. 4, 1500 (2013).
- Zhai and Jin (2016) X. Zhai and G. Jin, J. Phys. Condens. Matter 28, 355002 (2016).
- Wu and Meng (2015) X.-Q. Wu and H. Meng, J. Appl. Phys. 117, 203903 (2015).
- Soodchomshom (2014) B. Soodchomshom, J. Appl. Phys 115, 023706 (2014).
- Tao et al. (2015) L. Tao, E. Cinquanta, D. Chiappe, C. Grazianetti, M. Fanciulli, M. Dubey, A. Molle, and D. Akinwande, Nat. Nanotechnol. 10, 1 (2015).
- Narozhny and Levchenko (2016) B. N. Narozhny and A. Levchenko, Rev. Mod. Phys. 88, 025003 (2016).
- Zheng and MacDonald (2012) L. Zheng and A. H. MacDonald, J. Phys. Condens. Matter 24, 335602 (2012).
- Zheng and MacDonald (1993) L. Zheng and A. H. MacDonald, Phys. Rev. B 48, 8203 (1993).
- Saberi-Pouya et al. (2016) S. Saberi-Pouya, T. Vazifehshenas, M. Farmanbar, and T. Salavati-fard, J. Phys. Condens. Matter 28, 285301 (2016).
- Vazifehshenas and Salavati-fard (2015) T. Vazifehshenas and T. Salavati-fard, Physica B 462, 112 (2015).
- Güven and Tanatar (1997) K. Güven and B. Tanatar, Phys. Rev. B 56, 7535 (1997).
- Gorbachev et al. (2012) R. Gorbachev, A. Geim, M. Katsnelson, K. Novoselov, T. Tudorovskiy, I. Grigorieva, A. MacDonald, S. Morozov, K. Watanabe, T. Taniguchi, and L. Ponomarenko, Nat. Phys. 8, 896 (2012).
- Hwang and Das Sarma (2009) E. H. Hwang and S. Das Sarma, Phys. Rev. B 80, 205405 (2009).
- Peres et al. (2011) N. M. R. Peres, J. M. B. L. dos Santos, and A. H. C. Neto, Europhys. Lett. 95, 18001 (2011).
- Suen et al. (1992) Y. W. Suen, L. W. Engel, M. B. Santos, M. Shayegan, and D. C. Tsui, Phys. Rev. Lett. 68, 1379 (1992).
- Kim et al. (2011) S. Kim, I. Jo, J. Nah, Z. Yao, S. K. Banerjee, and E. Tutuc, Phys. Rev. B 83, 161401 (2011).
- Flensberg and Hu (1995) K. Flensberg and B. Y.-K. Hu, Phys. Rev. B 52, 14796 (1995).
- Das Sarma and Madhukar (1981) S. Das Sarma and A. Madhukar, Phys. Rev. B 23, 805 (1981).
- Vazifehshenas et al. (2010) T. Vazifehshenas, T. Amlaki, M. Farmanbar, and F. Parhizgar, Phys. Lett. A 374, 4899 (2010).
- Wu et al. (2015) J.-Y. Wu, C.-Y. Lin, G. Gumbs, and M.-F. Lin, RSC Adv. 5, 51912 (2015).
- Tabert and Nicol (2014) C. J. Tabert and E. J. Nicol, Phys. Rev. B 89, 195410 (2014).
- Iurov et al. (2017a) A. Iurov, G. Gumbs, and D. Huang, J. Phys. Condens. Matter 29, 135602 (2017a).
- Iurov et al. (2017b) A. Iurov, G. Gumbs, D. Huang, and G. Balakrishnan, Phys. Rev. B. 96, 245403 (2017b).
- Chang et al. (2014) H. R. Chang, J. Zhou, H. Zhang, and Y. Yao, Phys. Rev. B 89, 201411 (2014).
- Pyatkovskiy (2009) P. K. Pyatkovskiy, J. Phys. Condens. Matter 21, 025506 (2009).
- Patel et al. (2015) D. K. Patel, S. S. Ashraf, and A. C. Sharma, Phys. Status Solidi B 252, 1817 (2015).
- Van Duppen et al. (2014) B. Van Duppen, P. Vasilopoulos, and F. M. Peeters, Phys. Rev. B 90, 035142 (2014).
- Qiao et al. (2010) Z. Qiao, S. A. Yang, W. Feng, W.-K. Tse, J. Ding, Y. Yao, J. Wang, and Q. Niu, Phys. Rev. B 82, 161414 (2010).
- Haugen et al. (2008) H. Haugen, D. Huertas-Hernando, and A. Brataas, Phys. Rev. B 77, 115406 (2008).
- Yokoyama (2014) T. Yokoyama, New J. Phys. 16, 085005 (2014).
- Mirzaei et al. (2018) M. Mirzaei, T. Vazifehshenas, T. Salavati-fard, M. Farmanbar, and B. Tanatar, Phys. Rev. B 98, 045429 (2018).
- Stauber and Gómez-Santos (2012) T. Stauber and G. Gómez-Santos, Phys. Rev. B 85, 075410 (2012).
- Profumo et al. (2012) R. E. V. Profumo, R. Asgari, M. Polini, and A. H. MacDonald, Phys. Rev. B 85, 085443 (2012).
- Gumbs et al. (2016) G. Gumbs, A. Iurov, M. F. Lin, and P. Fekete, Sci. Rep. 6, 21063 (2016).
- Hwang and Das Sarma (2007) E. H. Hwang and S. Das Sarma, Phys. Rev. B 75, 205418 (2007).
- Das Sarma and Hwang (2009) S. Das Sarma and E. H. Hwang, Phys. Rev. Lett. 102, 206412 (2009).
- Van Tuan and Khanh (2013) D. Van Tuan and N. Q. Khanh, Physica E 54, 267 (2013).
- Badalyan and Peeters (2012) S. M. Badalyan and F. M. Peeters, Phys. Rev. B 85, 195444 (2012).
- Kane and Mele (2005) C. L. Kane and E. J. Mele, Phys. Rev. Lett. 95, 1 (2005).
- Ezawa (2013) M. Ezawa, Phys. Rev. B 87, 155415 (2013).
- Liu et al. (2011) C. C. Liu, H. Jiang, and Y. Yao, Phys. Rev. B 84, 195430 (2011).
- Ezawa (2012) M. Ezawa, New J. Phys. 14, 033003 (2012).