Abstract
Search for periodic signals from blazars has become widely discussed topic in recent years. In the scenario that such periodic changes originate from the innermost regions of blazars, the signals bear imprints of the processes occurring near the central engine, which is mostly inaccessible to our direct view. Such signals provide insights into various aspect of blazar studies including disk-jet connection, magnetic field configuration and, more importantly, strong gravity near the supermassive black holes and release of gravitational waves from the binary supermassive black hole systems. In this work, we report detection of a periodic signal in the radio light curve of the blazar J1043+2408 spanning 10.5 years. We performed multiple methods of time series analysis, namely, epoch folding, Lomb-Scargle periodogram, and discrete auto-correlation function. All three methods consistently reveal a repeating signal with a periodicity of days. To robustly account for the red-noise processes usually dominant in the blazar variability and other possible artifacts, a large number of Monte Carlo simulations were performed. This allowed us to estimate a high significance (99.9% local and 99.4% global) against possible spurious detection. As possible explanations, we discuss a number of scenarios including binary supermassive black hole system, Lense-Thirring precession and jet precession.
keywords:
Supermassive black holes: non-thermal radiation; active galactic nuclei: BL Lacertae objects: individual: J1043+2408; galaxies: jets; method: time series analysisx \doinum10.3390/—— \pubvolumexx \externaleditorAcademic Editor: name \historyReceived: date; Accepted: date; Published: date \TitleDETECTION OF PERIODIC RADIO SIGNAL FROM THE BLAZAR J1043+2408 \AuthorGopal Bhatta 1,†,‡\orcidA0000-0002-0705-6619* \AuthorNamesFirstname Lastname, Firstname Lastname and Firstname Lastname \corresCorrespondence: gopalbhatta716@gmail.com; Tel.: +x-xxx-xxx-xxxx
1 Introduction
Blazars, a class of radio-loud active galactic nuclei (AGN), are the most energetic sources in the universe. The sources have relativistic jets beamed upon us that shine brightly in non-thermal emission covering a wide electromagnetic spectrum - from radio to most energetic -rays. As jets accelerate matter with high speeds down the jet orientated close to the observer’s line of sight, relativistic effects become dominant resulting in the Doppler boosted emission that is highly variable over the entire electromagnetic spectrum (Meier12, ). The broadband spectral energy distribution (SED) of blazars can often be identified with a double-peaked feature in the frequency-flux plane. The lower peak, usually found between the radio and X-ray, arises as a result of the synchrotron emission by the energetic particles accelerating in the jet magnetic field; whereas the origin of the high frequency component, extending from X-rays to TeV energies, is still a debated topic. In leptonic models, e.g., Maraschi et al. (1992); Bloom & Marscher (1996) it is resulted due to the inverse-Compton scattering of the soft seed photons by the energetic particles. In the synchrotron self-Compton scenario (SSC), the same population of the high energy electrons responsible for the synchrotron emission up-scatter the photons to higher energy. However, in the external Compton scenario (EC), the seed photons might originate at the various components of an AGN, e.g., accretion disk Dermer & Schlickeiser (1993), broad-line region (Sikora, 1994), and dusty torus Błażejowski et al. (2000). Hadronic models, on the other hand, ascribe the high energy emission from blazars to the interaction of relativistic protons in the presence of radiation fields (e.g., Mannheim & Biermann, 1992; Aharonian, 2000; Mücke et al., 2003)
Blazars consist of two types of sources: flat-spectrum radio quasars (FSRQ) and BL Lacertae (BL Lac) objects. FSQRs are the more powerful sources which show emission lines in the optical continuum and have the synchrotron peak in the lower part of the spectrum; whereas BL Lac objects are less powerful ones which show weak or no emission lines and have synchrotron peak in the higher part of the spectrum. BL Lacs represent an extreme class of sources with maximum synchrotron emission output reaching up to soft X-rays (1016 Hz) and inverse-Compton emission output ranging from hard X-rays to TeV emission. The sources do not possess strong circum-nuclear photon fields and are believed to accrete at relatively low rates (see Bhatta2018b, , and references therein).
Blazars display variability in a wide range of temporal frequencies - equivalently, on diverse timescales ranging from a few minutes to decades. The statistical nature of such variability can fairly be represented by a featureless power-law power spectral density (PSD) (see in this context Bhatta2016, ; Bhatta2018c, , and references therein). However, signatures of quasi-periodic oscillations (QPO) in the multi-frequency blazar light curves, including radio, optical, X-ray and -ray, have been found. The timescales of the reported periodicity range from a few hours to a few years (see Gupta2018, ; Bhatta2017, ; Zola2016, ; Bhatta2016b, , for QPOs in blazars).
In particular, at radio frequencies QPO on diverse timescales have been recorded in a number of blazars: In BL Lac source PKS 0219-164, a strong signal of QPO with 270 d period, along with possible low-frequency harmonics, was detected Bhatta2017 . Similarly, in BL Lac source AO 0235, QPOs with periods ranging from about one year up to several years have been reported (Liu2006 ; Raiteri2001 . Also, FSRQ J1359+ 4011 was reported to exhibit persistent day periodic modulation in the 15 GHz observations King2013 . In addition, several other blazar sources were found to show QPOs in the radio frequencies, e.g., FSRQ PKS 1510-089 (Xie2008, ), blazar NRAO 530 (An2013, ), and FSRQ PKS 1156+295 Wang14 ; Hovatta2008 ; Hovatta2007 .
BL Lac J1043+2408 (RA=10h 43m 09.0s, Dec= +24d 08m 35s, and z = 0.563446; Hewett2010 ) has been detected by most of the currently available instruments operating within a wide range of electromagnetic frequencies. The source is cataloged by Fermi/LAT as 3FGL J1043.1+2407 Acero2015 , and in the soft X-ray (0.1-2.4 keV) it was frequently observed by ROSAT Massaro2009 . During The Micro-Arcsecond Scintillation-Induced Variability Survey III, its optical (R-band) brightness was recorded to be 16.84 magnitudes Pursimo2013 . The blazar is being regularly monitored in the 15-GHz radio band by the 40-m telescope of the Owens Valley Radio Observatory (OVRO) since 2008.
In this paper, we analyze the long term ( years) radio observations of the blazar J1043+2408 and report detection of 563 d periodicity in the light curve. In section 2 we discuss data acquisition. We present time series analysis of the light curve using the epoch-folding, Lomb-Scargle periodogram (LSP), and discrete auto-correlation function methods; besides, we also elaborate on the Monte Carlo simulation technique which is used to compute the statistical significance of the detected periodicity. In section 4, we discuss various possible scenarios that can lead to the observed periodic signal; and finally we summarize our conclusion in section 5.
2 Data Acquisition
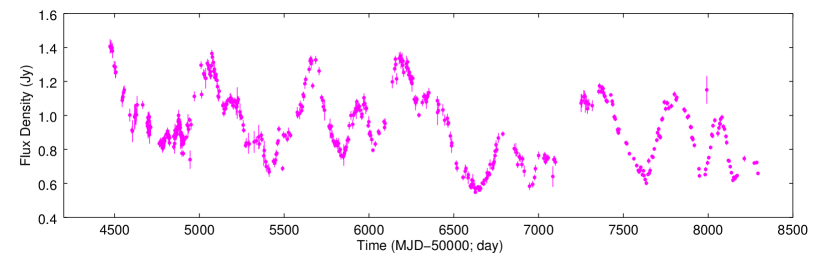
The 15 GHz radio observations of the source J1043+2408 were obtained from Owens Valley Radio Observatory (OVRO; Richards2011 ). We analyzed the observations, with an average sampling of a week, from epoch 2008-01-08 to 2018-07-08 (equivalently, from MJD 54473 to 58307), spanning 3820 days ( 10.5 years) .
3 Analysis and Results
The 15 GHz band light curve of the blazar J1043+2408 from the last decade is presented in Figure 1. In the figure, it can be clearly seen that not only the source displays long-term variability but it also shows a periodic flux modulation such that in each cycle the flux nearly doubles between minimum and maximum. To quantify the observed long-term variability, we estimated a fractional variability Vaughan2003 ; Bhatta2018a of % , indicating a moderate variability over the period.
3.1 Periodicity Search:
We carried out periodicity search analysis using three well known methods of time-series analysis: epoch folding, Lomb-Scargle periodogram and discrete auto-correlation function. The methods, analyses and the results are discussed in detail below.
|
|
3.1.1 Epoch folding
Epoch folding, a widely discussed method of time series analysis, was first worked out by Leahy et al. (1983) Leahy1983 and later improved by a number of authors (e.g. Davies1990, ; Davies1991, ). Unlike traditional discrete Fourier periodogram, which expects periodic components to be of the sinusoidal shape, the method is less sensitive to the modulating shape of the periodic components. Also, this method is largely unaffected by the irregularity in the sampling of the observations and therefore well suited for the periodic search in the data with gaps. In this method, a time series with N data points and varying about a mean value of is folded on several trial periods and phase bins. Then, a quantity expressed as
| (1) |
is estimated, where and represent the mean and standard deviation, respectively, of each of M phase bins. For the observations distributed as Gaussian noise, we generally find . However in case of the observations containing periodic signals, takes a value which is significantly different (or the maximum) from the average value (for details refer to Larsson1996, ). The method has been frequently tested in the context of the periodicity analysis of blazar light curves e.g., Zhang2014 .
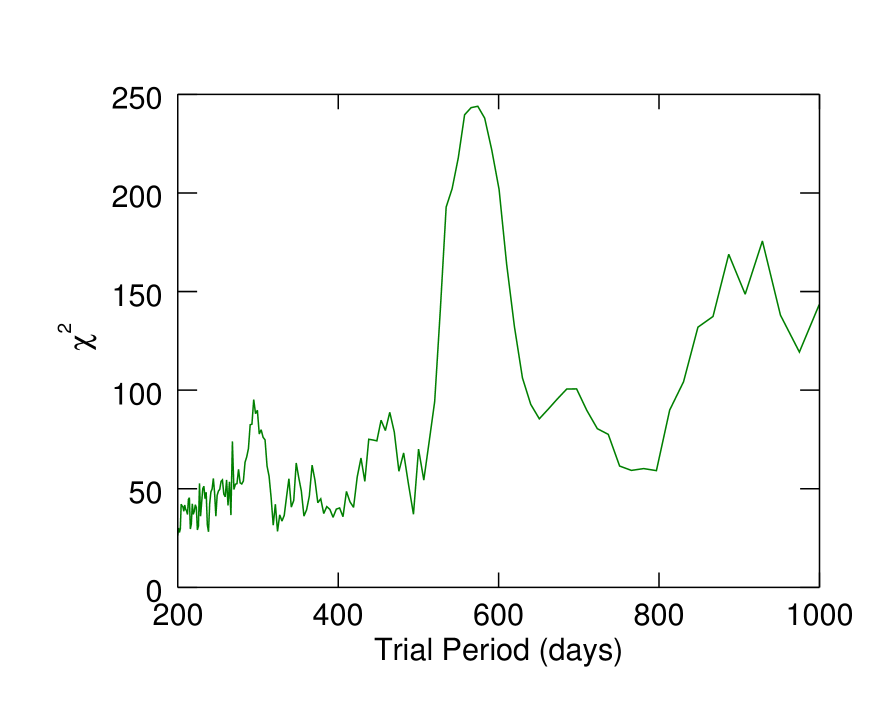
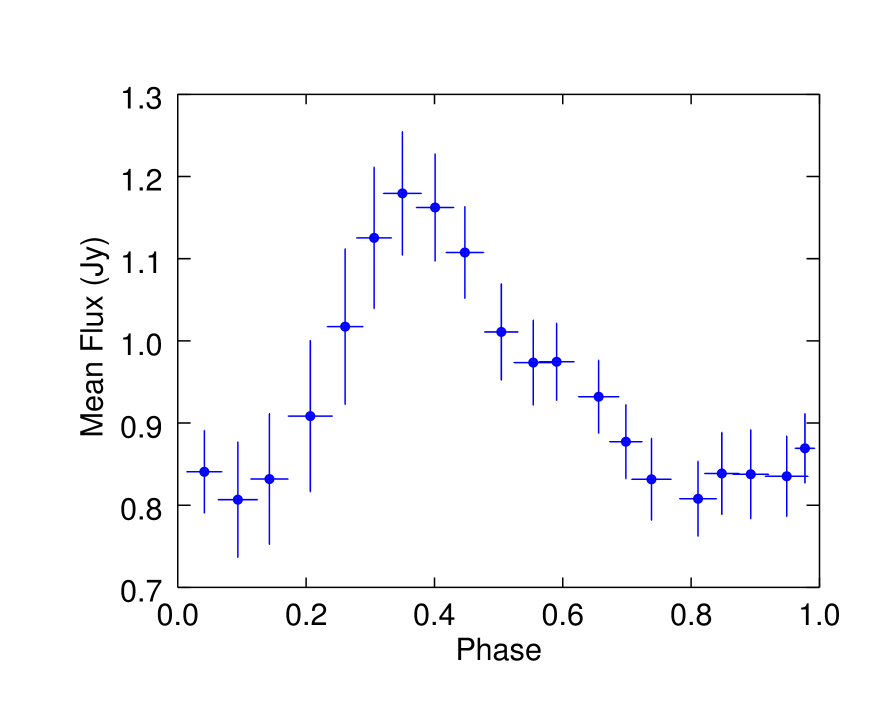
We computed values of the source light curve for the trial periods ranging between 200 and 1000 days using a time step of 14 days. The pulse profiles corresponding to these trial periods were generated and, subsequently, tested for constancy using Equation 1. The left panel of Figure 2 presents the distribution of the values over the trial periods considered. The maximum deviation seen at days, represents the most probable period. The uncertainties here represent the half-width at maximum (HWHM) of the Gaussian fit of the peak centered around 563-day trial period. The right panel of Figure 2 shows the pulse profile corresponding to the period. The observed period is further tested by using the following methods.
|
|
3.1.2 Lomb-Scargle Periodogram
The Lomb-Scargle Periodogram (LSP; Lomb1976, ; Scargle1982, ) is one of the most popular methods of time series analysis (see Bhatta2016, ; Bhatta2017, ; Bhatta2016b, ). The method, as a form of least-square fitting of the sinusoidal waves to the data, is less sensitive to the gaps in the data when compared to the traditional discrete Fourier transform (DFT). The fitting process enhances the periodogram features (or peaks) that can possibly represent periodic signals in light curves. The LSP of the source light curve was computed for the minimum and maximum frequencies of, d, and =1/14 d, respectively. It should be pointed out that the choice of the total number of periodogram frequencies, , plays an important role in the evaluation of the periodogram; we would like to select its value keeping in mind that a small value lacks precision on the location of the most prominent period; whereas a large value could be computationally inconvenient. In this work, the total number of periodogram frequencies were evaluated using
| (2) |
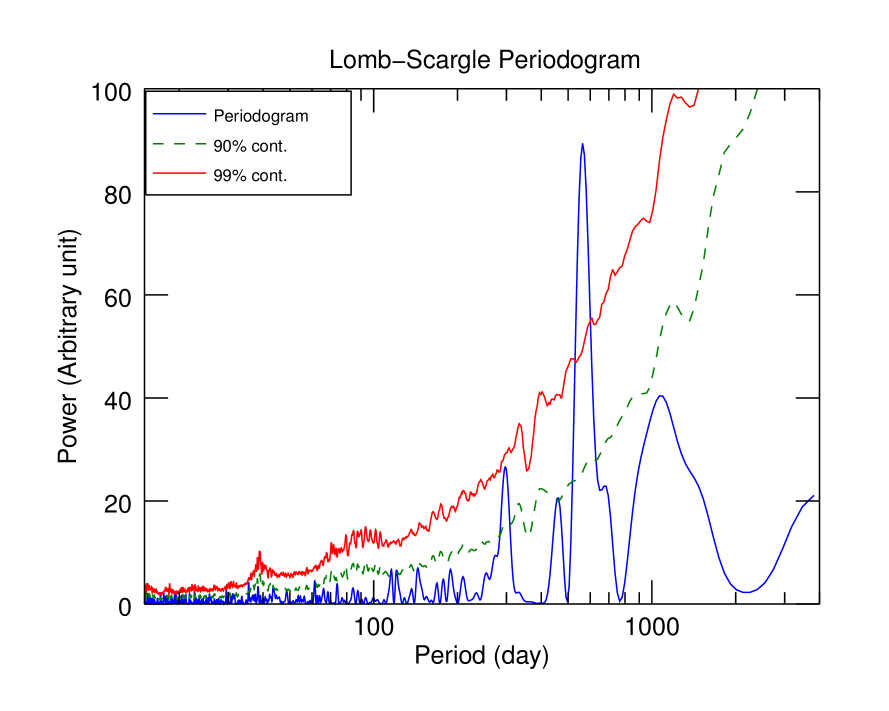
where , and days represents the total length of the observations (see VanderPlas2018, ). The LSP of the 10.5 years long OVRO light curve of the blazar J1043+2408 is presented in Figure 3. It can be seen that in the periodogram a distinct peak stands out around the timescale of days; this suggests presence of a strong periodic signal at the timescale. The uncertainties in the period are estimated by taking the HWHM of the most prominent peak (see Bhatta2017, ; Bhatta2016b, ). Moreover, to assess the effect of , we also computed LSP using . This made the dominant period shift to days with larger uncertainties of days. We see that the results are consistent with the previous finding by the epoch folding method.
3.1.3 Discrete auto cross-correlation Function
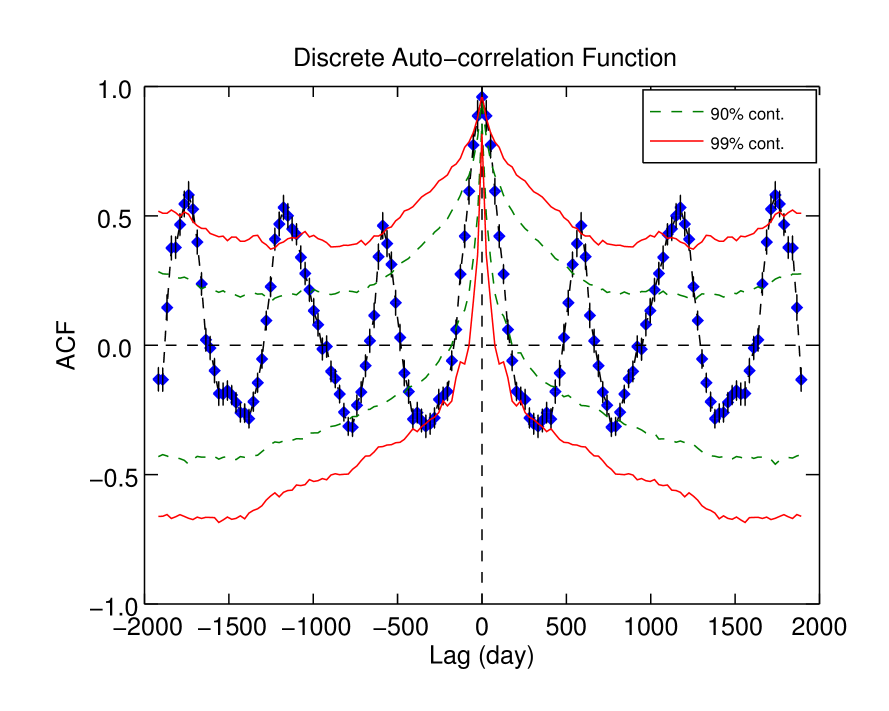
To further confirm the presence of the above periodic timescale using different method, we performed the discrete correlation function analysis as described in EK88 . The method has been mostly applied to investigate cross-correlation between two time series with uneven spacing (see Bhatta2018b, ; Bhatta2018c, ; Bhatta2016, ; Bhatta2018a, ). With only one light curve, the method becomes discrete auto-correlation function (ACF), which can be exploited to reveal the periodic signals in a light curve. The ACF, although related to PSD in frequency space, is computed in time domain and therefore it is free of the sampling effects such as windowing and aliasing. The method has been frequently employed in the periodicity search in blazar light curves (e.g. Bhatta2018b, ; Villata2004, ). The discrete ACF of the radio light curve of the blazar is presented in the right panel of Figure 3 which clearly reveals presence of the periodic behavior represented by the ACF peaks recurring after an interval of days. Once again, HWHM for the first peak is used as a measure of uncertainty. It should be noted that all three estimates of uncertainty measures, as provided by the HWHM of the Gaussian fit of the most prominent features, are consistent within 2% of the significant period.
3.1.4 Significance Estimation and Monte Carlo Simulation
After we have employed three different methods to detect periodicity in the light curve, it should be pointed out that, in general, the statistical properties of blazar light curves can be characterized as red-noise processes that can potentially mimic a transient periodic behavior, especially in the low-frequency domain (see Press1978, ; Bhatta2017, ; Bhatta2018c, , for the discussion). In addition, spurious peaks might arise owing to other sampling effects including discrete sampling, finite observation period and uneven sampling of the light curve. Therefore, it is important to make consideration of these effects in the significance estimation against spurious detection. To address the issue, we followed the power response method (PSRESP; Uttley2002, ), a method extensively used in the characterization of the AGN power spectrum density (see Bhatta2016, ; Bhatta2016b, ; Bhatta2017, ; Bhatta2018b, , and references therein). First the source periodogram was modeled with a power-law PSD of the form ; where , , and represent temporal frequency, spectral slope and Poisson noise level, respectively. To maximize the probability that the PSD model best represents the observed periodogram, and were used. A large number of (typically 10000) light curves were then simulated following the Monte Carlo (MC) method described in Timmer1995 . The method fully randomizes both the amplitude and the phase. However, the method could have possible caveats due to the fact that it produces Gaussian distributed light curves, which may not represent the probability density function of the observations (see Emmanoulopoulos et al., 2013). Nevertheless, as the periodic features in our all methods clearly stand out, we expect that any significant deviations in the significance estimation will fall within the range of uncertainties.
The simulated light curves were re-sampled to match the sampling of the source light curve. Now to estimate the significance of the periodic feature seen in the LSP, the LSP distribution of the simulated light curves was utilized to estimate a local and global significance of the periodic feature against spurious detections (for further details see Bhatta2016, ; Bhatta2016b, ; Bhatta2017, ; Bhatta2018b, ). The local significance tells us how likely the observed feature at a particular frequency is significant; whereas the global significance, which considers LSP distribution at all the frequencies considered, accounts for the fact that we do not have an a priori knowledge of the location of the frequency at which the most significant feature might occur (see Bhatta2017, ). The local significance of the observed periodic feature at the period of 563 d turned out to be 99.4%, and similarly the global significance of the LSP peak at the period 563 day was evaluated to be 99.6%. The local 90% and 99% LSP significance contours are represented by the dashed green and the red curves, respectively, in the left panel Figure 3. It can be seen that the red-noise has a predominance of spectral powers in the low-frequency regime, or equivalently longer timescales.
In similar way, we used the distribution of the simulated ACFs to estimate the local 90% and 99% significance contours shown by the dashed green and the red curves, respectively, in the auto-correlation function shown in the right panel of Figure 3. The observed high significances imply a low probability of spurious detections and therefore suggests that the signal, intrinsic to the source light curve, should have a physical origin.
4 Discussion
Study of periodic oscillations in blazars could be a novel method to investigate the processes occurring at the innermost regions of the active central engines. The studies could provide important insights into a number of blazar aspects including strong gravity environment around fast spinning supermassive black holes (SMBH), magnetic field configuration near the accretion disk, disk-jet connection and release of gravitational waves (GW) from the binary supermassive black hole systems. There could be a number of processes that can explain the observed periodic flux modulations. Below we discuss some of them.
|
|
First, for the observed period () of 563 days, the corresponding period in the source rest frame () at is 360 days, as estimated using . If we take the value as the Keplerian period around the central black hole, , we can estimate the corresponding radius of the orbit as given by
| (3) |
where is the length of the semi-major axis of the elliptic orbits. For a black hole of mass of the radius of the Keplerian orbit is estimated as 100 , equivalently, 0.005 parsecs. Now this result can be interpreted in terms of binary supermassive black hole system (e.g., Valtonen2011, ), which potentially can explain presence of year-like periodic timescales in AGN (see for a review Komossa2006, ). For the binary mass ratios in the rage 0.1–0.01 (see e.g., Begelman et al., 1980; Sillanpaa et al., 1988), the orbital decay timescale in the GW-driven regime can be computed as
| (4) |
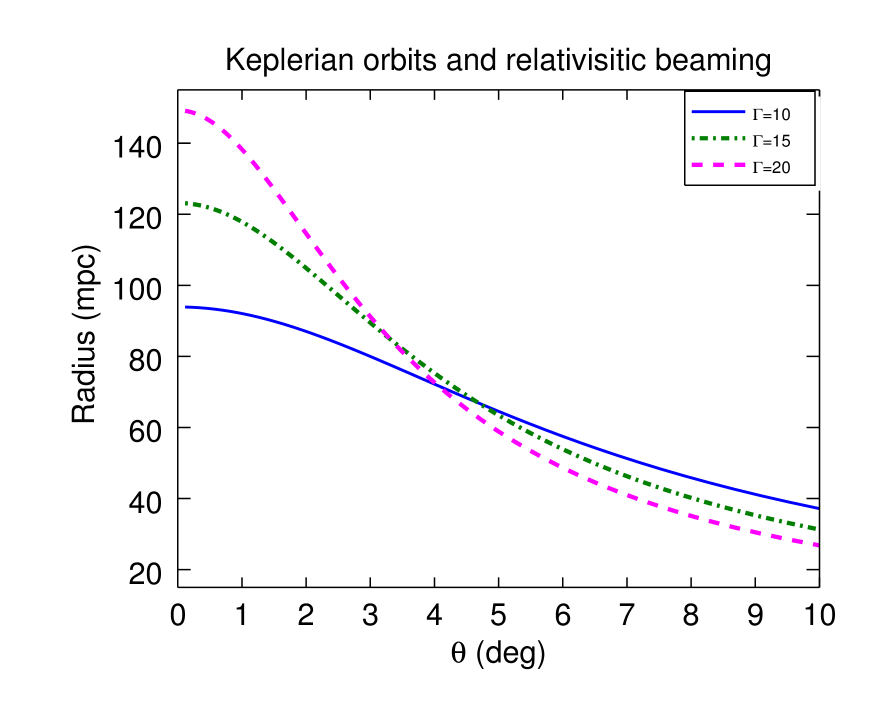
(see Peters1964, ); the timescale turns out to be less than a thousand years. Indeed, existence of binary SMBH is consistent with the prediction by the hierarchical galaxy formation models. As a matter of fact, the closest binary SMBH so far detected lies within a sub-parsec separation (0.35 pc; Kharb2017 ) in Mrk 533, a Seyfert type 2 AGN. Therefore if the above periodicity results from such a system, we should expect that the system will undergo gravitational coalescence within a few centuries accompanied with the emission of gravitational waves of the frequency Hz. However, the probability of observing such a close (milliparsec) system of binary SMBH might be too small (see Ackermann2015, ). But on the other hand, in the case of strong disk-jet connection (e.g., in Blandford & Payne, 1982) (see also Bhatta2018c ), the periodic modulations induced due to binary SMBH system could propagate down the jet affecting the Doppler boosted emission. In such case, true periodic timescales at the BH could be longer than the observed one due to relativistic effects, i.e. , where Doppler factor, , and , and are the bulk Lorentz factor, relativistic speed and angle to the line of sight, respectively. Consequently, the corresponding Keplerian orbit of the secondary black hole could be larger and therefore lie farther away from the primary BH. For instance, if a jet component carrying the periodic signal travels along the jet viewed at with a bulk Lorentz factor of , the orbit estimated using dilated timescale gives a distance of a parsecs. Such a sub-parsec separation incidentally represents a relatively stable configuration in the evolution of binary SMBH systems (see Rieger2007, ). The left panel of Figure 4 shows the radii of the Keplerian circular orbits of the possible secondary black hole corresponding to periodic modulations propagating with three different bulk Lorentz factors, , and 20, along the blazar jet that is viewed within .
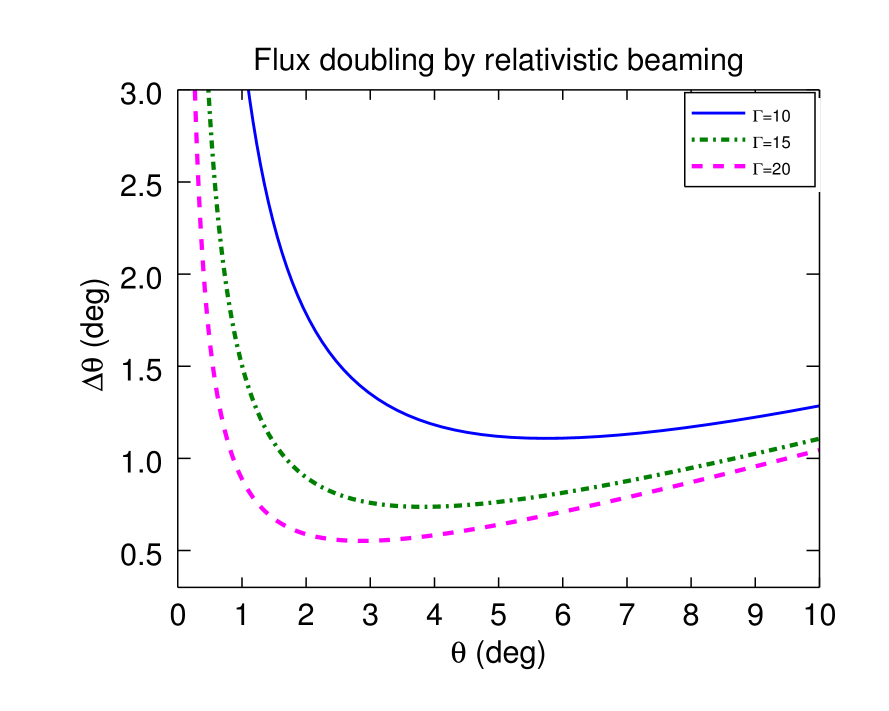
Similarly, the periodic changes can also be associated with relativistic motion of the emission regions along the helical path of the magnetized jets (e.g., Camenzind92, ; Mohan2015, ). In particular, when the emission regions move along the helical path of a jet with a high bulk Lorentz factor, due to the relativistic effects, the periodic changes in the viewing angle cause the Doppler boosted emission to be periodically modulated. The rest frame flux () and observed flux () are related through the equations
| (5) |
(similar to Equation B4 in Urry & Padovani, 1995). For blazars having typical radio spectral index (), the change in the angle of line of sight required to double the observed flux, while keeping the flux in the source rest frame constant, for various jet angles and three bulk Lorentz factors , is displayed in the right panel of Figure 4. As the figure shows, for typical blazar viewing angles in the range, a slight change in the viewing angle e.g., , is sufficient to double the observed brightness.
In another likely scenario, the detected QPO with a periodicity of days could be explained in the context of instabilities intrinsic to blazar accretion disk. For example, bright hot-spots on the disk that revolve around the BH could result in the year timescale periodicity. Assuming they follow circular Keplerian orbits, they could be located at from the BH. In the General Relativistic treatment of rotating massive objects, the nearby inertial frames are distorted by frame-dragging resulting in the nodal precession of the tilted orbits, ḵnown as the Lense-Thirring precession. Periodic behaviors in astronomical systems can also be linked to the Lense-Thirring precession of accretion disks (e.g. Stella1998, ; Motta2011, ). The timescale of such precession is proportional to the distance (from the BH) cubed and also to the mass of the central black hole so that the timescale, , can be expressed as
| (6) |
where , and represent dimensionless spin parameter, mass of the BH and the radial distance of the emission region from the BH, respectively. For a maximally spinning () central black hole with a mass , a timescale of 360 days places the emission region around . The periodic oscillations could be the result of the jet precession due to such warped accretion disks. However, such a periodic timescale would be thousands of years, hence may not be relevant here Liska2018 ; Graham2015 . In radio-loud AGNs, magnetic flux accumulation in the accretion disk can result in the formation of so-called magnetically choked accretion flow. In that case, owing to sudden change in the density and the magnetic flux, disk instabilities e.g., the Rayleigh-Taylor and Kelvin-Helmholtz instabilities, are set up; this in turn can induce QPOs at the disk-magnetosphere interface (Li2004, ; Fu2012, ). Similar QPOs have been observed in the recent magneto-hydrodynamical simulations of the large scale jets McKinney2012 . The periodic timescale of these QPOs could range from a few days to a few years depending upon the black hole mass and the spin parameter.
5 Conclusion
The long term (10.5 years) radio (15 GHz) observations of the blazar J1043+2408 were analyzed for possible periodicities using three methods widely used in astronomical time series analysis: epoch folding, Lomb-Scargle periodogram and auto-correlation function. The study revealed a strong periodic signal with a 560 day periodicity. A large number of Monte Carlo simulation of the light curves were used to establish a high significance () of the signal against possible spurious detection. We conclude that while other above discussed scenarios can not be completely ruled out, periodic modulations induced by gravitational perturbation in binary SMBH system seems a more plausible mechanism at the root of the observed periodic radio signal.
Acknowledgements.
We acknowledge the financial support by the Polish National Science Centre through the grant UMO-2017/26/D/ST9/01178. This research has made use of data from the OVRO 40-m monitoring program (Richards, J. L. et al. 2011, ApJS, 194, 29) which is supported in part by NASA grants NNX08AW31G, NNX11A043G, and NNX14AQ89G and NSF grants AST-0808050 and AST-1109911. We thank Prof. James Webb for carefully reading the manuscript. The author would like to thank the anonymous referees for their constructive comments and suggestions that greatly improved the manuscript. \conflictsofinterestThe authors declare no conflict of interest \abbreviationsThe following abbreviations are used in this manuscript:| AGN | Active Galactic Nuclei |
| ACF | Auto-correlation function |
| BL Lac | BL Lacertae object |
| BH | Black hole |
| FSRQ | Flat Spectrum Radio Quasar |
| LSP | Lomb-Scargle Periodogram |
| MC | Monte Carlo |
| OVRO | Owens Valley Radio Observatory |
| PSD | Power spectral density |
| QPO | Quasi-periodic oscillation |
| SMBH | Supermassive black hole |
References
- (1) Meier, D. L. , Black Hole Astrophysics: The Engine Paradigm, Springer, Verlag Berlin Heidelberg, 2012
- Maraschi et al. (1992) Maraschi, L., Ghisellini, G., & Celotti, A. A jet model for the gamma-ray emitting blazar 3C 279 ApJL, 1992, 397, L5
- Bloom & Marscher (1996) Bloom, S. D., & Marscher, A. P. An Analysis of the Synchrotron Self-Compton Model for the Multi–Wave Band Spectra of Blazars, ApJ 1996, 461, 657
- Dermer & Schlickeiser (1993) Dermer, C. D., & Schlickeiser, R. Thermal Comptonization Model for the High Energy Emission of Seyfert Active Galactic Nuclei, ApJ 1993, 416, 458
- Sikora (1994) Sikora, M. High-energy radiation from active galactic nuclei ApJS 1994, 90, 923
- Błażejowski et al. (2000) Błażejowski, M., Sikora, M., Moderski, R., & Madejski, G. M. Comptonization of Infrared Radiation from Hot Dust by Relativistic Jets in Quasars, ApJ 2000, 545, 107
- Mannheim & Biermann (1992) Mannheim, K., & Biermann, P. L. Gamma-ray flaring of 3C 279 - A proton-initiated cascade in the jet?, A&A, 1992, 253, L21
- Aharonian (2000) Aharonian, F. A. TeV gamma rays from BL Lac objects due to synchrotron radiation of extremely high energy protons, New Astron., 2000, 5, 377
- Mücke et al. (2003) Mücke, A., Protheroe, R. J., Engel, R., Rachen, J. P., & Stanev, T. BL Lac objects in the synchrotron proton blazar model, Astroparticle Physics, 2003, 18, 593
- (10) Bhatta, G., Mohorian M., and Bilinsky I. Hard X-ray Properties of NuSTAR Blazars, A&A, 2018, 619, A93
- (11) Bhatta, G., Stawarz, L., Markowitz, A., et al. Signatures of the disk-jet coupling in the Broad-line Radio Quasar 4C+74.26, ApJ, 2018, 866, 132
- (12) Bhatta, G., Stawarz, L., Ostrowski, M., et al. Multifrequency Photo-polarimetric WEBT Observation Campaign on the Blazar S5 0716+714: Source Microvariability and Search for Characteristic Timescales ApJ 2016, 831, 92B
- (13) Gupta, A. Multi-Wavelength Intra-Day Variability and Quasi-Periodic Oscillation in Blazars Galaxies, 2018, 6, 1
- (14) Bhatta, G., Radio and -Ray Variability in the BL Lac PKS : Detection of Quasi-periodic Oscillations in the Radio Light Curve, ApJ, 2017, 487, 7B
- (15) Bhatta, G., Zola S., Stawarz, L., et al. Detection of Possible Quasi-periodic Oscillations in the Long-term Optical Light Curve of the BL Lac Object OJ 287, ApJ, 2016, 832, 47
- (16) Zola, S., Valtonen, M., Bhatta, G., et al. A Search for QPOs in the Blazar OJ287: Preliminary Results from the 2015/2016 Observing Campaign Galaxies, 2016, 4, 41
- (17) Liu, F. K., Zhao, G., & Wu, X.-B. Harmonic QPOs and Thick Accretion Disk Oscillations in the BL Lacertae Object AO 0235+164 ApJ, 2006, 650, 749
- (18) Raiteri, C. M., Villata, M., Aller, H. D., et al. Optical and radio variability of the BL Lacertae object AO 0235+16: A possible 5-6 year periodicity A&A, 2001, 377, 396
- (19) King, O. G., Hovatta, T., Max-Moerbeck, W., et al. A quasi-periodic oscillation in the blazar J1359+4011 MNRAS, 2013, 436, L114
- (20) Xie, G. Z., Yi, T. F., Li, H. Z., Zhou, S. B., & Chen, L. E. AJ, 2008, 135, 2212
- (21) An, T., Baan, W. A., Wang, J.-Y., Wang, Y., & Hong, X.-Y. MNRAS, 2013, 434, 3487
- (22) Wang, J.-Y., An, T., Baan, W. A., & Lu, X.-L. Periodic radio variabilities of the blazar 1156+295: harmonic oscillations MNRAS, 2014, 443, 58
- (23) Hovatta, T., Tornikoski, M., Lainela, M., et al. Statistical analyses of long-term variability of AGN at high radio frequencies A&A, 2007, 469, 899
- (24) Hovatta, T., Lehto, H. J., & Tornikoski, M. Wavelet analysis of a large sample of AGN at high radio frequencies A&A, 2008, 488, 897
- (25) Hewett, P. C., & Wild, V. Improved redshifts for SDSS quasar spectra MNRAS, 2010, 405, 2302
- (26) Acero, F., Ackermann, M., Ajello, M., et al. Fermi Large Area Telescope Third Source Catalog ApJS, 2015, 218, 23
- (27) Massaro, E., Giommi, P., Leto, C., et al. Roma-BZCAT: a multifrequency catalogue of blazars A&A, 2009, 495, 691
- (28) Pursimo, T., Ojha, R., Jauncey, D. L., et al. The Micro-Arcsecond Scintillation-Induced Variability (MASIV) Survey. III. Optical Identifications and New Redshifts ApJ, 2013, 767, 14
- (29) Richards, J. L., Max-Moerbeck, W., Pavlidou, V., et al. Blazars in the Fermi Era: The OVRO 40 m Telescope Monitoring Program, ApJS, 2011, 194, 29
- (30) Vaughan, S., Edelson, R., Warwick, R. S., & Uttley, P. On characterizing the variability properties of X-ray light curves from active galaxies 2003, MNRAS, 345, 1271
- (31) Bhatta, G., & Webb, J. Microvariability in BL Lacertae: “Zooming” into the Innermost Blazar Regions, Galaxies, 2018, 6, 2
- (32) Leahy, D. A., Elsner, R. F., & Weisskopf, M. C. On searches for periodic pulsed emission - The Rayleigh test compared to epoch folding ApJ 1983, 272, 256
- (33) Davies, S. R. An improved test for periodicity MNRAS, 1990, 244, 93
- (34) Davies, S. R. Davies Periodicity Test Revisited MNRAS, 1991, 251, 64P
- (35) Zhang, B.-K., Zhao, X.-Y., Wang, C.-X., & Dai, B.-Z. Optical quasi-periodic oscillation and color behavior of blazar PKS 2155-304 RAA, 2014, 14, 933-941
- (36) Larsson, S. Parameter estimation in epoch folding analysis, A&AS, 1996, 117, 197
- (37) Lomb, N. R. Least-squares frequency analysis of unequally spaced data, Ap&SS, 1976, 39, 447
- (38) Scargle, J. D. Studies in astronomical time series analysis. II - Statistical aspects of spectral analysis of unevenly spaced data ApJ, 1982, 263, 835
- (39) VanderPlas, J. T. Understanding the Lomb–Scargle Periodogram 2018, ApJS, 236, 16
- (40) Edelson, R. A., & Krolik, J. H. The discrete correlation function - A new method for analyzing unevenly sampled variability data, ApJ, 1988 333, 646
- (41) Villata, M., Raiteri, C. M., Aller, H. D., et al. The WEBT campaigns on BL Lacertae. Time and cross-correlation analysis of optical and radio light curves 1968-2003 2004, A&A, 424, 497
- (42) Press, W. H. Flicker noises in astronomy and elsewhere Comments on Astrophysics, 1978, 7, 103
- (43) Uttley, P., McHardy, I. M., & Papadakis, I. E. Measuring the broad-band power spectra of active galactic nuclei with RXTE MNRAS, 2002, 332, 231
- (44) Timmer, J., & Koenig, M. On generating power law noise A&A 1995, 300, 707
- Emmanoulopoulos et al. (2013) Emmanoulopoulos, D., McHardy, I. M., & Papadakis, I. E. Generating artificial light curves: revisited and updated MNRAS, 2013, 433, 907
- (46) Valtonen, M. J., Lehto, H. J., Takalo, L. O., et al. Testing the 1995 binary black hole model of OJ287 ApJ, 2011, 729, 33–38
- (47) Komossa, S. Observational evidence for binary black holes and active double nuclei, MmSA 2006, 77, 733
- Begelman et al. (1980) Begelman, M. C., Blandford, R. D., & Rees, M. J. Massive black hole binaries in active galactic nuclei, Nature, 1980, 287, 307
- Sillanpaa et al. (1988) Sillanpaa, A., Haarala, S., Valtonen, M. J., Sundelius, B., & Byrd, G. G. OJ 287 - Binary pair of supermassive black holes ApJ, 1988, 325, 628
- (50) Peters, P. C. Gravitational Radiation and the Motion of Two Point Masses Physical Review, 1964, 136, 1224
- (51) Kharb, P., Lal, D. V., & Merritt, D. A candidate sub-parsec binary black hole in the Seyfert galaxy NGC 7674 Nature Astronomy, 2017, 1, 727
- (52) Ackermann, M., Ajello, M., Albert, A., et al. Multiwavelength Evidence for Quasi-periodic Modulation in the Gamma-Ray Blazar PG 1553+113 ApJL, 2015, 813, L41
- (53) Camenzind, M., & Krockenberger, M. The lighthouse effect of relativistic jets in blazars - A geometric origin of intraday variability A&A 1992, 255, 59
- (54) Mohan, P., & Mangalam, A. Kinematics of and Emission from Helically Orbiting Blobs in a Relativistic Magnetized Jet ApJ, 2015, 805, 91
- (55) Rieger, F. M. Supermassive binary black holes among cosmic gamma-ray sources Ap&SS 2007, 309, 271
- Urry & Padovani (1995) Urry, C. M., & Padovani, P. Unified Schemes for Radio-Loud Active Galactic Nuclei PASP, 1995, 107, 803
- Blandford & Payne (1982) Blandford, R. D., & Payne, D. G. Hydromagnetic flows from accretion discs and the production of radio jets MNRAS, 1982, 199, 883
- (58) Stella, L., & Vietri, M. Lense-Thirring Precession and Quasi-periodic Oscillations in Low-Mass X-Ray Binaries ApJL, 1998, 492, L59
- (59) Motta, S., Muñoz-Darias, T., Casella, P., Belloni, T., & Homan, J. Low-frequency oscillations in black holes: a spectral-timing approach to the case of GX 339-4 MNRAS, 2011, 418, 2292
- (60) Liska, M., Hesp, C., Tchekhovskoy, A., et al. Formation of precessing jets by tilted black hole discs in 3D general relativistic MHD simulations MNRAS, 2018, 474, L81
- (61) Graham, M. J., Djorgovski, S. G., Stern, D., et al. A systematic search for close supermassive black hole binaries in the Catalina Real-time Transient Survey MNRAS, 2015, 453, 1562
- (62) Li, L.-X., & Narayan, R. Quasi-periodic Oscillations from Rayleigh-Taylor and Kelvin-Helmholtz Instability at a Disk-Magnetosphere Interface ApJ, 2004, 601, 414
- (63) Fu, W., & Lai, D. Dynamics of the innermost accretion flows around compact objects: magnetosphere-disc interface, global oscillations and instabilities MNRAS, 2012, 423, 831
- (64) McKinney, J. C., Tchekhovskoy, A., & Blandford, R. D. MNRAS, 2012, 423, 3083
Samples of the compounds …… are available from the authors.