Density Changes in Low Pressure Gas Targets for Electron Scattering Experiments
Abstract
A system of modular sealed gas target cells has been developed for use in electron scattering experiments at the Thomas Jefferson National Accelerator Facility (Jefferson Lab). This system was initially developed to complete the MARATHON experiment which required, among other species, tritium as a target material. Thus far, the cells have been loaded with the gas species 3H, 3He, 2H, 1H and 40Ar and operated in nominal beam currents of up to A in Jefferson Lab’s Hall A. While the gas density of the cells at the time of loading is known, the density of each gas varies uniquely when heated by the electron beam. To extract experimental cross sections using these cells, density dependence on beam current of each target fluid must be determined. In this study, data from measurements with several beam currents within the range of to A on each target fluid are presented. Additionally, expressions for the beam current dependent fluid density of each target are developed.
keywords:
target , , tritium , helium , deuterium , hydrogen , argon1 Introduction
A modular gas cell target system was developed for use in Jefferson Lab’s Hall A for the MARATHON experiment E12-10-103 [1]. The design was specifically developed to safely contain and operate with gaseous tritium. The modular design allows gas cells filled with other species of gas to be installed in the system concurrently. The target was also adapted for experiments E12-11-112 () [2], E12-14-011 () [3, 4], E12-17-003 (Hypernuclear) [5] and E12-14-009 (elastic) [6]. MARATHON, together with these experiments, became known as the tritium group of experiments and were performed from December 2017 through November 2018. Prior to the tritium group of experiments operations, a target cell of this same design was filled with argon gas and used by experiment E12-14-012 (Argon) [7, 8] during Spring of 2017.
While the performance of the target was an important consideration, the primary objective of the target system design and construction was to ensure safe operations with tritium gas under all conditions. These conditions included target cell preparations, loading, storage, transportation, installation, removal, and beam operations. This was accomplished with a modular design, rigorous fabrication and testing, proper quality assurance and quality control, and multiple layers of containment/confinement.
In addition to describing of the target, we present the beam current dependent density of the five gases used with the target system, 3H, 3He, 2H, 1H and 40Ar. The electron beam deposits energy in the cell end caps as well as in the target fluid. This ionization energy, which is proportional to the beam current, heats the target fluid causing local changes in the density. To determine the magnitude of this effect, data were collected with the left high resolution spectrometer (LHRS) in Jefferson Lab Experimental Hall A during February 2017 for the 40Ar target and December 2017 for the other targets. The beam energy for the study was GeV in all cases, The angle and momentum settings were and GeV for 40Ar, and and GeV for the other fluids. Analysis shows that a simple quadratic polynomial function normalized to zero current provides an excellent descriptive fit function for all target fluids.
2 Target System
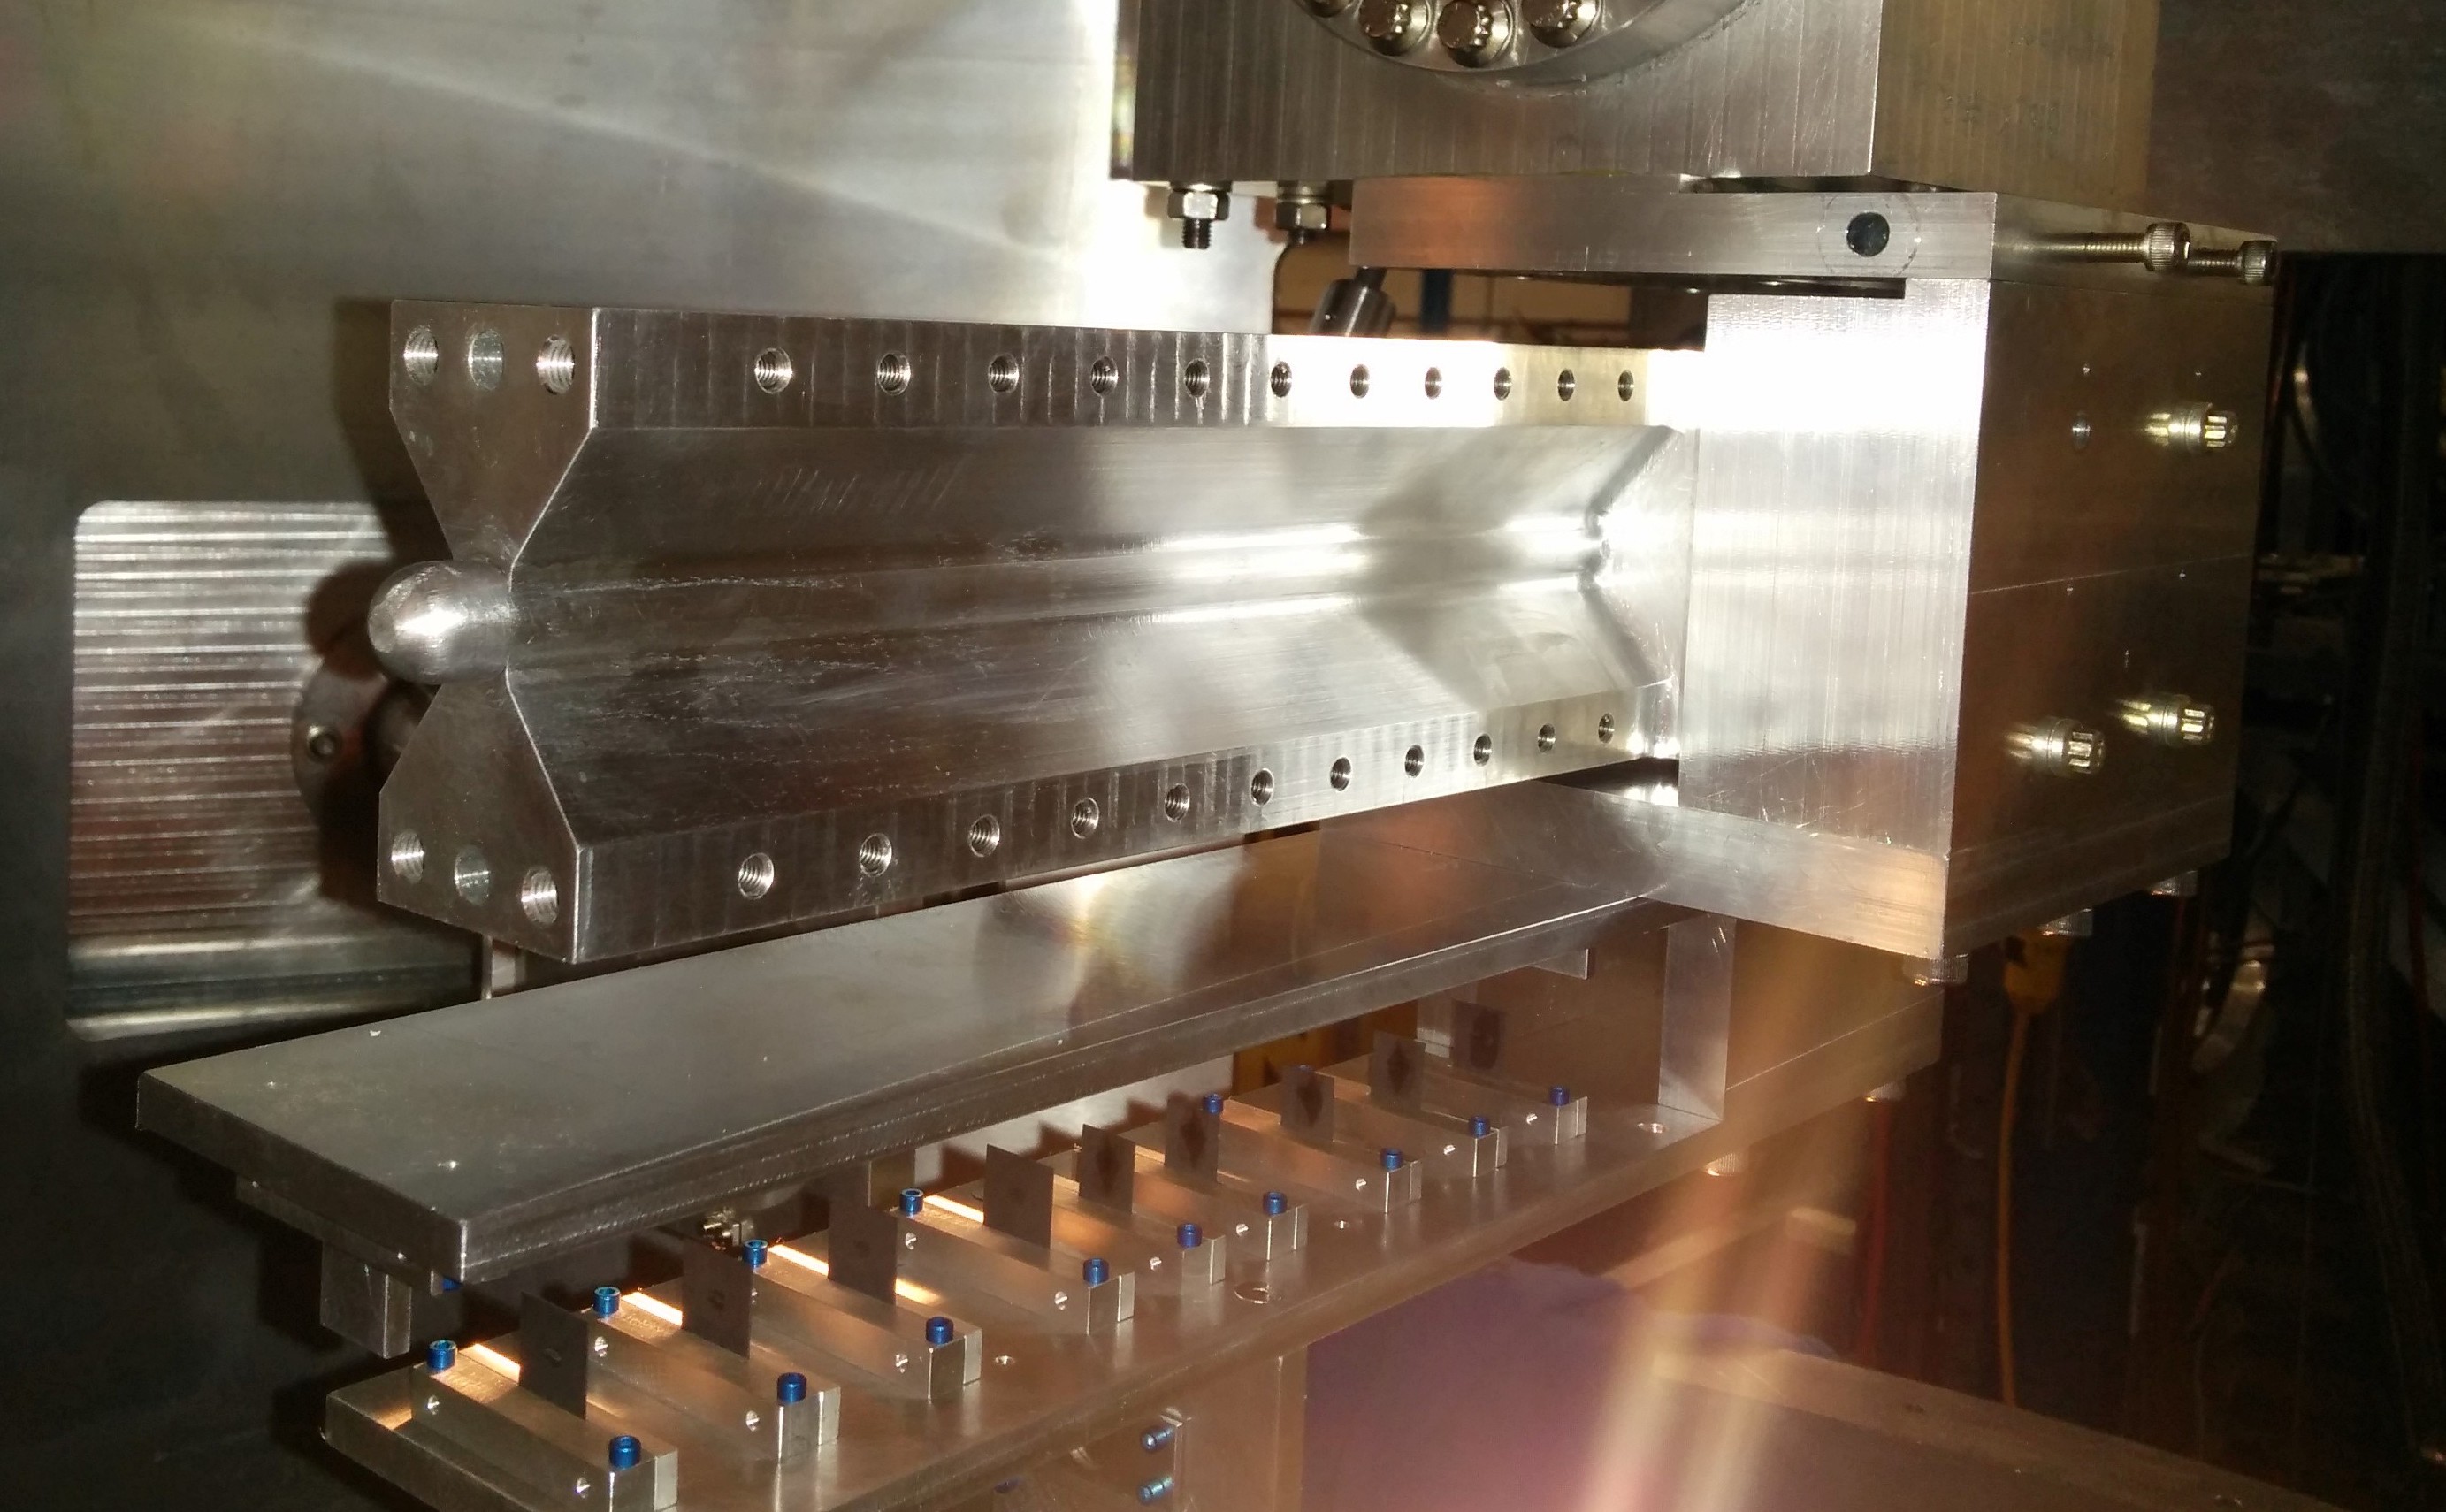
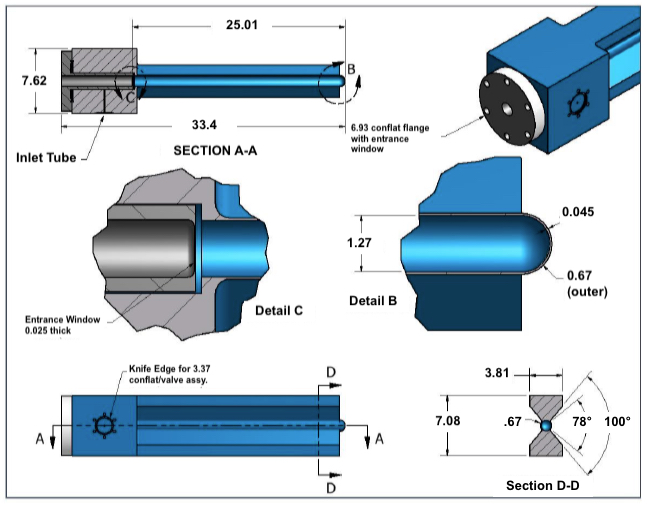
The modular design allows for multiple cell configurations. It also enables individual cells to be installed in special configurations of the standard Hall A cryogenic target such as the 40Ar target (see Fig. 1). Another feature is that it allows cells to be filled at off-site locations. The tritium cell was filled at Savannah River Site (SRS) by Savannah River Tritium Enterprises (SRTE), with 0.1 grams of tritium gas to a room temperature absolute pressure of 1.38 MPa. It was shipped in a special purpose transport container called the bulk tritium shipping package (BTSP). Including the cell this system provided continuous triple layer confinement throughout the shipping and handling process. This design also allowed the tritium cell to be placed in a storage container in Hall A while normal Hall installation activities were completed. The tritium cell was installed after all other preparatory tasks were completed. The modular sealed gas cell represents a departure from previous designs [9]. Fig. 2 shows the design of the gas cell design. This design is similar to the design proposed in Ref. [10] with engineering details for the construction and loading of these cell in Ref. [11]. .
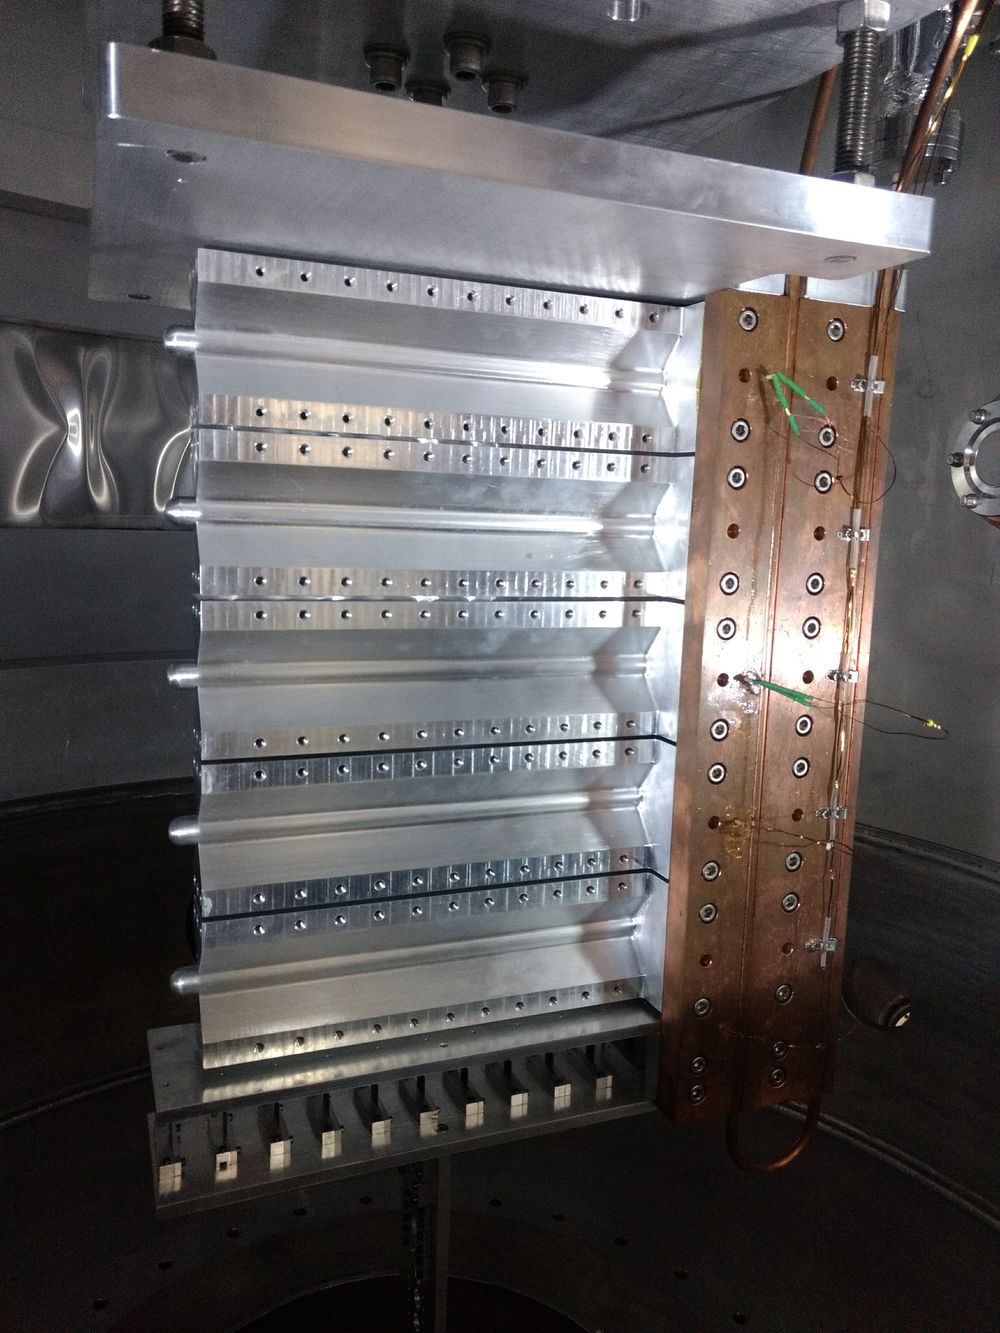
The configuration of the target system for the tritium experiments is shown in Fig. 3. In this configuration, there are (from top to bottom) four cells loaded with 3H, 2H, 1H, and 3He as well as a fifth empty cell which was used for background measurements. The cells are contained in a scattering chamber which is under vacuum. The scattering chamber vacuum is isolated from the upstream beam line vacuum by a 0.2 mm thick beryllium window. This window is roughly 30 cm upstream of the target center and is mounted on a reentrant tube that also contains a 15 cm long tungsten collimator with an inner diameter of 12.7 mm. The scattering chamber vacuum, with a pumping system directed to an exhaust stack, provided a second layer of tritium confinement. An exhaust system, (together with strict access controls) capable of maintaining a slight negative pressure in the experimental Hall ensured that the Hall boundary was a third layer of confinement.
Each cell is machined from ASTM B209 aluminum 7075-T651 plate. Each target cell has a cylindrical fluid space with a length of 25 cm and a diameter of 12.7 mm. The total volume of the cell (including the non-active region) is cm3. The thickness of the nearly flat entrance window and hemispherical exit window is nominally 0.25 mm. The parameters at the time of loading for each cell are summarized in Table 1.
Due to machining tolerances, the wall thickness of each cell varies slightly over its length. Thickness measurements were performed for each cell at several locations as schematically represented in Fig. 4 and summarized in Table 2. These measurements were performed with a Magna Mike 8600 Hall effect thickness gauge which provides a relative uncertainty of 0.001 mm and an absolute uncertainty of 0.007 mm. The error shown in the Table 2 indicates the standard deviation of multiple measurements in a 2 mm radius for a given location. The 40Ar cell, installed in February 2017, was later evacuated and installed as the empty cell for the tritium group of experiments, so Table 2 shows the 40Ar and the empty cell in a single column.
Once installed in the Hall A scattering chamber, the target cells were cooled to 40 K with the temperature maintained using a 15 K helium supply and a controlled heater. This cooling was required to removed the modest amount of heat generated by the electron beam passing through the target fluid, cell entrance and cell exit, which, in total, was about 15 W. To ensure cell integrity, the maximum beam current permitted on any of the cells was A [11]. The heat generated by the tritium decay is very small, about 50 mW.
| Target | Fill Pressure | Fill Temp | Thickness |
|---|---|---|---|
| (kPa) | (K) | (mg/cm2) | |
| 40Ar | |||
| 3H | |||
| 3H | |||
| 3He | |||
| 2H | |||
| 1H |

| Location |
|
|
|
|
|
||||||||||
|---|---|---|---|---|---|---|---|---|---|---|---|---|---|---|---|
| Entrance | |||||||||||||||
| Exit | |||||||||||||||
| Exit left | |||||||||||||||
| Exit right | |||||||||||||||
| Mid left | |||||||||||||||
| Mid right | |||||||||||||||
| Entrance left | |||||||||||||||
| Entrance right |
3 Hall A Spectrometers
The data were acquired with the left high resolution spectrometer (LHRS). For a detailed description of the LHRS see Ref. [12]. The basic components of the LHRS are a normal conducting quadrupole (Q1), a superconducting quadrupole (Q2), a superconducting dipole (D), and a superconducting quadrupole (Q3) in a Q-Q-D-Q configuration. The quadrupoles focus scattered charged particles while the dipole bends these particles, within a given momentum range, to the detectors. After passing through the spectrometer magnets, the scattered particles pass through two vertical drift chambers (VDCs) that provide tracking information [13]. Two layers of scintillator hodoscopes, s0 and s2, are on either side of a gas Cherenkov detector filled with CO2 [14]. The hodoscopes provide trigger and time of flight for the detected particles. The Cherenkov provides identification of electrons with approximately efficiency and reject below a momentum of 4.8 GeV/c. The last element in the detector stack is the shower calorimeter. Electrons passing through the calorimeter lead glass blocks induce a cascade of pair production and bremsstrahlung radiation from which their energy can be determined [12].
4 Beam Current Monitor
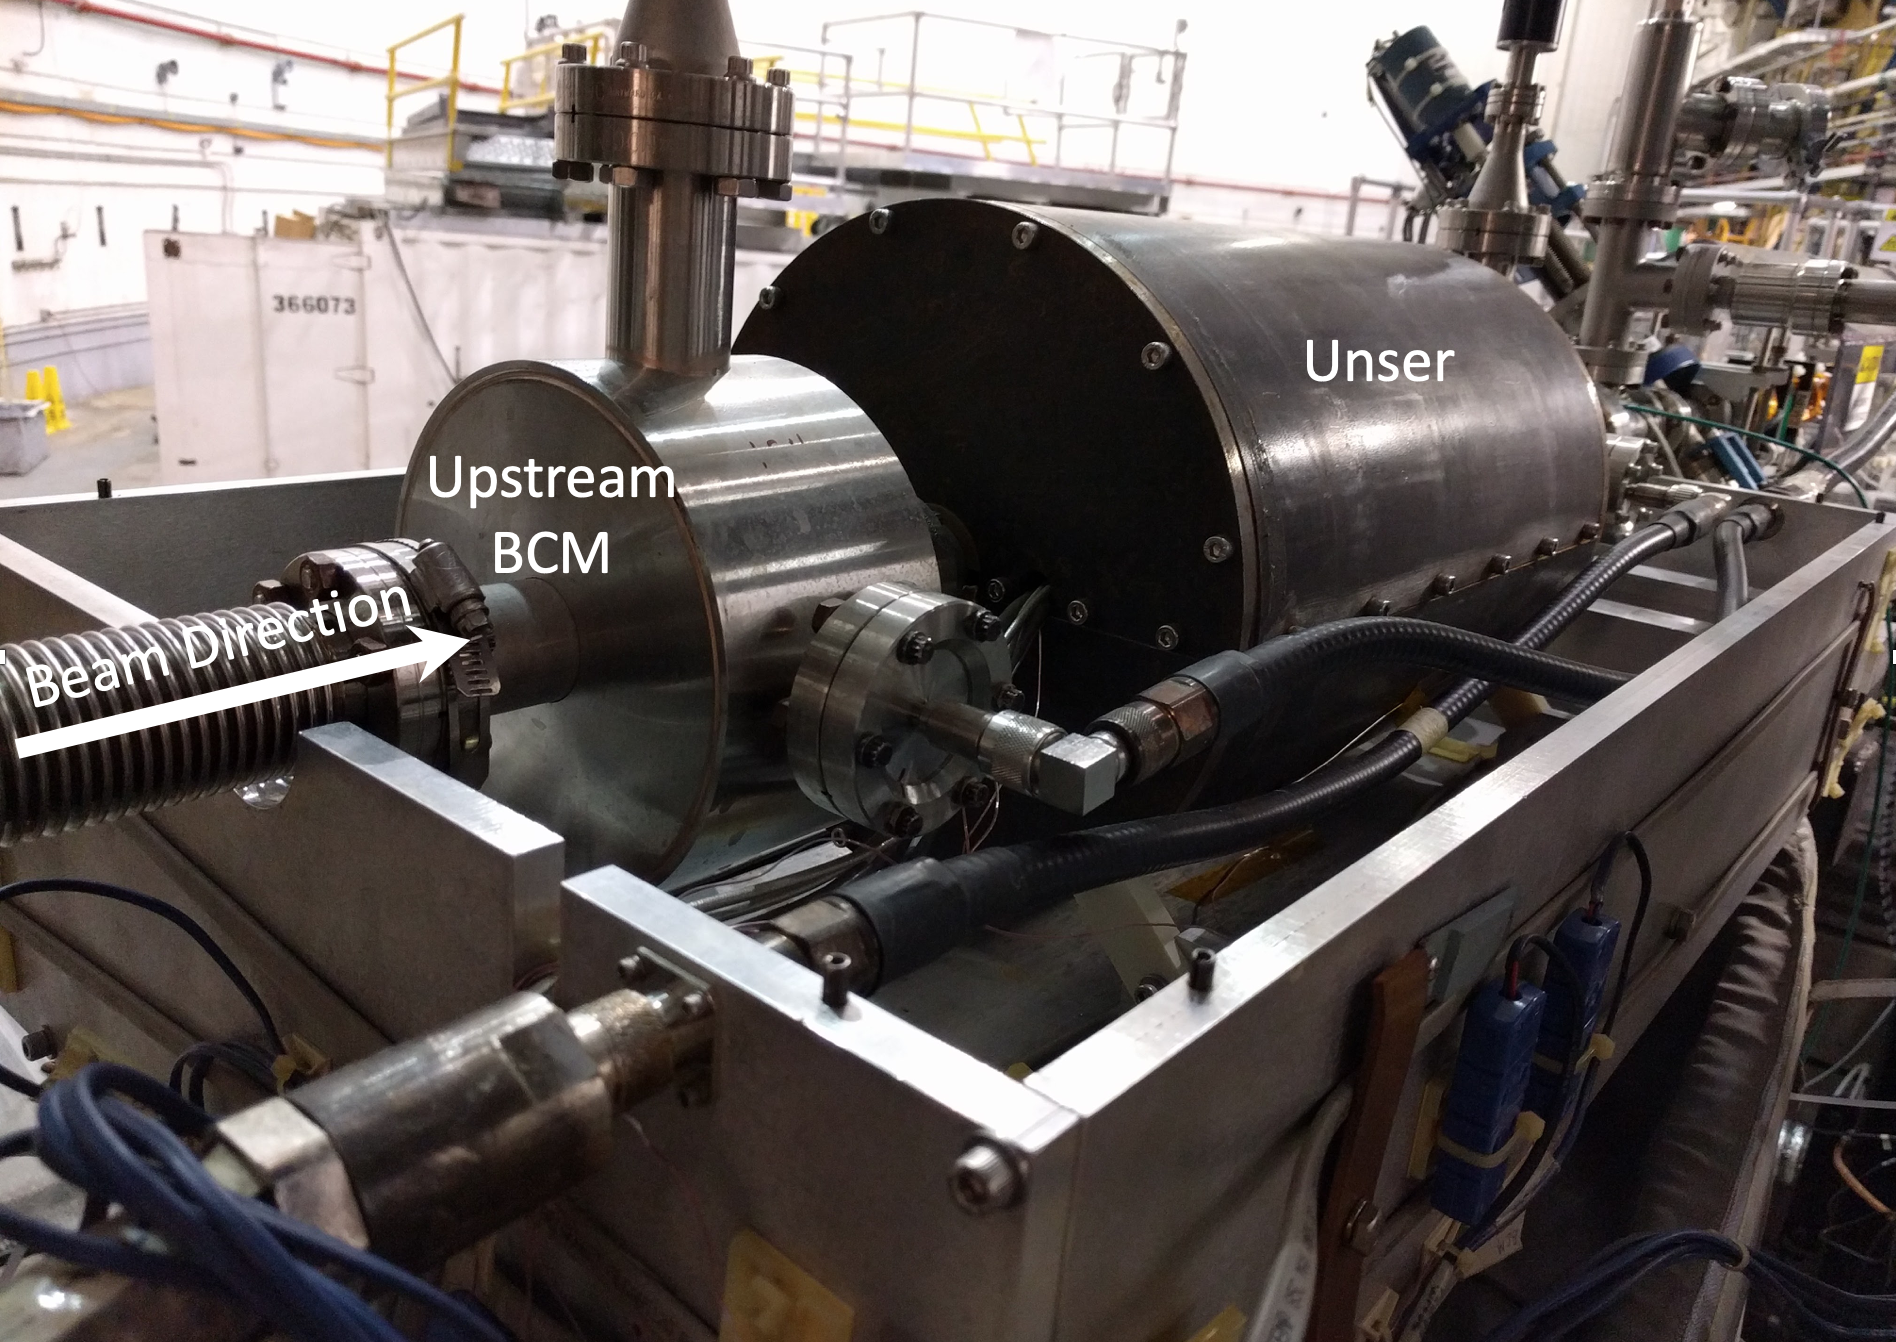
The beam current monitor (BCM) is a system of three independent devices and a current source [15]. This is a dedicated system in Hall A and while independent of the target effects, this system is the dominant source of systematic uncertainty in the current dependent density studies presented herein. The BCM system consists of a toroidal sensor (Unser) [16], located between upstream and downstream RF cavities, and a data-acquisition system. A current source, which is connected to a wire which passes through the Unser, is used to calibrate the Unser immediately prior to each use of the device and the Unser is then used to calibrate the BCMs with the electron beam.
The Unser monitor is composed of two identical toroidal coils driven in opposite directions by an external source. The DC component of the current flowing through the toroid sensor is detected by a magnetic modulator. The beam current passing through the cores produces a flux imbalance, which generates an output signal proportional to the even harmonics of the frequency of excitation, In the absence of a DC current, the sum of the signals is zero [15].
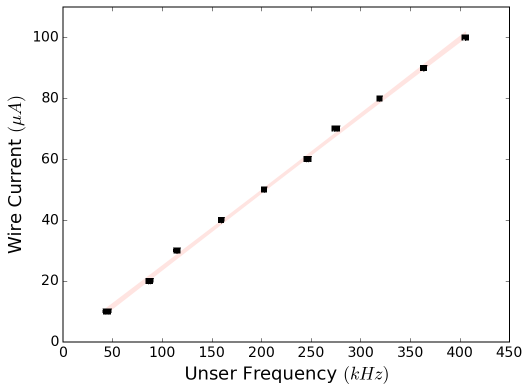
The temperature controlled Unser has a sensitivity to beam current of about 4 A and has a DC offset subtracted stability within [15]. The systems DC offset does slowly drift, necessitating the current calibration to be done immediately prior to using it for an absolute current calibration of the RF cavities. Once calibrated, the RF cavities are used to continuously monitor the beam current. The calibrations are checked periodically throughout the course of an experiment. To put the signals from the Unser and RF cavities into the scalers of Hall’s fast data acquisition system, a voltage to frequency (V/F) converter is used along with a discriminator. Figure 5 shows the Unser calibration with a known DC current source, the response of the system is found to be ( A/Hz.
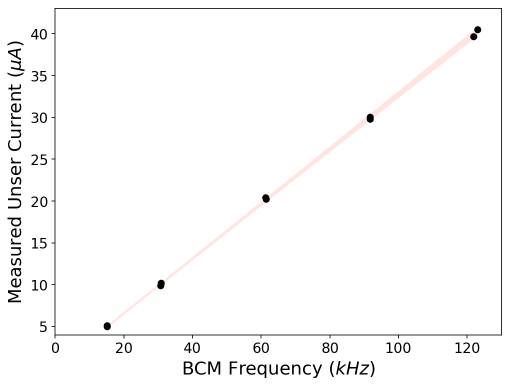
The beam current monitors (BCM) are 1497 MHz resonant cavities located immediately before and after the Unser and are used to continuously monitor the beam currents in Hall A (see Fig. 6). The cavities are composed of loop antennas located where the magnetic field is maximum. When the beam passes through, the output RF signal is proportional to the current [15]. As consequence, the BCM response is linear with respect to the current. Like the Unser, the signals from the RF cavities are filtered by a V/F converter. Several values of beam current (measured by the calibrated Unser) are used to the determine the linear dependence of the BCM as shown in Fig. 7. In general, the beam current can be then calculated using
| (1) |
where and are the fit parameters, which correspond to ( A/Hz and , respectively. Finally, for any given beam induced frequency , the current is given by Eq. 1. Unfortunately the BCM system becomes much less accurate for beam currents below A.
5 Method Overview
The density of the target is well known when loaded but experience and simulations have shown that the beam current will decrease the local density of the target fluid in the beam path. The magnitude of this effect depends on the beam current and target fluid species and must be quantified to accurately determine cross sections, ratios and other comparisons of data collected with the multiple gas cells [17]. It was shown (with the exception of the argon cell) that the target density reaches equilibrium within a few seconds from when the electron beam first impinges on the cell and the density was constant with stable beam current. The purpose of these measurements and analysis is to develop a calibration of the target density as a function of beam current for each gas species.
In order to extract the current dependent density correction, the LHRS is used to measure the event rate for several beam currents. The normalized yield is determined by applications of corrections to the raw event rate. These corrections include: integrated charge during the measurement, particle identification, acceptance cuts, detector efficiencies, and live times. The normalized yield is then given by
| (2) |
where is the number of good electrons, is the prescale factor of the DAQ system, is the integrated charge, and is the combined efficiency of the detectors, triggers and events selection cuts and is the live-time. Each one of these parameters is explained in detail in the following sections.
5.1 Event Selection
To improve counting efficiency and maximize live time, a compound trigger was used. This trigger required both scintillator planes and the Cherenkov detector to have signals above threshold in order to exclude events. To extract a good electron sample, several cuts were applied to the data. These cuts can be summarized in two groups: acceptance cuts, which assure that the events are selected within an acceptable spectrometer phase space, and tracking/particle identification (PID) cuts, which focus on the selection of electrons scattered from the target fluid. These selection cuts are:
-
i.
Momentum and angular acceptance cuts: Specifically, the ranges used to determine are , mrad and mrad.
-
ii.
Target length cut: This cut excluded events reconstructed back to the target windows and reduced background by limiting the effective target length cm
-
iii.
Only events with a single track in the VDC were kept.
-
iv.
A particle ID cut was applied to the Cherenkov ADC sum
-
v.
A particle ID cut was applied to the shower calorimeter
With these particle selection cuts, we found that the results remained stable within 1 run to run. The cut for the reaction vertex was chosen such that the contamination from the aluminum end-caps was smaller than 2%. The systematic effects of the aluminum background events were studied for all the targets are included in the systematic uncertainties.
5.2 Estimation of Efficiencies
A number of efficiencies were applied to the data to produce . For simplicity, in this analysis only electron events with one track in the VDC were selected. The ratio between the total number of electron events with one track and the total number of triggered electrons (including multi-track and non-track particles) defines the VDC efficiency.
The trigger efficiency was calculated using another trigger type, where only both scintillators were required to record the events. In this sense, the difference between the main trigger and the efficiency trigger is the Cherenkov detector. The ratio between the events recorded with the main and the efficiency trigger corresponds to the trigger efficiency.
The Cherenkov efficiency was calculated by selecting a sample of electrons detected in the calorimeter and determining the number of events that also were detected in the Cherenkov detector. The calorimeter efficiency was measured by selecting a sample of electrons in the Cherenkov detector and counting the number of these electrons that also fired the calorimeter.
For these measurements, the trigger, Cherenkov, and calorimeters efficiencies were . The tracking efficiency was dependent on the absolute rate in the LHRS and varied for 97 to 99%.
5.3 Live-Time Calculation
The live-time is related with the limitation of the speed of data acquisition system (DAQ) to record events. It depends on the electronics, computers and trigger rate and is calculated using the ratio of the number of events recorded over the total number of events seen by the trigger. Typical values for the live-time ranged 93-97% depending the trigger rate in the left LHRS as well as the DAQ prescale setting.
5.4 Total Charge
The beam is not completely stable throughout the run; it may trip off or fluctuate over time. Therefore, we obtained the calibration data when the beam was mostly stable, and only runs where the average current is within a window of A of the requested current are used. The charge is calculated by integrating the current over time using the BCM calibration result (see Section 4).
6 Solid Target Check
The aim of the analysis is to measure the density change when the beam is on the gas targets using the yield analysis. In order to test the method, the same analysis is applied to a solid target. The 40Ar experiment used a carbon foil while for the Tritium experiments used an aluminum target. Unlike the fluid targets, the solid target density is not measurably affected by the beam current.
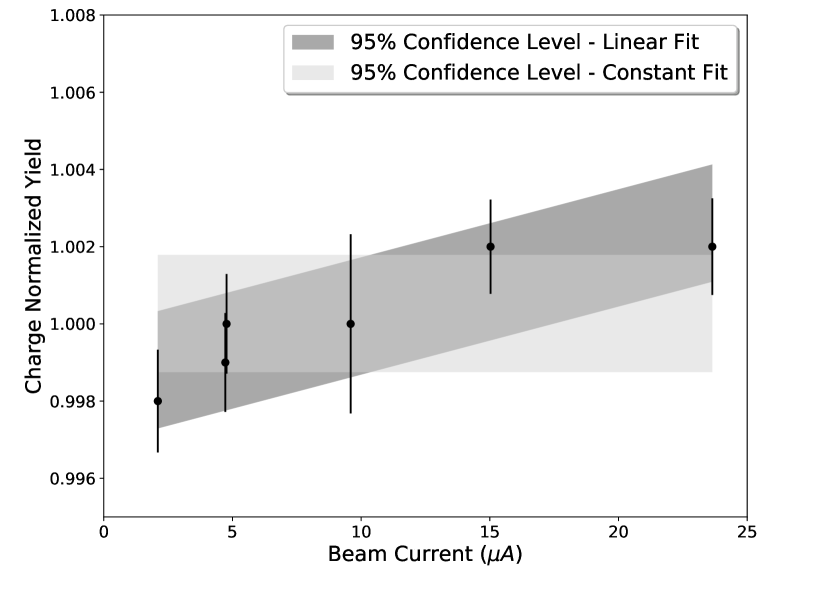
Figure 8 shows for the solid aluminum target which was calculated using Eq. 2 for different beam currents. It was normalized with respect to the lowest current yield value. The plot shows that did not change to within about 0.5 at the 95% confidence level which is well within the uncertainty of the measurement.
7 Background Contamination
The aluminum windows of the target cell contribute a background to the measured raw yield for each of the gas targets. To measure this background (henceforth referred to as contamination) in the case of the 40Ar experiment, a dummy target with aluminum foils with total thickness matching the radiation length of the argon filled cell was used. In the case of the tritium experiments, an empty cell (or dummy cell) was used. The normalized yields from these targets were then subtracted from the applicable . To check the current dependence of this subtraction, a comparison between the background at low and high current was measured for the dummy/empty targets. The charge yield given by Eq. 1 was binned in segments along the target length, and the ratio of the events at high current to low current was determined. The ratio was found to be 1.006, which indicates that the background subtraction is independent of current, as expected.
‘
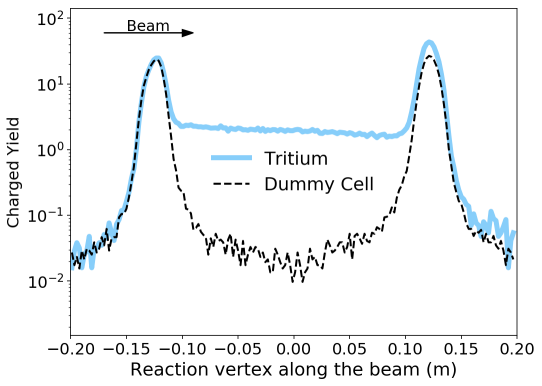
Figure 9 shows the spectra of the charge normalized yield for the empty (or dummy) cell and the tritium gas, for a beam current of . To optimize the signal to background ratio, events contributing to the were selected from a symmetric region of about the center of the target. Therefore, the contamination fraction is the ratio of for the empty cell to for the gas cell of interest. Table 3 summarizes the percentage of background contamination found in the gas targets for each beam current used in the study.
|
|
|
|
|
|
|
||||||||||||||
|---|---|---|---|---|---|---|---|---|---|---|---|---|---|---|---|---|---|---|---|---|
| 2.5 | 1.7 | 1.6 | 0.7 | 1.1 | 2.5 | 0.3 | ||||||||||||||
| 5 | 1.7 | 1.6 | 0.7 | 1.2 | 4.5 | 0.3 | ||||||||||||||
| 10 | 1.7 | 1.7 | 0.8 | 1.2 | 8 | 0.3 | ||||||||||||||
| 15 | 1.8 | 1.8 | 0.8 | 1.3 | 12 | 0.3 | ||||||||||||||
| 22.5 | 1.8 | 1.8 | 0.8 | 1.3 | 15 | 0.3 | ||||||||||||||
| 18 | 0.3 |
8 Gas Target Results
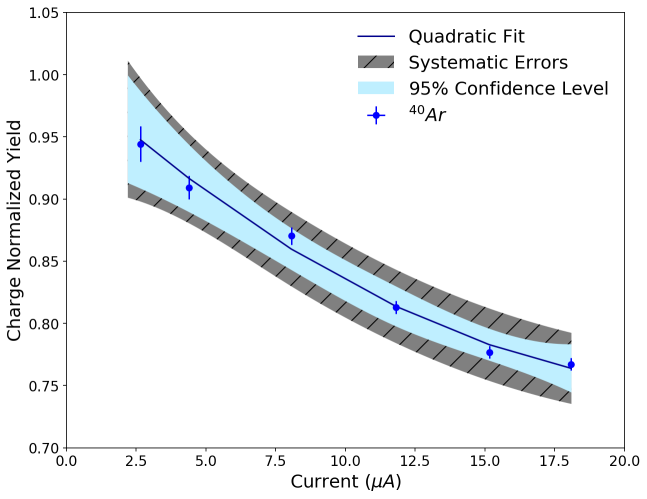
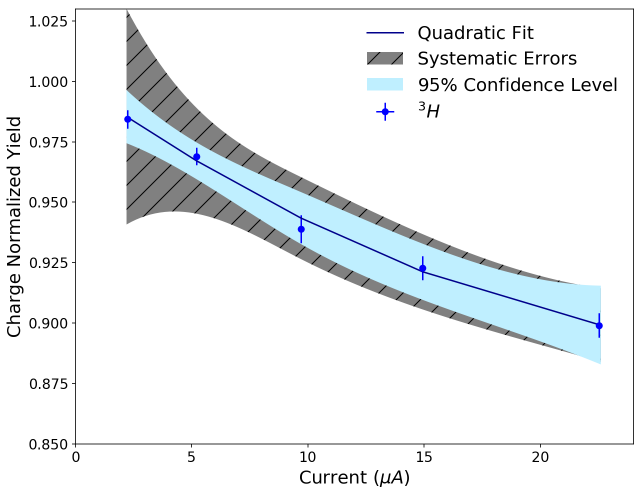
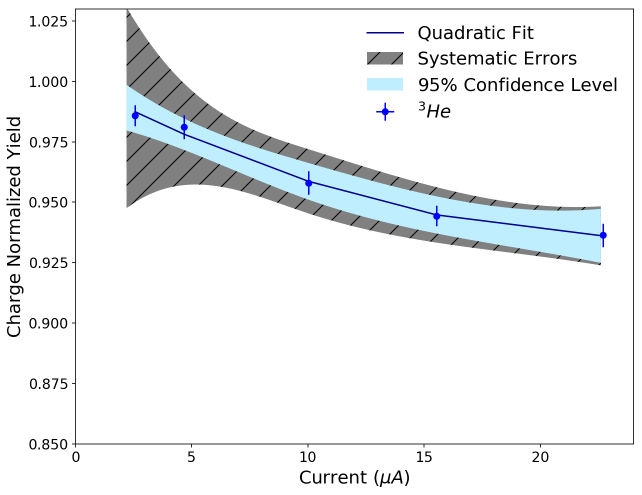
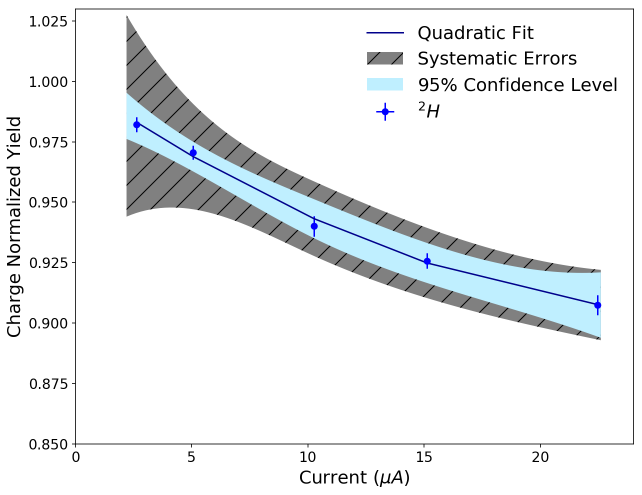
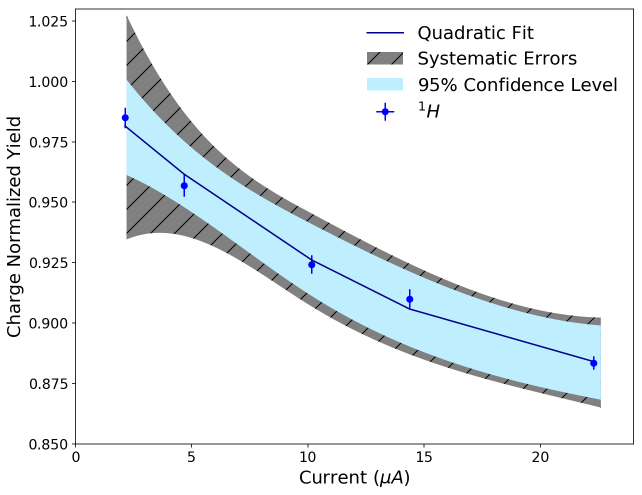
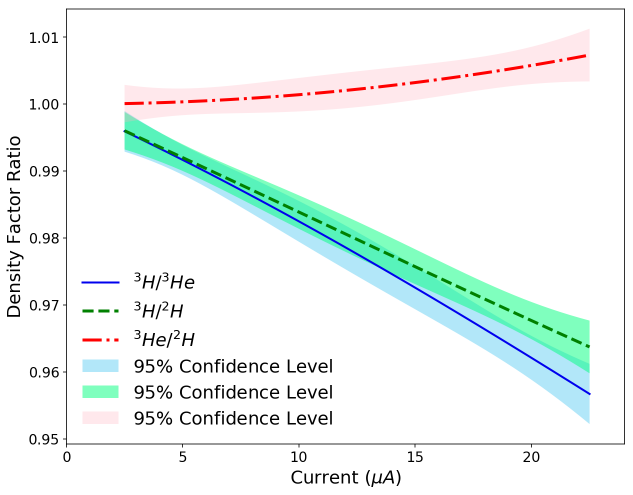
The density correction was determined for each gas species by measuring as a function of beam current . The function is then normalized to for . The density each gas cell for zero beam current is the same as that of the load density. Figures 10, 11(a), 11(b), 11(c) and 11(d) show the density correction for the different gas targets. It is easily seen that the density decreases with the current and that the behavior of the density correction factor is modeled well by a quadratic function
| (3) |
where , and are the fit parameters. Table 4 shows the fit parameters for each gas species. The density correction factor is determined for each gas by substitution of these parameters in Eq. 3. The density correction factor determined in this manner is valid for the current range . The error bar in the plots represents the statistical uncertainty only, and a fit was calculated with respect to those values with a confidence band in blue. The gray hatched confidence band represents a fit including both statistical and systematic uncertainties. Since many data analyses require ratios of different targets, we also provide the ratio of the density changes, shown in Fig. 12.
| 3H Fit Parameters | 3H Correlation Factors | ||
| a | C(a, b) | ||
| b | C(b, c) | ||
| c | C(a, c) | ||
| 3He Fit Parameters | 3He Correlation Factors | ||
| a | C(a, b) | ||
| b | C(b, c) | ||
| c | C(a, c) | ||
| 2H Fit Parameters | 2H Correlation Factors | ||
| a | C(a, b) | ||
| b | C(b, c) | ||
| c | C(a, c) | ||
| 1H Fit Parameters | 1H Correlation Factors | ||
| a | C(a, b) | ||
| b | C(b, c) | ||
| c | C(a, c) | ||
| 40Ar Fit Parameters | 40Ar Correlation Factors | ||
| a | C(a, b) | ||
| b | C(b, c) | ||
| c | C(a, c) | ||
8.1 Systematic Uncertainties
Several corrections are applied to the data in this analysis, and since the current is different for every point, the uncertainties are evaluated at every point. Confidence bands for each fit including the systematic uncertainties are shown in Fig. 10, 11(a), 11(b), 11(c) and 11(d). They include the uncertainty in the charge, live-time and detector efficiencies.
The BCM monitors are effective over a range from 0 to 100 A. However, low current measurements have a slightly higher uncertainty causing the uncertainty in the charge to be current dependent. The uncertainty in the current and charge is estimated using the BCM calibration shown in Fig. 7, together with the error covariance matrix. This is the dominant source of systematic uncertainty in the determination of the density reduction factor .
The background contamination coming from the entrance and exit windows is also a source of systematic uncertainty. This is due to the thickness variations in the cell entrance and exit windows which can be seen in Figure 9. Therefore, in order to calculate the background uncertainty in the measurement, the percentage of background was calculated in for the values of 4 cm, 7 cm and 10 cm from the center of the target. The same normalization procedure was followed for each of the different cuts in the reaction vertex region to calculate . Finally, the uncertainty in the background contamination is given by the standard deviation of the average of multiple obtained with the different cuts. The standard deviation was never more than 1 for each current.
Furthermore, systematic uncertainties were estimated for the live-time, VDC one-track efficiency, trigger efficiency, detector and cut efficiencies of the gas Cherenkov and rejection.
9 Summary
A novel design for low density gas targets has been used in the Jefferson Lab electron beam with a number of different gas species. These cells have proven to be extremely robust and satisfied the safety requirements necessary for holding 1 kCi of tritium gas. In this manuscript, we have shown how the local density of these cells changes when an electron beam passes through them. The 5% to 10% changes that were measured at 22.5 uA for the different gas species are consistent with the design expectations. Determination these density changes was critical for experiments using these cells for cross section measurements.
10 Acknowledgments
We wish to thank the staff of the Thomas Jefferson National Accelerator Facility for their help safely installing and removing the tritium cells. We also acknowledge the critical efforts of Savannah River Site and Savannah River Tritium Enterprises. And special thank to Marcy Stutzman for proofreading this manuscript. This work was supported by the U.S. Department of Energy (DOE) contract DE-AC05-06OR23177 under which Jefferson Science Associates operates the Thomas Jefferson National Accelerator Facility, DOE contract DE-AC02-06CH11357, DOE contract DE-SC0013615, and by National Science Foundation (NSF) Grant No. NSF PHY 1506459.
References
References
- [1] G. Petratos, et al., JLab Experiment E12-10-103 (2010).
- [2] P. Solvignon, et al., JLab Experiment E12-11-112 (2011).
- [3] O. Hen, L. B. Weinstein, S. Gilad, W. Boeglin, et al., JLab Experiment E12-14-011 (2013).
- [4] R. Cruz-Torres, et al., Comparing proton momentum distributions in nuclei via 3He and 3H measurements (2019). arXiv:1902.06358.
- [5] L. Tang, F. Garibaldi, P. E. C. Markowitz, S. N. Nakamura, J. Reinhold, G. M. Urciuoli, JLab Experiment E12-17-003 (2017).
- [6] L. S. Myers, D. W. Higinbotham, J. R. Arrington, JLab Experiment E12-14-009 (2014). arXiv:1408.5283.
- [7] O. Benhar, et al., JLab Experiment E12-14-012 (2014). arXiv:1406.4080.
- [8] H. Dai, et al., First Measurement of the Ar Cross Section at Jefferson Lab, Phys. Rev. C 99 (2019) 054608.
- [9] D. Beck, et al., A Cryogenic tritium target system for nuclear physics experiments, Nucl. Instrum. Meth. A277 (1989) 323–337.
- [10] B. Brajuskovic, T. O’Connor, R. J. Holt, J. Reneker, D. Meekin, P. Solvignon, Thermomechanical design of a static gas target for electron accelerators, Nucl. Instrum. Meth. A729 (2013) 469–473.
- [11] D. Meekins, et al., Cryogenic Tritium Gas Target for Electron Scattering Experiments, in preperation for Nucl. Instrum. and Meth. A.
- [12] J. Alcorn, et al., Basic Instrumentation for Hall A at Jefferson Lab, Nucl. Instrum. Meth. A522 (2004) 294–346.
- [13] K. G. Fissum, et al., Vertical drift chambers for the Hall A high-resolution spectrometers at Jefferson Lab, Nucl. Instrum. Meth. A474 (2001) 108–131.
- [14] M. Iodice, et al., The CO-2 gas Cherenkov detectors for the Jefferson Lab Hall-A spectrometers, Nucl. Instrum. Meth. A411 (1998) 223–237.
- [15] J. Denard, A. Saha, G. Lavessiere, High Accuracy Beam Current Monitor System for CEBAF’s Experimental Hall A, Conf. Proc. C0106181 (2001) 2326–2328.
- [16] K. B. Unser, The Parametric current transformer: A Beam current monitor developed for LEP, AIP Conf. Proc. 252 (1992) 266–275.
- [17] R. Holt, W. Korsch, D. Meekins, T. O. Connor, G. Petratos, R. Ransome, P. Solvignon, B. Wojtsekhowski, A Tritium Gas Target for Jefferson Lab (2015).