A SOFIA Survey of [C ii] in the galaxy M51 I. [C ii] as a tracer of Star Formation
Abstract
We present a [C ii] 158 m map of the entire M51 (including M51b) grand–design spiral galaxy observed with the FIFI–LS instrument on SOFIA. We compare the [C ii] emission with the total far–infrared (TIR) intensity and star formation rate (SFR) surface density maps (derived using H and 24m emission) to study the relationship between [C ii] and the star formation activity in a variety of environments within M51 on scales of 16″ corresponding to 660 pc. We find that [C ii] and the SFR surface density are well correlated in the central, spiral arm, and inter-arm regions. The correlation is in good agreement with that found for a larger sample of nearby galaxies at kpc scales. We find that the SFR, and [C ii] and TIR luminosities in M51 are dominated by the extended emission in M51’s disk. The companion galaxy M51b, however, shows a deficit of [C ii] emission compared with the TIR emission and SFR surface density, with [C ii] emission detected only in the S–W part of this galaxy. The [C ii] deficit is associated with an enhanced dust temperature in this galaxy. We interpret the faint [C ii] emission in M51b to be a result of suppressed star formation in this galaxy, while the bright mid– and far–infrared emission, which drive the TIR and SFR values, are powered by other mechanisms. A similar but less pronounced effect is seen at the location of the black hole in M51’s center. The observed [C ii] deficit in M51b suggests that this galaxy is a valuable laboratory to study the origin of the apparent [C ii] deficit observed in ultra–luminous galaxies.
1 Introduction
The [C ii] 158 m line is the main coolant of diffuse neutral interstellar gas and therefore plays a critical role in the thermal balance of the interstellar medium of galaxies (Dalgarno & McCray, 1972). Interstellar gas is heated by energetic electrons that are emitted by dust grains that absorb far–ultraviolet photons from massive stars (Spitzer, 1948). [C ii] emission is thus related to the energy input from massive stars to the interstellar medium, making it the brightest far-infrared line (Stacey et al., 1991) and an important tracer of the star formation activity in galaxies. Redshifted [C ii] line emission has been used to study the properties of unresolved galaxies in the early Universe with ALMA and NOEMA (Carilli & Walter, 2013). It is however important to study the relationship between star formation and the [C ii] emission in the local Universe, where different environments (nuclei, spiral arms, etc.) can be separated, and their relative contribution to the observed star formation tracers can be determined.
The [C ii] emission and star–formation rate have been observed to be well correlated in the Milky Way (Pineda et al., 2014), within nearby galaxies (Herrera-Camus et al., 2015), in the integrated emission of unresolved nearby galaxies (de Looze et al., 2011), and even in a sample of “normal” high-redshift galaxies (Capak et al., 2015). However, large [C ii] intensity deficits (reduced [C ii] emission for a given far-infrared (FIR) intensity) have been observed in ultra-luminous infrared galaxies (e.g. Malhotra et al., 2001; Díaz-Santos et al., 2013, 2017), which has been interpreted as [C ii] failing to trace the (possibly enhanced) star formation activity in these galaxies. The origin of this deficit remains elusive, with several possibilities being suggested in the literature that might reduce the [C ii] intensity and/or increase the FIR intensity (e.g. Graciá-Carpio et al., 2011; Kapala et al., 2017; Díaz-Santos et al., 2013; Goicoechea et al., 2015; Langer & Pineda, 2015; Smith et al., 2017). Observations of nearby galaxies provide an important opportunity to study the origin of the [C ii] deficit and its relationship to the different environments in these galaxies in detail.
In this Letter we present a complete [C ii] map of the M51 galaxy observed with the FIFI-LS instrument on SOFIA. This map was obtained as part of a Joint Impact Proposal (program ID 04_0116) that also includes a velocity resolved map of M51 obtained with the upGREAT instrument on SOFIA. In this Letter, we use the FIFI-LS [C ii] map to study the relationship of this spectral line to star formation over the entire disk of the M51, including its companion M51b (NGC5195). The velocity–resolved spectral map of M51 will be presented in a separate paper with emphasis on the gas kinematics.
M51 is a nearby grand design spiral at a distance of 8.5 Mpc (McQuinn et al., 2016), with an inclination angle of 24° (Daigle et al., 2006). It is interacting with a smaller companion galaxy, M51b , classified as a barred lenticular (SB0 pec; Sandage & Tammann 1981) and a LINER galaxy (Ho et al., 1997). Partial maps and individual positions of M51 have been presented based on observations with the KAO (Nikola et al., 2001) and ISO (Kramer et al., 2005) at resolutions of 55″ and 80″, respectively, which were insufficient to separate different environments within the galaxy. Parkin et al. (2013) presented [C ii] observations at 12″ angular resolution in M51 using the Herschel/PACS instrument, but focused only on the inner parts of M51. With the complete [C ii] map of the M51 and M51b galaxies we are able to study the relationship between the [C ii] emission and the star formation activity in a wide range of environments.
This paper is organized as follows. In Section 2 we detail the FIFI-LS observations and data reduction. We also describe the ancillary data we use to determine the star–formation rate (SFR) and total far-infrared intensity (TIR) in M51. In Section 3 we compare the [C ii], TIR intensities, and the SFR surface density in M51. We discuss the results of this comparison in Section 4, and give the conclusions of this work in Section 5.
2 Observations
2.1 FIFI-LS [C ii] observations
We present data taken on the [C ii] line around 157.8 m, with the Far Infrared Field-Imaging Line Spectrometer (FIFI–LS) instrument (Colditz et al., 2012; Klein et al., 2014) aboard the Stratospheric Observatory For Infrared Astronomy (SOFIA; Young et al., 2012). Details on the FIFI–LS instrument, observing schemes, and atmospheric correction can found in Fischer et al. (2018). Here we present data taken with the 115–203 m channel that has a 55 pixel footprint on the sky, each with a size of 12″ 12″ yielding a field–of–view of 1′1′. Each pixel is a so-called “spaxel”, which means that internally the light is dispersed spectrally (using a grating) over 16 pixels for each spaxel, providing an integral-field data cube covering a total spectral bandwidth between 1500 and 3000 km s-1, with a spectral resolution of 270 km s-1. Our data were acquired in symmetric chop mode with a full throw of 8′. The M51 map is a mosaic of 181 fields of 1′ 1′ in a grid with 30″ spacing to create half–pixel sampling and some redundancy in the data set. The on–source integration time per point is 120s. With the overheads for chopping and telescope motion, the whole map took about 15 h. We assume a diffraction–limited telescope with a point spread function (PSF) having a FWHM of 16″ (660 pc at a distance of 8.5 Mpc). The data were taken on 11 SOFIA flights in two series between February 2016 and March 2017. Data reduction was carried out using the FIFI-LS data reduction pipeline (Vacca, 2016). We fitted a linear baseline to each spectrum and integrated the emission within the [C ii] spectral region to obtain the integrated intensity map. final [C ii] map has a pixel size of 5.3″ and has a typical r.m.s. noise of erg s-1 cm-2 sr-1.
Flux calibration is established by observing standard calibration sources. The absolute amplitude calibration uncertainty is assumed to be 20%, of which 10% is the relative uncertainty from FIFI-LS seen between flight series and different calibrators, and the rest is the uncertainty in the atmospheric transmission correction. We compared the intensities of our FIFI-LS map in the inner parts of M51 to that observed with Herschel/PACS (Parkin et al., 2013) smoothed to an angular resolution that matched that of FIFI–LS. We found that the FIFI-LS fluxes are systematically lower by a factor of 1.26 compared with those from PACS. While this factor is within the uncertainties of our observations, we nevertheless apply this correction factor to the FIFI–LS intensities used in the analysis presented here.
2.2 TIR and SFR maps
We used Spitzer and Herschel mid and far–infrared continuum maps (Kennicutt et al., 2011) to derive the TIR intensity () and SFR surface density () in M51. We estimated the TIR intensity (i.e. the infrared intensity integrated between 3 and 1100 m; in units of erg s-1 cm-2 sr-1) using,
| (1) |
where all specific intensities, , are in units of in erg s-1 cm-2 sr-1 Hz-1 (Croxall et al., 2012). The surface density of recent star formation (in units of M⊙ yr-1 kpc-2) was estimated using 24m and H maps following Gallagher et al. (2018),
| (2) |
where the intensity of is in units of erg s-1 cm-2 sr-1, and in units of MJy sr-1. The H and 24m continuum maps were observed as part of the Spitzer/SAGE survey (Kennicutt et al., 2003). Both maps were smoothed with a Gaussian kernel and regridded to match the resolution and grid of the FIFI-LS [C ii] map. We estimated the rms noise of and by calculating the standard deviation in regions in the maps that are removed from the galaxy. The rms noise is M⊙ yr-1 kpc-2 for the SFR surface density, and erg s-1 cm-2 sr-1 for the TIR intensity.
| Region | # of | ([C ii]) | (TIR) | SFR |
|---|---|---|---|---|
| pixelsaaTotal number of pixels in mask. | [erg/s] | [erg/s] | [/yr] | |
| Center | 182 | 1.2 | 3.8 | 0.9 |
| Arms | 2865 | 2.5 | 9.0 | 2.5 |
| Inter–arm | 7382 | 8.5 | 4.7 | 1.2 |
| M51b | 35 | 7.0 | 8.4 | 0.2 |
| Total | 10464 | 4.5 | 1.8 | 4.8 |
3 Results
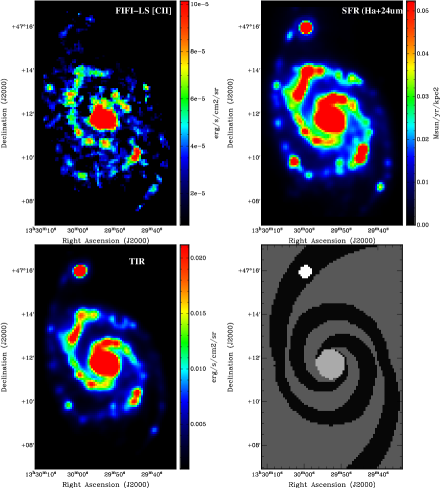
In Figure 1 we show the FIFI-LS [C ii] map of M51 together with those of and . We also include a mask that is used to separate different environments in M51. These are the center, arms, inter-arms, and the M51b companion galaxy. The arm regions were defined following a geometrical model of the spiral structure in M51 (Pineda et al. 2018, in prep.) and the center and M51b masks were defined as pixels with a K–band magnitude (tracing the stellar mass) larger than 17.2 mag and 16 mag, respectively, at 16″ resolution. All three images are morphologically similar, showing peaks at the center, northern, and southern spiral arms. The only exception is the M51b galaxy that is bright in the and maps but much fainter in the [C ii] map.
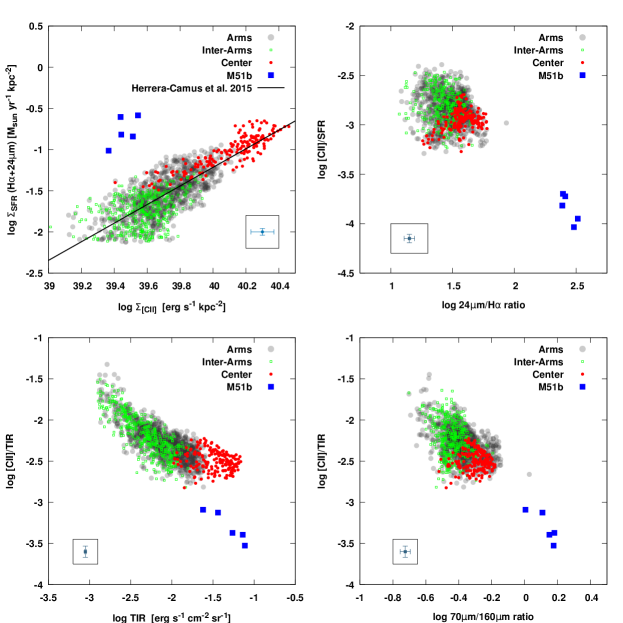
The upper left panel of Figure 2 shows a pixel-by-pixel comparison between the [C ii] luminosity per unit area observed in M51 and the SFR surface density. Data points from the different mask regions defined in Figure 1 (arms, inter–arms, center, and M51b) are color coded. We also show a straight line that corresponds to the relationship found by Herrera-Camus et al. (2015) in a sample of 46 nearby galaxies observed with Herschel/PACS. While the [C ii] intensity range of the center, spiral arms, and inter-arm regions in M51 differ, they all show a good correlation between and . The data points in these regions are also in agreement with the relationship of the galaxy sample studied by Herrera-Camus et al. (2015). However, M51b shows significantly fainter [C ii] emission with respect to the SFR surface density, suggesting a [C ii] deficit similar to that seen in ultra-luminous infrared galaxies (ULIRGS). A moderate deficit is also seen in pixels at M51’s center.
The lower left panel of Figure 2 shows the [C ii] to TIR intensity ratio as a function of the TIR intensity. The data points center, arm, and inter–arm regions are typically in the 10-3 to 10-2 range observed in normal galaxies (e.g. Kapala et al., 2015; Kramer et al., 2013). M51b, exhibits much lower values of the [C ii]/TIR, as low as 10-4. Such low values are typical of ULIRGS (Díaz-Santos et al., 2013), but note that the TIR luminosity of M51b (Table 1) is at least two orders of magnitude lower than that of typical ULIRGS.
The upper right panel of Figure 2 compares the ratio to the 24m/H ratio to study whether there are systematic differences between star forming regions in the arms and more diffuse regions in the inter-arms of M51. We find no significant difference between the 24m/H in the arm (average ratio 31.5) and inter-arm (average ratio 27.5) regions of M51. The central region has a somewhat larger 24m/H ratio of 39. However, M51b deviates significantly with an average 24m/H ratio of 276. This deviation is a result of enhanced 24m emission rather than fainter H emission. We show in the lower right panel of Figure 2, the [C ii]/TIR ratio as a function of the 70m/160m ratio, which is a proxy for the dust temperature. The arm and inter-arm regions have similar average 70m/160m ratio (0.35 and 0.4, respectively) while the central region has a slightly larger average value (0.5). M51b shows an enhanced average 70m/160m ratio of 1.3, which indicates that the reduced [C ii]/TIR ratio in this galaxy is related to an increase in dust temperature. The suggested enhancement of the dust temperature in M51b is consistent with that estimated by Mentuch Cooper et al. (2012). A similar dependence of the [C ii]/TIR ratio to dust temperature seen in Figure 2 has been observed in a larger sample of galaxies (including ULIRGS; Herrera-Camus et al., 2015; Díaz-Santos et al., 2017, 2013; Lu et al., 2015).
4 Discussion
4.1 Relative contributions from M51 environments
Table 1 presents the total [C ii] and TIR luminosities, and SFR for the different environments studied in M51. The SFR and the [C ii] and TIR luminosities in M51 are dominated by the disk of M51 (arm and inter-arm regions) representing about 75% of the total value of these quantities, even though the central region has the highest surface density. The larger luminosity in the disk of M51 is a result of these quantities being extended over a larger area than that of the central and M51b regions. This suggests that if M51 were at a greater distance, and thus were unresolved, the measured SFR and [C ii] and TIR luminosities would be dominated by the galaxy’s disk rather than by its central region.
4.2 The origin of the [C ii] deficit in M51b
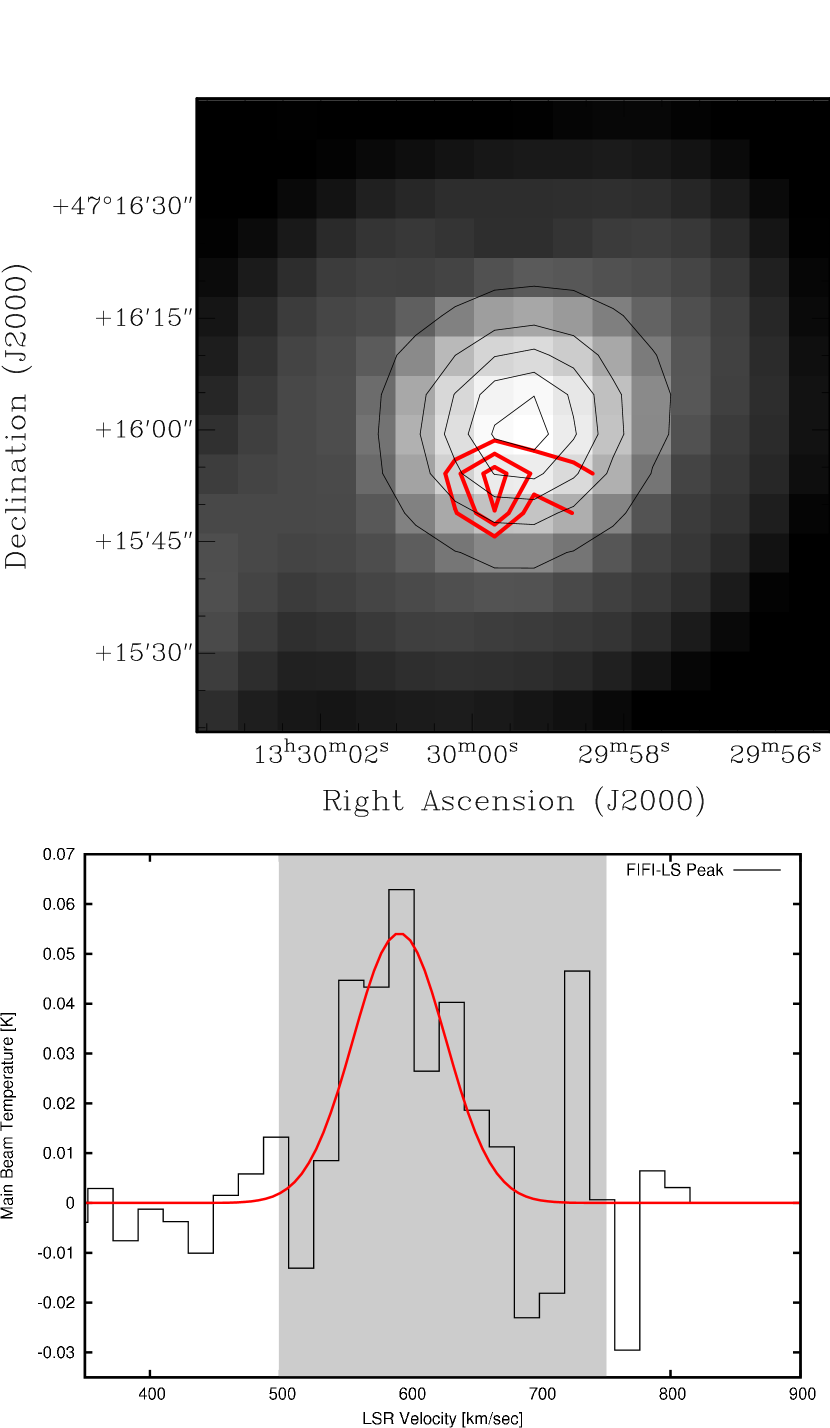
In the upper panel of Figure 3 we show [C ii] emission from M51b in the form of contours. We also show the TIR emission. While most of the TIR emission (and inferred SFR) peaks at the center of the galaxy, [C ii] shows emission only from the South–West (S–W) side of the TIR peak. CO observations show a molecular disk in M51b that extends to the S–W and North–East (N–E) from its center (Kohno et al., 2002; Alatalo et al., 2016). The S–W and N–E components have CO velocities of 580 km s-1 and 680 km s-1, respectively (Kohno et al., 2002). We also observed this region with the upGREAT instrument with velocity resolved observations but could not detect [C ii] in individual pixels. However, averaging the spectra above the contour in the FIFI-LS map and S–W from M51b’s center results in the spectrum shown in the lower panel of Figure 3. The [C ii] line is clearly detected at the S–W with a peak at 580 km s-1, which is consistent with the CO velocity in this region. The total integrated intensity of the observed spectrum is 2.4 erg s-1 cm-2 sr-1, which is consistent with the average intensity of the FIFI–LS map in this area of 2.0 erg s-1 cm-2 sr-1. We also averaged the upGREAT spectra in the N–E part of the galaxy, but could not detect any emission.
M51b is intrinsically very faint in [C ii] considering the observed TIR intensity and the inferred SFR. Additionally, this galaxy shows enhanced 24m emission (Figure 2) and elevated dust temperature (Mentuch Cooper et al., 2012) compared to M51. M51b is a barred lenticular galaxy in a post–starburst phase, in which the stellar population is dominated by old stars (10 Gyr) and massive star-formation is suppressed (Kohno et al., 2002; Alatalo et al., 2016). The lack of massive star formation in M51b is consistent with the faint [C ii] emission detected but it is inconsistent with the large TIR emission observed in this galaxy and the high SFR inferred from H and 24m dust continuum emission.
M51b shows Active Galactic Nuclei (AGN) activity, based on its near–infrared line emission (Goulding & Alexander, 2009) and there is evidence of AGN feedback producing arcs and shocks in X–ray and H emission (Schlegel et al., 2016; Rampadarath et al., 2018). X–rays can heat the dust to higher temperatures than FUV emission, and can result in bright infrared emission, resulting in enhanced values of the TIR intensity and anomalously large inferred SFR (Voit, 1991). Note, however, that the X-ray luminosity in M51b ( erg s-1) is low compared to what is typical for galaxies (Ebrero et al., 2009), and is a factor of 30 lower than that at the center of M51 (Brightman et al., 2018). Thus, the AGN in M51b can heat the dust only in its immediate vicinity. Higher resolution images of the 24 m and H emission in M51b show a point source at its center that is unresolved in the 6″ (247 pc) and 0.31″ (12 pc) resolution of these images, respectively. As the [C ii] peak is about 10″ (450 pc) from the center of M51b, it is therefore possible that the bright fir– and mid–infrared and [C ii] emission arises from different locations within the 16″ beam of our observations, with the hot dust associated to the AGN dominating the mid– and far–infrared emission and a higher column density, colder dust temperature region contributing to the [C ii] emission. This [C ii]–emitting cloud is too far from the AGN to be influenced by its X–ray emission. The evolved stellar population in M51b can also heat the dust but does not contribute significantly to the FUV emission that heats the gas via photoelectric effect (Bendo et al., 2012; Kapala et al., 2017). Note, however, that the stellar surface density at the center of M51 is similar to that in M51b, but this region shows only a moderate deficit of [C ii] with respect to the TIR emission and inferred SFR. Thus, an enhanced stellar density is likely not the only mechanism responsible for the low [C ii]/SFR and [C ii]/TIR ratios in M51b.
4.3 [C ii] emission at the center of M51
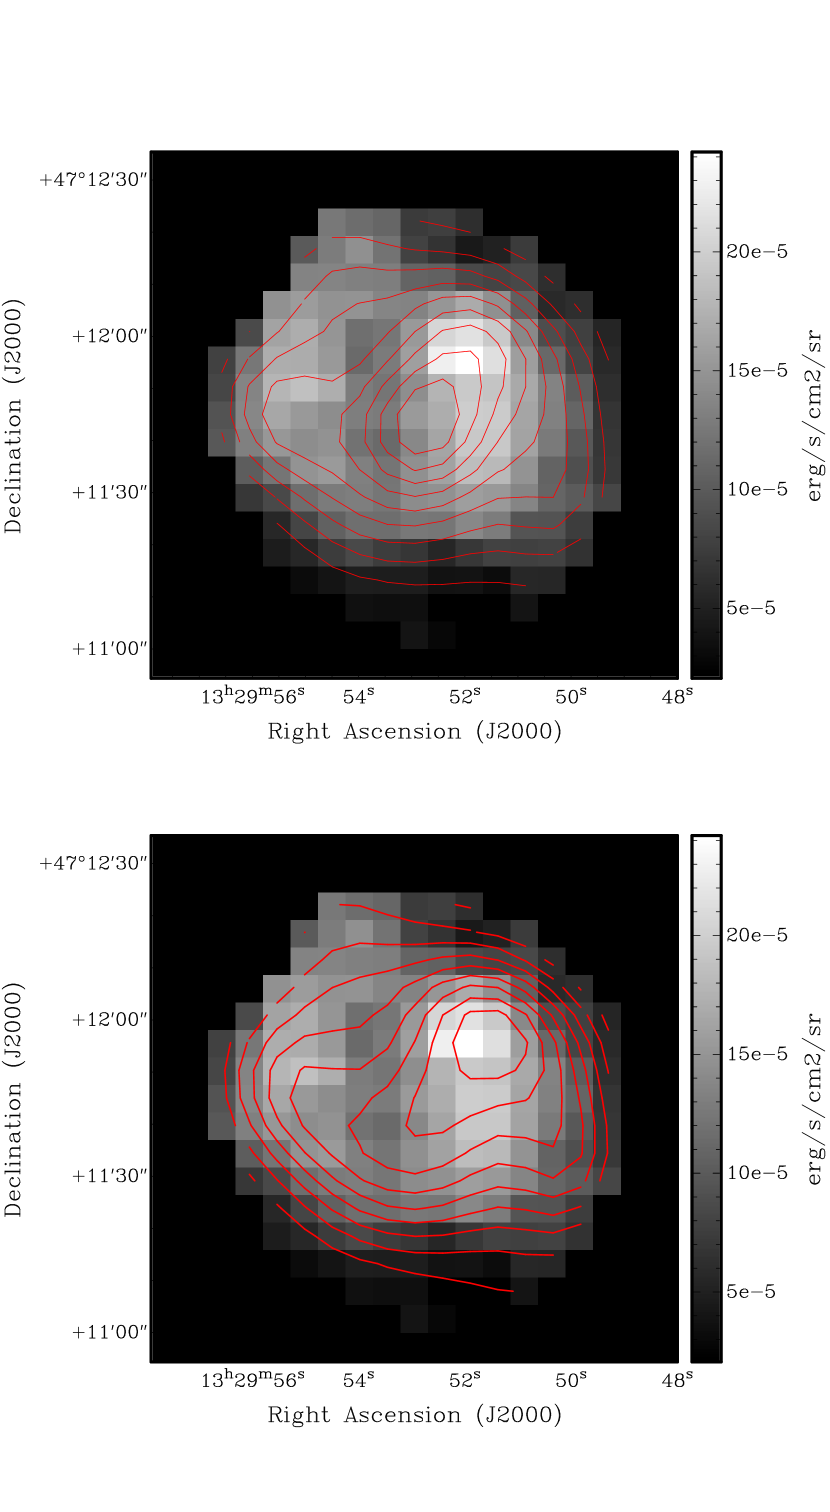
As shown in Figure 2, there are a number of pixels at the center of M51 that show a moderate [C ii] deficit for a given SFR surface density. However, this effect is not as pronounced when [C ii] is compared with the TIR intensity. In Figure 4 we show the [C ii] emission in M51’s central regions with contours of the TIR intensity and inferred SFR. The SFR surface density image shows a peak of emission at its center that is not present in the [C ii] image (both the H and 24 m show a point-source emission at this location ). This peak corresponds to the location of the Compton–thick AGN activity present in this region (Stauffer, 1982; Fukazawa et al., 2001). Therefore, this region also represents an example of AGN–powered H and 24 m emission, with fainter [C ii] emission. The peak at the AGN location can also be seen in the far–infrared images used to estimate the TIR intensity but it is not as pronounced as for the shorter wavelength data used to determine the SFR surface density.
5 Conclusions
We presented a [C ii] emission map over the entire M51 and M51b galaxies observed with the SOFIA/FIFI–LS instrument. We compared the [C ii] emission with the total far–infrared intensity and star formation rate surface density maps of M51 within a variety of environments. We found that [C ii] and the SFR surface density are well correlated in the central, spiral arm, and inter-arm regions. The correlation is in good agreement with that found for a larger sample of nearby galaxies at kpc scales. We found that the SFR and [C ii] and TIR luminosities in M51 are dominated by the extended emission in M51’s disk. The companion galaxy M51b, however, shows a deficit of [C ii] emission compared with the TIR emission and inferred SFR surface density, with [C ii] emission detected only in the S–W part of this galaxy. We find that this [C ii] deficit is related to an enhanced dust temperature in this galaxy. We interpret the faint [C ii] emission in M51b to be a result of suppressed star formation in this galaxy, while the bright mid– and far–infrared emission, which drive the TIR and SFR values, are powered by other mechanisms. A similar but less pronounced effect is seen at the location of the black hole in M51’s center. The observed [C ii] deficit in M51b suggests that this galaxy represents a valuable laboratory in which to study the origin of the apparent [C ii] deficit observed in ultra-luminous infrared galaxies.
References
- Alatalo et al. (2016) Alatalo, K., Aladro, R., Nyland, K., et al. 2016, ApJ, 830, 137
- Bendo et al. (2012) Bendo, G. J., Boselli, A., Dariush, A., et al. 2012, MNRAS, 419, 1833
- Brightman et al. (2018) Brightman, M., Baloković, M., Koss, M., et al. 2018, ArXiv e-prints, arXiv:1805.12140
- Capak et al. (2015) Capak, P. L., Carilli, C., Jones, G., et al. 2015, Nature, 522, 455
- Carilli & Walter (2013) Carilli, C. L., & Walter, F. 2013, ARA&A, 51, 105
- Colditz et al. (2012) Colditz, S., Fumi, F., Geis, N., et al. 2012, in Proc. SPIE, Vol. 8446, Ground-based and Airborne Instrumentation for Astronomy IV, 844617
- Croxall et al. (2012) Croxall, K. V., Smith, J. D., Wolfire, M. G., et al. 2012, ApJ, 747, 81
- Daigle et al. (2006) Daigle, O., Carignan, C., Amram, P., et al. 2006, MNRAS, 367, 469
- Dalgarno & McCray (1972) Dalgarno, A., & McCray, R. A. 1972, ARA&A, 10, 375
- de Looze et al. (2011) de Looze, I., Baes, M., Bendo, G. J., Cortese, L., & Fritz, J. 2011, MNRAS, 416, 2712
- Díaz-Santos et al. (2013) Díaz-Santos, T., Armus, L., Charmandaris, V., et al. 2013, ApJ, 774, 68
- Díaz-Santos et al. (2017) Díaz-Santos, T., Armus, L., Charmandaris, V., et al. 2017, ApJ, 846, 32
- Ebrero et al. (2009) Ebrero, J., Carrera, F. J., Page, M. J., et al. 2009, A&A, 493, 55
- Fischer et al. (2018) Fischer, C., Beckmann, S., Bryant, A., et al. 2018, Journal of Astronomical Instrumentation, 1840003
- Fukazawa et al. (2001) Fukazawa, Y., Iyomoto, N., Kubota, A., Matsumoto, Y., & Makishima, K. 2001, A&A, 374, 73
- Gallagher et al. (2018) Gallagher, M. J., Leroy, A. K., Bigiel, F., et al. 2018, ApJ, 858, 90
- Goicoechea et al. (2015) Goicoechea, J. R., Teyssier, D., Etxaluze, M., et al. 2015, ApJ, 812, 75
- Goulding & Alexander (2009) Goulding, A. D., & Alexander, D. M. 2009, MNRAS, 398, 1165
- Graciá-Carpio et al. (2011) Graciá-Carpio, J., Sturm, E., Hailey-Dunsheath, S., et al. 2011, ApJ, 728, L7
- Herrera-Camus et al. (2015) Herrera-Camus, R., Bolatto, A. D., Wolfire, M. G., et al. 2015, ApJ, 800, 1
- Ho et al. (1997) Ho, L. C., Filippenko, A. V., & Sargent, W. L. W. 1997, ApJS, 112, 315
- Kapala et al. (2015) Kapala, M. J., Sandstrom, K., Groves, B., et al. 2015, ApJ, 798, 24
- Kapala et al. (2017) Kapala, M. J., Groves, B., Sandstrom, K., et al. 2017, ApJ, 842, 128
- Kennicutt et al. (2011) Kennicutt, R. C., Calzetti, D., Aniano, G., et al. 2011, PASP, 123, 1347
- Kennicutt et al. (2003) Kennicutt, Jr., R. C., Armus, L., Bendo, G., et al. 2003, PASP, 115, 928
- Klein et al. (2014) Klein, R., Beckmann, S., Bryant, A., et al. 2014, in Proc. SPIE, Vol. 9147, Ground-based and Airborne Instrumentation for Astronomy V, 91472X
- Kohno et al. (2002) Kohno, K., Tosaki, T., Matsushita, S., et al. 2002, PASJ, 54, 541
- Kramer et al. (2005) Kramer, C., Mookerjea, B., Bayet, E., et al. 2005, A&A, 441, 961
- Kramer et al. (2013) Kramer, C., Abreu-Vicente, J., García-Burillo, S., et al. 2013, A&A, 553, A114
- Langer & Pineda (2015) Langer, W. D., & Pineda, J. L. 2015, A&A, 580, A5
- Lu et al. (2015) Lu, N., Zhao, Y., Xu, C. K., et al. 2015, ApJ, 802, L11
- Malhotra et al. (2001) Malhotra, S., Kaufman, M. J., Hollenbach, D., et al. 2001, ApJ, 561, 766
- McQuinn et al. (2016) McQuinn, K. B. W., Skillman, E. D., Dolphin, A. E., Berg, D., & Kennicutt, R. 2016, ApJ, 826, 21
- Mentuch Cooper et al. (2012) Mentuch Cooper, E., Wilson, C. D., Foyle, K., et al. 2012, ApJ, 755, 165
- Nikola et al. (2001) Nikola, T., Geis, N., Herrmann, F., et al. 2001, ApJ, 561, 203
- Parkin et al. (2013) Parkin, T. J., Wilson, C. D., Schirm, M. R. P., et al. 2013, ApJ, 776, 65
- Pineda et al. (2014) Pineda, J. L., Langer, W. D., & Goldsmith, P. F. 2014, A&A, 570, A121
- Rampadarath et al. (2018) Rampadarath, H., Soria, R., Urquhart, R., et al. 2018, MNRAS, 476, 2876
- Sandage & Tammann (1981) Sandage, A., & Tammann, G. A. 1981, A Revised Shapley-Ames Catalog of Bright Galaxies
- Schlegel et al. (2016) Schlegel, E. M., Jones, C., Machacek, M., & Vega, L. D. 2016, ApJ, 823, 75
- Smith et al. (2017) Smith, J. D. T., Croxall, K., Draine, B., et al. 2017, ApJ, 834, 5
- Spitzer (1948) Spitzer, Jr., L. 1948, ApJ, 107, 6
- Stacey et al. (1991) Stacey, G. J., Geis, N., Genzel, R., et al. 1991, ApJ, 373, 423
- Stauffer (1982) Stauffer, J. R. 1982, ApJ, 262, 66
- Vacca (2016) Vacca, W. 2016, Guest Investigator Handbook for FIFI-LS Data Products, Tech. rep., SOFIA Science Center
- Voit (1991) Voit, G. M. 1991, ApJ, 379, 122
- Young et al. (2012) Young, E. T., Becklin, E. E., Marcum, P. M., et al. 2012, ApJ, 749, L17