Semantically-aware population health risk analyses
Abstract
One primary task of population health analysis is the identification of risk factors that, for some subpopulation, have a significant association with some health condition. Examples include finding lifestyle factors associated with chronic diseases and finding genetic mutations associated with diseases in precision health. We develop a combined semantic and machine learning system that uses a health risk ontology and knowledge graph (KG) to dynamically discover risk factors and their associated subpopulations. Semantics and the novel supervised cadre model make our system explainable. Future population health studies are easily performed and documented with provenance by specifying additional input and output KG cartridges.
1 Introduction
Population health studies discover risk factors associated with diseases within subpopulations. We found thousands of published studies that used multivariate logistic regression to identify risk factors using the National Health and Nutrition Examination Survey (NHANES) dataset111https://www.cdc.gov/nchs/nhanes/index.htm, yielding valuable population health insights at a great duplication of effort.222On 10/23/18, scholar.google.com returned 5240 results for the search “NHANES ‘multivariate logistic regression’ ‘risk factors”’. For each paper, the author typically specifies some combination of a single disease, a small number of risk factors, and a specific patient cohort (e.g., a subpopulation defined by age, gender, or ethnicity). Started in 1960, NHANES examines about 5000 subjects a year and thus serves as one of the primary data resources for epidemiology and population health studies.
In these studies, the goal is not to develop a supervised model with a high predictive accuracy, but rather to find significant associations between risk factors (e.g. exercise, nutrition, exposure to potential toxins) and diseases (e.g. cancer, cardiovascular disease, diabetes, vision loss) in a defined subpopulation. Once validated in further studies, these risk factors can serve as the basis for interventions at the clinical and/or public policy levels leading to health promotion and disease prevention.
By leveraging a combination of semantics and analytics, we can formalize and generalize these workflows to enable future studies to be performed dynamically with minimal effort. We utilize the environment-wide association study (EWAS, Patel et al. [2010]) and make it applicable to a wide array of diseases and risk factors by simply specifying high-level “cartridges" that encode the study definition of interest. The approach is coupled with interpretable precision health models that perform automatic identification of at-risk subpopulations with distinct risk profiles. We emphasize that these subpopulations and risk profiles are discovered, which contrasts with the more typical study in which the researcher designs a cohort and then runs a targeted analysis of a few risk factors.
Our risk analysis tool performs dynamic, semantically-aware precision risk analyses by testing the association between risk factors and health conditions or diseases for statistical significance. Any risk factor, health condition or disease definable in NHANES may be analyzed. As NHANES is updated, our tool can empower and accelerate novel population health studies and findings. In NHANES, data collection is biased to better capture minority populations; thus, we employ survey-weighted approaches (Heeringa et al. [2017]) to correct for this bias. Currently, we support survey-weighted generalized linear models with and without subpopulation discovery. The proposed approach can be rapidly adapted to alternative datasets and different analysis pipelines.
The Risk Analyzer web application leverages our ontology and a knowledge graph (KG) to drive analytics performed in R. As described in (McCusker et al. [2018]), a KG is a graph in which meaning is expressed as structure, statements are unambiguous, a limited set of relationships are used, and explicit provenance is included. We build on prior semantic representations of analytics, including the foundational semantic workflow model (McGuinness and Bennett [2015], Bennett et al. [2016]) and the ScalaTion (Nural et al. [2015]) framework. Underlying everything is a representation of data and metadata in our KG. The KG uses best practices ontologies and the Cohort Ontology (Chari et al. [2018]) extended to capture risk factor analyses using “cartridges". The derived subpopulations and risk profiles are also declaratively encoded in the KG.
2 Methods
2.1 Preparation
We first ingest NHANES records into a linked data representation with the Semantic Data Dictionary (SDD, Rashid et al. [2017]) approach. This creates a dictionary mapping and a codebook for NHANES variable values, cohorts, and survey weights. Both of these link NHANES terminology to terms in open source ontologies that support reuse and interoperability. Ontologies that we reuse include the Semanticscience Integrated Ontology (SIO), Children’s Health Exposure Analysis Resource (CHEAR), Statistics Ontology (STATO), and Chemical Entities of Biological Interest (ChEBI). This allows for the creation of a KG of data and metadata, which can be interlinked with best practice terminology. Further, the content is published using nanopublications (Groth et al. [2010]) to maintain provenance. We develop a Health Risk Factor Ontology that contains three classes of entities: analysis concepts, workflow axioms, and background domain axioms. Analysis concepts include definitions of responses and associated confounding variables. Workflow axioms describe data preprocessing steps, such as standardization of continuous risk factors. Background domain axioms capture knowledge necessary for specifying the analytics model. For example, to make urine measurements of risk factors comparable, the analysis can control for urinary creatinine.
Minimal necessary analysis components from the Health Risk Factor Ontology are stored in modular serializations called cartridges, and these are loaded as the user chooses how to construct their study. Response variable cartridges provide the analysis concepts and background domain axioms necessary to model a given disease. Study cohort cartridges list inclusion criteria used to determine if a given subject may be included in the study. Risk factor cartridges describe categories of semantically similar risk factors and give their necessary background domain axioms. Workflow cartridges contain a set of axioms that completely detail an analysis workflow. Once an analysis has been performed, the findings are stored in a results cartridge, which also contains links to the other cartridges used to perform that analysis. Results are written back to the KG so that they can be accessed by query.
2.2 Analysis
The user designs their study using the Risk Analyzer’s graphical interface with defaults informed by the KG. This requires choosing the target chronic health condition, control factors, risk factors, and patient cohort. One study might examine associations in adult patients between type 2 diabetes (T2D) and a hundred different pesticides while controlling for age, gender, ethnicity, and BMI. Based on these settings, the Risk Analyzer queries the KG using SPARQL (Harris et al. [2013]) to extract the relevant records. Then it applies the appropriate workflow axioms and visually presents the results.
The user may choose different survey-weighted analysis methods, including generalized linear models for population analysis and the supervised cadre model (SCM, New et al. [2018]) for interpretable precision health. Cadre models simultaneously discover subpopulations and learn their risk models. Subpopulations, which we call cadres, are subsets of the population defined with respect to a rule learned by the SCM. Subjects in the same cadre have the same association with a given risk factor.
SCMs may be applied to a variety of analytics tasks, including multiple and multivariate regression and classification. We sketch out binary classification. When trained on a set of observations , the supervised cadre models divides the observations into a set of cadres. Each cadre is characterized by a center and a linear risk function parameterized by . New observations have a aggregate risk score given by , where
Here is the probability belongs to cadre , is a seminorm parameterized by , and is a hyperparameter that controls the sharpness of the cadre-assignment process. The cadre membership of is a multinoulli random variable with probabilities ; this set is the softmax of the set of weighted inverse-distances . The optimal parameters for an SCM are obtained by applying stochastic gradient descent to a loss function derived from a posterior maximization problem.
The supervised cadre model is ante-hoc explainable (Holzinger et al. [2017]): it incorporates explainability directly into its structure. Its parameters have intuitive purposes. The feature distributions of observations can be grouped by cadre to reveal underlying cadre structure. For example, an SCM might discover that, for the subpopulation of middle-aged and older white people, there is a significant association between the pesticide nicosulfuron and high systolic blood pressure (SBP).
After the analysis, new metadata and data are written back into the KG, annotated with terms defined in the ontology. The metadata include subpopulation summary statistics, such as variable means and standard deviations, and SCM hyperparameters. The data include each observation’s cadre membership. The ontology was designed to include attributes useful for informing analysis design, summarizing analysis results for later comparison, and for generating reports. By including annotations that use well defined terms, we claim that the resulting knowledge graph can be considered a computational knowledge graph, as applications can compute with statements embedded in it since they have definitions of terms used and also have the provenance of how the statements were derived.
3 Results

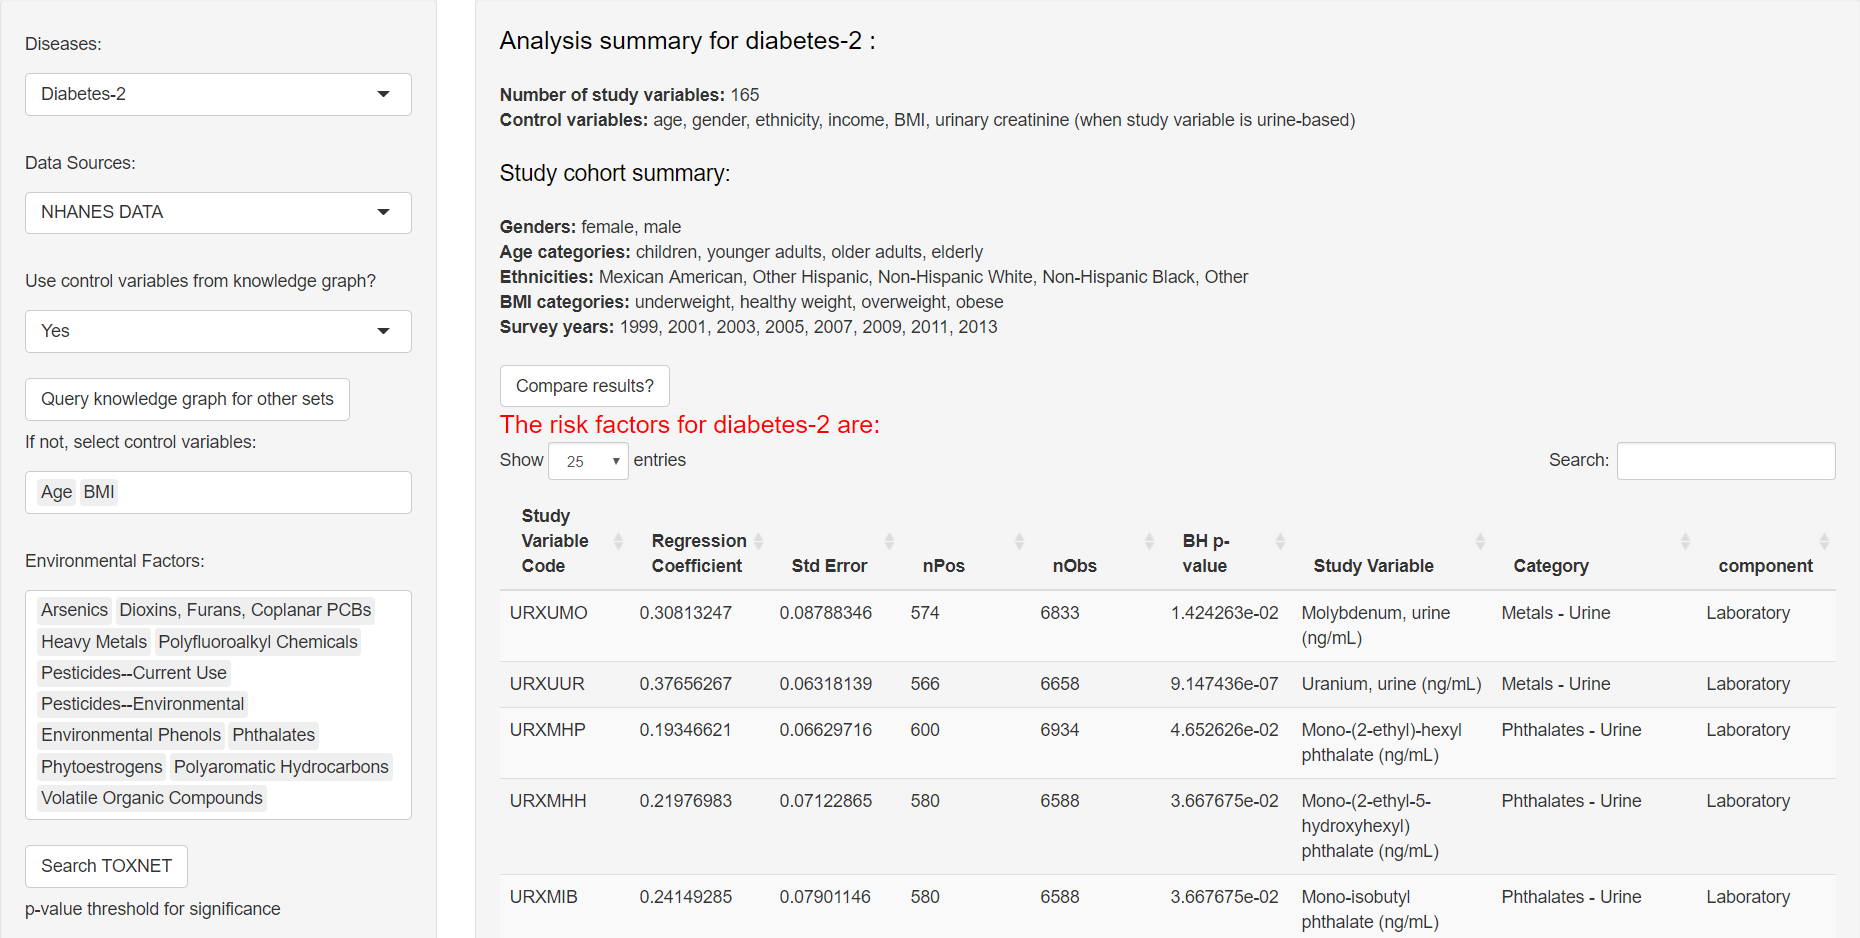
The risk analyzer analyzes a user-specified subpopulation with the Health Risk Factor Ontology. Possible risk factors include 218 environmental exposure and 36 lifestyle variables. It targets diseases: T2D, breast cancer, heart disease, thyroid disease, and hypertension. Figure 1 shows the results of this implementation being used to identify environmental factors associated with type 2 diabetes. The user dynamically specifies and executes the study through the interface. Figure 2 shows a portion of a results cartridge. This cartridge stores the findings that identified environmental factors associated with high SBP.

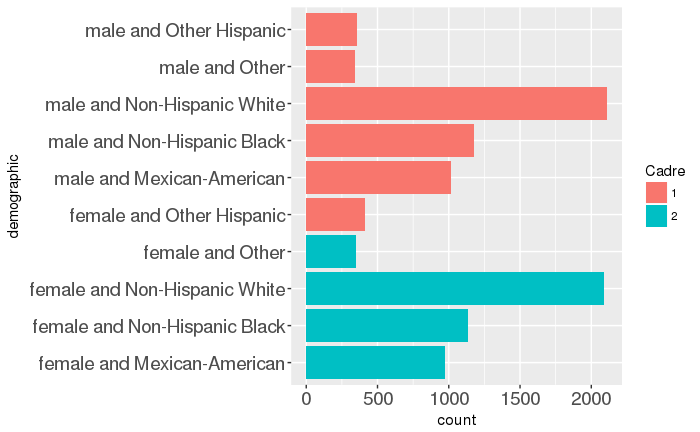
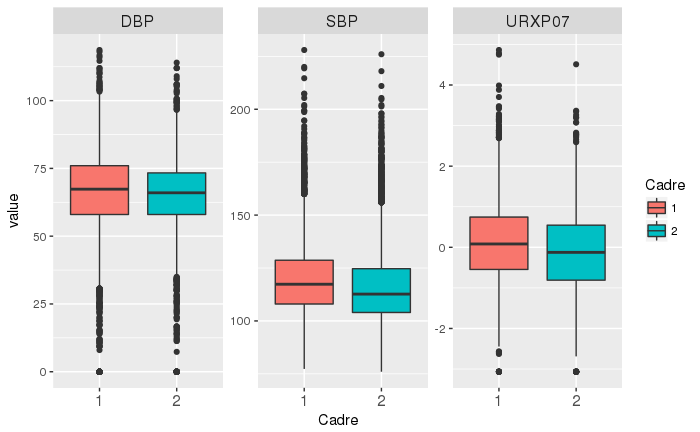
We can examine the subpopulations discovered by the supervised cadre model. Fig. 3 shows two subpopulations associated with the polyaromatic hydrocarbon 2-hydroxyphenanthrene. These subpopulations and their discovered associations can also be written back to the knowledge graph.


4 Discussion
We have presented a unique synthesis of semantics and analytics and used it to execute population health risk factor studies. We leverage inference capabilities and ontology term relationships to dynamically construct and execute the risk factor model and interpret the results. Using cadre models linked with semantics, the system can provide discovery and explainable insights in future population health studies. Our system writes its statistical findings and parameters back to the KG, enabling them to be retrieved via query while enabling comparisons with previous results. By linking a result to the cartridge used to produce it, we completely document how that result was produced.
Future work includes a full implementation of the SCM framework and expansion of the Health Risk Factor Ontology, enabling users to dynamically introduce and apply cartridges modeling new diseases and risk factors of interest to different datasets. Predicate relationships will facilitate the analytics. We report here on population health analyses of survey data using cadre models. This same framework could readily be adapted to the analysis of electronic health care records to support evidence-based analyses targeted towards individual patients. Multimodal narrative generation and presentation technologies can use the KG to dynamically create interactive interfaces and reports that communicate and explain analytic insights targeted towards researchers, clinicians or patients.
Acknowledgments
This work is partially supported by IBM Research AI through the AI Horizons Network.
References
- Alghasham et al. [2011] A. A. Alghasham, A. R. Meki, and H. A. Ismail. Association of Blood Lead level with Elevated Blood Pressure in Hypertensive Patients. Int J Health Sci (Qassim), 5(1):17–27, Jan 2011.
- Almeida Lopes et al. [2017] A. C. B. Almeida Lopes, E. K. Silbergeld, A. Navas-Acien, R. Zamoiski, A. D. C. Martins, A. E. I. Camargo, M. R. Urbano, A. E. Mesas, and M. M. B. Paoliello. Association between blood lead and blood pressure: a population-based study in Brazilian adults. Environ Health, 16(1):27, 03 2017.
- Bennett et al. [2016] K. P. Bennett, J. S. Erickson, H. De los Santos, S. Norris, E. Patton, J. Sheehan, and D. L. McGuinness. Data analytics as data: A semantic workflow approach. In Proc. of Artificial Intelligence for Data Science Workshop at Neural Information Processing Systems (NIPS), Barcelona, Spain, Dec 2016.
- Chari et al. [2018] S. Chari, R. Weerawarana, O. Seneviratne, J. P. McCusker, D. L. McGuinness, and A. Das. Semantic modeling of cohort descriptions in research studies. In AMIA 2018 Knowledge Representation and Semantics Working Group Pre-Symposium, November 2018. URL "https://tw.rpi.edu/web/doc/semantic_modeling_of_cohort".
- Groth et al. [2010] P. Groth, A. Gibson, and J. Velterop. The anatomy of a nanopublication. Information Services and Use, 30(1):51–56, 2010.
- Harris et al. [2013] S. Harris, A. Seaborne, and E. Prud’hommeaux. SPARQL 1.1 query language. W3C recommendation, 21(10), 2013.
- Heeringa et al. [2017] S. Heeringa, B. West, and P. Berglund. Applied Survey Data Analysis. Chapman and Hall/CRC., 2 edition, 2017.
- Holzinger et al. [2017] A. Holzinger, C. Biemann, C. S. Pattichis, and D. B. Kell. What do we need to build explainable AI systems for the medical domain? CoRR, abs/1712.09923, 2017.
- McCusker et al. [2018] J.P. McCusker, J.S. Erickson, K. Chastain, S. Rashid, R. Weerawarana, and D.L. McGuinness. What is a Knowledge Graph? Semantic Web Journal, Under Review, 2018. URL https://doi.org/10.1007/978-0-387-39940-9_1512.
- McGuinness and Bennett [2015] D. L. McGuinness and K. P. Bennett. Integrating Semantics and Numerics: Case Study on Enhancing Genomic and Disease Data Using Linked Data Technologies. In Proceedings of SmartData 2015, San Jose, CA, August 2015.
- New et al. [2018] A. New, C. Breneman, and K. P. Bennett. Cadre Modeling: Simultaneously Discovering Subpopulations and Predictive Models. In 2018 International Joint Conference on Neural Networks (IJCNN), pages 1–8, July 2018.
- Nural et al. [2015] M. V. Nural, M. E. Cotterell, H. Peng, R. Xie, P. Ma, and J. A. Miller. Automated Predictive Big Data Analytics Using Ontology Based Semantics. Int J Big Data, 2(2):43–56, Oct 2015.
- Patel et al. [2010] C. J. Patel, J. Bhattacharya, and A. J. Butte. An Environment-Wide Association Study (EWAS) on type 2 diabetes mellitus. PLOS ONE, 5(5):1–10, 05 2010.
- Rashid et al. [2017] S. M. Rashid, K. Chastain, J. A. Stingone, D. L. McGuinness, and J. P. McCusker. The Semantic Data Dictionary Approach to Data Annotation & Integration. Enabling Open Semantic Science (SemSci), pages 47–54, 2017.