Reddening of the BLR and NLR in AGN From a Systematic Analysis of Balmer Decrement
Abstract
We selected an active galactic nuclei (AGN) sample () from Sloan Digital Sky Survey Data Release 7, and measured the broad- () and narrow-line Balmer decrements () of 554 selected AGNs. We found that the distributions of Balmer decrements can be fitted by a Gaussian function and give the best estimates of with a standard deviation 0.07 dex, and with a standard deviation 0.10 dex. We inspected the distributions of and in the BaldwinPhillipsTerlevich (BPT) diagram and found that only narrow-line Balmer decrements depend on the physical conditions of the narrow-line region (NLR). We tested the relationship between and , and found that does not correlate with . We investigated the relationship between Balmer decrements and Seyfert sub-type, and found that only broad-line Balmer decrements correlate with Seyfert sub-type, We also examined the dependency of Balmer decrements on AGN properties, and found that Balmer decrements have no correlation with optical luminosity, but show some dependence on accretion rate. These results indicate that the NLR is subject to more reddening by dust than the broad-line region (BLR).
keywords:
AGN: emission lines – AGN: general.1 Introduction
The unified model of active galactic nuclei (AGN) proposes that the variety in AGN type is just the result of viewing from different orientations (Antonucci 1993; Urry & Padovani 1995). A dusty toroidal structure (i.e., the torus) surrounding an accreting massive black hole (BH) is believed to be a common feature of AGN. The broad-line region (BLR) is close to the central region and is believed to be located within the inner radius of the dusty torus. The narrow-line region (NLR) is located farther from the black hole and accretion disc, at the distance of a few pc. Many hard X-ray surveys have showed that 70% of all local AGNs are obscured, where the obscuration in X-ray regime is produced by multiple absorbers mostly associated with the torus and the BLR, the obscuring material in the infrared is a transition zone between the BLR and NLR (e.g., Burlon et al. 2011; Ramos Almeida & Ricci 2017). In the optical regime, Gaskell & Harrington (2017) suggests that outflowing dusty clumps driven by radiation pressure acting on the dust complicate the study of the geometric structure and kinematics of the BLR and the search for sub-parsec supermassive black hole (SMBH) binaries.
The internal reddening caused by obscuring material attenuates the activity of AGN and blurs the nature of AGN, such as the underestimate of luminosity and accretion rate. For example, The reverberation mapped spectra of IRAS F12397+333 () have a very red colour resulting from the internal reddening of AGN (Galactic extinction corrected; Du et al. 2014). After correcting internal reddening, the luminosity at 5100Å and dimensionless accretion rate increase 4 and 9 times, respectively (Du et al. 2014; Hu et al. 2015). In addition, the internal reddening in AGN, which always produced by dust in the local of AGN or the host galaxy, are useful for us to understand the accretion and feedback process of AGN.
Using the Balmer decrement as an indicator of reddening, many works have studied the internal reddening of AGN in detail for different AGN samples (e.g., Costero & Osterbrock 1977; Gaskell 1982, 1984; Gaskell et al. 2004; Dong et al. 2005; La Mura et al. 2007; Dong et al. 2008; Heard & Gaskell 2016; Baron et al. 2016; Gaskell 2017). For the BLR, Gaskell (2017) suggested that the intrinsic Balmer decrement in extremely blue AGN is 111The superscript b and n in the text stand for the broad emission-line and narrow emission-line, respectively, which is consistent with the Baker-Menzel Case B value of 2.74 (Osterbrock & Ferland, 2006). For the NLR, the best overall average value of 3.1 is adopted for the intrinsic ratio (Gaskell, 1982, 1984; Wysota & Gaskell, 1988; Heard & Gaskell, 2016), which is a bit larger than the recombination value of 2.85 resulting from the effects of collisional excitation (Osterbrock & Ferland, 2006).
However there still exist some open questions including (1) many works show that the distributions of the broad-line Balmer decrement cover a wide range, but the median or average value varies from one sample to another. For example, La Mura et al. (2007) derived , Dong et al. (2008) gave with standard deviation 0.03 dex, Gaskell (2017) suggested that the intrinsic is 2.72, Zhou et al. (2006) found the mean ratio to be 3.028 with a dispersion of 0.36, etc. (2) de Zotti & Gaskell (1985) and Heard & Gaskell (2016) found that broad-line Balmer decrements are greater than narrow-line Balmer decrements, which is opposite to the result of Baron et al. (2016); (3) The nature and distribution of dust causing internal reddening of AGN remain unknown (e.g., Heard & Gaskell 2016; Baron et al. 2016; Gaskell 2017), for example whether dust causing reddening in the BLR and continuum also causes in the NLR or not. To investigate these issues, in this paper, we study the properties of broad- and narrow-line Blamer decrements based on a AGN sample selected from the Sloan Digital Sky Survey Data Release 7 (SDSS DR7; York et al. 2000; Schneider et al. 2010). In Section 2, we describe the construction of sample. We fit spectra and obtain the measurements of emission-line fluxes in Section 3, and give results in Section 4. Section 5 is discussion. We draw our conclusions in Section 6.
2 Sample Construction
Based on the H and H emission line, in this paper, we concentrate on studying the properties of Balmer decrements and exploring potential difference (if existences) between broad- and narrow-line Balmer decrements. However, it is hard to separate the NLR Balmer lines from the BLR Balmer lines, since narrow lines sometimes blend with broad lines (Dong et al., 2008; Hu et al., 2008; Stern & Laor, 2012a, b, 2013). To this purpose, we selected a sample of broad-line AGNs from the Sloan Digital Sky Survey Data Release 7 (Schneider et al., 2010) using the following criteria:
-
1.
We limited redshifts at first so that the H line has a sufficient number of good spectral pixels within the SDSS spectral wavelength coverage, which gives a total sample consisting of 3532 AGNs.
-
2.
Then we selected objects with spectral signal-to-noise ratio (S/N)15 to limit the complex model well in spectral fitting scheme (see Section 3). Therefore, 1005 AGNs are excluded from parent sample.
-
3.
In order to ensure reliable measurement of narrow emission-line, we further selected objects that the signal-to-noise ratio of the peak of narrow emission-lines (including H4861, H6563 and [N II] 6584) greater than 10, and found only 616 AGNs satisfy with this criteria.
-
4.
We excluded those objects with apparent absorption lines which indicates significant contamination from host galaxies. Finally, we selected 554 AGNs.
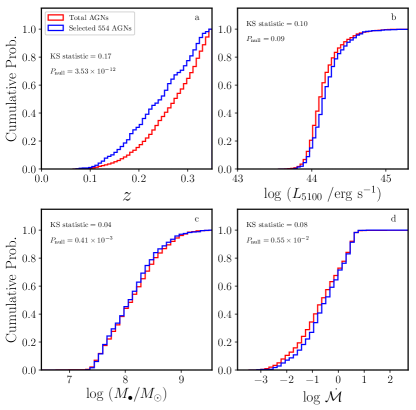
To check whether the selected sample bias from the parent sample in AGN properties, we plotted the cumulative distribution function of the primary AGNs parameters (calculated from the best fitted results, see Section 3) for selected 554 AGNs and total sample in Figure 1. Then we employed KolmogorovSmirnov (KS) test to quantify the differences, the results are quoted in Figure 1. The test shows that the distribution of selected 554 AGNs are almost same with parent sample (except for redshift).
3 Spectral Fitting and Measurements
Spectral fitting scheme is widely used in the optical spectra study of AGNs (e.g., Hu et al. 2008; Dong et al. 2008, 2011; Wang et al. 2009; Shen et al. 2011; Stern & Laor 2013; Lu et al. 2016b). Meanwhile, the disadvantage of spectral decomposition is also emphasized in many works (Dong et al., 2008; Stern & Laor, 2013). Briefly, the limitations and complexities of spectral decomposition attributes to the facts that there are essentially no emission-line free regions where the continuum can be determined well; Fe II emission lines and narrow corona lines are blended with broad lines; AGN continuum cannot be described by a single power law from red to blue side of spectrum, which means that we have to determine the local continuum for the H and H regions separately (also see Dong et al. 2008). Therefore, we simultaneously fit the spectrum with multiple components, which include the continuum, the Fe II multiplets and several emission lines, giving emphasis on proper determination of the local pseudo-continua. This fitting scheme is similar to the process adopted by Dong et al. (2008). In brief, main process of spectral fitting is described as follows:
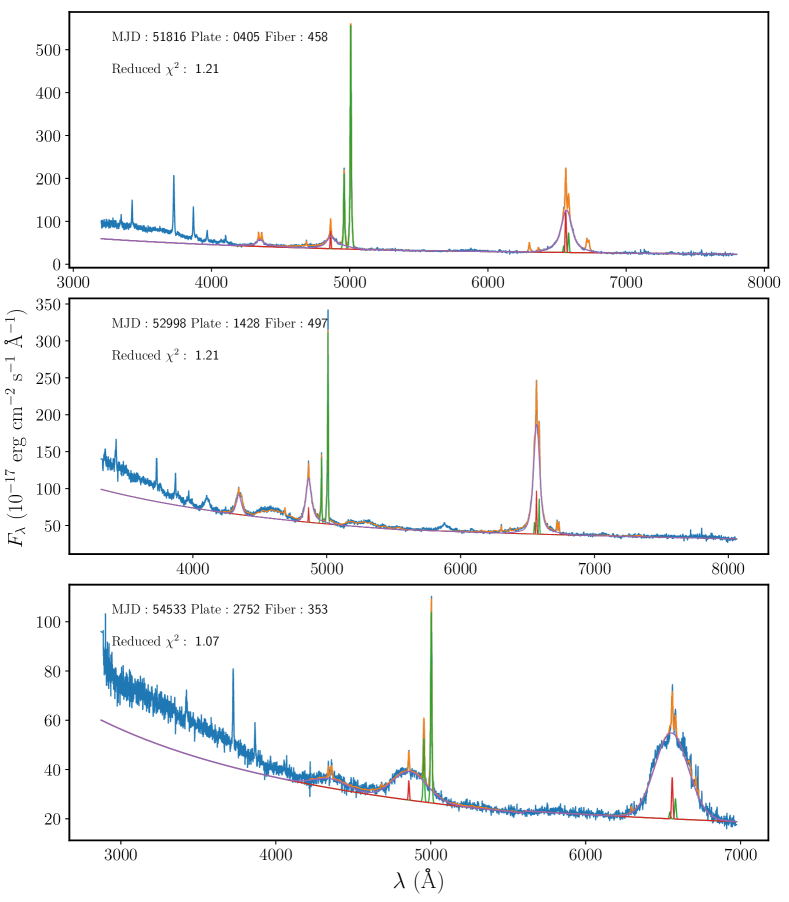
We corrected Galactic extinction and redshift for each SDSS spectrum, then we fitting spectrum in rest-frame wavelength range of 4200Å to 7500Å using a broken power law with a break wavelength at 5600Å. The optical Fe II emission lines are modelled by two separate sets of templates constructed by Dong et al. (2008, 2011) based on the measurements of I Zw 1 by Véron-Cetty et al. (2004), one for broad Fe II line system and the other for narrow Fe II line system. We modelled emission lines from H to [S II] 222 Some emission-line regions in the fitting window are masked out, because they have no effect on the results. They includes [Cl III] , He I and [Ar III] . Some emission lines are not added to the fitting model, because either they are too weak to constrain in the fit or they have little effect on the results. They includes He I , [Fe VII] and the , [N I] , [Ca V] , He I and [O II] . as follows. Broad hydrogen Balmer lines (H, H, H) are modelled with two to four Gaussians. The broad He II line is modelled with one Gaussian. [O III] and the doublet are assumed to have the same redshifts and profiles, and each is modelled with one to two Gaussians. Other corona lines are modelled with one Gaussian. Narrow Balmer lines (H, H, H), [N II] and [S II] doublets are assumed to have the same redshift and profile. The flux ratio of the [O III] doublet 5007/4959 and [N II] doublet 6583/6548 are fixed to the theoretical value of 2.96 (more details refer to Dong et al. 2008). In Figure 2, we also over-plotted the fitted results, as shown by the orange line in each panel.
From the best fitted results, we calculated the monochrome luminosity at 5100Å (), the full width at half maximum (FWHM) of broad H emission line. Then the black hole mass () is estimated by
| (1) |
where , estimated from relationship (Bentz et al., 2013) is the H time lag with respective to the 5100 Å continuum, is the gravitational constant, is the speed of light, and is the so-called virial factor that includes all the unknown information about the geometry and kinematics of the BLR gas. The dimensionless accretion rate is estimated via (e.g., Du et al. 2014; Lu et al. 2016a)
| (2) |
where, is the 5100 Å luminosity, is the black hole mass, is the cosine of the inclination of the accretion disk. Following the usual approximation, we take . The fluxes of broad hydrogen Balmer lines (H, H), narrow hydrogen Balmer lines (H, H), [O III] and [N II] are measured from the best fitted model.
4 Results
4.1 The Distribution of Balmer Decrements
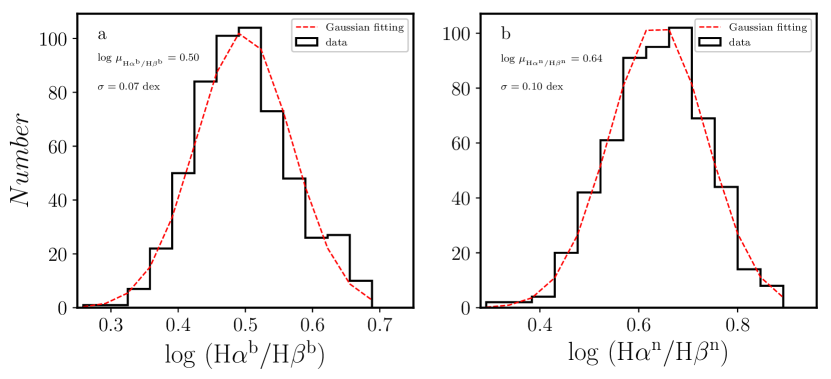
Using the Balmer line (H and H) fluxes, we calculated the broad-line Balmer decrements of and the narrow-line Balmer decrements of for the 554 AGNs. In Figure 3(a, b), we plotted the distributions of and ratios in logarithm form by dividing the samples into 14 bins, respectively. Both distributions can be fitted by a Gaussian function, as shown with the red dashed line in Figure 3. The best-fitted results give the mean log()=0.50 (i.e. =3.16) with a standard deviation of 0.07 dex, and the mean log()=0.64 (i.e. =4.37), with a standard deviation of 0.10 dex. These average ratios are respectively larger than the intrinsic values of (refer to Gaskell 2017 for this value) and (Gaskell, 1982, 1984; Wysota & Gaskell, 1988). The average ratios of and strongly show that the narrow-line Balmer decrements are much larger than broad-line systematically. This suggests that the level of reddening in the NLR is higher than the BLR if we accept that the observed Balmer decrements depend on the reddening.
4.2 Balmer Decrements and BPT diagram
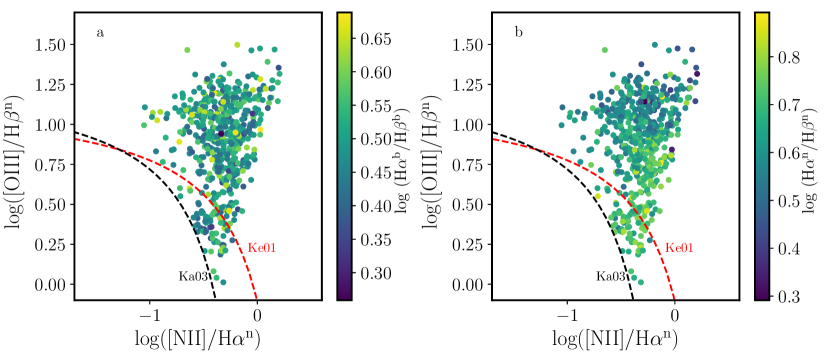
The two-dimensional line-intensity ratio calculated from relatively strong lines of [O III] 5007, H4861, [N II] 6584 and H6563 (here Balmer emission-line refer only to the narrow component) can be used to probe the nebular conditions of a source (i.e., BPT diagram promoted by Baldwin et al. 1981 and modified by Veilleux & Osterbrock 1987). Using Balmer decrements as third parameter, we constructed 2D distributions of BPTBalmer decrement for 554 AGNs in Figure 4(a, b), and investigated the relationship between Balmer decrements and physical condition of nebular. We found that only 35 (6%) of 554 AGNs lie below Ke01 line (Kewley et al., 2001), which means that the ionization of the NLR is dominated by AGN rather than host galaxy.
In Figure 4 (a), we can see that distribute in the BPT diagram randomly, which is confirmed by the correlation analysis (see Table 1). Panel (b) of Figure 4 shows that most of the AGNs with the largest ratios locate on the bottom of the BPT diagram (the direction of [O III]/H axis), which in fact indicates a correlation between and [O III]/H. This is confirmed by the correlation analysis, with correlation coefficient , and probability of no correlation . These results indicate that the broad-line Balmer decrements are independent on the physical conditions of the NLR, whereas the narrow-line Balmer decrements are associated with the physical conditions of the NLR. We will further discuss this in the following analysis.
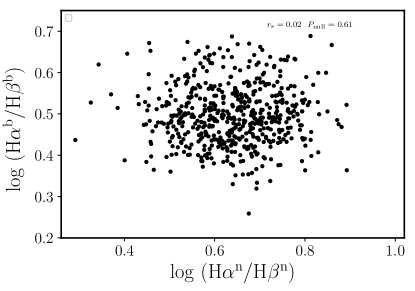
4.3 Relationship of and
In this section, we attempt to investigate the relationship between and for our sample, as shown in Figure 5. The Spearman rank correlation coefficient and probability of the null hypothesis (listed in Table 1) are and respectively, indicating that does not correlate with , which is consistent with the find of de Zotti & Gaskell (1985). The dust causing the common reddening of both the BLR and NLR could be associated with the dust of host galaxy (de Zotti & Gaskell, 1985; Baron et al., 2016), because host galaxy is extremely extended. However, if reddening of the BLR and NLR is caused fully by the same dust in the line of sight, the broad-line Balmer decrements should be significantly correlated with the narrow-line Balmer decrements, vice versa. We found that the averaged is smaller than the averaged (Section 4.1), and they are independent on each other. These indicate that the NLR could be covered by more dust in the light of sight, and the dust causing the reddening of the BLR and NLR may be different. Many cases can account for this result. For example, in the frame of AGN unified model (Antonucci 1993), it is possible that the partial dusty torus of AGN cause the reddening of the BLR, and the dust amount obscuring the BLR in the line of sight depend on the inclination angle of AGN. But the NLR may be free from the dust torus since the NLR gas lies under the gravitational influence of host galaxy (e.g., Ho 2009). However, as suggested by Mor et al. (2009), Stern et al. (2014), Baron et al. (2016) and Ramos Almeida & Ricci (2017), the NLR is dusty clouds, which may cause the reddening of the NLR in observation. Certainly, it is also possible that both the BLR and NLR may be reddened by the dust in the host galaxy, and thus the total dust amount sustained by the BLR and NLR are dependent on their sizes and the observing angle.
| Parameter 1 | Parameter 2 | ||
|---|---|---|---|
| 0.02 | |||
| 6584 | 0.02 | ||
| 5007 | 0.06 | ||
| 6584 | 0.02 | ||
| 0.24 | |||
| 0.21 | |||
| -0.10 | 0.01 | ||
| -0.01 | 0.75 | ||
| -0.18 | |||
| 0.24 | |||
| 5007 | -0.55 | ||
| EW() | -0.59 | ||
| 5007 | -0.33 | ||
| EW() | -0.25 |
4.4 Balmer Decrements and Seyfert subtype
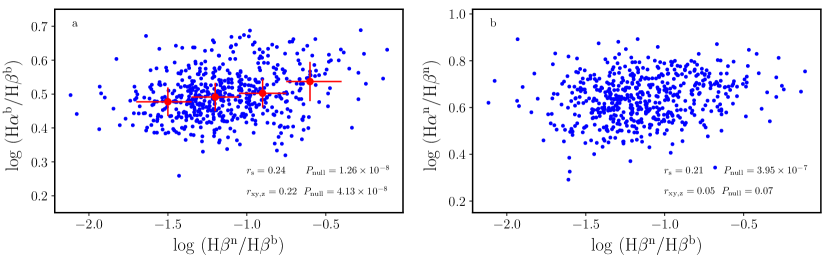
In order to investigate the relation between Balmer decrements and Seyfert sub-type. We chose the most physical scheme used by Osterbrock (1977), which subdivides the AGN population into Seyfert 1.0, 1.2, and 1.5 according to the prominence of the broad compared to the narrow component of H (i.e, H/H ratio). That is, in the frame of AGN unified model (Antonucci, 1993), the higher H/H ratio means the AGN with larger inclination angle to the telescope. However, Stern & Laor (2012b) found that the NLR to BLR luminosity ratio () decreases with increasing H luminosity (), and suggested that the drop of with is most likely due to the decrease in covering factor of the NLR with AGN luminosity (also see Ludwig et al. 2009). Therefore, in the next, we test the relationship between Balmer decrements and H/H by removing the influence of H luminosity () using the partial correlation analysis (Kendall & Stuart, 1979; Lu et al., 2016b).
Figure 6 (a, b) shows the broad- and narrow-line Balmer decrement as a function of H/H ratio. We employed correlation analysis to investigate the dependency of broad- and narrow-line Balmer decrement on H/H ratio. The Spearman rank correlation coefficient and probability of the null hypothesis are quoted in panel (a, b) and also listed in Tabel 1. The result shows that the broad-line Balmer decrements weakly correlate with H/H ratio (, ), and the narrow-line Balmer decrements weakly correlate with H/H ratio (, ). Meanwhile, we found that H/H ratio decreases with increasing in our sample (, ), which is consistent with previous result (see Figure 3 of Stern & Laor 2012b, who adopt ratio and ). Therefore, we further employed partial correlation analysis to investigate whether these correlations are affected by . The partial correlation coefficients show that still weakly correlates with H/H ratio (, , where , and ), whereas there is no correlation between and H/H (, , where ). The former trend is supported by the fact that the of Seyfert 1.8-1.9s is above 10 and might be as high as 20 (Osterbrock 1981; Crenshaw et al. 1988; Osterbrock & Ferland 2006). The lack of correlation between and H/H indicates that the inclination has little effect on the reddening of NLR emission lines, which might suggest that the reddening of NLR seems to be mainly caused by the dust embedded in the NLR clouds.
4.5 Balmer Decrements and Optical Luminosity
To check the dependency of Balmer decrements on optical luminosity, we employed the Spearman rank correlation analysis. The Spearman rank correlation coefficient of and probability of the null hypothesis of are also given in Table 1. The test shows that broad-line Balmer decrements do not correlate with optical luminosity, which is consistent with the result of Dong et al. (2008). This suggests that dust covering factor in the BLR remains a constant with optical luminosity increasing. This case is opposite with receding torus models suggested that obscured fraction in the line of sight decreases with optical luminosity increasing (Lawrence, 1991). However, recent studies Based on sophisticated dusty torus model suggested that the dust covering factor weakly depends on AGN luminosity (Stalevski et al., 2016). Meanwhile, we found that the narrow-line Balmer decrement is also independent on optical luminosity of AGNs.
Infrared (IR) time-lag observations show that the inner dust torus radius scales with the AGN luminosity as (“size-luminosity” relation, Suganuma et al. 2006), as well as from theoretical calculation (Barvainis, 1987) and near-IR(NIR) interferometric observations (Kishimoto et al., 2011). However, based on mid-IR(MIR) observational study of 23 AGNs, Burtscher et al. (2013) suggest that a common “size-luminosity” relation does not exist for AGN torus due to the fact that the torus sizes of these fainter sources are smaller than that expected from relation and show a large scatter, and two torus model components are needed to explain the observed results. The polar component was detected directly in NGC 1068 using high-angular-resoluiton MIR observations (Mason et al., 2006). Recently, the studies of MIR observation for 20 AGNs indicate that the bulk of the MIR emission comes from a diffuse polar component (Asmus et al., 2016). These results show that the nature of the nuclear environment of accreting systems is extremely complex. Our result suggests that the dust in the line of sight causing the reddening of the BLR and NLR do not be impacted by radiation pressure (i.e., optical luminosity) of accretion disk. This may caused by the fact that the intrinsic differences in their dust structures. It is also possible that the dust near the central region is destroyed (MacAlpine 1985; Osterbrock & Ferland 2006), and the dust causing the reddening of AGN survives at the radius far from the central region of AGN, which attenuates the role of AGN optical luminosity on Balmer decrements.
4.6 Balmer Decrements and accretion rate
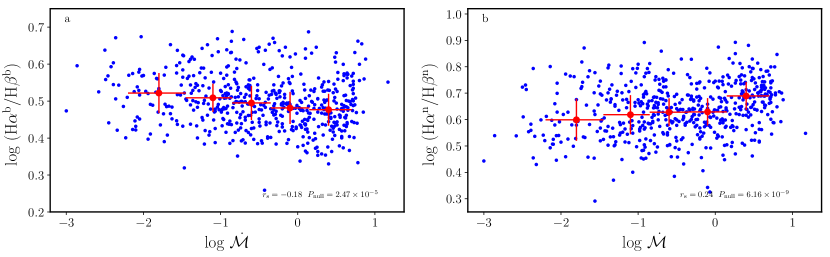
Ricci et al. (2017) found that the covering factor of dusty torus drops dramatically with increasing . This could be a natural result that a part of dusty torus supply gas for accretion flow, and a part of dusty torus in high-latitude may drop to the low-latitude of accretion disk. In this case, AGNs reddening (especially, for the region within the dusty torus) will be weakened with increasing accretion rate if the BLR (and accretion disk) are obscured by dusty torus. Therefore, broad-line Balmer decrement decreases as accretion rate increases. This expectation is supported by the test shown in Figure 7 (a), where we plot Balmer decrements as a function of accretion rate, to some degree. The Spearman rank correlation analysis shows that broad-line Balmer decrements weakly correlate with accretion rate (see Table 1 and Figure 7 a).
Meanwhile, we found an interested results that the narrow-line Balmer decrement increases with increasing accretion rate (see Figure 7 b). Recall that the narrow-line Balmer decrements correlate with physical conditions of the NLR (Section 4.2), it is possible that the physical conditions in the NLR are driven/modulated by accretion rate. We will further investigate this issue in the next section.
4.7 Narrow-Line Balmer Decrements and NLR Physics
We have found that narrow-line Balmer decrements are independent on the inclination of AGN (Section 4.4), but depend on the accretion rate (Section 4.6) and physical conditions of the NLR (Section 4.2). Using photoionization code CLOUDY, Baskin & Laor (2005) calculated emission-line flux ratio of , and found that depends on the electron density and ionization parameter of the NLR gas. Based on Palomar-Green quasar sample, Baskin & Laor (2005) found that the strength of 5007 is modulated by the covering factor, electron density and ionization parameter of the NLR gas (Figure 5 of Baskin & Laor 2005). Therefore, we use and EW() represent the physical conditions of the NLR to investigate the properties of narrow-line Balmer decrements in this section.
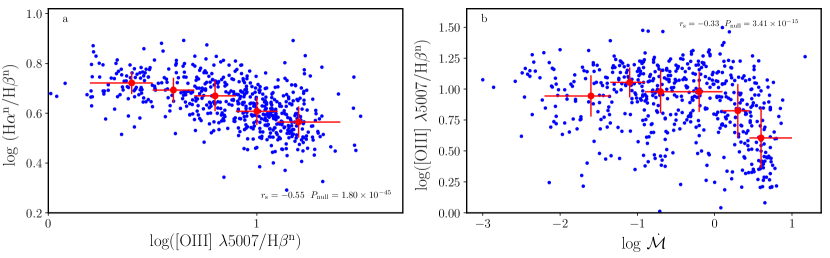
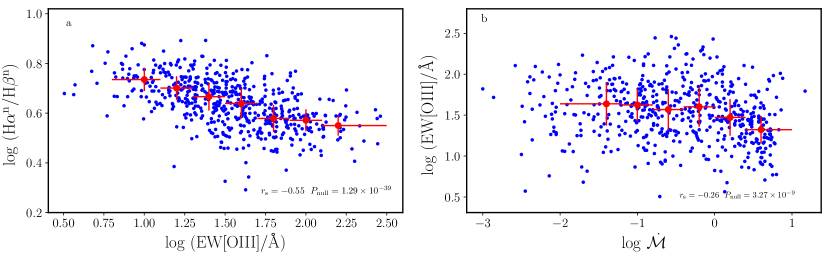
Figure 8 (a) displays relationship. The result of correlation analysis (noted in panel and listed in Table 1) shows that inversely correlates with . Figure 8 (b) displays relationship, which shows that inversely correlates with accretion rate. This result indicates that narrow-line Balmer decrement increases with decreasing , which could be attribute to the electron density increases and ionization parameter decreases of the NLR gas as accretion rate increases. In addition, we can see from Figure 8 (b) that the observed ratio trends to have a maximum value 10. This observed ratio is consistent with the expectation of photoionization model, which give out the maximum ratio 10 (the top panel of Figure 2 in Baskin & Laor 2005).
Similarly, Figure 9 (a, b) display and relationship, respectively. The results of correlation analysis show that inversely correlates with , and inversely correlates with . When the accretion rate increases, AGN outflows or winds might increase. However, there are no theoretical calculations or observations that support outflows or winds can reach to the NLR (Netzer, 2006; Hickox & Alexander, 2018). That is the covering factor of the NLR might not increase with accretion rate. Therefore, the inverse correlation between and accretion rate might indicates that the electron density increases and/or ionization parameter decreases as accretion rate increases.
5 Discussion
5.1 Comparison with Previous Work
Previous results from different AGN samples give different . For example, La Mura et al. (2007) derived based on 90 Seyfert 1 galaxies from SDSS. Zhou et al. (2006) measured ratios for 2000 narrow-line Seyfert 1 galaxies (NLS1s) and obtained the average ratio is 3.028 with a dispersion of 0.36 (refer to Fig. 6 of Zhou et al. 2006). Dong et al. (2008) selected 446 low-redshift (z0.35) AGN in which the spectral slopes vary in the range from 1.5 to 2.7, the ratios range from 2.3 to 4.2 and the distribution of the ratios can be well described by log-Gaussian (Figure 3 of Dong et al. 2008), with a mean ratio of 3.06. Gaskell (2017) selected an extremely blue AGN sample with (where , is measured from 4030Å to 5600Å), these bluest AGNs have a significantly flatter Balmer decrement (see Fig. 1 of Gaskell 2017), which give the geometric mean ratio is 2.860.06. For our sample, the ratios can be described by a Gaussian function with a peak value 3.16 and standard deviation 0.07 dex. Dong et al. (2008) shown that the Balmer decrement is a good indicator of internal reddening in AGN. Gaskell (2017) gave a conclusion that the bluest 10% of SDSS AGNs have significant reddening, and suggested that the un-reddening Balmer decrement of the BLR is the Case B value of . On the whole, the results obtained from early small samples and our sample point to the mean ratio of the BLR is larger than the Baker-Menzel Case B value, suggesting that the observed BLR is reddened by the dust in the line of sight. In addition, the recombination theory gives the narrow-line Balmer decrement of , the best overall average value of 3.1 is adopt for the intrinsic ratio of the NLR by taking into account the collisional excitation in the partly ionized transition region (Osterbrock & Ferland 2006). For our sample, the ratios of the NLR also can be described by a Gaussian function with a peak value of 4.37 and standard deviation 0.10 dex, which is significantly larger than the typical value of 3.1. Combining with the suggestion that the narrow-line Balmer decrements do give a reliable indication of reddening (Gaskell 1982), we concluse that the NLR is also reddened by the dust in the line of sight.
On the other hand, Heard & Gaskell (2016) studied a compiled sample, which is composed of Dong et al. (2008) blue AGNs, Dong et al. (2005) partially obscured AGNs, very high SN AGNs observed by Osterbrock 1977 and Cohen 1983 in Lick observatory, and found that the average broad-line Balmer decrement is larger than the average narrow-line Balmer decrement. However, this is opposite to the result obtained from 109 nearby Seyfert galaxies by de Zotti & Gaskell (1985). For our selected AGN sample, the average ratio is also larger than the ratio, this is consistent with result of de Zotti & Gaskell (1985) and Baron et al. (2016)333Baron et al. (2016) calculated the broad- and narrow-line Balmer decrements of 1296 AGNs in the redshift range (see Fig. 7 of Baron et al. 2016), it is obvious that the narrow-line Balmer decrement is larger than the broad-line Balmer decrement..
5.2 Spatial Distribution of Dust
In Section 4, we investigated the physical properties of broad- and narrow-line Balmer decrements systematically, and discovered many differences between the broad- and narrow-line Balmer decrements. If we accept that the steeper Balmer decrement primarily depends on internal reddening of AGN, our results are an important clue to investigate the space distribution of dust causing internal reddening of AGN.
A probable case is that the dust causing the reddening of observed AGN survive in the radius far from the centre of AGN resulting from the broad-line Balmer decrements are a constant with optical luminosity (equivalently radiation pressure). As suggested by Ramos Almeida & Ricci (2017), these dust may include equatorial/toroidal structure (torus) and polar component. For the BLR, it is possible that partial dust torus may cause the reddening of the BLR, and covering fractions of dusty torus in the line of sight depend on the inclination angle and accretion rate of AGN, which is supported by the fact that the broad-line Balmer decrement correlates with H/H ratio and accretion rate (see Figure 6 a and Figure 7 a) and by the unified model of AGN. But complicated structure of the dusty torus, such as clumpy geometry and broad range of covering factors, and the existence of pole dust (Ramos Almeida & Ricci, 2017), where covering factors of torus marginally depend on the accretion rate, could be attenuate the correlation between broad-line Balmer decrements and H/H ratio. For the NLR, there is no significant correlation between the broad- and narrow-line Balmer decrement, and averaged broad-line Balmer decrement is lower than the narrow-line, suggesting that there are more and different dust reddening the NLR compared to the BLR. Interestingly, we found that narrow-line Balmer decrements correlate with physical conditions of the NLR and accretion rate. It is possible that many dust indwell in the NLR and redden the NLR (e.g., Mor et al. 2009; Stern et al. 2014; Baron et al. 2016; Ramos Almeida & Ricci 2017).
It should be noted, de Zotti & Gaskell (1985) argued that the reddening in the BLR arises in the plane of the galaxies. This argument is based on interpreting the Balmer decrement of the BLR slightly correlates with axial ratio, but the significant level of this correlation is very low. To interprete NaI D as interstellar absorption line in the host galaxies, and the correlation of equivalent width of NaI D with optical continuum slope (), Baron et al. (2016) suggested that the dusty gas causing the AGN reddening is the interstellar medium (ISM) of the host galaxy. As Gaskell (2017) concerned, it is possible that the variation in equivalent widths of NaI D is due to varying amounts of host-galaxy starlight.
6 Conclusion
In this paper, we selected an AGN sample and investigated many physical properties of broad- and narrow-line Balmer decrement. Our main results are:
-
1.
The distributions of the broad- and narrow-line Balmer decrements in our sample can be described by a Gaussian function, and the average broad- and narrow-line Balmer decrements are 3.16 and 4.37, respectively. The narrow-line Balmer decrements are systematically larger than the broad-line decrements, which is contrary in part to previous results. Using Balmer decrements as indicator of internal reddening of AGN, we can conclude that the dust causing the reddening in the NLR is larger than the BLR.
- 2.
-
3.
Using H/H ratio (Seyfert sub-type) as the proxy of inclination angle, We found that the broad-line Balmer decrements weakly correlate with the inclination of AGN, while narrow-line Balmer decrements are independent on the inclination. We also found that broad- and narrow-line Balmer decrements are independent on AGN optical luminosity in our samples, which is consistent with the results of Dong et al. (2008).
-
4.
The Balmer decrements of the BLR (NLR) inversely (positively) correlate with accretion rates, which probably indicates that the reddening of the BLR and NLR may be modulated by accretion rate.
7 Acknowledgements
We are grateful to the referee for constructive suggestions that significantly improved the manuscript. We acknowledge the support of the staff of the Lijiang 2.4m telescope. Funding for the telescope has been provided by CAS and the People’s Government of Yunnan Province. YZ is supported by the National Key Research and Development Program of China (No. 2017YFA0402704). K.X.L. is supported by the Light of West China Program provided by CAS (No. Y7XB016001), and the National Natural Science Foundation of China (grant Nos. 11703077).
References
- Antonucci (1993) Antonucci, R. 1993, ARA&A, 31, 473
- Asmus et al. (2016) Asmus, D., Hönig, S. F., & Gandhi, P. 2016, ApJ, 822, 109
- Baldwin et al. (1981) Baldwin, J. A., Phillips, M. M., & Terlevich, R. 1981, Pub. Ast. Soc. Pacific, 93, 5
- Baron et al. (2016) Baron, D., Stern, J., Poznanski, D., & Netzer, H. 2016, ApJ, 832, 8
- Barvainis (1987) Barvainis, R. 1987, ApJ, 320, 537
- Baskin & Laor (2005) Baskin, A., & Laor, A. 2005, MNRAS, 358, 1043
- Bentz et al. (2013) Bentz, M. C., Denney, K. D., Grier, C. J., et al. 2013, ApJ, 767, 149
- Burlon et al. (2011) Burlon, D., Ajello, M., Greiner, J., et al. 2011, ApJ, 728, 58
- Burtscher et al. (2013) Burtscher, L., Meisenheimer, K., Tristram, K. R. W., et al. 2013, A&A, 558, A149
- Cohen (1983) Cohen, R. D. 1983, ApJ, 273, 489
- Costero & Osterbrock (1977) Costero, R., & Osterbrock, D. E. 1977, ApJ, 211, 675
- Crenshaw et al. (1988) Crenshaw, D. M., Peterson, B. M., & Wagner, R. M. 1988, AJ, 96, 1208
- de Zotti & Gaskell (1985) de Zotti, G., & Gaskell, C. M. 1985, A&A, 147, 1
- Dong et al. (2011) Dong, X.-B., Wang, J.-G., Ho, L. C., et al. 2011, ApJ, 736, 86
- Dong et al. (2008) Dong, X., Wang, T., Wang, J., et al. 2008, MNRAS, 383, 581
- Dong et al. (2005) Dong, X.-B., Zhou, H.-Y., Wang, T.-G., et al. 2005, ApJ, 620, 629
- Du et al. (2014) Du, P., Hu, C., Lu, K.-X., et al. 2014, ApJ, 782, 45
- Gaskell (1982) Gaskell, C. M. 1982, Pub. Ast. Soc. Pacific, 94, 891
- Gaskell (1984) Gaskell, C. M. 1984, ApJ Letters, 24, 43
- Gaskell (2017) Gaskell, C. M. 2017, MNRAS, 467, 226
- Gaskell et al. (2004) Gaskell, C. M., Goosmann, R. W., Antonucci, R. R. J., & Whysong, D. H. 2004, ApJ, 616, 147
- Gaskell & Harrington (2017) Gaskell, C. M., & Harrington, P. Z. 2017, arXiv:1704.06455
- Heard & Gaskell (2016) Heard, C. Z. P., & Gaskell, C. M. 2016, MNRAS, 461, 4227
- Hickox & Alexander (2018) Hickox, R. C., & Alexander, D. M. 2018, arXiv:1806.04680
- Ho (2009) Ho, L. C. 2009, ApJ, 699, 638
- Hu et al. (2015) Hu, C., Du, P., Lu, K.-X., et al. 2015, ApJ, 804, 138
- Hu et al. (2008) Hu, C., Wang, J.-M., Ho, L. C., et al. 2008, ApJ, 687, 78
- Kauffmann et al. (2003) Kauffmann, G., Heckman, T. M., Tremonti, C., et al. 2003, MNRAS, 346, 1055
- Kendall & Stuart (1979) Kendall, M., & Stuart, A. 1979, The Advanced Theory of Statistics: Inference and Relationship, Vol. 2. 4th edn. Griffin, London
- Kewley et al. (2001) Kewley, L. J., Dopita, M. A., Sutherland, R. S., Heisler, C. A., & Trevena, J. 2001, ApJ, 556, 121
- Kishimoto et al. (2011) Kishimoto, M., Hönig, S. F., Antonucci, R., et al. 2011, A&A, 527, A121
- La Mura et al. (2007) La Mura, G., Popović, L. Č., Ciroi, S., Rafanelli, P., & Ilić, D. 2007, ApJ, 671, 104
- Lawrence (1991) Lawrence, A. 1991, MNRAS, 252, 586
- Lu et al. (2016b) Lu, K.-X., Du, P., Hu, C., et al. 2016b, ApJ, 827, 118
- Lu et al. (2016a) Lu, K.-X., Li, Y.-R., Bi, S.-L., & Wang, J.-M. 2016a, MNRAS, 459, L124
- Ludwig et al. (2009) Ludwig, R. R., Wills, B., Greene, J. E., & Robinson, E. L. 2009, ApJ, 706, 995
- MacAlpine (1985) MacAlpine, G. M. 1985, Astrophysics of Active Galaxies and Quasi-Stellar Objects, 259
- Mason et al. (2006) Mason, R. E., Geballe, T. R., Packham, C., et al. 2006, ApJ, 640, 612
- Mor et al. (2009) Mor, R., Netzer, H., & Elitzur, M. 2009, ApJ, 705, 298
- Netzer (2006) Netzer, H. 2006, Physics of Active Galactic Nuclei at all Scales, 693, 1
- Osterbrock (1977) Osterbrock, D. E. 1977, ApJ, 215, 733
- Osterbrock (1981) Osterbrock, D. E. 1981, ApJ, 249, 462
- Osterbrock & Ferland (2006) Osterbrock, D. E., & Ferland, G. J. 2006, Astrophysics of gaseous nebulae and active galactic nuclei, 2nd. ed. by D.E. Osterbrock and G.J. Ferland. Sausalito, CA: University Science Books, 2006
- Ramos Almeida & Ricci (2017) Ramos Almeida, C., & Ricci, C. 2017, Nature Astronomy, 1, 679
- Ricci et al. (2017) Ricci, C., Trakhtenbrot, B., Koss, M. J., et al. 2017, Nature, 549, 488
- Schneider et al. (2010) Schneider, D. P., Richards, G. T., Hall, P. B., et al. 2010, AJ, 139, 2360
- Shen et al. (2011) Shen, Y., Richards, G. T., Strauss, M. A., et al. 2011, ApJS, 194, 45
- Suganuma et al. (2006) Suganuma, M., Yoshii, Y., Kobayashi, Y., et al. 2006, ApJ, 639, 46
- Stalevski et al. (2016) Stalevski, M., Ricci, C., Ueda, Y., et al. 2016, MNRAS, 458, 2288
- Stern & Laor (2012a) Stern, J., & Laor, A. 2012a, MNRAS, 423, 600
- Stern & Laor (2012b) Stern, J., & Laor, A. 2012b, MNRAS, 426, 2703
- Stern & Laor (2013) Stern, J., & Laor, A. 2013, MNRAS, 431, 836
- Stern et al. (2014) Stern, J., Laor, A., & Baskin, A. 2014, MNRAS, 438, 901
- Urry & Padovani (1995) Urry, C. M., & Padovani, P. 1995, Pub. Ast. Soc. Pacific, 107, 803
- Veilleux & Osterbrock (1987) Veilleux, S., & Osterbrock, D. E. 1987, ApJS, 63, 295
- Véron-Cetty et al. (2004) Véron-Cetty, M.-P., Joly, M., & Véron, P. 2004, A&A, 417, 515
- Wang et al. (2009) Wang, J.-G., Dong, X.-B., Wang, T.-G., et al. 2009, ApJ, 707, 1334
- Wysota & Gaskell (1988) Wysota, A., & Gaskell, C. M. 1988, Active Galactic Nuclei, 307, 79
- York et al. (2000) York, D. G., Adelman, J., Anderson, J. E., Jr., et al. 2000, AJ, 120, 1579
- Zhou et al. (2006) Zhou, H., Wang, T., Yuan, W., et al. 2006, ApJS, 166, 128