11email: cochetti@fcaglp.unlp.edu.ar 22institutetext: Departamento de Espectroscopía Estelar, Facultad de Ciencias Astronómicas y Geofísicas, Universidad Nacional de La Plata, Argentina 33institutetext: Instituto de Física y Astronomía, Universidad de Valparaíso, Chile 44institutetext: Université Côte d’Azur, Laboratoire Lagrange, Nice, 06000, France
Spectro-interferometric observations of a sample of Be stars††thanks: Based on observations collected at the European Organisation for Astronomical Research in the Southern Hemisphere under ESO programme ID 094.D-0140
Abstract
Context. Be stars are rapid rotators surrounded by a gaseous disk envelope whose origin is still under debate. This envelope is responsible for observed emission lines and large infrared excess.
Aims. To progress in the understanding of the physical processes involved in the disk formation, we estimate the disk parameters for a sample of Be stars and search for correlations between these parameters and stellar properties.
Methods. We performed spectro-interferometric observations of 26 Be stars in the region of the Br line to study the kinematical properties of their disks through the Doppler effect. Observations were performed at the Paranal observatory with the VLTI/AMBER interferometer. This instrument provides high spectral (R12000) and high spatial ( mas) resolutions.
Results. We modeled 18 Be stars with emission in the Br line. The disk kinematic is described by a quasi-Keplerian rotation law, with the exception of HD 28497 that presents a one-arm density-wave structure. Using a combined sample, we derived a mean value for the velocity ratio (where is the critical velocity), and found that rotation axes are probably randomly distributed in the sky. Disk sizes in the line component model are in the range of stellar radii and do not correlate with the effective temperature or spectral type. However, we found that the maximum size of a stable disk correlates with the rotation velocity at the inner part of the disk and the stellar mass.
Conclusions. We found that, on average, the Be stars of our combined sample do not rotate at their critical velocity. However, the centrifugal force and mass of the star defines an upper limit size for a stable disk configuration. For a given rotation, high-mass Be stars tend to have more compact disks than their low-mass counterparts. It would be interesting to follow up the evolution of the disk size in variable stars to better understand the formation and dissipation processes of their circumstellar disks.
Key Words.:
techniques: interferometric – techniques: high angular resolution – stars: winds, outflows – stars: emission-line, Be – stars: general1 Introduction
Classical Be stars are rapid B-type rotators of luminosity class V to III that have, or had at some time, emission lines of hydrogen (at least in H) and single ionized metals (Jaschek et al. 1981; Collins 1987). The formation of these emission lines is attributed to the presence of a circumstellar disk-like envelope surrounding the star.
Observations suggest the presence of two different regions in the circumstellar envelope of Be stars: a dense equatorial disk in quasi-Keplerian rotation (responsible for most of the emission lines and the IR-excess; Rivinius et al. 2013) and a more diluted polar wind (responsible for the highly broadened UV lines; Prinja 1989).
The mass density distribution of Be star disks is often modeled with a simple power law of the form , where is a base density and is the exponent of the radial coordinate (Waters 1986; Jones et al. 2008). Typically values are g cm-3 and the power is about (Cote & Waters 1987; Waters et al. 1987; Silaj et al. 2010; Arcos et al. 2017; Vieira et al. 2017).
There is a general consensus about the importance of stellar rotation on the mass ejection process necessary to form a circumstellar disk. Frémat et al. (2005) derived a mean value for the average rotational velocity of Be stars on the order of 88% of break-up (or critical) velocity, 111Rotational velocity of a star at which the centrifugal force equals the gravitational force at the equator.. Cranmer (2005) showed that the hottest Be stars have a uniform spread of intrinsic rotation speed between 40 and 100% of their values, while the coolest Be stars are all quasi-critical rotators. Meilland et al. (2012) found a mean velocity ratio of that corresponds to a rotation rate of 222The rotational rate, , is the ratio of the stellar angular velocity to its critical one.. This means that only a small amount of energy would be needed to eject matter from the stellar surface, otherwise, the importance of other mechanisms (e.g., radiation pressure, pulsation, binarity) that could contribute to form the disk should be discussed.
Zorec et al. (2016) studied a set of 233 stars and transformed the distribution of observed projected rotational velocities into another distribution of true rotational velocities. Since the values become globally larger as stars evolve from the main sequence (MS) to later evolutionary phases, the distribution of true rotational velocities depends on the evolutionary state of the stellar sample. These authors concluded that once the mode of ratios of the true velocities of Be stars attains the value in the MS evolutionary phase, it remains unchanged up to the end of the MS lifespan. The statistical corrections for overestimations of , caused by macroturbulent motions and binarity, produce a shift of this distribution toward lower values when all MS evolutionary stages are considered together. Finally, the obtained final distribution has a mode at with a nearly symmetric distribution, showing that the Be phenomenon is present in a wide range of true rotational velocities (). With this result, the probability that Be stars are critical rotators is very low.
Meilland et al. (2012) proposed that an efficient way to test mass-ejection processes is to constrain the geometry and kinematics of Be stars’ circumstellar environments. This can only be performed using long-baseline interferometry with high spectral resolution. First detections of rotational signatures in the envelope of Be stars were carried out by Mourard et al. (1989). Later, Meilland et al. (2007b) obtained clear evidence of Keplerian rotation in the disk of Ara. Contemporaneous interferometric observations also provided information on the disk sizes (Tycner et al. 2005; Meilland et al. 2009; Sigut et al. 2015) and flattenings (Quirrenbach et al. 1997; Tycner et al. 2005), whilst a clear signature of polar wind was detected in Achernar by Kervella & Domiciano de Souza (2006). The presence of small-scale structures was found in CMa (Meilland et al. 2007a) and Tau (Carciofi et al. 2009) that were interpreted with the one-arm density-wave oscillation model proposed by Okazaki (1997).
In a few cases, the stellar photosphere was resolved by interferometry, allowing the determination of physical stellar parameters, as for Achernar (Domiciano de Souza et al. 2003). Long-baseline interferometry has also been a powerful tool for detecting companions and deducing physical parameters of binary systems and circumbinary disks; for example, Sco (Meilland et al. 2011), 48 Per and Per (Delaa et al. 2011), Cen (Meilland et al. 2008), HD 87643 (Millour et al. 2009) and Achernar (Kanaan et al. 2008).
To progress in the understanding of the physical processes responsible for the mass ejection and to test the hypothesis that they depend on stellar parameters, Meilland et al. (2012) initiated a survey of the circumstellar environments of eight bright Be stars: Col, CMa, Car, p Car, Cen, Cen, Ara, and Aqr. They observed the Br emission line to study the kinematics within the circumstellar disk. They determined the disk extension in the line and the nearby continuum for most of the targets and constrained the disk kinematics, showing that the disk rotation law is close to a Keplerian one. However, as they did not detect any correlation between the stellar parameters and the structure of the circumstellar environments they suggested that a larger sample of Be stars was needed to obtain conclusive results.
In this work, we present spectro-interferometric observations of a new set of 26 Be stars obtained using the Very Large Telescope Interferometer(VLTI)/Astronomical Multi-Beam Recombiner(AMBER) instrument described in Sect. 2. The results derived from our sample together with those obtained by Meilland et al. (2012) are discussed, with the aim being to understand the physical properties and origin of their circumstellar disks.
This paper is organized as follows: in Sect. 2 we present the observations. In Sect. 3 we describe the adopted model and stellar parameters used to fit interferometric data. In Sect. 4 we introduce the selected sample to study and provide a qualitative analysis of AMBER data of each object together with the best-fitting model parameters. We discuss our results in Sect. 5 and give our conclusions in Sect. 6.
2 Observations
Near-infrared (NIR) spectro-interferometric observations were carried out with the AMBER instrument (Petrov et al. 2007) installed on the VLTI at the Paranal Observatory, Cerro Paranal, Chile.
AMBER operates in the NIR part of the spectrum between 1.0 and 2.4 m. It was designed to coherently combine three telescope beams that can either be 8.2 m unit telescopes (UTs) or 1.8 m auxiliary telescopes (ATs). These three output beams are merged in a common Airy disk containing Young’s fringes, which are dispersed by a standard long-slit spectrograph on a two-dimensional (2D) detector. Per observation, AMBER delivers the visibilities and differential phases of the science target at three different spatial frequencies and one closure phase. The fringe contrast and phase are related to the Fourier transform of the source brightness distribution on sky at the observed spatial frequency , where B is the baseline distance of a telescope pair within the UT or AT configuration. The stabilisation of the fringes could be enhanced with the external fringe tracker FINITO (Fringe-tracking Instrument of NIce and TOrino), allowing longer DITs (detector integration time) up to 10 sec and leading to a better S/N on the spectrally dispersed fringes. Quite often, AMBER programs include the observation of calibrator objects to obtain not only differential but also absolute visibilities, using an estimation of the sizes of the calibrators and their visibilities. However, the drawback of using AMBER in high-resolution mode (HR, with R 12 000) with FINITO is the difficulty in determining a stable transfer function using calibrators that usually lead to poor data calibration.
We observed 26 Be stars using the AMBER instrument in conjunction with FINITO, from October 28 to 31, 2014. Our survey does not include the observation of calibrators. The observations were performed using the ATs, and the AMBER spectrograph was setup in the HR mode and centered on the Br 2.16 m emission line. This allows us to study the circumstellar gas kinematics through the Doppler effect. The lack of a calibrator is not an issue since the differential visibility, the differential phase, and the closure phase are independent of the effects that modify the absolute visibility.
The interference pattern is related to the source brightness via a 2D Fourier transformation of the complex visibility and for modeling purposes fairly good coverage of the plane is required.
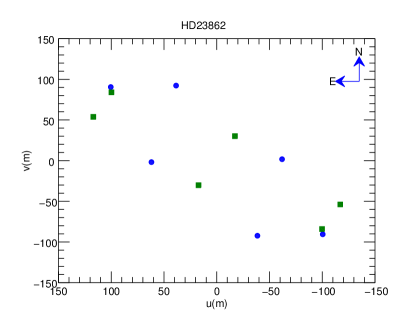
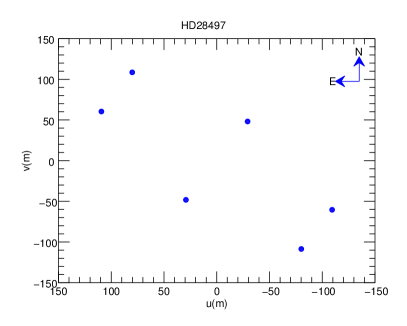
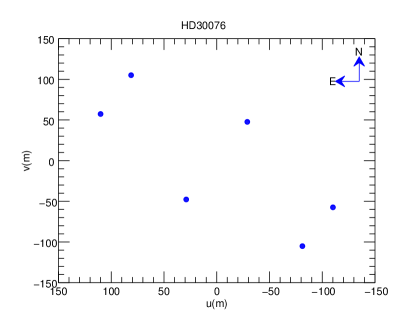
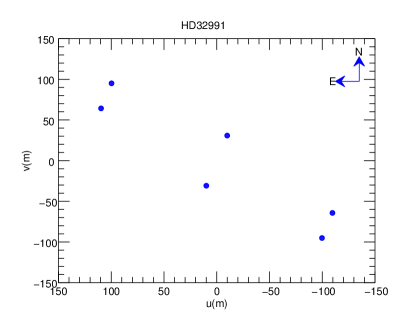
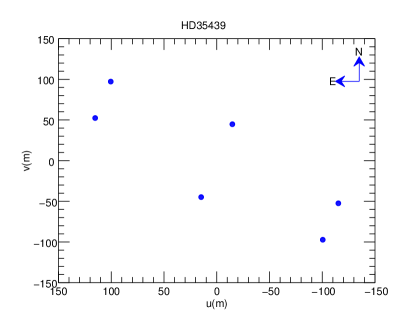
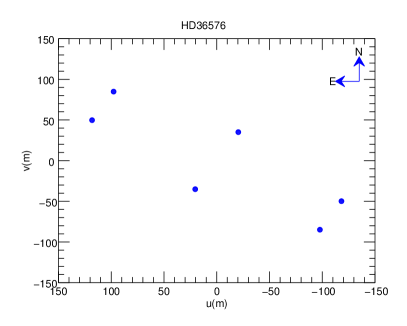
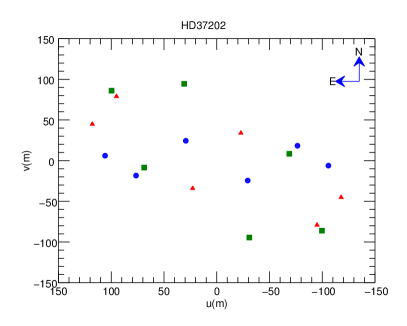
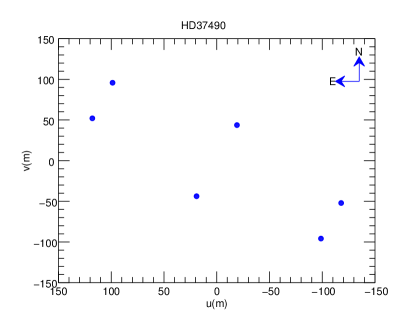
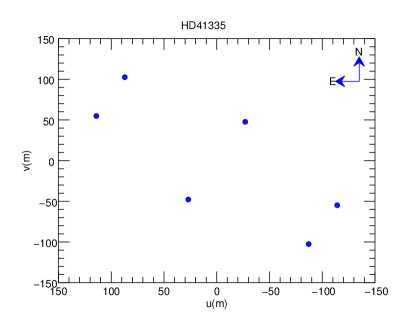
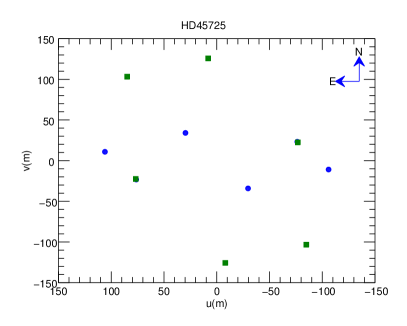
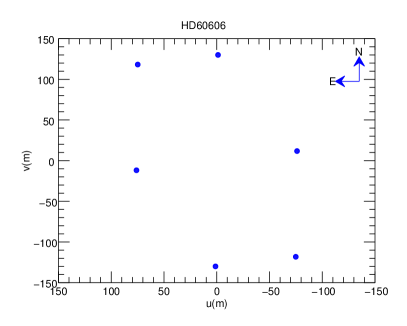
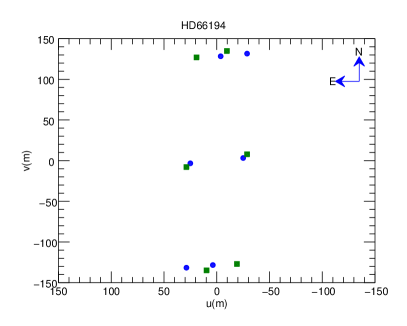
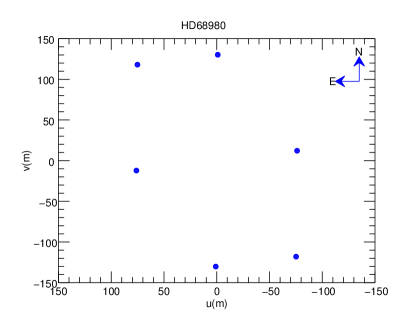
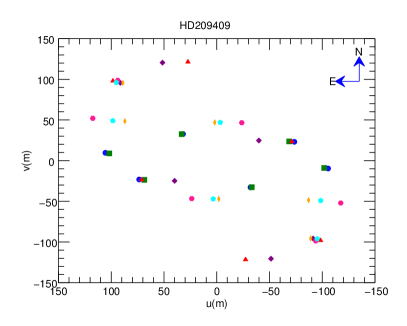
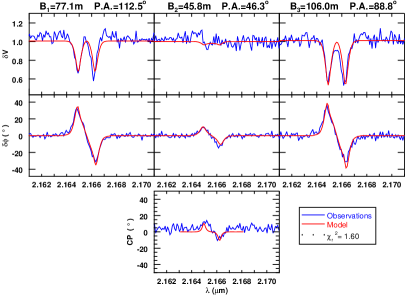
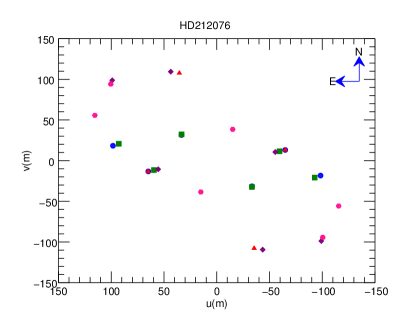
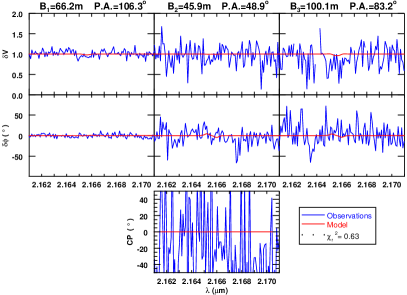
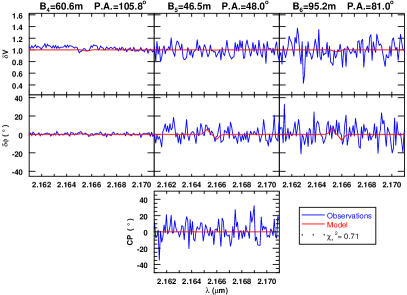
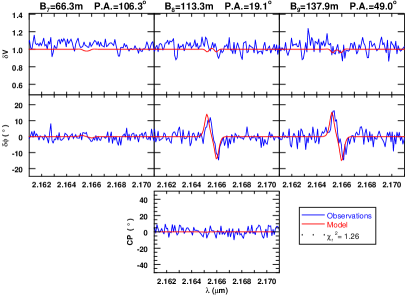
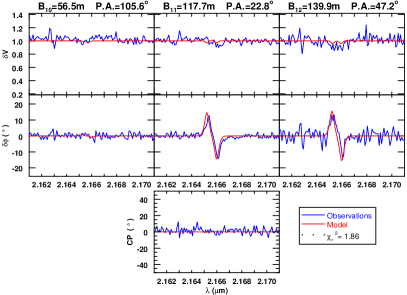
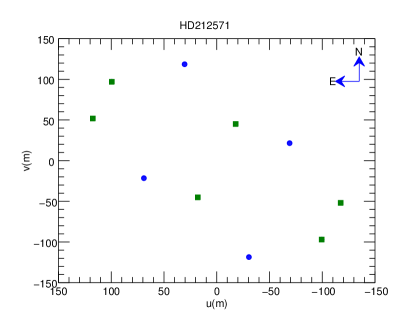
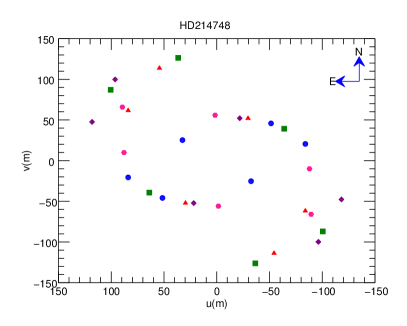
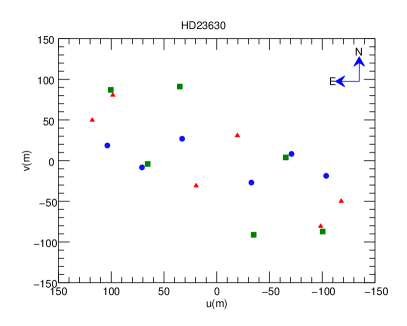
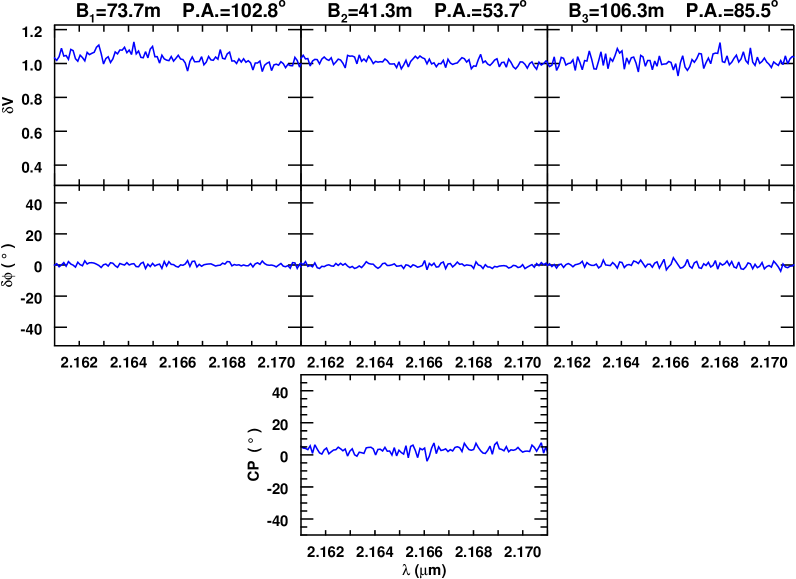
Table 1 presents the log of observations: HD number, date and time, telescope baseline configuration, baselines length and position angles, and integration time of our 26 Be stars AMBER dataset. The projected baselines, plane, in meters for each object of the selected sample (see Subsec. 4.1) is shown in Fig. 1 and online Figs. 19-36. Each observation in the () plane, that is, three baseline measurements, is plotted with different colors and symbols, as is explained in the caption of Fig. 1.
Data were reduced using the VLTI/AMBER data-reduction software (amdlib v3.0.9, see Tatulli et al. 2007; Chelli et al. 2009, for detailed information on the AMBER data reduction).
| HD Number | Date & Time | Telescope | Length (m) / Position angle (∘) | DIT | |||||
| UTC | Configuration | Bi | sec | ||||||
| HD 23 302 | 2014-10-29 05:57 | A1-I1-G1 | 77.5/ | 106.4 | 38.5/ | 54.3 | 106.5/ | 89.6 | 5.0 |
| 2014-10-31 06:24 | A1-K0-J3 | 126.8/ | 72.0 | 38.2/ | -36.1 | 123.8/ | 53.7 | 20.0 | |
| HD 23 338 | 2014-10-29 05:39 | A1-G1-I1 | 78.7/ | 108.1 | 36.8/ | 54.5 | 105.7/ | 91.6 | 5.0 |
| HD 23 408 | 2014-10-29 06:36 | A1-G1-I1 | 73.7/ | 102.8 | 41.3/ | 53.7 | 106.3/ | 85.5 | 5.0 |
| HD 23 480 | 2014-10-29 06:15 | A1-G1-I1 | 76.1/ | 104.9 | 39.9/ | 54.0 | 106.7/ | 87.9 | 5.0 |
| HD 23 630 | 2014-10-29 06:55 | A1-G1-I1 | 71.3/ | 101.2 | 42.5/ | 53.0 | 105.3/ | 83.6 | 5.0 |
| 2014-10-30 07:27 | A1-G1-J3 | 65.5/ | 97.9 | 97.6/ | 22.0 | 133.0/ | 51.4 | 5.0 | |
| 2014-10-31 06:45 | A1-K0-J3 | 128.1/ | 70.3 | 36.5/ | -33.9 | 127.3/ | 53.1 | 20.0 | |
| HD 23 862 | 2014-10-30 07:47 | A1-G1-J3 | 61.9/ | 96.0 | 100.0/ | 23.7 | 135.2/ | 50.3 | 5.0 |
| 2014-10-31 07:06 | A1-K0-J3 | 128.8/ | 68.4 | 34.7/ | -31.2 | 130.4/ | 52.3 | 20.0 | |
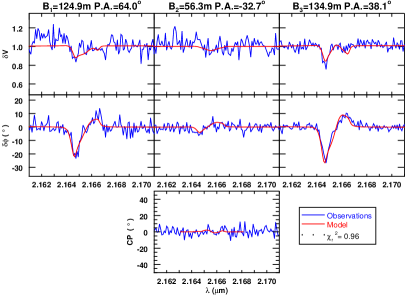
| HD 28 497 | 2014-10-31 05:46 | A1-K0-J3 | 124.9/ | 64.0 | 56.3/ | -32.7 | 134.9/ | 38.1 | 10.0 |
| HD 30 076 | 2014-10-31 06:05 | A1-K0-J3 | 124.2/ | 65.4 | 55.8/ | -32.7 | 132.8/ | 39.5 | 10.0 |
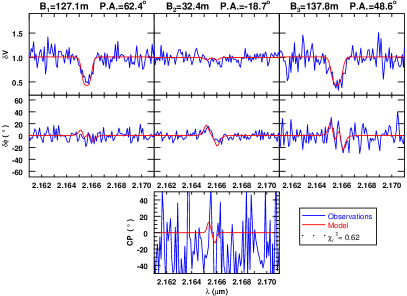
| HD 32 991 | 2014-10-31 09:20 | A1-K0-J3 | 127.1/ | 62.4 | 32.4/ | -18.7 | 137.8/ | 48.6 | 5.0 |
| HD 33 328 | 2014-10-30 07:01 | A1-G1-J3 | 79.9/ | 111.8 | 127.2/ | 5.3 | 135.8/ | 42.2 | 5.0 |
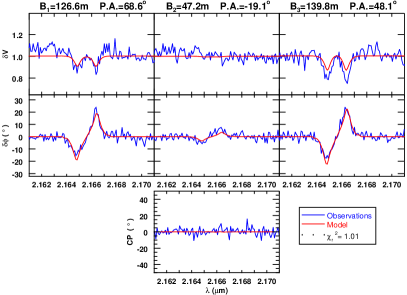
| HD 35 439 | 2014-10-31 09:02 | A1-K0-J3 | 126.6/ | 68.6 | 47.2/ | -19.1 | 139.8/ | 48.1 | 5.0 |
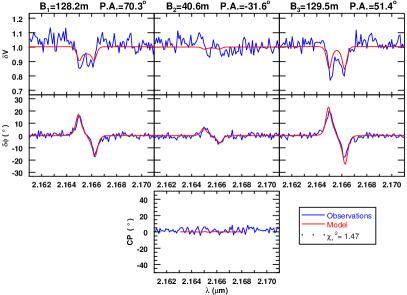
| HD 36 576 | 2014-10-31 08:25 | A1-K0-J3 | 128.2/ | 70.3 | 40.6/ | -31.6 | 129.5/ | 51.4 | 5.0 |
| HD 37 202 | 2014-10-29 07:37 | A1-G1-I1 | 78.7/ | 108.4 | 38.2/ | 52.6 | 106.0/ | 90.8 | 2.0 |
| 2014-10-30 08:56 | A1-G1-J3 | 69.3/ | 101.6 | 99.5/ | 19.0 | 131.7/ | 51.5 | 5.0 | |
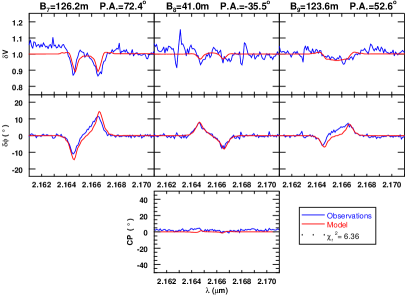
| 2014-10-31 08:07 | A1-K0-J3 | 126.2/ | 72.4 | 41.0/ | -35.5 | 123.6/ | 52.6 | 5.0 | |
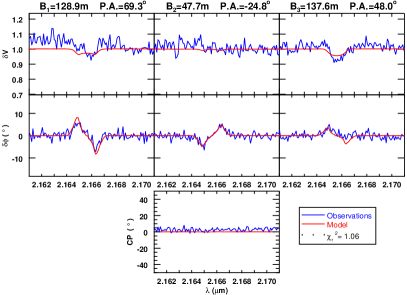
| HD 37 490 | 2014-10-31 08:41 | A1-K0-J3 | 128.9/ | 69.3 | 47.7/ | -24.8 | 137.6/ | 48.0 | 5.0 |
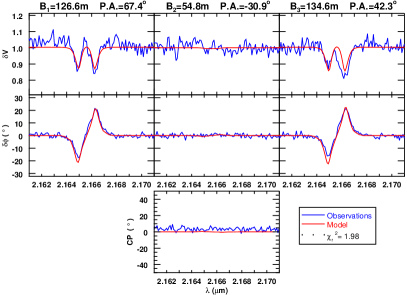
| HD 41 335 | 2014-10-31 07:50 | A1-K0-J3 | 126.6/ | 67.4 | 54.8/ | -30.9 | 134.6/ | 42.3 | 5.0 |
| HD 45 725 | 2014-10-29 08:30 | A1-G1-I1 | 79.8/ | 112.0 | 45.2/ | 42.9 | 106.5/ | 88.1 | 4.0 |
| 2014-10-30 08:08 | A1-G1-J3 | 80.0/ | 111.3 | 125.9/ | 3.9 | 133.7/ | 41.3 | 4.0 | |
| HD 60 606 | 2014-10-30 08:35 | A1-G1-J3 | 77.0/ | 103.5 | 130.0/ | -0.6 | 139.9/ | 33.9 | 10.0 |
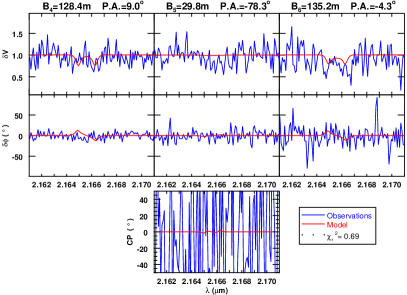
| HD 66 194 | 2014-10-31 04:37 | A1-K0-J3 | 128.3/ | -1.7 | 25.3/ | -86.5 | 134.7/ | -12.9 | 10.0 |
| 2014-10-31 05:21 | A1-K0-J3 | 128.4/ | 9.0 | 29.8/ | -78.3 | 135.2/ | -4.3 | 10. | |
| HD 68 980 | 2014-10-30 09:16 | A1-G1-J3 | 77.1/ | 103.8 | 130.1/ | -0.4 | 139.9/ | 34.0 | 5.0 |
| HD 75 311 | 2014-10-31 07:33 | A1-K0-J3 | 128.3/ | 28.8 | 38.8/ | -60.5 | 137.0/ | 11.7 | 5.0 |
| HD 209 409 | 2014-10-29 00:48 | A1-G1-I1 | 77.1/ | 112.5 | 45.8/ | 46.3 | 106.0/ | 88.8 | 2.0 |
| 2014-10-29 01:27 | A1-G1-I1 | 72.6/ | 114.1 | 46.5/ | 47.7 | 102.3/ | 89.0 | 2.0 | |
| 2014-10-30 01:06 | A1-G1-J3 | 74.8/ | 113.3 | 124.5/ | 13.3 | 138.9/ | 47.2 | 2.0 | |
| 2014-10-30 03:31 | A1-G1-J3 | 47.0/ | 127.6 | 131.0/ | 24.2 | 132.3/ | 45.7 | 2.0 | |
| 2014-10-31 00:25 | A1-K0-J3 | 128.5/ | 69.2 | 52.3/ | -28.2 | 136.1/ | 45.6 | 2.0 | |
| 2014-10-31 03:03 | A1-K0-J3 | 110.1/ | 66.5 | 47.1/ | -4.2 | 135.2/ | 46.8 | 2.0 | |
| 2014-10-31 03:39 | A1-K0-J3 | 99.7/ | 63.7 | 47.0/ | 2.4 | 130.5/ | 45.0 | 2.0 | |
| HD 212 076 | 2014-10-29 02:04 | A1-G1-I1 | 66.2/ | 106.3 | 45.9/ | 48.9 | 100.1/ | 83.2 | 5.0 |
| 2014-10-29 02:36 | A1-G1-I1 | 60.6/ | 105.8 | 46.5/ | 48.0 | 95.2/ | 81.0 | 5.0 | |
| 2014-10-30 02:02 | A1-G1-J3 | 66.3/ | 106.3 | 113.3/ | 19.1 | 137.9/ | 49.0 | 2.0 | |
| 2014-10-30 02:50 | A1-G1-J3 | 56.5/ | 105.6 | 117.7/ | 22.8 | 139.9/ | 47.2 | 5.0 | |
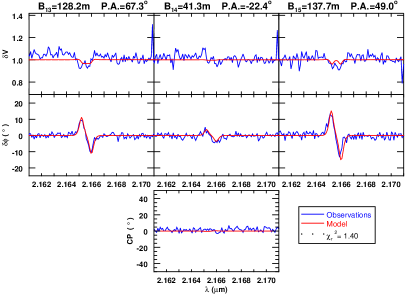
| 2014-10-31 01:57 | A1-K0-J3 | 128.2/ | 67.3 | 41.3/ | -22.4 | 137.7/ | 49.0 | 5.0 | |
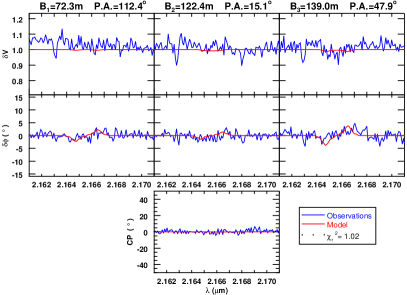
| HD 212 571 | 2014-10-30 01:42 | A1-G1-J3 | 72.3/ | 112.4 | 122.4/ | 15.1 | 139.0/ | 47.9 | 2.0 |
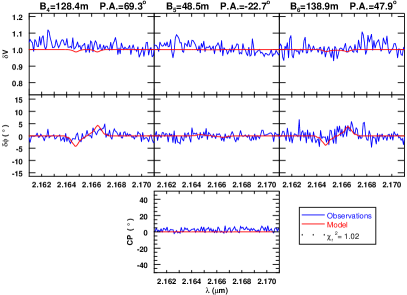
| 2014-10-31 01:38 | A1-K0-J3 | 128.4/ | 69.3 | 48.5/ | -22.7 | 138.9/ | 47.9 | 10.0 | |
| HD 214 748 | 2014-10-29 03:30 | A1-G1-I1 | 68.9/ | 137.9 | 41.2/ | 54.6 | 86.4/ | 108.7 | 5.0 |
| 2014-10-30 02:28 | A1-G1-J3 | 75.0/ | 127.3 | 131.4/ | 16.9 | 132.9/ | 51.4 | 2.0 | |
| 2014-10-30 04:34 | A1-G1-J3 | 59.9/ | 157.4 | 126.0/ | 26.7 | 104.2/ | 56.2 | 5.0 | |
| 2014-10-31 01:20 | A1-K0-J3 | 127.4/ | 71.2 | 56.5/ | -23.8 | 138.7/ | 46.1 | 5.0 | |
| 2014-10-31 04:15 | A1-K0-J3 | 88.5/ | 87.5 | 55.9/ | 1.7 | 111.1/ | 56.2 | 5.0 | |
| HD 219 688 | 2014-10-29 04:15 | A1-G1-I1 | 57.0/ | 129.6 | 44.0/ | 48.5 | 79.2/ | 95.2 | 5.0 |
| HD 224 686 | 2014-10-29 03:51 | A1-G1-I1 | 79.9/ | 132.6 | 36.2/ | 70.8 | 103.4/ | 114.3 | 5.0 |
3 Metodology
3.1 Disk model
Interferometric data are often analyzed using a 2D kinematic model of a rotating and/or expanding equatorial disk. This simple “toy model” has been used to describe circumstellar disks of classical Be stars (Meilland et al. 2012; Delaa et al. 2011; Meilland et al. 2011); see Delaa et al. (2011) for a detailed description of the model.
This model includes a central star described by a uniform disk of constant brightness , where and are the spatial Cartesian coordinates on the sky plane, surrounded by a circumstellar envelope. The envelope emission in the line, , and continuum, , are described by two elliptical Gaussian distributions of different FWHMs, named and , but with the same flattening due to a projection effect on the sky of a geometrically thin equatorial disk that depends on the inclination angle , being , where is the major axis and is the minor axis.
The emission maps were combined with a 2D projected velocity map, , of the geometrically thin equatorial disk,
| (1) |
where and are the rotational and radial velocity laws for the disk with the radial distance given by Hutchings (1970) and Castor et al. (1975), respectively,
| (2) | ||||
| (3) |
where is the stellar radius, the rotational velocity at the disk inner radius, the expansion velocity at the photosphere, the terminal velocity, the exponent of the expansion velocity law and the exponent of the rotational velocity law.
For each wavelength and within a narrow spectral band , an iso-velocity map projected along the line of sight, , was calculated and multiplied by the whole emission map in the line. The whole emission map for each wavelength is the weighted sum of the stellar map, the disk continuum map and the emission line map:
| (4) | ||||
| (5) |
where and are respectively the contributions of the total continuum flux from the star and the disk, while is the line equivalent width.
The model parameters can be classified into different categories:
-
•
Stellar parameters: , distance (), inclination angle (), disk major-axis position angle () .
-
•
Kinematic parameters: , , , and .
-
•
Disk continuum parameters: disk FWHM in the continuum (), disk continuum flux normalized by the total continuum flux ().
-
•
Disk emission line parameters: disk FWHM in the line (), and line equivalent width ().
We know how each parameter affects the visibility and phase variations (Meilland et al. 2012), and most parameters are unambiguously constrained using a few baselines with various orientations and lengths. Therefore, we decided to perform the model-fitting manually (instead of an automatic fit of the models). For all targets we set the expansion velocity to zero, since usually the radial velocity in the disk is assumed negligible (Miroshnichenko et al. 2003; Vinicius et al. 2006; Meilland et al. 2007a, b). For the other parameters (especially , , , and , which strongly affect the interferometric observables and, therefore, are easily and unambiguously constrained), we started with rough value estimates from a preliminary fit to our interferometric data and, then, we explored the parameter space by decreasing steps to minimize (see details below). We also explored the full range of possible model parameters using larger steps to make sure there are no other minima. Once we had obtained the best-fitting model, we changed the parameters one by one to find the uncertainty of each one. We consider the limit of uncertainty when the model is no longer a good fit for the observations. In what follows, we briefly describe each parameter.
-
•
(major axis position angle) modifies the amplitude of phase variations and the drop of the visibility (Meilland et al. 2011). For a nonfully resolved disk, the amplitude of the “S” shape variation is proportional to the baseline length and depends on its orientation. When the baseline is aligned with the major axis of the circumstellar envelope, the amplitude of the “S” shape is maximum and the visibility variation is “W” shaped, as shown in the B1 baseline of Fig. 1. At the same time, when the baseline is aligned with the minor axis the amplitude of the “S” shape is null and the shape of the drop of the visibility changes from “W” to “V” shaped, as shown in the B5 baseline of Fig. 1. We started the fit with 10∘ steps in the 0-360∘ range, and refined the grid using a final step of 1∘.
-
•
is measured from the Br line profile. To derive the model sensitivity to the , this value was varied up to using steps between 1 and 0.1 .
-
•
(disk FWHM in the emission line in stellar diameters, ) has a huge influence on the drop of the visibility along all baselines and on the amplitudes of the “S” shapes of the differential phases. Phase variation loses its “S” shape for those baselines that fully resolved the disk, because of secondary effects due to inhomogeneities of the disk or, as in most of our observations, because of a mathematical effect due to the over-resolution of the disk as shown in the B9 baseline of Fig. 1. This mathematical effect is due to a property of the Fourier transform, by which the visibility goes through zero when a simple object is fully resolved, and beyond that, its phase is inverted. This effect is more complex in the case of a multicomponent object, that is, the rotating disk around a Be star, and it generates the loss of the ”S” shape of the phase variations in a fully resolved disk. The parameter also affects the double-peak separation (the larger the disk, the smaller the separation). We calculated models with values in the 1-20 range, with steps of between 0.5 and 0.1.
-
•
(disk FWHM in the continuum in stellar diameters, ) is mainly derived from visibility measurements in the continuum. This parameter sets the relative flux of the disk in the continuum. As the disk emission in the continuum is larger than the stellar photosphere, this parameter affects the level of the absolute visibility in the continuum, that is, the absolute visibility in the continuum decreases when increases. Therefore, it can modify the amplitude of the phase variations. The more resolved an object is in the continuum, the smaller the phase variations are. We explored the values in the 1-20 range, with steps of between 1 and 0.1.
-
•
(inclination angle) also has a significant effect on the drop of the visibility for baselines close to the polar orientation; it also has influence on the line-peak separation since it is related to the projected rotational velocity. The space parameter for is the range 0-90∘, and we explored steps of between 5∘ and 1∘.
-
•
(rotational velocity) and (exponent of the rotational velocity law) influence the double-peak separation and line width. The faster the disk rotates, the larger the peaks separate. On the other hand, as increases, the rotational velocity drops faster with distance, the line double-peak separation becomes smaller, and the line wings wider. It is quite hard to set both and unambiguously. The only way to do that is to study the disk kinematics using multiple lines formed in different parts of the disk. As and describe the global disk kinematics, they should not depend on the observed line. This has been done only once, on the Be star Sco (Meilland et al. 2011), using the H line from the VEGA instrument, and Br and the 2.06 m He i lines from AMBER. It is worth mentioning emission line wings can also be affected by nonkinematic broadening caused by noncoherent scattering (Delaa et al. 2011). Unfortunately, we do not have measurements in other lines to solve the ambiguity, therefore we explored the space parameter of and to derive rough values. For , the space parameter was limited by (obtained from and ) and , and we explored this interval using initial steps of 10 km s-1 and decreasing them to minimal steps of 2 km s-1. For , we inspected the range, with initial steps of 0.05 and final steps of 0.01.
.
3.2 Stellar parameters from SED fittings
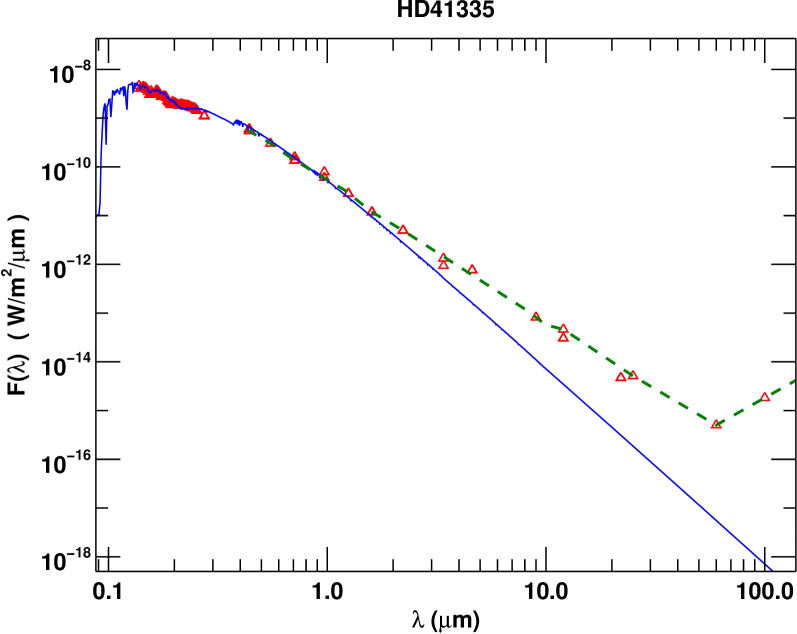
In order to derive and for the selected sample, we performed fittings to the spectral energy distributions (SEDs). For each target, we reconstructed its SED using data available from the VIZIER database. We fitted a Kurucz (1979) model to the photometric data (Ochsenbein et al. 2000) using a minimization method implemented in the library IDL routine “mpfit” (details about the algorithm used can be found in Sect. 3.1 of Arcos et al. (2018). The input parameters are , and the reddening . The and values were taken from Frémat et al. (2005). The value of was set in 3.1, using the interstellar extinction law from Cardelli et al. (1989).
For three of the sample stars (HD 32 991, HD 37 202 and HD 66 194) values are not available in the literature. Therefore, we also obtained from the SED fitting.
To avoid contamination from the disk flux, the SED was fitted in the ultraviolet and optical wavelength ranges (Meilland et al. 2009). We fixed the stellar parameter from Table 2, except for and , which are left free (and in the cases commented before). From the best-fitting model we constrained and for all the targets, and also the effective temperature, , for HD 32 991, HD 37 202, and HD 66 194.
In Fig. 2 we present an example of an SED fitting model. Red triangles represent the photometric data from the VIZIER database, the solid blue line represents the best-fitting Kurucz model, and the dashed green line shows the IR excess.
4 Results
4.1 The selected sample and stellar parameters
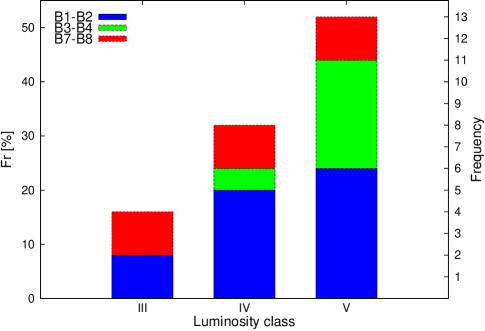
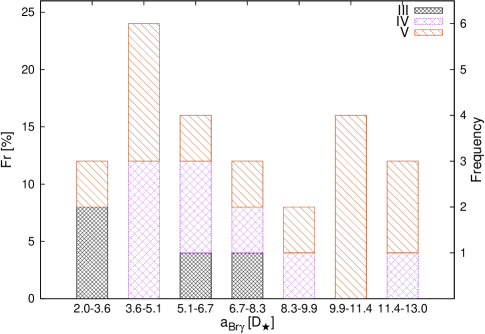
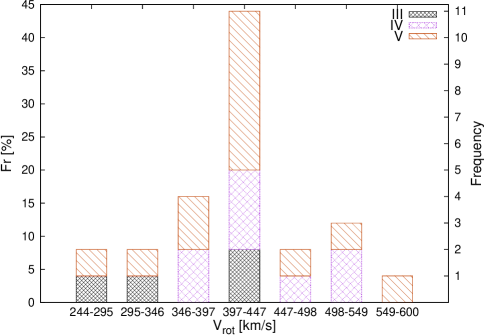
Our sample consists of 26 Be stars observed with the VLTI/AMBER instrument. As shown in Fig. 3, the majority of the stars show a double-peaked emission profile. Shell line profiles are observed in HD 23 862 (28 Tau) and HD 37 202 ($ζ$ Tau). The Br line is weak in HD 212 571 ($π$ Aqr) while eight stars (HD 23 302, HD 23 338, HD 23 408, HD 23 480, HD 33 328, HD 75 311, HD 219 688, and HD 224 686) display an absorption line profile. These last eight stars are excluded from the present study because we want to model the circumstellar disk emission. Therefore, our final sample contains 18 Be stars with , spectral types between B1 and B8, and luminosity classes between V and III, distributed according to the histogram displayed in Fig. 4. Around 55% of our star sample have spectral types B1-B2, and the others are distributed almost uniformly between B3-B4 and B7-B8. The sample does not have stars with spectral types B5-B6. Around 60% of the star sample are in luminosity class V. Stars with luminosity classes IV and III are a few more than 20% and 15% of the total sample, respectively. Luminosity classes IV and III are mostly present in spectral types B1-B2 and B7-B8, while luminosity class V is spread over all the spectral subtypes sampled.

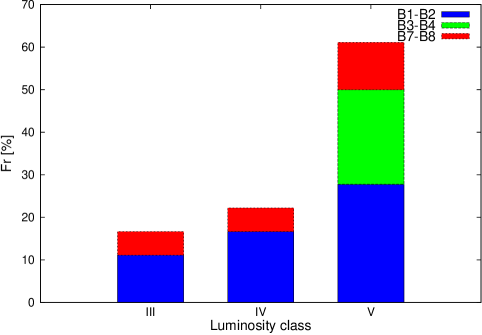
Table 2 lists known and calculated parameters for stars with the Br line in emission: the HD number and star name are given in the first two columns; columns 3 and 4 list the -band magnitude () and spectral type (ST), respectively, taken from the CDS database. Column 5 lists the distance to the star in pc () which was taken from van Leeuwen (2007) and Astraatmadja & Bailer-Jones (2016). Columns 6, 7, and 8 give the effective temperature (), projected rotational velocity (), and break-up velocity () taken from Frémat et al. (2005), with the exception of the stellar parameters for HD 32 991, HD 37 490, and HD 66 194, which we estimated from fittings to the SEDs using Kurucz (1979) atmospheric models (see Sect. 3.2). For HD 32 991, the was taken from Abt et al. (2002), and for HD 37 490 and HD 66 194 from Chauville et al. (2001). Columns 9, 10, and 11 list the polarization angle (), disk continuous flux contribution relative to the total flux in the -band (), and the stellar radius (). The polarization angle, was taken from Yudin (2001). and were also derived from the SED by fitting a Kurucz (1979) model as is explained in Sect. 3.2.
| Name | HD Number | (a) | ST(a) | (c) | (c) | (d) | (e) | (e) | ||
|---|---|---|---|---|---|---|---|---|---|---|
| (mag) | (pc) | (K) | (km s-1) | (km s-1) | (∘) | () | ||||
| $η$ Tau | HD 23 630 | 2.940 | B7III | 127 8 (f) | 12258 505 | 149 8 | 274 15 | 34 | 6.6 | 0.71 |
| 28 Tau | HD 23 862 | 4.937 | B8Vne | 117 5 | 12106 272 | 290 15 | 420 22 | 69 | 3.5 | 0.19 |
| 28 Eri | HD 28 497 | 5.798 | B2(V)ne | 465 63 | 26724 427 | 342 24 | 631 45 | 120 | 4.1 | 0.63 |
| 56 Eri | HD 30 076 | 5.452 | B2(V)nne | 822 486(f) | 20488 330 | 225 12 | 456 25 | 148 | 11.0 | 0.47 |
| 105 Tau | HD 32 991 | 4.775 | B2Ve | 250 43(f) | 20900 (e) | 175 18(g) | – | 126 | 3.8 | 0.90 |
| $ψ_01$ Ori | HD 35 439 | 5.355 | B1Vn | 318 85 | 22134 665 | 266 13 | 513 26 | 142 | 6.1 | 0.09 |
| 120 Tau | HD 36 576 | 4.777 | B2IV-Ve | 476 73 | 22618 508 | 266 13 | 487 25 | 113 | 4.5 | 0.87 |
| $ζ$ Tau | HD 37 202 | 2.970 | B1IVe-shell | 136 16 | 19310 550 | 326 7 | 466 13 | 34 | 6.1 | 0.58 |
| $ω$ Ori | HD 37 490 | 4.805 | B3Ve | 423 52 | 14492 (e) | 155 5 (h) | 319 (h) | 9 | 13.5 | 0.02 |
| V696 Mon | HD 41 335 | 4.770 | B3/5Vnne | 403 122 | 20902 610 | 376 26 | 520 36 | 147 | 8.2 | 0.44 |
| $β_01$ Mon | HD 45 725 | 4.030 | B4Ve-shell | 207 49 | 17810 455 | 345 21 | 486 30 | 14 | 5.0 | 0.32 |
| OW Pup | HD 60 606 | 5.050 | B2Vne | 363 32 | 18030 332 | 285 16 | 441 25 | – | 6.2 | 0.56 |
| V374 Car | HD 66 194 | 5.359 | B3Vn | 379 47(f) | 14089 (e) | 200 29(h) | 367 (h) | 130 | 7.9 | 0.32 |
| MX Pup | HD 68 980 | 4.554 | B2ne | 284 13 | 25126 642 | 152 8 | 534 31 | – | 6.0 | 0.40 |
| $o$ Aqr | HD 209 409 | 4.661 | B7IVe | 133 4 | 12942 402 | 282 20 | 391 27 | 6 | 4.4 | 0.17 |
| 31 Peg | HD 212 076 | 4.685 | B2IV-Ve | 497 70 | 19270 326 | 103 6 | 439 26 | 58 | 8.0 | 0.70 |
| $π$ Aqr | HD 212 571 | 5.351 | B1III-IVe | 239 16 | 26061 736 | 233 15 | 558 37 | 177 | 5.2 | 0.30 |
| $ϵ$ PsA | HD 214 748 | 4.400 | B8Ve | 149 15 | 11966 356 | 205 13 | 317 21 | 3 | 6.6 | 0.02 |
Values taken from: $a$$a$footnotetext: CDS database; $b$$b$footnotetext: van Leeuwen (2007), except noted otherwise; $c$$c$footnotetext: Frémat et al. (2005), except noted otherwise; $d$$d$footnotetext: Yudin (2001); $e$$e$footnotetext: SED fittings; $f$$f$footnotetext: Astraatmadja & Bailer-Jones (2016); $g$$g$footnotetext: Abt et al. (2002); $h$$h$footnotetext: Chauville et al. (2001).
4.2 Disk parameters and properties
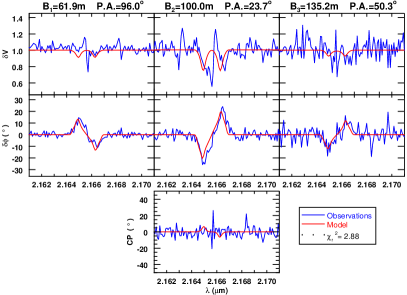
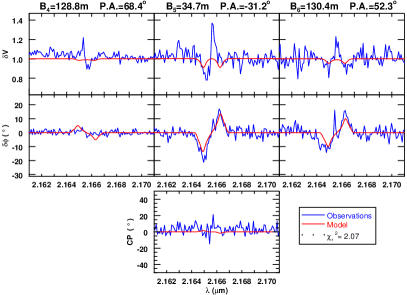
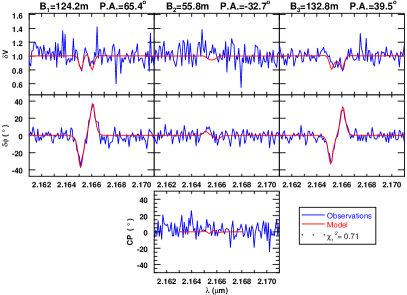
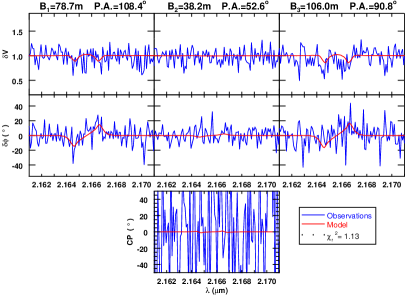
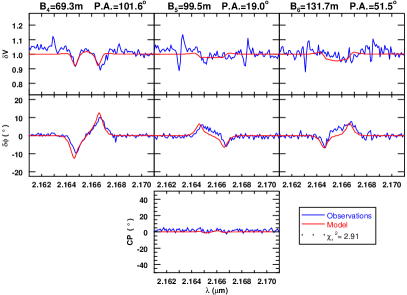
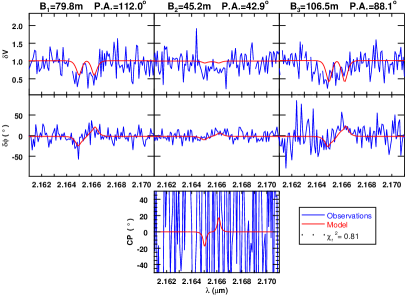
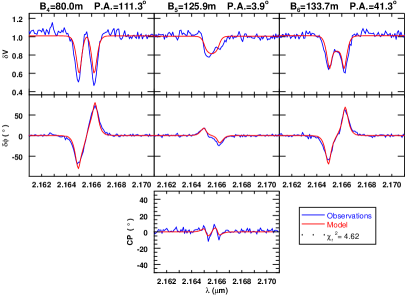
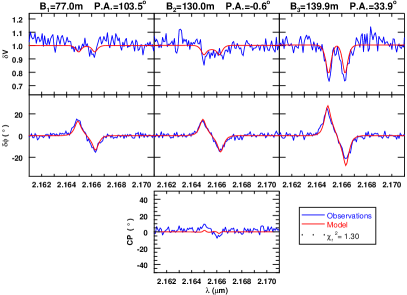
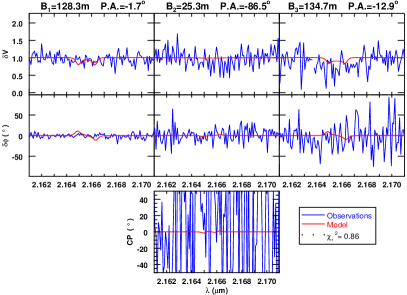
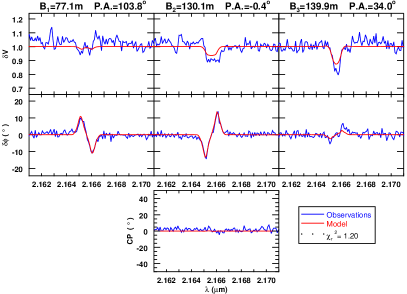
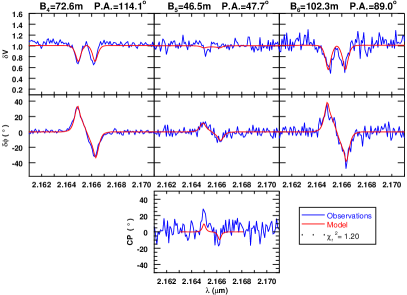
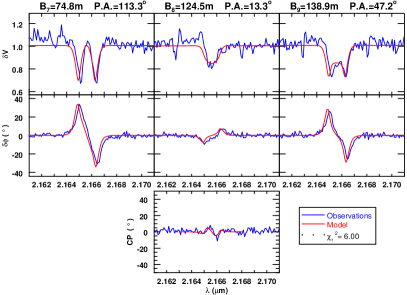
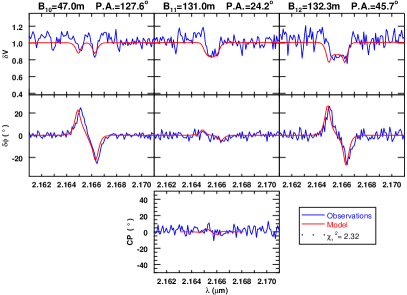
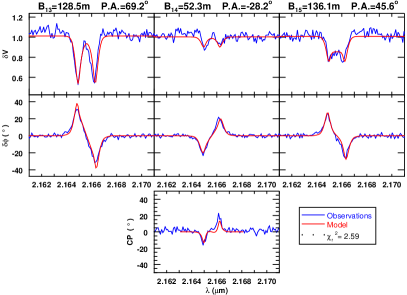
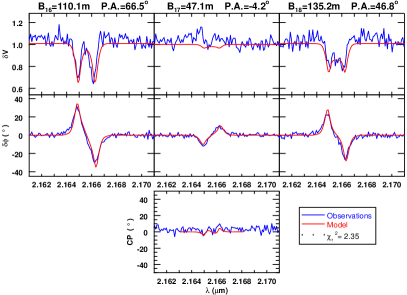
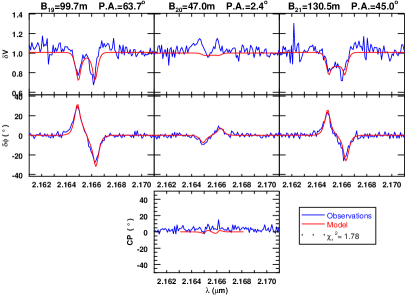
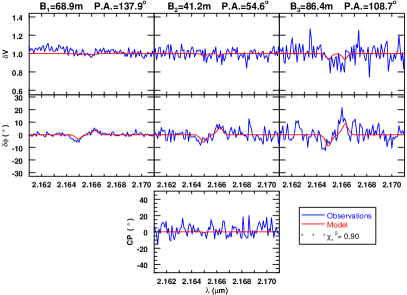
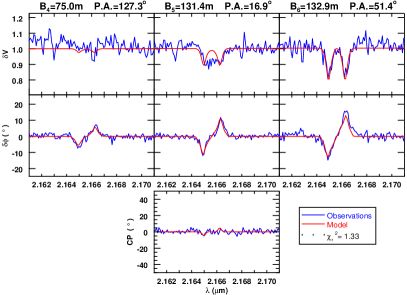
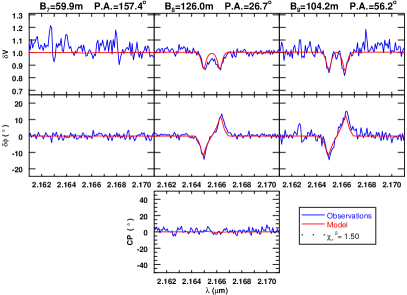
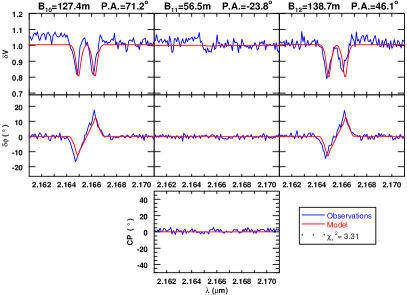
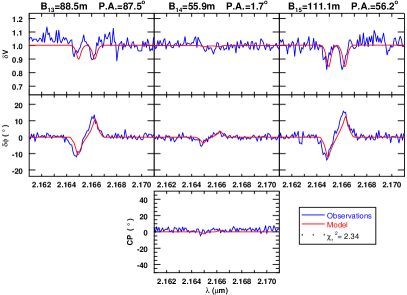
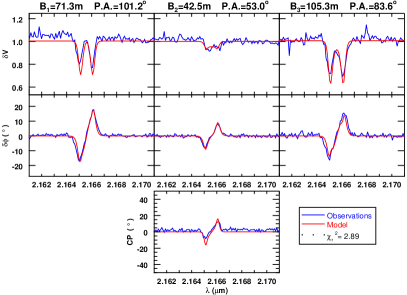
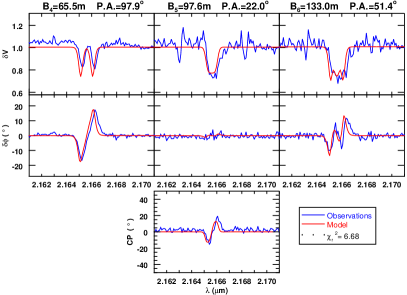
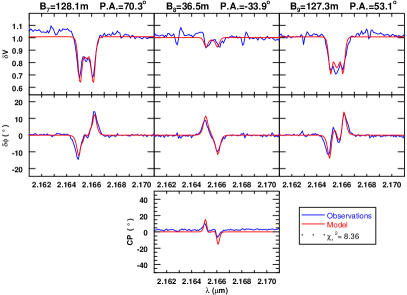
For the 18 stars that show the Br emission line, Fig. 1 and online Figs. 19-36 present the () plane coverages, differential visibilities, differential phases and closure phases as a function of wavelength, together with the best-fitting model. Differential visibilities, differential phases and closure phases from our observations are plotted in blue, and the best-fitting kinematic model is overplotted in red.
In almost all cases, the data show a drop of visibility in the emission line caused by variations in either the disk extension or the relative flux between the line and the continuum (Meilland et al. 2007b). In these cases, the visibility drop is “W” shaped and the differential phase is “S” (or more complex) shaped. Both characteristics bring out a rotating equatorial disk (Meilland et al. 2011).
For the stars with the Br line in absorption, Fig. 5 shows, as an example, the differential visibility, differential phase, and the closure phase as a function of wavelength for the unresolved disk of HD 23408.
The upper rows of Table 3 summarize the parameters of the best-fitting model obtained from our axisymmetric kinematic model for each star with the Br line in emission. Column 1 gives the HD number of each star; columns 2 and 3 list global parameters of the disk (inclination angle and the position angle ); columns 4 and 5 give the kinematical parameters of the disk ( and ); columns 6 and 7 provide values for the major axis of the disk in the continuum () and in the line (), respectively; columns 8 and 9 give Br EW and V/R ratio; and column 10 lists the reduced of the fit.
To derive we modeled the differential visibility normalized to the continuum, and the uncertainties (see Table 3) were obtained following the procedure described in Sect. 3. In some cases, the uncertainties are not listed because the values were not properly constrained. Therefore only a rough value (marked with ∗ in Table 3) is given, which corresponds to the parameter obtained from a fitting model that minimizes the value. Despite the large uncertainty on the parameter , the parameters of the disk at the line frequency are still quite accurate, since they are determined independently of the values (i.e., using the drop of visibility in the line).
| Global geometric | Global kinematic | K-band continuum | Br | ||||||||||||
| parameters | parameters | disk geometry | disk geometry | ||||||||||||
| Parameter | V/R | - | |||||||||||||
| (∘) | (∘) | (km s-1) | - | () | () | () | - | - | |||||||
| HD 23630 | 53 | 5 | 110 | 5 | 270 | 25 | -0.45 | 0.05 | 1.31.0 | 7.0 | 1.0 | 5.80 | 0.8 | 1.02 | 5.86 |
| HD 23862 | 85 | 5 | 333 | 10 | 410 | 50 | -0.47 | 0.05 | 4.0* | 11.0 | 1.0 | 8.86 | 1.0 | 1.00 | 2.31 |
| HD 28497 | 44 | 10 | 30 | 10 | 600 | 50 | -0.35 | 0.05 | 6.02.0 | 11.0 | 2.0 | 14.00 | 3.0 | 1.29 | 0.96 |
| HD 30076 | 38 | 5 | 73 | 4 | 400 | 20 | -0.45 | 0.05 | 6.01.0 | 10.0 | 0.5 | 20.67 | 3.0 | 1.06 | 0.70 |
| HD 32991 | 40 | 10 | 157 | 5 | 500 | 50 | -0.50 | 0.05 | 2.0* | 13.0 | 2.0 | 20.00 | 2.0 | 1.07 | 0.62 |
| HD 35439 | 55 | 5 | 45 | 20 | 397 | 50 | -0.50 | 0.05 | 1.7* | 4.5 | 0.3 | 20.00 | 5.0 | 0.96 | 1.01 |
| HD 36576 | 60 | 5 | 198 | 10 | 380 | 50 | -0.40 | 0.02 | 2.01.0 | 13.0 | 1.0 | 15.00 | 3.0 | 1.01 | 1.60 |
| HD 37202 | 67 | 5 | 127 | 5 | 400 | 30 | -0.45 | 0.03 | 4.7* | 4.8 | 0.4 | 7.43 | 2.0 | 1.02 | 3.19 |
| HD 37490 | 49 | 5 | 305 | 5 | 308 | 30 | -0.50 | 0.05 | 1.0* | 2.5 | 0.5 | 11.62 | 3.0 | 1.02 | 0.97 |
| HD 41335 | 68 | 5 | 55 | 5 | 400 | 30 | -0.60 | 0.03 | 2.0* | 5.0 | 0.4 | 17.00 | 4.0 | 0.95 | 1.98 |
| HD 45725 | 72 | 5 | 101 | 5 | 440 | 40 | -0.50 | 0.03 | 1.2* | 12.0 | 1.0 | 22.70 | 2.0 | 0.97 | 2.71 |
| HD 60606 | 70 | 10 | 240 | 10 | 390 | 20 | -0.50 | 0.05 | 2.0* | 7.5 | 0.5 | 17.00 | 2.0 | 1.03 | 1.23 |
| HD 66194 | 55 | 5 | 220 | 20 | 350 | 50 | -0.40* | 3.0* | 8.0 | 1.0 | 10.73 | 2.0 | 1.01 | 0.78 | |
| HD 68980 | 22 | 3 | 310 | 5 | 410 | 40 | -0.50 | 0.05 | 1.5* | 3.0 | 0.5 | 25.00 | 4.0 | 1.03 | 1.16 |
| HD 209409 | 70 | 5 | 290 | 5 | 355 | 50 | -0.45 | 0.03 | 3.0* | 8.0 | 0.5 | 18.12 | 2.0 | 1.02 | 2.50 |
| HD 212076 | 22 | 5 | 202 | 20 | 400 | 60 | -0.50 | 0.05 | 3.0* | 4.0 | 0.5 | 12.00 | 2.0 | 1.01 | 1.16 |
| HD 212571 | 34 | 10 | 87 | 15 | 440 | 40 | -0.50 | 0.1 | 1.5* | 2.0 | 0.3 | 6.00 | 2.0 | 1.00 | 1.01 |
| HD 214748 | 73 | 10 | 67 | 10 | 244 | 20 | -0.46 | 0.03 | 2.0* | 3.9 | 0.4 | 5.00 | 0.5 | 1.04 | 1.85 |
| HD 37795 | 35 | 5 | 10 | 350 | 10 | -0.5 | 0.1 | 2.00.5 | 5.5 | 0.3 | 7.0 | 0.5 | 1.04 | 4.0 | |
| HD 50013 | 35 | 10 | 25 | 10 | 480 | 40 | -0.5 | 0.2 | 3.50.5 | 6.2 | 2.0 | 13.0 | 2.0 | 1.13-1.10 | 6.8 |
| HD 89080 | 65 | 10 | 5 | 5 | 300 | 20 | -0.45 | 0.1 | 3.01.0 | 6.5 | 1.0 | 5.8 | 0.5 | 1.04 | 1.1 |
| HD 91465 | 70 | 10 | -25 | 10 | 400 | 30 | -0.45 | 0.1 | 2.00.5 | 11.0 | 2.0 | 10.0 | 1.0 | 1 | 2.5 |
| HD 105435 | 35 | 15 | 40 | 10 | 500 | 50 | -0.5 | 0.3 | 2.01.0 | 9.0 | 2.0 | 19.2 | 2.0 | 1 | 2.3 |
| HD 120324 | 25 | 5 | 80 | 15 | 510 | 20 | -0.5 | 0.1 | 3.0 | 4.0 | 1.0 | 5.6 | 0.3 | 1.03 | 1.3 |
| HD 158427 | 45 | 5 | 88 | 2 | 480 | 20 | -0.5 | 0.1 | 2.0 | 5.8 | 0.5 | 14.5 | 1.0 | 1.01 | 1.7 |
4.3 Comments on individual objects
-
•
HD 23630 ($η$ Tau) is a Be star of spectral type B7 III that belongs to the the Pleiades cluster. It exhibits a H line profile without significant changes on long timescales (Tycner et al. 2005). Using interferometric observations and a Gaussian fit for the H emission, Tycner et al. (2005) found an angular diameter of 2.080.18 mas for the major axis of an elliptical Gaussian model. Grundstrom & Gies (2006) obtained, using Tycner et al. (2005) data, an inclination angle , and an interferometric ratio between the disk radius in the continuum and the stellar radius of , while the disk extension is derived from the H line EW.
Silaj et al. (2010) fitted the observed H double-peaked emission line using a central star of B8 spectral type and a power-law mass density distribution for the disk, . These authors also derived the following parameters: inclination angle and base density at the stellar equator g cm-3.
Touhami et al. (2013) made a K-band continuum survey using the CHARA Array long-baseline interferometer and found that the circumstellar disk of Tau was unresolved.
For this object we performed three interferometric measurements with very high S/Ns using the VLTI/AMBER interferometer (see Fig. 1). The best-fitting model provides the following geometrical and kinematical parameters for the disk: , , km s-1, , , and . We noted that although the baselines were not oriented along the measured , the differential phase lose the “S” shape for those baselines that fully resolved the disk. The derived inclination from the interferometric data is in agreement with the expected shape for the Br double-peaked line profile (shown in Fig. 3) that suggests a disk seen at intermediate inclination angle.
-
•
HD 23862 (28 Tau) is a Be star of spectral type B8 V, member of the Pleiades cluster. It is a single-lined spectroscopic binary with a low-mass companion (Nemravová et al. 2010). It has an orbital period of 218 days, a semi-amplitude of 5.9 km s-1, and a large orbital eccentricity (Katahira et al. 1996a, b). The orbital solution proposed by Nemravová et al. (2010) has a semimajor axis between 223.5 and 225.5 , and a periastron separation between 53.0 and 53.4 , depending on the orbital inclination of the system.
The star underwent several B, Be, and Be shell transition phases with a period of 34 years (Sadakane et al. 2005). From the analysis of the long-term polarimetric observations, Hirata (2007) interpreted the variation of the polarization angle in terms of the precession of the disk caused by the companion.
The star disk was marginally resolved with the CHARA array. Touhami et al. (2013) derived a disk-to-star radius ratio of , adopting a and axial ratio . Fitting the H line profile, Silaj et al. (2014) obtained a model with an inclination angle , a disk base density of g cm-3, and a power-law index of 2.5.
For this object we obtained two interferometric measurements with a good S/N (see Fig. 19). The best-fitting model provides the following geometrical and kinematical parameters for the disk: , , km s-1, , , and . The Br line profile exhibits a double-peaked emission with a shell absorption line at its center (Fig. 3), typically seen in Be stars at a high inclination angle.
-
•
HD 28497 (228 Eri) is a Be star of spectral type B2. This star has shown variable emission and shell episodes. Andrillat et al. (1990) derived a size for the H region between 1.79 and 4.79 stellar radii. Silaj et al. (2010) fitted the H double-peaked emission using as a best-fitting model a central star with spectral type B0 and the following disk parameters , g cm-3, and , while Vieira et al. (2017) obtained , and from the IR continuum radiation.
We obtained one interferometric measurement with a high S/N (see Fig. 20). The “W” and ‘S” shapes from the differential visibility and differential phases were very asymmetrical, being the amplitude smaller in the red than the blue part of the spectrum. Both features were impossible to fit with a simple model. The Br line was also clearly asymmetrical, with a (see Fig. 3). To improve the fit of our data we considered a disk model with one-arm over-density, like the one developed by Okazaki (1997). We considered an antisymmetric spiral-like intensity distribution similar to the one given by Stee et al. (2013, in their Eq. 5). The best-fitting model provides the following geometrical and kinematical parameters for the disk: , , km s-1, , , and . The arm was oriented with an angle from the major axis of the envelope.
-
•
HD 30076 (56 Eri) is a B2 V Be star. Andrillat et al. (1990) derived a size for the H region of between 1.37 and 6.0 stellar radii. Silaj et al. (2010) fitted the H double-peaked emission line using a central star of spectral type B2 and disk parameters with , g cm-3, and . From a statistical study, Jones et al. (2011) found that this star is variable with a confidence level of 95%.
We performed one interferometric measurement (see Fig. 21). The disk parameters for the best-fitting model are: , , km s-1, , , and . The position angle of the B1 baseline () was oriented close to the measured of the disk, thus the “W” and “S” shaped features in the visibility drop and differential phase were clearly present. The observed double-peaked Br line profile (Fig. 3) is consistent with the line-of-sight inclination angle obtained from the interferometric model.
-
•
HD 32991 (105 Tau) is an early-type Be shell star (B2 V). The star exhibits photometric variability as Cas type variables (Lefèvre et al. 2009). The best-fitting model parameters derived by Silaj et al. (2010) from the H emission line are: a central B2 type star plus a disk with , g cm-3, and . This object has not previous disk size determinations.
We obtained one interferometric measurement (see Fig. 22). The best-fitting model provides the following set of disk parameters: , , km s-1, , , and . As the observed baseline B2 (with ), oriented along the major axis of the disk, was the shortest one, the “W” and “S” shaped features in differential visibility and differential phase are very weak. The Br line single-peaked profile (Fig. 3) is consistent with the small inclination angle obtained using our interferometric model.
-
•
HD 35439 ($ψ_01$ Ori) is a variable star of spectral type B1 V, passing from Be B Be phases. Andrillat et al. (1990) derived a size for the H region of between 1.31 and 3.66 stellar radii. Silaj et al. (2010) fitted a double-peaked H line profile using a B0-type central star with the following disk parameters , g cm-3, and . The value of is greater than the one derived by Vieira et al. (2017) from the WISE SED ( and ). On the other hand, Arcos et al. (2017) found two different set of parameters: , g cm-3, by modeling observations of the H line taken in 2012 and , g cm-3, and from data taken in 2015.
We performed one interferometric measurement (see Fig. 23). The best-fitting disk model parameters are: , , km s-1, , , and . The B3 baseline had an orientation close to the of the major axis of the disk, therefore pronounced “W” and “S” shaped features were observed in the differential visibility and differential phase. The double-peaked Br line profile shown in Fig. 3 is consistent with the shape expected from a disk with inclination angle derived from the interferometric model.
-
•
HD 36576 (120 Tau) is a B2 IV-V Be star. This star presents multiperiodicity consistent with multimodal nonradial pulsations (Bossi et al. 1989). The size of the H line forming region was estimated to be between 1.28 and 3.59 stellar radii by Andrillat et al. (1990). Silaj et al. (2010) modeled the single-peaked H line emission using a power-law density distribution for a central B2 type star plus a disk with parameters: , g cm-3, and . However, from the SED model, Vieira et al. (2017) obtained , and .
We performed one measurement using the VLTI/AMBER interferometer (see Fig. 24). The best-fitting model for the disk provides the following geometrical and kinematical parameters: , , km s-1, , , and . Although the baselines were not oriented close to the measured of the disk, the “W” shape in differential visibility and “S” shape in the differential phase are clearly seen in the largest baseline. The double peaked Br line profile is consistent with the shape expected from a disk with an intermediate angle orientation.
-
•
HD 37202 ($ζ$ Tau) is one of the most observed Be stars. It has a spectral type B1 IV. It has been known as a spectroscopic binary for decades. Harmanec (1984) derived an orbital period of 132.9735 days and an eccentricity .
Complex variations in the H shell spectrum and long-term V/R variations were observed (Ballereau et al. 1987; Tycner et al. 2005). As the star is close enough ( pc, van Leeuwen 2007), the circumstellar disk can be resolved with the actual instruments, and spectro-interferometry extends this resolution to the disk dynamics. The limb-darkened photospheric diameter was estimated at 0.4 mas (Tycner et al. 2004; Gies et al. 2007), and this corresponds to a radius of 5.5 to 6 at the Hipparcos distance.
Using interferometric observations and fitting Gaussians from the H emission disks, Tycner et al. (2005) found a value for the major axis of 3.140.21 mas. Based on Tycner et al. (2005) data, Grundstrom & Gies (2006) derived an inclination angle , and interferometric radius of , while from the H line EW they calculated a disk extension of . Touhami et al. (2011) presented an analysis of -band observations of the continuum emission from the circumstellar gas disk obtained with CHARA Array. Using a radiative transfer code for a parameterized version of the viscous decretion disk model they derived the following parameters: g cm-3, , , and disk temperature .
Gies et al. (2007), using CHARA in the -band, measured the semi-major axis of the disk to 1.79 mas or 4.5 . This value is lower than the estimated Roche-lobe radius for the primary star of the system, which Tycner et al. (2004) computed as 144 12 (5.3 mas), at a binary separation of 254 20 (9.2 mas). Considering this separation between both components the secondary star would be out of the circumstellar disk, in agreement with other models (Castle 1977). Štefl et al. (2009) studied three V/R cycles between 1997 and 2008. They found that after each minimum in V/R, the shell absorption weakens and splits into two components, leading to three emission peaks. Also, the phasing of the Br emission showed that the photocenter of the line-emitting region lied within the plane of the disk but was offset from the continuum source. The plane of the disk remained stable throughout the observed V/R cycles. Schaefer et al. (2010) resolved the circumstellar disk between 2007 and 2009 with the MIRC beam combiner at the CHARA array. They fit a nearly edge-on disk, with a FWHM major axis 1.8 mas at the -band. In addition, they found a correlation between the position angle of the disk and the spectroscopic V/R ratio, suggesting that the disk is precessing.
For this object, we obtained three interferometric measurements, two with a quite high S/N ratio and one with a lower S/N (see Fig. 25). The best-fitting model provides the following geometrical and kinematical parameters for the disk: , , km s-1, =-0.45, , and . The line profile is typical for a Be star seen at high inclination angle (double-peaked with a shell absorption line at its center), in agreement with its Be shell classification. For the observations with good S/N, the “W” shape in the drop of the differential visibility and “S” shape of the differential phase are clear.
-
•
HD 37490 ($ω$ Ori) is a classical B3 V emission line star, which has been studied over many years. It presents short ( 1 day) and mid-term ( 11 months) photometric variability (Balona et al. 1987; Bergin et al. 1989; Balona et al. 1992). These variations were associated to nonradial pulsations, and the increase or decrease of the disk size. Andrillat et al. (1990) estimated a size for the H region of between 1.07 and 2.27 stellar radii. Neiner et al. (2002) determined the stellar parameters employing two methods: astrophysical formulae and the Barbier-Chalonge-Divan (BCD) spectrophotometric system. With the stellar parameters derived from the BCD system, =4.306 0.016 and g=3.48 0.03, they determined =0.83, , , and using evolutionary tracks from Schaller et al. (1992).
Balona et al. (2002) found a km s-1 from nonemission helium lines, and km s-1 from the metal lines. They suggested that even the helium lines with weak emission are likely contaminated by the emission from the gas disk. Neiner et al. (2003) found evidence for the presence of a weak magnetic field, sinusoidally varying with a period of 1.29 days. However, new observations were unable to confirm the presence of this magnetic field (Neiner et al. 2012). Silaj et al. (2010) fitted the double-peaked H emission line using a central star of spectral type B2, , g cm-3, and . van Belle (2012) suggested that this object is a possible target for interferometric observations, with an estimated angular size of 0.5 mas and flattening =0.13.
For this star we obtained one interferometric measurement (see Fig. 26) and derived the following parameters for the disk: , , km s-1, , , and . The shape of the double-peaked line profile indicates that the object is seen from an intermediate inclination angle, consistent with the value we derived and a more precise determination of obtained by Neiner et al. (2003).
-
•
HD 41335 (V696 Mon) is an interacting binary system (Peters 1972). Peters (1983) measured the radial velocity and obtained an orbital period of 80.86 days. The system consists of a primary star B1.5IV-V of and a secondary of . They measured a separation between the components of 0.84 UA (). Studying the system SED, Waters et al. (1991) showed that the companion could be a hot subdwarf (Sd) star but not a cool giant star. Based on UV and H observations, Peters et al. (2016) was able to detect the weak signal of the spectral lines corresponding to a hot Sd star, and proposed a primary star with 9 and a secondary with 0.7 . They proposed that this Sb star creates a one-armed spiral feature, a tidal wake in the disk of the Be star (Thaller et al. 1995, named Be+SdO binary system or Per type). Andrillat et al. (1990) derived a size for the H circumstellar envelope of between 1.66 and 3.43 stellar radii. From the SED, Vieira et al. (2017) obtained , and . Furthermore, Arcos et al. (2017) derived g cm-3, , and .
We performed one interferometric measurement for this object (Fig. 27). The best-fitting model provides the following geometrical and kinematical parameters of the disk: , , km s-1, =-0.6, , and . The double-peaked line profile, the drop of the differential visibility and phase variations present small asymmetries. The largest baselines (B1 and B3) were oriented with an angle close to the disk . Therefore, the “W” shape in the drop of differential visibility and the “S” shape of the differential phase are clear. The double-peaked line profile is consistent with the line shape seen at an intermediate inclination angle. Although Peters et al. (2016) proposed the presence of a one-armed spiral structure, we have not needed to consider an overdensity to fit our data.
-
•
HD 45725 ($β_01$ Mon) is a Be-shell star of spectral type B4 V. This object has been catalogued as a triple star by Struve (1925). Abt & Cardona (1984) measured separations of 7.1”, 2.8”, and 25.9” between the system components. Assuming that these separations were the semimajor axis of the orbits, they estimated periods of 10 000, 2 600, and 100 000 years, respectively. Oudmaijer & Parr (2010) catalogued the system as a binary and fit bidimensional Gaussians to the spatial profiles, finding a separation between the components of 7.14 arcsec and a position angle of 133∘. Andrillat et al. (1990) derived a size for the H region of between 1.86 and 3.64 stellar radii.
van Belle (2012) suggested that HD 45 725 is a good candidate for interferometric observations, with estimations for the projected rotational velocity of km s-1, an angular size of 0.70 mas, and a flattening of =0.17. Arcos et al. (2017) obtained the following disk parameters g cm-3, n= 2, and .
We obtained two interferometric measurements, one with a relatively high S/N and the other with a low value (see Fig. 28). The best-fitting disk model provides the following geometrical and kinematical parameters: , , km s-1, =-0.5, , and . We note that the Br line does not present the shell absorption profile expected for our high value of the inclination angle. The baselines B1 and B4 were very similar and were oriented close to the . The baselines B2 and B6 had almost the same orientation, but different lengths, and therefore the shape of the differential visibility and differential phase are more evident in the B6 base.
-
•
HD 60606 (OW Pup) is a B2V Be star. Lefèvre et al. (2009) catalogued this object as a Cas-type variable. The SED was modeled by Vieira et al. (2017) who derived , and , while from the H line Arcos et al. (2017) obtained the following disk parameters: g cm-3, , and . There are no disk size determinations available for this object.
Based on one interferometric measurement (Fig. 29), the best-fitting model provides the following geometrical and kinematical parameters for the disk: , , km s-1, =-0.5, , and . The longest baseline was also the closest to the modeled , and therefore the “W” shape of the differential visibility and the “S” shape of the differential phase are well defined.
-
•
HD 66194 (V374 Car) is a Be star of spectral type B3V and is a member of the open cluster NGC 2516. It has been identified as a blue straggler star by Ahumada & Lapasset (2007). González & Lapasset (2000) reported some variability in the measured radial velocities and suggested that this object could be a spectroscopic binary with mass transfer in a close system. The star exhibits photometric variability as Cas-type variables (Lefèvre et al. 2009). This object has not previous disk size determinations.
We performed two interferometric observations with a low S/N ratio (Fig. 30). The best-fitting model provides the following geometrical and kinematical parameters for the disk: , , km s-1, , , and . Both observations were carried out with a very similar instrumental configuration. Therefore, none of them show clear signs of either a drop in the differential visibilities or the typical “S” shape in the differential phase. The Br line profile is consistent with the intermediate inclination angle obtained from our interferometric model (see Fig. 3).
-
•
HD 68980 (MX Pup) is a spectroscopic binary of spectral type B1.5 IVe (Slettebak 1982) with a period of 5.1526 days and a very excentric orbit (Carrier et al. 2002). Its light curve also shows long-term variability with a time scale of about 9 years accompanied by variations (Mennickent et al. 1997; Hanuschik et al. 1995). Silaj et al. (2010) used a simple power-law model to fit the one-peaked emission H line profile, using a central star of B2 spectral type with the following disk parameters: , g cm-3, and . Arcos et al. (2017) obtained two set of independent parameters for the disk, g cm-3, , and using observations taken in 2013, and , , and with data acquired in 2015. Whilst Vieira et al. (2017) derived from the SED a , and . There are no disk size determinations available for this object.
We obtained one interferometric measurement (Fig. 31). The best-fitting model provides the following geometrical and kinematical parameters for the disk: , , km s-1, , , and . The longest B3 baseline was oriented almost perpendicular to the of the disk. The differential visibility has a “V” shape and the differential phase has a small amplitude “S” shape. The Br line profile is in emission with a small asymmetry (see Fig. 3). Its shape is consistent with a line profile seen at the small inclination angle found.
-
•
HD 209409 ($o$ Aqr) is a rapidly rotating Be shell star classified as a B7 IV. The star has a stable H emission and does not show variations (Rivinius et al. 2006). The star has been fully resolved by interferometry in many studies. Touhami et al. (2013) derived a disk-to-star radius ratio , and , while Cyr et al. (2015) found an axis ratio of 0.25 in the -band. Sigut et al. (2015) combined H and interferometric data covering a period of 7 years and concluded that all the observations were consistent with a circumstellar disk seen at an inclination of and with g cm-3, and . Meilland et al. (2012) obtained the following parameters for the disk: , , km s-1, , , and . Alternatively, Yudin (2001) found for the observed polarization. From line profile fittings, Silaj et al. (2010) modeled the double-peaked H line profile with a central B8 type star and disk parameters with , g cm-3, and , while Arcos et al. (2017) obtained a lower base density and index power (g cm-3, and ), and two different inclinations: (in 2013), and (in 2015).
For this target we obtained seven interferometric measurements with high S/Ns (Fig. 32 and 33). From the best-fitting disk model we derived: , , km s-1, , , and . The baselines B1, B and B7 were oriented close to the of the disk, and therefore the “W” shape of the drop of the differential visibility and the “S” shape of the differential phase are well defined. The B11 baseline was one of the largest and was oriented almost perpendicularly to the measured , so the drop of the differential visibility has a “V” shaped structure and the “S” shaped feature of the differential phase has a small amplitude. The double-peaked Br line profile, the “W” shaped feature in the drop of the differential visibility and the “S” shaped feature of the differential phase are quasi-symmetric. This indicates that the object is seen from a high inclination angle and it does not present major inhomogeneity in the disk.
-
•
HD 212076 (31 Peg) is a Be star with a spectral type B2 IV-V. The star disk was marginally resolved with the CHARA array. To derive a disk-to-star radius ratio of , Touhami et al. (2013) should adopt a and axial ratio . Silaj et al. (2010) fitted the H emission line assuming a circumstellar disk surrounding a B2 type-star with , g cm-3, and . These disk parameters differ from those found by Arcos et al. (2017, , , g cm-3 in 2012, and g cm-3 in 2015) and by Vieira et al. (2017, , and .).
We obtained five interferometric observations, three with high S/N and two with low S/N ratios. The best-fitting model corresponds to an equatorial disk with , , km s-1, , , and . The shapes of “W” in the visibility drop and “S” in the differential phase are seen in a few baselines (generally the largest), as shown in Fig. 34.
-
•
HD 212571 ($π$ Aqr) is a Be star of spectral type B1 III-IV. From the analysis of the H line profile, Bjorkman et al. (2002) suggested that HD 212571 may be a binary system with an orbital period of 84.1 days, consisting of stars with masses of M☉, and M☉. They also suggested that photometric, spectroscopic, and polarimetric variations observed during the second half of the twentieth century might be due to variable mass transfer between the binary components. Wisniewski et al. (2010) found that the timescale of disk-loss events corresponds to almost 29 complete orbits of the binary companion. They also found that the position angle of the intrinsic polarization is , indicating that the disk is oriented on the sky at a position angle of .
Silaj et al. (2010) modeled the H double-peaked emission line using a B0-type central star and an equatorial disk with g cm-3, and , seen with an inclination angle . Arcos et al. (2017) derived three different sets of parameters, using spectra taken at different epochs: g cm-3, , and for the epochs 2012 and 2015, and g cm-3, , and for 2013, while Vieira et al. (2017) obtained and from the SED. The disk size has not been determined for this object.
We performed two interferometric measurements with good S/N (Fig. 35) and derived the following geometrical and kinematical parameters for the disk: , , km s-1, , , and . The “W” shape in the drop of the differential visibility is barely perceptible in the B3 and B4 baselines. The “S” shape of the differential phase is present only in a few baselines. The double-peaked Br line profile is very weak, as shown in Fig. 3.
-
•
HD 214748 ($ϵ$ PsA) is a fast-rotating B-type star with a stellar classification B8 Ve. Arcos et al. (2017) modeled the H line emission using a power-law density distribution with gr cm-3, , and . This disk base density is higher than the one calculated by Vieira et al. (2017) (, and ) based on a pseudo-photosphere model for the disk continuum emission.
We performed five interferometric measurements with a high S/N (see Fig. 36). The best-fitting model provides the following geometrical and kinematical parameters for the equatorial disk: , , km s-1, , , and . The B10 baseline was oriented close to the observed of the disk. The Br line is in emission and exhibits a strong asymmetry (see Fig. 3).
4.4 Polarization angle
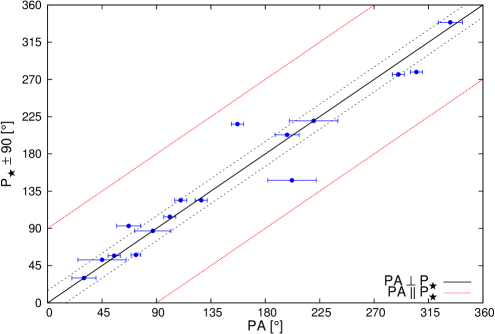
The polarization position angle in an optically thin axisymmetric disk is usually perpendicular to the plane of the disk since it mainly comes from electron scattering (Brown & McLean 1977). However, Delaa et al. (2011) reported that for 48 Per the major axis is oriented parallel to the polarization angle, and proposed that this might be due to the disk optical thickness. In almost all cases the disk major axes of our star sample seem to be roughly perpendicular to the polarization measurement, as shown in Fig. 6. Exceptions are HD 32991, and HD 212076. Both objects have small inclination angles that make the determination of the interferometric position angles more uncertain, especially when the observations have a bad S/N, as in HD 32991, or reveal the presence of a small disk, like in HD 212076.
For HD 23 862, the is almost perpendicular to the polarization angle measured by Yudin (2001), but different from previous reported values. This difference could be explained by disk precession caused by a companion (Hirata 2007).
4.5 Global properties
In most cases, our simple kinematic model reproduced our measurements. However, in one case (HD 28 497) we needed to add a “one-armed” over-density structure to improve the fit process of our data. The disk kinematics is dominated by rotation, with a law close to a Keplerian rotation in almost all targets. The largest discrepancies are found in HD 36 576 (), HD 41 335 (), HD 66 194 (), and HD 28 497 (). The last one corresponds to the object with the “one-armed” over-density.
Using the and values taken from the literature and our own values, we obtained the ratios presented in Table 4. We found a mean ratio of .
The rotational rate is defined in Frémat et al. (2005) by the ratio of the stellar angular velocity to its critical one, , where and are the equatorial radii (in polar radii) for stars rotating at and , respectively. Values of are listed in Table 4. The mean rotational rate from our sample of Be stars is .
| HD 23630 | 0.68 | 0.12 | 0.87 | 0.09 |
|---|---|---|---|---|
| HD 23862 | 0.69 | 0.08 | 0.87 | 0.06 |
| HD 28497 | 0.78 | 0.25 | 0.93 | 0.13 |
| HD 30076 | 0.79 | 0.18 | 0.94 | 0.09 |
| HD 32991 | - | - | ||
| HD 35439 | 0.63 | 0.10 | 0.83 | 0.09 |
| HD 36576 | 0.63 | 0.09 | 0.83 | 0.08 |
| HD 37202 | 0.76 | 0.07 | 0.92 | 0.04 |
| HD 37490 | 0.64 | 0.07 | 0.84 | 0.06 |
| HD 41335 | 0.78 | 0.14 | 0.93 | 0.07 |
| HD 45725 | 0.75 | 0.11 | 0.91 | 0.07 |
| HD 60606 | 0.69 | 0.12 | 0.87 | 0.09 |
| HD 66194 | 0.67 | 0.14 | 0.86 | 0.11 |
| HD 68980 | 0.76 | 0.18 | 0.92 | 0.10 |
| HD 209409 | 0.77 | 0.13 | 0.93 | 0.07 |
| HD 212076 | 0.62 | 0.21 | 0.82 | 0.18 |
| HD 212571 | 0.75 | 0.29 | 0.91 | 0.17 |
| HD 214748 | 0.68 | 0.12 | 0.87 | 0.09 |
4.6 Statistical analysis of the combined sample
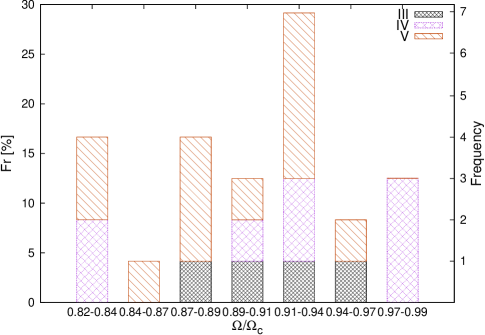
With the aim of studying a larger and more representative sample of Be stars and gaining a better understanding of the physical properties and origin of the circumstellar envelopes, we combine our results with those obtained by Meilland et al. (2012). The star HD 209409 was excluded from the Meilland et al. (2012) sample, and disk parameters were derived from our new observation, which has a higher S/N, improving the model fitting. The disk parameters obtained by Meilland et al. (2012) are listed in the lower rows of Table 3. Therefore, the combined star sample contains 25 Be stars, with spectral types between B1 and B8, and luminosity classes between V and III, distributed according to the histogram displayed in Fig. 7.
To search for the optimal bin number and bin size in each histogram, we adopted a bin-width optimization method that minimizes the integrated squared error (Shimazaki & Shinomoto 2007).
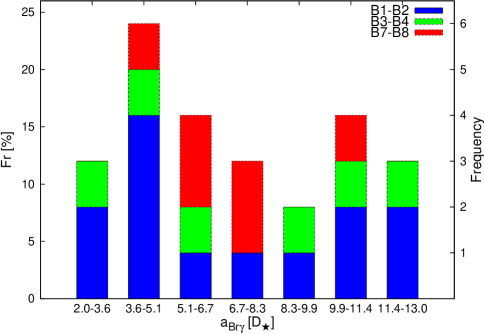
The distribution of the disk extension in the line per spectral type and luminosity class is presented in Fig. 8. This distribution is bimodal, with maxima at and . About a third of the star sample shows small disks, with between and . The largest measured for the disk size is 13 . Stars with luminosity class V present disks with different sizes, whilst stars with luminosity class III only present disks smaller than .
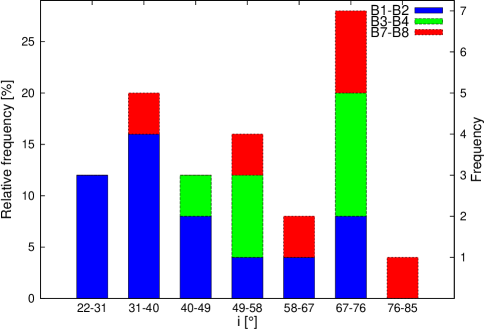
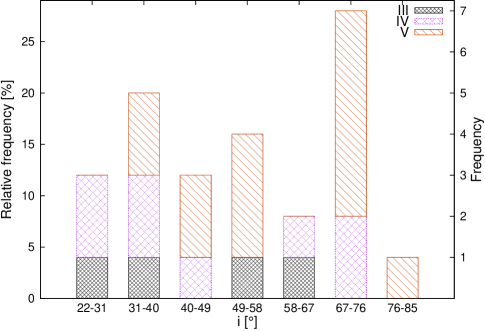
In Fig. 9 we present the distribution of the observed inclination per spectral type and luminosity class. The distribution presents a peak at the interval 67-76∘. A few late B-type stars were observed near equator-on (). Stars seen at small angles (lower than 40∘) are mostly of spectral type B1-B2, and all luminosity classes are seen. For intermediate values, the distribution is almost uniform for the different spectral types. Our sample does not have stars of luminosity class III seen at high inclination angles.
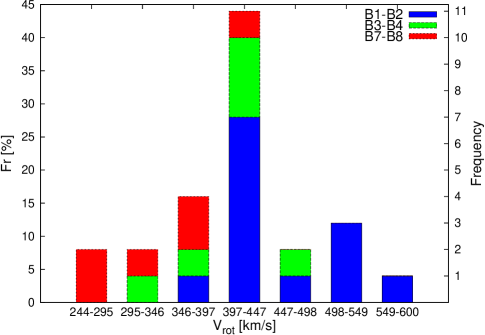
In Fig. 10 we present the distribution of the rotational velocity at the disk inner radius () per spectral type and luminosity class. This distribution has a peak in the bin km s-1. The peak contains stars of all spectral types and luminosity classes. Early spectral-type stars have disks with high rotational velocities, whilst late B-type stars show disks with low rotational velocities. As regards the luminosity class, all stars exhibit more or less the same distribution, with a maximum at km s-1. Only one star (HD 28497) has an extremely high value of , that reaches km s-1.
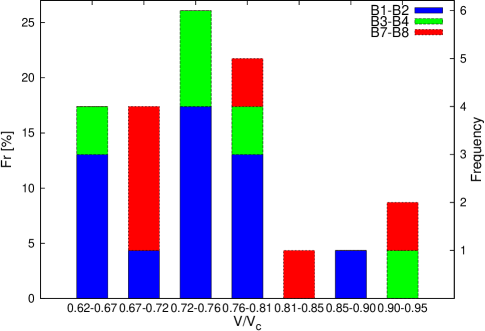
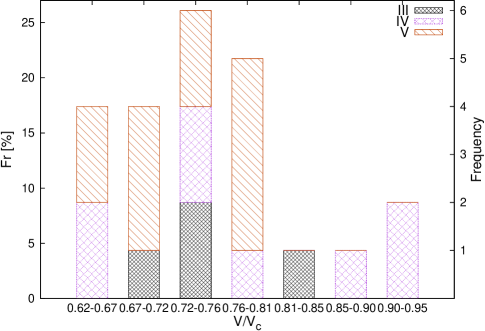
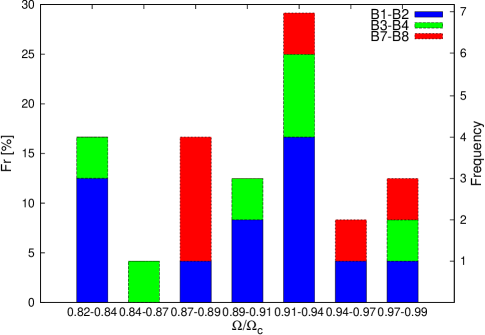
The distribution of ratio per spectral type and luminosity class is presented in the Fig. 11. Between 0.62 and 0.81, the distribution is almost constant and includes of the sample. The left is distributed between 0.81 and 0.99. We do not see any correlation with the spectral type or the luminosity class. In Fig. 12 we present the distribution of , which shows values between 0.82 and 0.99. The distribution is similar for stars with different spectral types and luminosity classes.
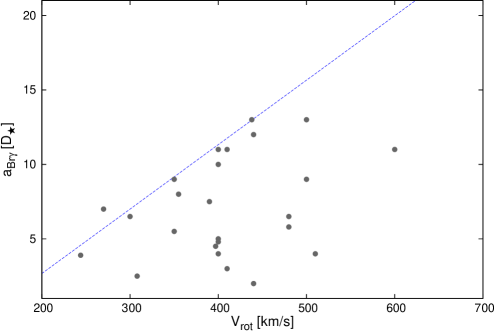
Although, there is no clear correlation between the disk extension in the line and , we observe that disk extensions larger than 10 are only present when km s-1. This outcome is discussed in a broader context in Sect. 5.
Using the obtained values for and , we estimated the stellar masses from the expression , where is the gravitational constant. At first glance, no correlation was found between the stellar mass and the disk size.
5 Discussion
5.1 Rotational rate
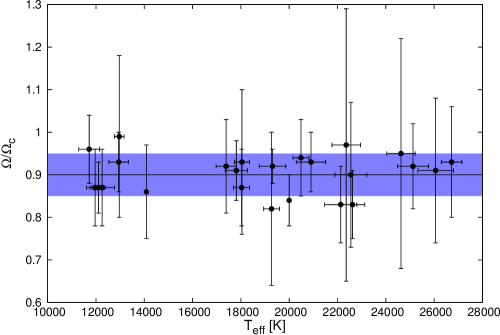
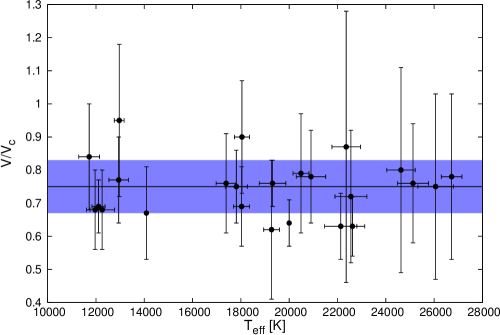
Considering the combined sample, we found a mean ratio and a mean rotational rate . These values agree with the ones determined by Frémat et al. (2005) from a sample of 130 stars, that is, and , and by Zorec et al. (2016, ). However, when this ratio is corrected by the effects of gravitational darkening, macroturbulence, and binarity, its value drops to , according to Zorec et al. (2016). As our sample contains seven binary stars, our value, which is not corrected for the mentioned effects, should be an upper limit. On the bases of this result, we conclude that the Be stars of our sample, on average, do not rotate at their critical velocity.
Cranmer (2005) proposed that the rotational rates have different limits depending on the effective temperature. To test his hypothesis, we plotted the values of the rotational rates against (see Fig. 13) but found no relationship.
5.2 Stellar rotation axes
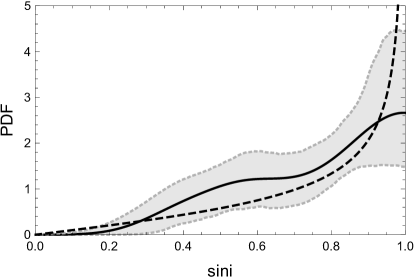
To see if the rotational axes are randomly distributed, we compared the distribution of projected angles from our data with a theoretical distribution (see, e.g., Curé et al. 2014).
Let us define the 3D vector , and , the projection of to the plane normal to the line of sight, with being the angle between and the line of sight. If we assume that is uniformly distributed over the sphere, then the probability distribution function (PDF) verifies that (Curé et al. 2014).
In Fig. 14 we present, in black solid line, the kernel density estimation (KDE) of the observed values and the theoretical PDF . Furthermore, we performed a Bootstrap study, generating random samples of our values, each with a sample length of 25 data. The resulting confidence interval using the 0.025 and 0.975 quantiles is also plotted in the figure (shaded gray region), showing that the theoretical PDF lies almost entirely inside the confidence interval. In view of this finding, we performed Kolmorogov-Smirnov and Anderson-Darling tests to verify if the observed data are distributed according to the expected PDF. We obtained a -value of 0.0686 and 0.0997, respectively. Both tests do not reject the null hypotesis, meaning that the sample might come from a random orientation of stellar rotational axes, but in view of the small -values, a detailed study with a larger data sample is necessary to elucidate the underlying distribution.
5.3 Correlation between and
The disk size in the Br line ranges between 2 and 13 , and is independent of the effective temperature of the stars.
To discuss the origin of the circumstellar envelope and the role of the stellar rotation, we search for a relation between the disk extension in the Br line and . Figure 15 shows the whole sample of stars and highlights that there are no Be stars with low values for and large disk size. Furthermore, we observe that all the stars are located below the blue dashed line. This could mean that there is an upper limit for the disk size according to a given rotational velocity.
Considering the spectral variability of Be stars, we look for a criterion to determine which stars have stable disks. To this purpose, we compared the strength and spectral appearance of the H line for each star using observations published by Doazan et al. (1991), Silaj et al. (2010, 2014), Arcos et al. (2017) and Arcos et al. (2018, in preparation). Thus, we differentiate the objects that present a stable intensity in the H line from objects that present variations. Based on the H criterion, the objects that we consider as stable are: HD 23 630, HD 32 991, HD 36 576, HD 37 795, HD 89 080, HD 209 409, and HD 214 748. These objects are identified as “without variability” in Fig. 16, and the blue dashed line could state an upper limit for the disk size of these stars.
Another criterion was based on the results found by Vieira et al. (2017) who analyzed the evolution of the disks using the viscous decretion disk (VDD) model, and found that the timescale for disk growth is shorter than the timescale for disk dissipation. Also, they found a correlation between and values and determined distinct regions in the plane. In this diagram, the region is associated with dissipating disks; the strip between and corresponds to the steady-state zone, and the region where is related to disks in formation. Based on this new criterion, Vieira et al. (2017) found that HD 23630, HD 28497, HD 35439, HD 41335, HD 50013, HD 89080, HD 91465, HD 105435 and HD 212571 have steady disks. In Fig. 16 these objects are identified as “”. Some of these stars fall in the linear relationship found before, but others seem to outline a second linear regression, below the previous one. This second linear relationship is plotted with an orange dotted line and could be related with another stability condition for the disk extension for stars of a given spectral type or stellar mass.
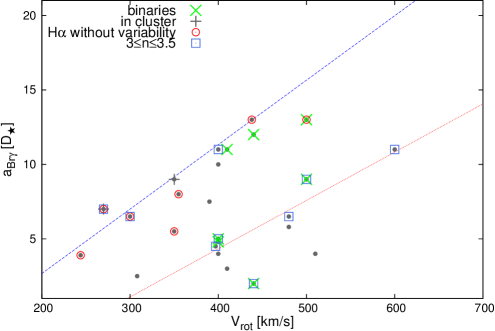
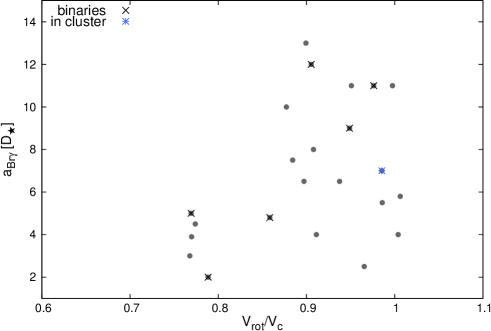
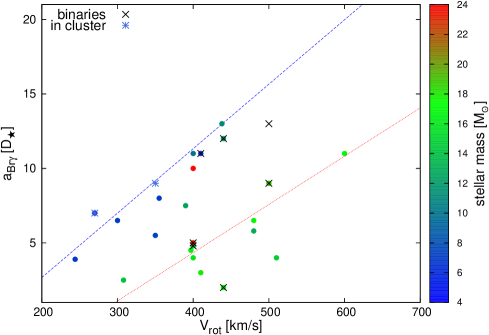
Figure 17 presents our findings for disk size versus . We observe that the stars with the largest disks present values of , however no correlation with the stellar type was observed, as shown in Fig. 13.
Since it has often been observed that late-type Be stars are less variable than early-type ones (Hubert & Floquet 1998; Jones et al. 2011; Barnsley & Steele 2013; Labadie-Bartz et al. 2017), it would be possible that the relations for stable disks are connected to the mass of the star. Nevertheless, it is interesting to highlight that, for a given , the least massive B-type stars are close to the upper size limit while the most massive stars are near the lower limit, as is illustrated in Fig. 18. This result points out that Be stars with high stellar masses have denser and more compact disks than their low-mass counterparts. As the former are more luminous, compact and dense disks would be brighter in the Br line. This could explain why the peak of the Be phenomenon is around the B1-B3 spectral types. Evidence supporting a scenario where disks of early Be stars are more massive and smaller than those of late-Be types was previously reported by Arcos et al. (2017), who used a large sample of H observations.
Here, it is worth mentioning that HD 212 571 is a binary star that is located below the orange linear regression, and, according to Vieira et al. (2017), has a steady disk. For this object, the timescale of the disk-loss events could be important, since the observations used by Vieira et al. (2017) were performed from January to November 2010 and our interferometric observations were carried out in October 2014. Arcos et al. (2017) observed the same object one year later, and found an value that locates it in the dissipation region. Therefore, it is possible that the disk size we found does not correspond to the disk size on a steady phase.
5.4 Comparison of disk sizes in the H line and the Br line
Disk sizes observed in the Br line are systematically larger than those obtained from the -band with the CHARA interferometer (Gies et al. 2007; Touhami et al. 2013). However, we do not find any clear correlation between the sizes of the disk in the Br and H lines. Using 48 northern Be stars, Catanzaro (2013) found that the radii of the disks measured in the H line have values between 2 and 14 , with a maximum concentration in the interval of 6-8 . The values are similar to the disk size we measured in the Br line.
Measurements of disk size in H are available for thirteen of the stars in our sample (Hanuschik et al. 1988; Andrillat et al. 1990; Grundstrom & Gies 2006). The Br size measured from HD 23 630 is larger than the H size obtained by Grundstrom & Gies (2006) but smaller than the one obtained by Hanuschik et al. (1988), even though this star has a stable H profile. For HD 37 202, HD 158 427, and HD 214 748, the Br sizes are smaller than the ones measured in H, as was found in Sco by Meilland et al. (2011). For HD 37 490, the Br and H (Andrillat et al. 1990; Hanuschik et al. 1988) lines lead to similar measurements for the disk size, contrary to HD 28 497, HD 30 076, HD 35 439, HD 36 576, HD 41 335 and HD 45 725, for which the Br line presents larger disk sizes than the ones obtained from H. It should be noted that all these objects have variable H profiles, possibly indicating that their disk sizes have increased.
Considering the variability of the Be stars, and the different methods used to derive the sizes of their circumstellar disks, it would be useful to perform simultaneous multiwavelength observations.
6 Conclusions
We analyzed a sample of 26 Be stars observed with the VLTI/AMBER instrument. We were able to obtain geometrical and kinematic disk parameters for 18 of these that present the Br line in emission, by fitting interferometric data with a 2D kinematic model for a rotating equatorial disk. For 5 stars of our sample the kinematical properties of the disks have been obtained for the first time.
Disk sizes measured in the Br line are similar to the ones obtained from the H line, and they range between 2 and 13 . We do not observe any correlation between disk size and (or spectral type) of the central star. One third of the stars in our sample have sizes lower than 6 and stars with luminosity class III tend to present the smallest disks. Nevertheless, using a combined sample of Be stars (our 18 Be star sample plus 7 stars studied by Meilland et al. 2012) we found an upper limit for the disk extension in the Br line that correlates with the rotational velocity in the inner part of the disk and the stellar mass. For a given , high-mass Be stars have more compact and dense disks than their low-mass counterparts. In almost all cases, the star disks rotate in Keplerian fashion, with the exception of HD 28497, which required a one-arm over-density model.
The distribution of stellar rotational velocities was found to be relatively symmetrical and has a maximum at km s-1. Stars with early spectral types tend to have high rotational velocities, whilst late B-type stars have low rotational velocities. We derived a mean ratio and a mean rotational rate , in agreement with those authors that propose that, on average, Be stars do not rotate at their critical velocity (Cranmer 2005; Frémat et al. 2005; Zorec et al. 2016). On the other hand, we did not observe any correlation between values and spectral types, as was previously suggested by Cranmer (2005).
It is interesting to remark that the rotational axes seem to be uniformly distributed in the sky. However, this last result is not conclusive due to the low quantile value obtained. Therefore, more observations should be carried out to confirm this tendency.
It would be interesting to follow up the evolution of disk size in variable Be stars to better understand disk formation and dissipation processes of their circumstellar disks. To this aim simultaneous observations at different wavelengths are necessary. Furthermore, it would be interesting to improve radiative transfer models with various density laws in order to decipher whether or not the maximum disk size found (about 13 ) in the Br emission line has a physical meaning in terms of density and ionization structure of a “fully” built Be disk.
Acknowledgements.
We would like to thank our anonymous referee for his/her valuable comments and suggestions, which helped to improve our manuscript. We thank M. L. Arias for her careful reading and comments. C.A thanks becas de doctorado nacional de CONICYT 2016-2017. M.C. and C.A. acknowledge support from Centro de Astrofísica de Valparaíso. L.C. acknowledges financial support from CONICET (PIP 0177), the Agencia Nacional de Promoción Científica y Tecnológica (PICT 2016-1971) and the Programa de Incentivos (G11/137) of the Universidad Nacional de La Plata (UNLP), Argentina. L.C. and M.C. thank support from the project CONICYT + PAI/Atracción de capital humano avanzado del extranjero (folio PAI80160057).References
- Abt & Cardona (1984) Abt, H. A. & Cardona, O. 1984, ApJ, 285, 190
- Abt et al. (2002) Abt, H. A., Levato, H., & Grosso, M. 2002, ApJ, 573, 359
- Ahumada & Lapasset (2007) Ahumada, J. A. & Lapasset, E. 2007, A&A, 463, 789
- Andrillat et al. (1990) Andrillat, A., Jaschek, M., & Jaschek, C. 1990, A&AS, 84, 11
- Arcos et al. (2018, in preparation) Arcos, C., Cochetti, Y. R., & Cidale, L. 2018, in preparation, Spectroscopic atlas of southern Be stars - Manuscript in preparation
- Arcos et al. (2017) Arcos, C., Jones, C. E., Sigut, T. A. A., Kanaan, S., & Curé, M. 2017, ApJ, 842, 48
- Arcos et al. (2018) Arcos, C., Kanaan, S., Chávez, J., et al. 2018, MNRAS, 474, 5287
- Astraatmadja & Bailer-Jones (2016) Astraatmadja, T. L. & Bailer-Jones, C. A. L. 2016, ApJ, 833, 119
- Ballereau et al. (1987) Ballereau, D., Alvarez, M., Chauville, J., & Michel, R. 1987, Rev. Mexicana Astron. Astrofis., 15, 29
- Balona et al. (1992) Balona, L. A., Cuypers, J., & Marang, F. 1992, A&AS, 92, 533
- Balona et al. (2002) Balona, L. A., Handler, G., Aerts, C., et al. 2002, in Astronomical Society of the Pacific Conference Series, Vol. 256, Observational Aspects of Pulsating B- and A Stars, ed. C. Sterken & D. W. Kurtz, 9
- Balona et al. (1987) Balona, L. A., Marang, F., Monderen, P., Reitermann, A., & Zickgraf, F.-J. 1987, A&AS, 71, 11
- Barnsley & Steele (2013) Barnsley, R. M. & Steele, I. A. 2013, A&A, 556, A81
- Bergin et al. (1989) Bergin, E. A., Burns, J. F., Guinan, E. F., & McCook, G. P. 1989, Information Bulletin on Variable Stars, 3358
- Bjorkman et al. (2002) Bjorkman, K. S., Miroshnichenko, A. S., McDavid, D., & Pogrosheva, T. M. 2002, ApJ, 573, 812
- Bossi et al. (1989) Bossi, M., Guerrero, G., & Bianchini, G. 1989, Information Bulletin on Variable Stars, 3348
- Brown & McLean (1977) Brown, J. C. & McLean, I. S. 1977, A&A, 57, 141
- Carciofi et al. (2009) Carciofi, A. C., Okazaki, A. T., Le Bouquin, J.-B., et al. 2009, A&A, 504, 915
- Cardelli et al. (1989) Cardelli, J. A., Clayton, G. C., & Mathis, J. S. 1989, ApJ, 345, 245
- Carrier et al. (2002) Carrier, F., Burki, G., & Burnet, M. 2002, A&A, 385, 488
- Castle (1977) Castle, K. G. 1977, PASP, 89, 862
- Castor et al. (1975) Castor, J. I., Abbott, D. C., & Klein, R. I. 1975, ApJ, 195, 157
- Catanzaro (2013) Catanzaro, G. 2013, A&A, 550, A79
- Chauville et al. (2001) Chauville, J., Zorec, J., Ballereau, D., et al. 2001, A&A, 378, 861
- Chelli et al. (2009) Chelli, A., Utrera, O. H., & Duvert, G. 2009, A&A, 502, 705
- Collins (1987) Collins, II, G. W. 1987, in IAU Colloq. 92: Physics of Be Stars, ed. A. Slettebak & T. P. Snow, 3–19
- Cote & Waters (1987) Cote, J. & Waters, L. B. F. M. 1987, A&A, 176, 93
- Cranmer (2005) Cranmer, S. R. 2005, ApJ, 634, 585
- Curé et al. (2014) Curé, M., Rial, D. F., Christen, A., & Cassetti, J. 2014, A&A, 565, A85
- Cyr et al. (2015) Cyr, R. P., Jones, C. E., & Tycner, C. 2015, ApJ, 799, 33
- Delaa et al. (2011) Delaa, O., Stee, P., Meilland, A., et al. 2011, A&A, 529, A87
- Doazan et al. (1991) Doazan, V., Sedmak, G., Barylak, M., Rusconi, L., & Battrick, B., eds. 1991, ESA Special Publication, Vol. 1147, A Be star atlas of far UV and optical high-resolution spectra
- Domiciano de Souza et al. (2003) Domiciano de Souza, A., Kervella, P., Jankov, S., et al. 2003, A&A, 407, L47
- Frémat et al. (2005) Frémat, Y., Zorec, J., Hubert, A.-M., & Floquet, M. 2005, A&A, 440, 305
- Gies et al. (2007) Gies, D. R., Bagnuolo, Jr., W. G., Baines, E. K., et al. 2007, ApJ, 654, 527
- González & Lapasset (2000) González, J. F. & Lapasset, E. 2000, AJ, 119, 2296
- Grundstrom & Gies (2006) Grundstrom, E. D. & Gies, D. R. 2006, ApJ, 651, L53
- Hanuschik et al. (1995) Hanuschik, R. W., Hummel, W., Dietle, O., & Sutorius, E. 1995, A&A, 300, 163
- Hanuschik et al. (1988) Hanuschik, R. W., Kozok, J. R., & Kaiser, D. 1988, A&A, 189, 147
- Harmanec (1984) Harmanec, P. 1984, Bulletin of the Astronomical Institutes of Czechoslovakia, 35, 164
- Hirata (2007) Hirata, R. 2007, in Astronomical Society of the Pacific Conference Series, Vol. 361, Active OB-Stars: Laboratories for Stellare and Circumstellar Physics, ed. A. T. Okazaki, S. P. Owocki, & S. Stefl, 267
- Hubert & Floquet (1998) Hubert, A. M. & Floquet, M. 1998, A&A, 335, 565
- Hutchings (1970) Hutchings, J. B. 1970, MNRAS, 150, 55
- Jaschek et al. (1981) Jaschek, M., Slettebak, A., & Jaschek, C. 1981, Be star terminology., be Star Newsletter
- Jones et al. (2008) Jones, C. E., Sigut, T. A. A., & Porter, J. M. 2008, MNRAS, 386, 1922
- Jones et al. (2011) Jones, C. E., Tycner, C., & Smith, A. D. 2011, AJ, 141, 150
- Kanaan et al. (2008) Kanaan, S., Meilland, A., Stee, P., et al. 2008, A&A, 486, 785
- Katahira et al. (1996a) Katahira, J.-I., Hirata, R., Ito, M., et al. 1996a, in Revista Mexicana de Astronomia y Astrofisica Conference Series, Vol. 5, Revista Mexicana de Astronomia y Astrofisica Conference Series, ed. V. Niemela, N. Morrell, P. Pismis, & S. Torres-Peimbert, 114
- Katahira et al. (1996b) Katahira, J.-I., Hirata, R., Ito, M., et al. 1996b, PASJ, 48, 317
- Kervella & Domiciano de Souza (2006) Kervella, P. & Domiciano de Souza, A. 2006, A&A, 453, 1059
- Kurucz (1979) Kurucz, R. L. 1979, ApJS, 40, 1
- Labadie-Bartz et al. (2017) Labadie-Bartz, J., Pepper, J., McSwain, M. V., et al. 2017, AJ, 153, 252
- Lefèvre et al. (2009) Lefèvre, L., Marchenko, S. V., Moffat, A. F. J., & Acker, A. 2009, A&A, 507, 1141
- Meilland et al. (2011) Meilland, A., Delaa, O., Stee, P., et al. 2011, A&A, 532, A80
- Meilland et al. (2012) Meilland, A., Millour, F., Kanaan, S., et al. 2012, A&A, 538, A110
- Meilland et al. (2007a) Meilland, A., Millour, F., Stee, P., et al. 2007a, A&A, 464, 73
- Meilland et al. (2008) Meilland, A., Millour, F., Stee, P., et al. 2008, A&A, 488, L67
- Meilland et al. (2009) Meilland, A., Stee, P., Chesneau, O., & Jones, C. 2009, A&A, 505, 687
- Meilland et al. (2007b) Meilland, A., Stee, P., Vannier, M., et al. 2007b, A&A, 464, 59
- Mennickent et al. (1997) Mennickent, R. E., Sterken, C., & Vogt, N. 1997, A&A, 326, 1167
- Millour et al. (2009) Millour, F., Chesneau, O., Borges Fernandes, M., et al. 2009, A&A, 507, 317
- Miroshnichenko et al. (2003) Miroshnichenko, A. S., Bjorkman, K. S., Morrison, N. D., et al. 2003, A&A, 408, 305
- Mourard et al. (1989) Mourard, D., Bosc, I., Labeyrie, A., Koechlin, L., & Saha, S. 1989, Nature, 342, 520
- Neiner et al. (2012) Neiner, C., Grunhut, J. H., Petit, V., et al. 2012, MNRAS, 426, 2738
- Neiner et al. (2002) Neiner, C., Hubert, A.-M., Floquet, M., et al. 2002, A&A, 388, 899
- Neiner et al. (2003) Neiner, C., Hubert, A.-M., Frémat, Y., et al. 2003, A&A, 409, 275
- Nemravová et al. (2010) Nemravová, J., Harmanec, P., Kubát, J., et al. 2010, A&A, 516, A80
- Ochsenbein et al. (2000) Ochsenbein, F., Bauer, P., & Marcout, J. 2000, A&AS, 143, 23
- Okazaki (1997) Okazaki, A. T. 1997, A&A, 318, 548
- Oudmaijer & Parr (2010) Oudmaijer, R. D. & Parr, A. M. 2010, MNRAS, 405, 2439
- Peters (1972) Peters, G. J. 1972, PASP, 84, 334
- Peters (1983) Peters, G. J. 1983, PASP, 95, 311
- Peters et al. (2016) Peters, G. J., Wang, L., Gies, D. R., & Grundstrom, E. D. 2016, ApJ, 828, 47
- Petrov et al. (2007) Petrov, R. G., Malbet, F., Weigelt, G., et al. 2007, A&A, 464, 1
- Prinja (1989) Prinja, R. K. 1989, MNRAS, 241, 721
- Quirrenbach et al. (1997) Quirrenbach, A., Bjorkman, K. S., Bjorkman, J. E., et al. 1997, ApJ, 479, 477
- Rivinius et al. (2013) Rivinius, T., Carciofi, A. C., & Martayan, C. 2013, A&A Rev., 21, 69
- Rivinius et al. (2006) Rivinius, T., Štefl, S., & Baade, D. 2006, A&A, 459, 137
- Sadakane et al. (2005) Sadakane, K., Hirata, R., & Tsuji, T. 2005, PASJ, 57, 1
- Schaefer et al. (2010) Schaefer, G. H., Gies, D. R., Monnier, J. D., et al. 2010, AJ, 140, 1838
- Schaller et al. (1992) Schaller, G., Schaerer, D., Meynet, G., & Maeder, A. 1992, A&AS, 96, 269
- Shimazaki & Shinomoto (2007) Shimazaki, H. & Shinomoto, S. 2007, Neural Computation, 19, 1503
- Sigut et al. (2015) Sigut, T. A. A., Tycner, C., Jansen, B., & Zavala, R. T. 2015, ApJ, 814, 159
- Silaj et al. (2014) Silaj, J., Jones, C. E., Sigut, T. A. A., & Tycner, C. 2014, ApJ, 795, 82
- Silaj et al. (2010) Silaj, J., Jones, C. E., Tycner, C., Sigut, T. A. A., & Smith, A. D. 2010, ApJS, 187, 228
- Slettebak (1982) Slettebak, A. 1982, ApJS, 50, 55
- Stee et al. (2013) Stee, P., Meilland, A., Bendjoya, P., et al. 2013, A&A, 550, A65
- Struve (1925) Struve, O. 1925, ApJ, 62
- Tatulli et al. (2007) Tatulli, E., Millour, F., Chelli, A., et al. 2007, A&A, 464, 29
- Thaller et al. (1995) Thaller, M. L., Bagnuolo, Jr., W. G., Gies, D. R., & Penny, L. R. 1995, ApJ, 448, 878
- Touhami et al. (2011) Touhami, Y., Gies, D. R., & Schaefer, G. H. 2011, ApJ, 729, 17
- Touhami et al. (2013) Touhami, Y., Gies, D. R., Schaefer, G. H., et al. 2013, ApJ, 768, 128
- Tycner et al. (2004) Tycner, C., Hajian, A. R., Armstrong, J. T., et al. 2004, AJ, 127, 1194
- Tycner et al. (2005) Tycner, C., Lester, J. B., Hajian, A. R., et al. 2005, ApJ, 624, 359
- Štefl et al. (2009) Štefl, S., Rivinius, T., Carciofi, A. C., et al. 2009, A&A, 504, 929
- van Belle (2012) van Belle, G. T. 2012, A&A Rev., 20, 51
- van Leeuwen (2007) van Leeuwen, F., ed. 2007, Astrophysics and Space Science Library, Vol. 350, Hipparcos, the New Reduction of the Raw Data
- Vieira et al. (2017) Vieira, R. G., Carciofi, A. C., Bjorkman, J. E., et al. 2017, MNRAS, 464, 3071
- Vinicius et al. (2006) Vinicius, M. M. F., Zorec, J., Leister, N. V., & Levenhagen, R. S. 2006, A&A, 446, 643
- Waters (1986) Waters, L. B. F. M. 1986, A&A, 162, 121
- Waters et al. (1987) Waters, L. B. F. M., Cote, J., & Lamers, H. J. G. L. M. 1987, A&A, 185, 206
- Waters et al. (1991) Waters, L. B. F. M., Cote, J., & Pols, O. R. 1991, A&A, 250, 437
- Wisniewski et al. (2010) Wisniewski, J. P., Draper, Z. H., Bjorkman, K. S., et al. 2010, ApJ, 709, 1306
- Yudin (2001) Yudin, R. V. 2001, A&A, 368, 912
- Zorec et al. (2016) Zorec, J., Frémat, Y., Domiciano de Souza, A., et al. 2016, A&A, 595, A132
Appendix A
For each target, we present the () plan coverage, with the AMBER HR measurements. The best-fitting kinematics models are overplotted.