Constraints on very high energy gamma-ray emission from the Fermi Bubbles with future ground-based experiments
Abstract
The origin of sub-TeV gamma rays detected by the Fermi-Large Area Telescope (LAT) from the Fermi Bubbles (FBs) at the Galactic center is still uncertain. In a hadronic model, acceleration of protons and/or nuclei and their subsequent interactions with gas in the bubble volume can produce the observed gamma rays. Recently the High Altitude Water Cherenkov (HAWC) observatory reported an absence of gamma-ray excess from the Northern FB at Galactic latitude, which resulted in flux upper limits in the energy range of TeV. These upper limits are consistent with the gamma-ray spectrum measured by Fermi-LAT at , where an exponential cutoff at energies GeV is evident. However, the FB gamma-ray spectrum at , without showing any sign of cutoff up to around 1 TeV in the latest results, remains unconstrained. The upcoming Cherenkov Telescope Array (CTA) will perform a Galactic center survey with unprecedented sensitivity in the energy between 20 GeV and 300 TeV. In this work, we perform both morphological and classic on/off analyses with planned CTA deep central and extended survey and estimate the sensitivity of CTA to the FB hadronic gamma-ray flux models that best fit the spectrum at and whose counterpart neutrino flux model best fits the optimistic neutrino spectrum from IceCube Neutrino Observatory. We also perform sensitivity analysis with a future ground-based Cherenkov detector the Large High Altitude Air Shower Observatory (LHAASO). We find that CTA will be able to discover or constrain the FB gamma-ray flux at in the 200 GeV – 100 TeV range with planned observation strategy, while LHAASO may constrain emission in the GeV – 100 TeV range if systematic uncertainties can be achieved.
pacs:
95.85.Ry, 14.60.Pq, 98.70.SaI Introduction
Ground-based Very High Energy (VHE, GeV) gamma-ray astronomy has been undergoing dramatic progress over the past two decades, providing new insights into the known gamma-rays sources and developing strategies to search for potential new sources. The current imaging air-Cherenkov telescopes such as the High Energy Stereoscopic System (H.E.S.S.) Aharonian et al. (2006a), Major Atmospheric Gamma-ray Imaging Cherenkov (MAGIC) telescopes Hassan et al. (2016) and Very Energetic Radiation Imaging Telescope Array System (VERITAS) Holder et al. (2006), and water-Cherenkov detector HAWC Abeysekara et al. (2013) will be superseded by a new generation of observatories such as CTA Acharya et al. (2019) and LHAASO Di Sciascio (2016). These upcoming experiments will achieve much better angular resolution and sensitivity, and will have wider field of view in comparison to the existing detectors.
Discovered in 2010 using Fermi-LAT data Su et al. (2010); Dobler et al. (2010), FBs at the Galactic center provide prime targets for the currently operational and upcoming VHE gamma-ray observatories. Gamma-ray emission from the FB is spatially associated with Planck observation Ade et al. (2013), the WMAP microwave haze Finkbeiner (2004) and X-ray survey from ROSAT Mertsch and Sarkar (2011); confirming their multi-wavelength emission nature. These two bubbles have approximately uniform surface brightness in gamma rays at high latitude and have sharp rims, with an estimated luminosity of 4 erg/s between 100 MeV and 500 GeV Finkbeiner (2004); Abeysekara et al. (2017a).
The origin and production mechanism of gamma rays from the FB are still elusive. Both leptonic Su et al. (2010); Mertsch and Sarkar (2011); Ackermann et al. (2014) and hadronic Crocker and Aharonian (2011); Crocker (2012) models have been used to fit the gamma-ray spectrum successfully. In leptonic models, gamma rays are generated by inverse Compton scattering of infrared-ultraviolet photons by accelerated electrons. In hadronic models, gamma rays are produced by accelerated ions colliding with ambient particles in the bubble volume. High-energy neutrinos as counterparts to gamma rays are expected in case of a hadronic model Crocker and Aharonian (2011); Lunardini and Razzaque (2012); Razzaque (2013); Lunardini et al. (2014, 2015); Ackermann et al. (2014); Fujita et al. (2013). In the latest sample of 82 High-Energy Starting Events (HESE) with deposited energy above 60 TeV, released by the IceCube Collaboration Aartsen et al. (2017), the arrival directions of eight events (7 showers and 1 track events) are within the FB contours and the arrival directions of six shower events have their median positional error overlapping with the FB contours Razzaque and Yang (2018). It is uncertain, however, how many of these neutrino events are from the FB itself or from a diffuse astrophysical background. Another recent analysis shows up to probability that the FB is a neutrino source Fang et al. (2017). If confirmed with a higher significance in future larger HESE sample, FB might become the first diffuse source to have been seen in both gamma rays and neutrinos Lunardini et al. (2015).
Recently the HAWC observatory presented their results on search for gamma-ray emission from the Northern bubble at Galactic latitude with 290 days of data Abeysekara et al. (2017a). Without finding any significant excess, the HAWC observatory put constraints on the FB gamma-ray flux in the energy range of TeV. These flux upper limits are consistent with the latest FB gamma-ray data from the Fermi-LAT at high-Galactic latitudes, Ackermann et al. (2017), which shows a cutoff in the spectrum at energies at GeV. The spectrum of the low-latitude () FB, however, is hard and does not show any obvious sign of cutoff at energies up to TeV. The HAWC upper limits Abeysekara et al. (2017a) therefore do not constrain the low-latitude FB spectrum, which could be a prime target for CTA and LHAASO in future. In addition, the spectrum in the central region of the FB may get harder at VHE range compared to the high-latitude spectrum, if there is a latitude-dependent emission. Therefore, we expect the central region of the FB would be an ideal target for studying the hadronic models, in particular to explore the VHE range.
In this paper we estimate preliminary sensitivity of the CTA and LHAASO to the FB gamma-ray flux using publicly available information on the characteristics of these observatories. CTA South will be located in Paranal, Chile Acharya et al. (2019), while CTA North will be located in La Palma, Canary Islands, Spain. There is already a strategy in place to survey the Galactic center region with CTA. We exploit this survey characteristics in our calculation. The LHAASO is currently under construction in Daocheng, China at 4410 m altitude Di Sciascio (2016) and will be able to observe the most part of the Northern bubble.
The paper is organized as follows: we introduce the next-generation gamma ray observatories being constructed lately, CTA and LHAASO in Sec. II; we describe the hadronic models based on neutrino and gamma ray observations and discuss the major backgrounds in gamma-ray observation in Sec. III; we present our analysis methods, discuss the systematic errors for FBs, present our results and possible future constraints from gamma-ray observations in Sec. IV; we summarize and conclude in Sec. V.
II Ground-based gamma-ray observatories
Gamma-ray astronomy, focusing on the observation of photons with energies above 0.5 MeV and reaching up to a few hundred TeV, has achieved impressive progress over the last few decades. For the high-energy regime ( MeV), gamma rays are either observed directly using spaced based telescopes or indirectly on the ground by detecting the electromagnetic showers produced by primary photons interacting with Earth’s atmosphere. Currently, ground-based gamma-ray detectors are classified into two categories, namely the Imaging Atmospheric Cherenkov Telescope (IACT) and Extensive Air Shower (EAS) arrays based on the detection techniques. We refer to Thompson (2015); de Naurois and Mazin (2015) for a review of gamma-ray detection techniques. We discuss below briefly two upcoming detectors, namely CTA and LHAASO, in each of these categories and for which we estimate the sensitivities to the FBs.
II.1 The Cherenkov Telescope Array (CTA)
The IACTs observe gamma rays by detecting Cherenkov light emitted by initiated air shower of secondary particles in the atmosphere at high altitude. Cherenkov light is beamed along the direction of primary particles and covers a circular area of about 250 m diameter on the ground. Therefore, optical telescopes within the Cherenkov light pool will record images of the track of air shower. With multiple telescopes viewing the same primary particle, a stereoscopic reconstruction of the shower geometry is performed and precise information about the energy and arrival direction of the primary gamma rays are extracted.
CTA is the fourth generation of IACTs for VHE gamma-ray astronomy and will be located in Northern and Southern Hemispheres for a full sky coverage. It will cover a wide energy range from 20 GeV to up to 300 TeV Acharya et al. (2019). CTA will improve the efficiency and sensitivity of current instruments by a factor of ten, resulting in excellent angular resolution and better discrimination of charged cosmic-ray backgrounds. According to its survey strategy, CTA will map the Galactic center region in unprecedented details, and will probe relationship between the central source and diffuse emission of the FBs for the first time in TeV energy range. Thus the maximum energy of the cosmic-ray accelerators responsible for gamma-ray emission and activity in the central 100 pc will be understood better. In addition, with its expected performance, CTA will possibly study the feature of sharp edges of the FBs above hundreds of GeV.
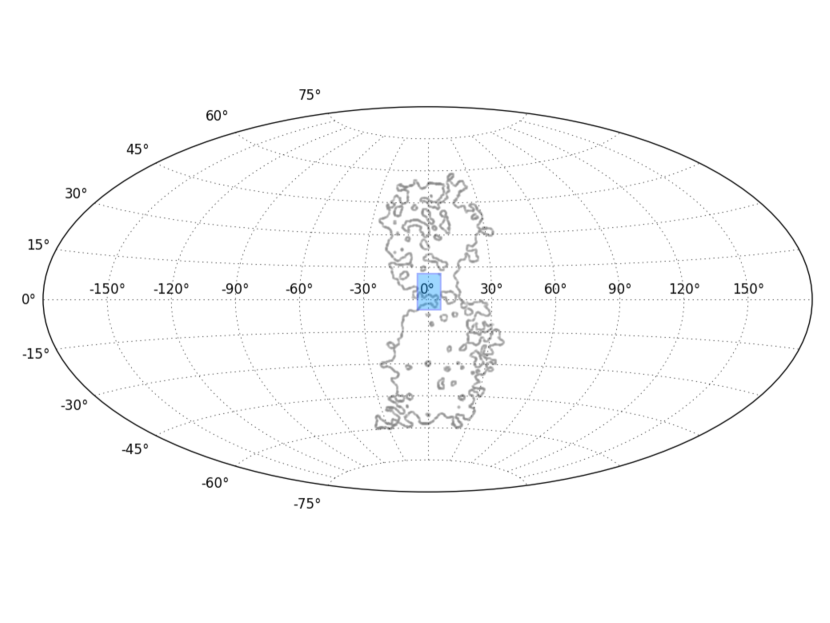
In this study, we will concentrate on study of the FBs with the CTA Southern array based on current configuration, referred to as Production 3b Hassan et al. (2016); Acharya et al. (2019). To better target the FB central region, we perform our study according to the CTA proposed pointing strategy Acharya et al. (2019) of a deep exposure centered on the Sgr A* and extended region survey as illustrated in Fig. 1. In the first year’s operation, the central survey will perform 525 hours of observation centered on the Galactic center with 9 pointing (at 0∘ and 1∘ in and ); the extended survey will have 300 hours of observation on the Northern Galactic plane with 15 pointing (at 0∘ and 2∘ in , 2∘ to 10∘ in ). We apply ctools (v1.5.0) Knödlseder et al. (2016)111http://cta.irap.omp.eu/ctools/, a dedicated software package for scientific analysis of CTA, to simulate the observation, where a radius of 3∘ field of view for each pointing is adopted. Even though FB detection is very challenging, due to its large structure and complicated emission from the inner part (), our work will give the first sensitivity estimation for this giant diffuse source with stacking analysis.
II.2 The Large High Altitude Air Shower Observatory (LHAASO)
The extended air shower (EAS) gamma-ray detectors such as Pierre Auger and HAWC have proven to be successful. They have high duty cycle and large field of view. The LHAASO project will be one of the world’s largest cosmic-ray observatories, currently being constructed at Haizi Mountain in Sichuan province, China Di Sciascio (2016). It aims at detecting both gamma rays and cosmic rays over wide energy ranges from eV to eV and from eV to eV, respectively. LHAASO will consist a water Cherenkov detector array (WCDA), 12 wide-field fluorescence telescopes above ground, a 1.3 km2 array (KM2A) made of 6000 plastic scintillators and approximately 1146 Cherenkov water tanks spread over the same area underground. In the energy range of interest to search for gamma rays from the FBs, one should utilize the WCDA for FB detection.
According to LHAASO’s location, it will be able to observe the most part of the Northern FB. Until now HAWC does not provide sensitivity in the sub-TeV energy regime, due to large signal contamination and background, and their work to improve sensitivities is still going on. However, the LHAASO surface water array will be four times larger than HAWC and therefore will be more sensitive. As complementary to CTA’s sensitivity to the FBs, LHAASO will provide additional information of the central regions of the FB within a shorter time scale and at higher energies.
III Emission from the Fermi Bubbles and backgrounds
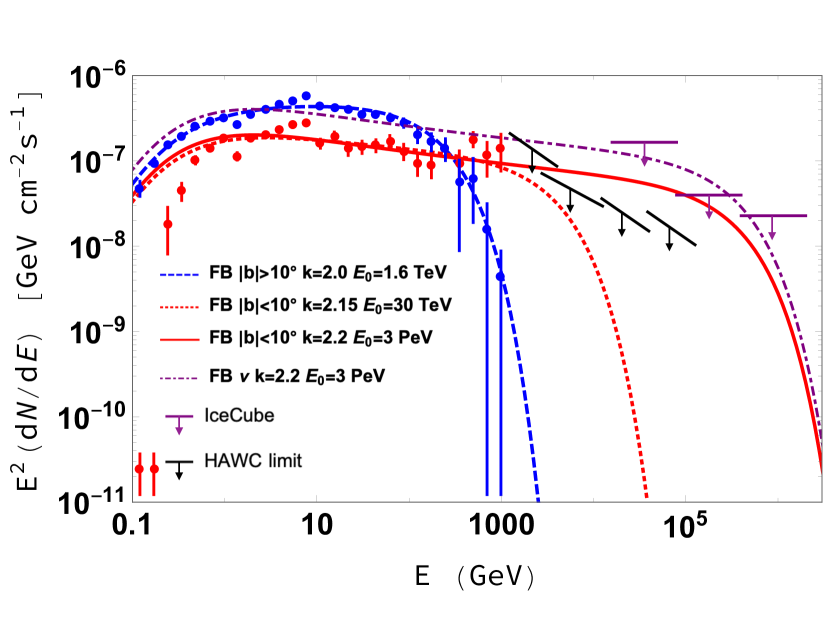
In this work we have adopted the FB template and spectra from recent Galactic center analysis of Fermi-LAT using 6.5 years of data with the region of interests in longitude and latitude Ackermann et al. (2017). The analysis was done with spectral components analysis (SCA) procedure as in Ref. Ackermann et al. (2014), where the residuals were obtained by subtracting the gas-correlated emission and point source models from the data and then were decomposed into two components correlated with and spectra. In the end, the FB template was derived by cutting the hard component at significance. Notice that in this updated FB analysis the spectrum of the low-latitude () FB is similar to the spectrum of the high-latitude () FB at lower energy from 100 MeV to 100 GeV, but remains hard above 100 GeV as can be seen in Fig. 2. Also shown in Fig. 2 the HAWC upper limits in the region Abeysekara et al. (2017a).
III.1 Hadronic model
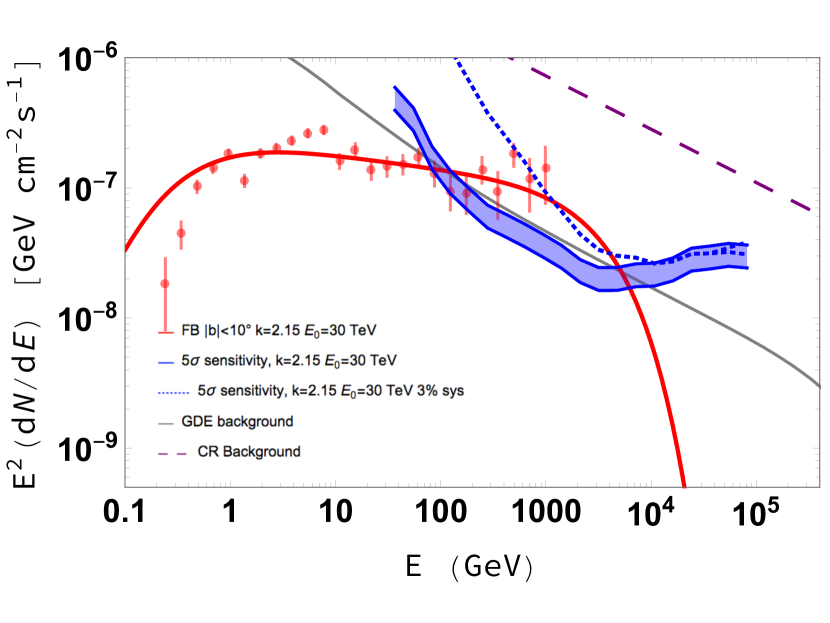
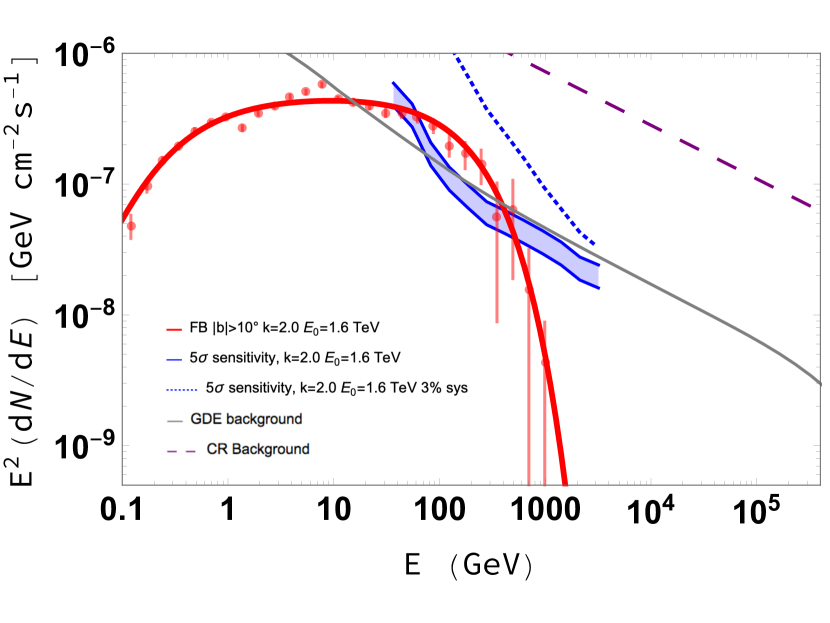
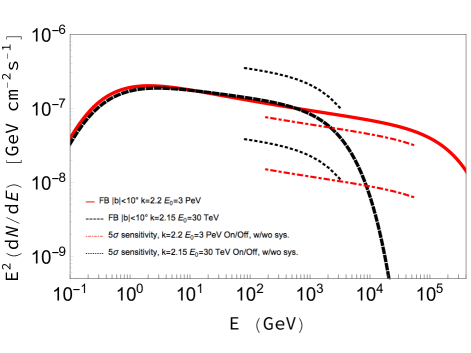
We adopt the same hadronic models as in Lunardini and Razzaque (2012); Lunardini et al. (2015) but updated in Ref. Razzaque and Yang (2018) with latest Fermi-LAT Ackermann et al. (2017) and IceCube data Aartsen et al. (2017). We assume an exponentially cut-off power law proton injection spectrum in the form of , where and are the spectral index and exponential cutoff energy, respectively. The blue dashed (, TeV) and red dotted (, TeV) lines are the best-fit hadronic models for the low-latitude and high-latitude FB emission regions, respectively. The solid red line (, PeV) which is very similar to the red dashed line at and below the highest LAT data point, is inspired by requiring neutrino flux from the same hadronic model to satisfy the upper limits calculated from 8 IceCube events in 6-year IceCube neutrino data Aartsen et al. (2017) from the direction of the FB originating from the hadronic model Razzaque and Yang (2018). Note that our best-fit gamma-ray flux models are compatible with the HAWC upper limits. The neutrino inspired model gives gamma-ray flux higher than the HAWC upper limits at TeV but these upper limits do not strictly apply to the low-latitude FB flux. We refer readers to our recent review Razzaque and Yang (2018) for more details.
III.2 Background models
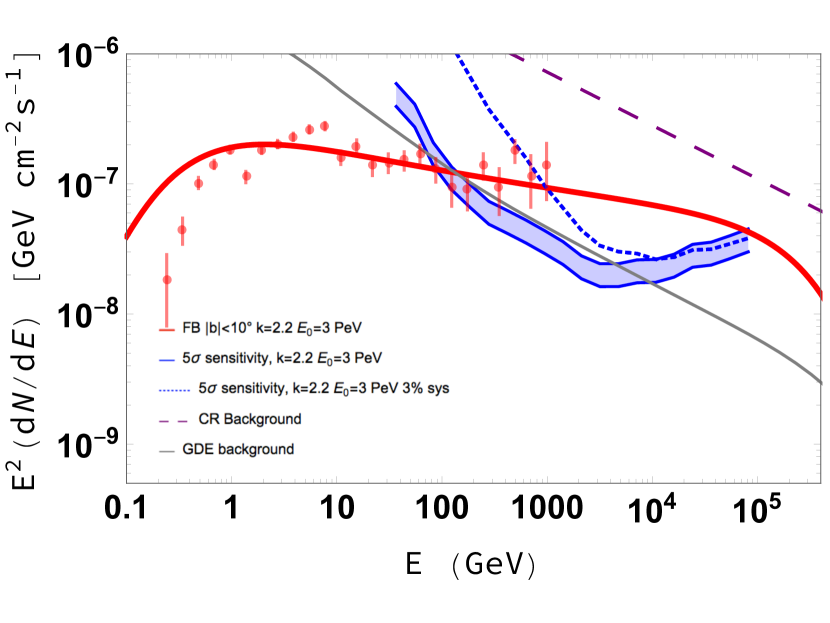
For IACTs, the major source of background is cosmic rays (CRs), namely hadrons and electrons, whose flux is about three orders of magnitude higher than that of gamma-ray signals. The background rejection requires efficient techniques, such as identification of shower image and distribution of arrival time of the shower front Voelk and Bernloehr (2009). In addition, thanks to the application of machine-learning algorithms, the background rejection efficiency has been further improved. Even though few CRs, which are mostly electrons, can trigger and pass the photon cuts, the residual contamination is still expected. In this work, we adopt the instrumental background implemented in ctools, which is derived through extensive Monte Carlo simulation for the planned array layout prod 3b. Therefore, the dominant backgrounds for studying the FB are residual CRs and diffuse gamma-ray emission from the Galactic center region. At CTA, the residual CR background is simulated and analyzed based on the instrumental properties, such as the effective area and point spread function. The cosmic-ray background of Instrument Response Function (IRF) follows a power law of shape as shown with purple long-dashed lines in Fig. 3. The second dominant background is the Galactic Diffuse Emission (GDE) which has been observed by Fermi-LAT Atwood et al. (2013) and H.E.S.S. Aharonian et al. (2006b). We have adopted a GDE model (gray solid lines in Fig. 3) following the study of gamma-ray emission in Ref. Gaggero et al. (2017), which interpret the current data with a CR transport model and is consistent with the contribution of decay, inverse Compton and bremsstrahlung emissions. Other contributions to the gamma-ray background are point and extended sources located at or near the Galactic center. On the other hand, main backgrounds for LHAASO are hadronic cosmic rays from proton to iron, whose combined flux is –4 orders of magnitude larger than the flux of FB gamma rays. Since the cosmic electron spectrum is about two orders of magnitudes lower than the flux of hadrons, its contribution to the background is neglected in our analysis hereafter.
IV Analysis
Both CTA and LHAASO are under construction, therefore there is no data available to test the FB flux models yet. Instead we use the well-known Asimov data set Cowan et al. (2011) constructed from the flux models and corresponding expectation values to save the computing power required for simulations, since it has been well justified and widely applied to estimate the median experimental significance Cowan et al. (2011). We perform both a morphological analysis and an ON/OFF analysis for CTA using the Asimov data set in order to calculate sensitivity to the FB flux models and identify sharp edge of the FB. For LHAASO, we use a simplified method to estimate sensitivity to the FB using signal and background events. The details are discussed below.
IV.1 Morphological analysis for CTA
The dataset is binned with 0.5 degree per pixel and 20 energy bins in the energy range from 30 GeV to 100 TeV. To calculate the CTA sensitivity to the FB, we adopt the method of statistical hypothesis test. The probability of observing events with expected events is given by the binned Poisson likelihood function
| (1) |
where and represent -th energy bin and -th region of interest. The model data can be expressed with three components as . Here , and are the expected numbers of events in each pixel generated by ctmodel of ctools based on instrumental CR background, GDE model and derived FB model, and , and are the strength parameter and nuisance parameters in each energy bin. For including the point sources in the analysis, such as central gamma-ray source HESS J1745–290 Aharonian et al. (2004), the pulsar wind nebula G0.9+0.1 Aharonian et al. (2005) and supernova remnant (SNR) HESS J1745–303 Aharonian (2008), one needs to include additional components in the formula here. Including the background point sources in our analysis however does not affect our results. This is because the point sources contribute only a few events in 4 to 6 pixels over a total of 1010 pixel region at each energy bin. Therefore, the maximum likelihood (ML) ratio can be defined as Cowan et al. (2011)
| (2) |
In Eq. (2), the denominator is the unconditional ML with , and as ML estimators fitted to the Asimov data set. The numerator is the conditional ML, which is maximized with and for specified value of . Therefore the ratio in Eq. (2) is related to with 1 degree of freedom (the difference in degrees of freedom between two hypothesis) as , based on Wilks’ theorem Wilks (1938). To compute differential CTA sensitivity, the mock data in each pixel is the total number of background events without the test source (FB), . As the discovery significance of a detection is simply estimated as the square root of the Test Statistic (TS) value, where TS = . We obtain the strength factor by setting corresponding to 5 sigma significance. Therefore, the sensitivity is computed as , where is logarithmic mean energy of the i-th energy bin, and is the corresponding FB flux density. To take into account statistical fluctuation of the CTA discovery significance with Asimov data set, we follow Eq. (31) in Ref. Cowan et al. (2011) to obtain the standard variance of . Therefore sensitivities with statistical uncertainty are shown as the shaded region in Fig. 3, corresponding to . For minimization of the logarithm likelihood function, we utilize the python iMinuit algorithm James and Roos (1975)222https://github.com/iminuit/iminuit and find the best fit parameters.
Major systematic uncertainties in our study are from instrumental response. As the number of background CRs is much more than signal photons, the instrumental systematic uncertainty is the primary concern in the analysis, even though the systematic uncertainty from GDE models can get up to 10% – 20%. Following Silverwood et al. (2015), we multiply the model data by a scaling parameter to account for the independent pixel-to-pixel systematic effects in the observation. We assume that the nuisance parameters follow a Gaussian distribution with variance for all , independent of and . Therefore the likelihood function in Eq. (1) can be written as Silverwood et al. (2015).
| (3) |
The ML value of for each and can be obtained by solving the derivative of Eq. (3) with respect to set to zero as Silverwood et al. (2015).
| (4) |
For IACTs such as H.E.S.S., the acceptance inhomogeneity is estimated to be 3% or less, unless observations is done with large zenith angle or bright sources in the FoV Berge et al. (2007). Therefore, we take the value of variance as the case for our analysis. The 5 sigma sensitivity for the case with systematic uncertainty are shown as dotted blue curve in Fig. 3. The top (bottom) panel shows these sensitivities for the high- (low-) spectral cutoff model for the low-latitude FB flux. The obtained sensitivities clearly show that CTA will have good sensitivity to the FB flux models in the GeV range, overlapping with Fermi-LAT data. Also, as seen in Fig. 3, systematics are the major effect at lower energy ( 2 TeV), however at higher energy ( 2 TeV), statistics take more role in the signal discovery. This is because at lower energy the background is more dominant, whose detection is strongly dependent on the instrumental systematics and at high energy the sensitivity is limited by a low signal flux. As seen in the bottom panel of Fig. 3, when including the 3% systematic uncertainty, it will be difficult for CTA to observe the high-latitude region of the FB. Further observational strategies will need to be considered in this case.
IV.2 On/Off analysis for CTA
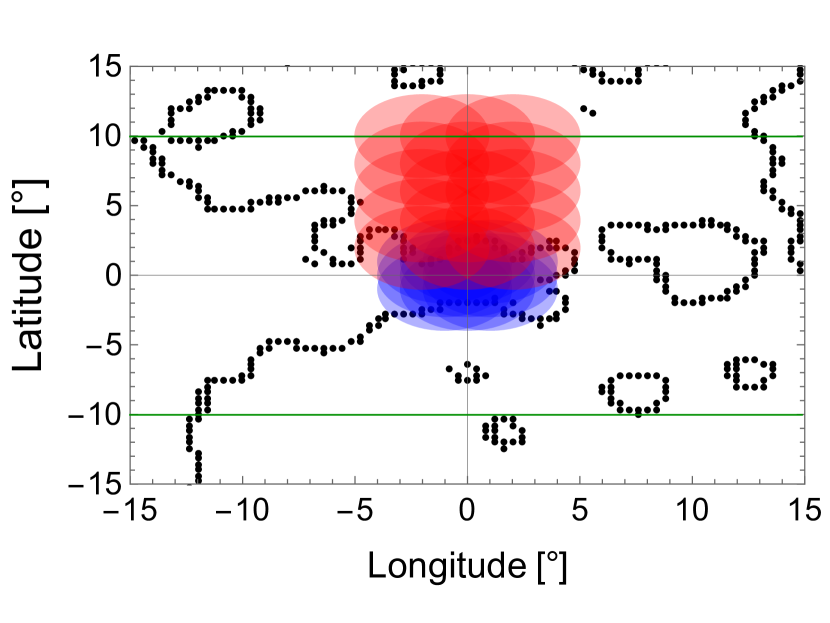
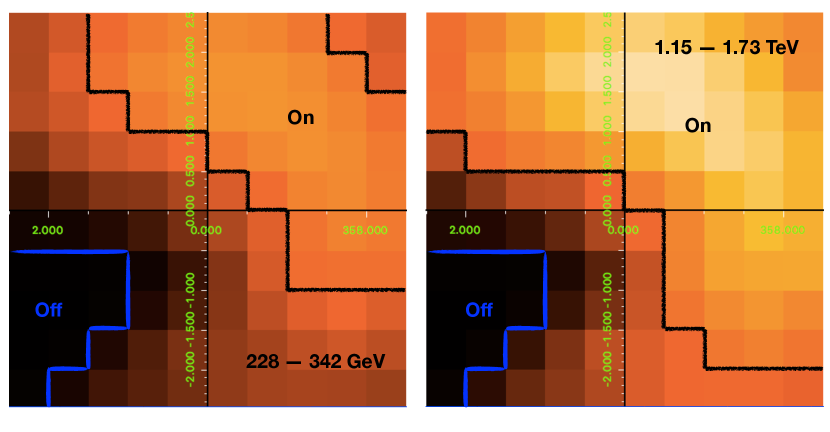
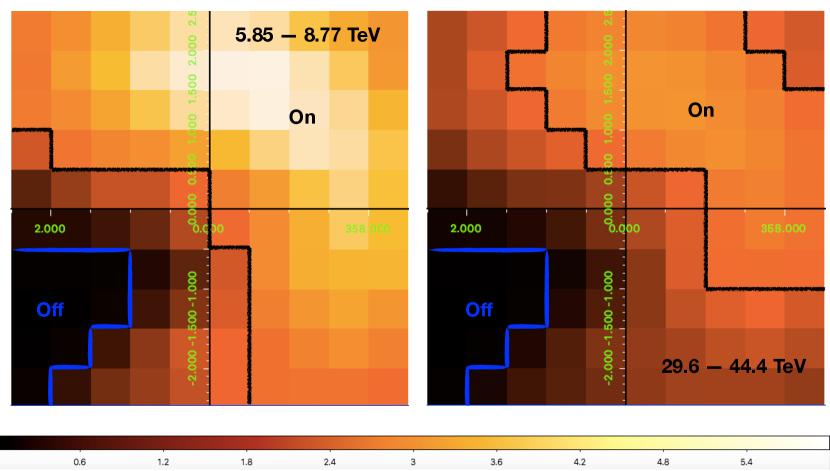
In a classic ON/OFF analysis or the so called Li-Ma analysis Li and Ma (1983), it is interesting and ideal to use FB edges as border between the ON and OFF regions to test if we can find sharp rims in the observation. First of all, we calculate the statistical significance in each pixel, for the Asimov dataset with known backgrounds. As for next step, we select the ON pixels with certain gamma-ray excess and the OFF pixels with no significant gamma-ray excess, . Statistical significance of the pixels is shown in Fig. 4 together with selections of the ON/OFF regions for the high spectral cutoff model ( PeV), where we can easily identify the regions with apparent brightness. However, the estimated significance explicitly depends on background and GDE models, which lack sufficient data at TeV regime and which need to be improved and modified according to future measurement. Systematic uncertainty from the GDE model has also been taken into account as discussed in Sec. IV A. For the high-cutoff FB spectrum, there is no pixel passing the ON selection for the first four and the last energy bins (30 – 152 GeV and 67 – 100 TeV, respectively), where the background events dominate over signal events. Hence, the energy range used for this analysis is from 228 GeV to 100 TeV. For the low spectral cutoff model ( TeV), half of the energy bins have the selected ON regions, ranging from 101 GeV to 5.85 TeV. As a result, we exclude those bins without the ON-region in the calculation.
For the Asimov dataset with known backgrounds, the parameter is denoted as the ratio of the expected means of and , i.e., . The corresponding likelihood function for the ON/OFF problem can be expressed as in Cousins et al. (2008)
| (5) |
where and are expected number of events for the ON and OFF region, given as ) and , respectively. The corresponding mock data in the selected ON and OFF region are and , respectively Abdallah et al. (2018). Therefore, the log-likelihood ratio is given by
| (6) |
where , and are the unconditional ML estimators of , and , and , and are the conditional ML estimators as a function of . The calculated 5 sigma sensitivities from the ON/OFF analysis are presented as the black dotted and red dot-dashed curves in Fig. 5 for the low-cutoff and high-cutoff spectral models for the low-latitude FB data, respectively, which match with the models in certain energy ranges. Therefore, CTA will have good sensitivity to the FB edges. However, note that the selection of ON and OFF regions introduces trials in our ON/OFF study using Asimov dataset. Therefore the statistical significance would be reduced in future observations, when this look elsewhere effect Lyons (2008) is taken into account.
To take into consideration of the systematics in ON/OFF analysis, first we compute () for the ON (OFF) region in each energy bin based on Eq. (4). The likelihood function is then formatted as below,
| (7) |
The obtained integral sensitivities with 3% systematics can be seen in Fig. 5 as the upper dot-dashed and dotted curves for certain spectra. CTA sensitivity including this systematics is still good enough for FB detection of the high-cutoff model. However for the low-cutoff model, with limited number of energy bins in the analysis, the sensitivity for FB detection is only possible if systematics is .
IV.3 Detection significance for LHAASO
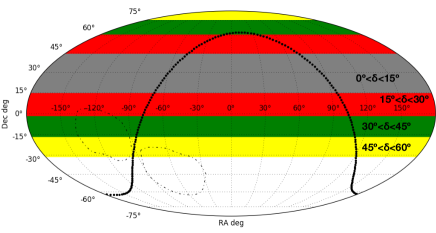
LHAASO is located at a latitude of 29∘21’31” North and at a longitude of 100∘09’15” East. As one of the major components, WCDA has a coverage of 78,000 m2 and observes gamma rays and cosmic rays in the energy range from 100 GeV to 100 TeV within a half-opening angle of 60∘. The estimated scalar effective area 333LHAASO Collaboration, private communication can get up to 106 m2 with energies above 30 TeV. According to its geographical location, LHAASO will be able to scan the whole Northern sky, and observe the Northern FB in 3 zenith-angle bands, [15∘, 30∘], [30∘, 45∘] and [45∘, 60∘] as shown in Fig. 6.
As a ground based hybrid detector, the major concern for LHAASO is the gamma and hadron separation. Absorption of gamma rays due to electron-positron pair production with photons from starlight or cosmic microwave background is negligible in the tested energy range. Another background is diffuse gamma-ray emission, which has been measured by Fermi-LAT Ackermann et al. (2012) and H.E.S.S. Aharonian et al. (2006b). To estimate the gamma-ray background in different sky regions, we adopt the same GDE model as CTA analysis from Ref. Gaggero et al. (2015) for the inner Galaxy region. Since the cosmic electron spectrum is about two orders of magnitudes lower than that of hadron, its contribution to the background is neglected.
We calculate the event numbers for FB, GDE and CR (, and ) for each zenith angle bin with formula, , where is the exposure time and is the flux of the FB, CR and GDE, respectively. Here, and are the effective area and the daily averaged FB solid angle seen by LHAASO (, 0.026 and 0.07 sr) for three zenith-angle bins [15∘, 30∘], [30∘, 45∘] and [45∘, 60∘] separately. Based on the study of Monte Carlo simulations, the hadron/gamma separation is characterized by the quality factor Liao et al. (2017), where the hadron background can be reduced to as expected. Hence, we obtain the model data and mock data as + for 30 day observation, where and represent the -th energy bin and -th zenith bin. The likelihood function can be obtained as
| (8) |
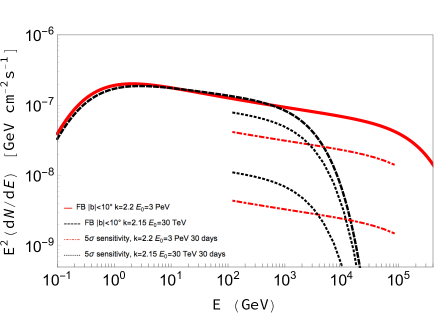
We calculate integral sensitivity of LHAASO to the FB with 5 sigma significance for both the high-cutoff and low-cutoff spectra as seen in Fig. 7 with the same test statistical method as in Sec. IV A and IV B. As a ground-base water Cherenkov detector, the overall systematic uncertainty, due to the detection efficiency, air shower modeling, optical model and so on, is estimated to be 10% Abeysekara et al. (2017b). In our calculation, we assume in Eq. (3) to take into account the systematic effect with the equations below,
| (9) |
where
| (10) |
Figure 7 shows LHAASO’s sensitivity to the high- and low-cutoff spectra from the Northern bubble for 30-day observation as red dot-dashed and black dotted curves, respectively, where the upper (lower) curve is without (with) systematic errors. By including the systematic errors, our sensitivities are worsen by a factor of 7 to 10 for the high-/low- cutoff model. These estimations are for low-latitude bubbles, based on the same FB flux as for CTA. For CTA, we have enough instrumental information such as effective area as function of energy and zenith angle, PSF etc., and we bin our data in 3 dimensions accordingly. In other words we have sufficient statistic, so we calculate the differential sensitivity, as shown in Fig. 3. However, for LHAASO, we only have effective area for four zenith-angle bins, that means we do not have the spatial distribution of counts. So that is why in Fig. 7, we present the integral sensitivity with and without systematic uncertainties and not differential sensitivity for each energy bin. With 10% systematic uncertainty, LHAASO will be able to detect the Northern FB with 30 day of data in case of both high- and low-cutoff models.
V Summary and conclusions
FB at the Galactic center Su et al. (2010); Dobler et al. (2010) are intriguing objects and are potential targets for ground-based VHE telescopes. The analysis of Fermi-LAT data results in FB spectra being best described as having a cutoff above 100 GeV, in the high Galactic latitude () region and without any apparent cutoff in the low Galactic latitude () region Ackermann et al. (2017). The low-latitude hard spectrum, which is not constrained by recent HAWC observations Abeysekara et al. (2017a), can potentially be targeted by CTA and LHAASO in near future.
We have explored sensitivity of CTA-South to the FB using Asimov data sets constructed from the FB hadronic flux models Razzaque and Yang (2018) and by taking into account cosmic-ray and diffuse gamma-ray backgrounds. We performed a morphological analysis, based on the proposed 525 hour Galactic center and 300 hour Northern Galactic plane observations by CTA Acharya et al. (2019), using publicly available ctools (v1.5.0) software Knödlseder et al. (2016). Our results show that CTA will be sensitive to the low-latitude FB in the 100 GeV –100 TeV ( 100 GeV –7 TeV) range for high- (low-) cut-off spectrum. A classic ON/OFF analysis with the same observations and flux models shows that CTA will be sensitive to the edges of the FB and put more constraints on our models. By taking into account 3% independent systematic uncertainty in each pixel, the sensitivity is worsen by up to a factor of 10, especially in the energy range of 30–152 GeV due to the dominant CR background. At lower energy ( TeV), the systematics determine the sensitivity, and at higher energy, the statistics take more control of the discovery.
With less details known about the LHAASO observation strategies, we have performed a simple sensitivity calculation using expected events from the FB flux and background models, integrated in the 0.1–100 TeV range. Our results show that LHAASO will have good sensitivity to the high-cutoff model for the low-latitude FB spectrum, even with a reasonably estimated 10% systematics. However we also notice that the discovery of FB by LHAASO will crucially depend on the systematics and sensitivity to the low-cutoff hadronic model will not improve even with longer observation time. Interesting upper limits can be derived from LHAASO observation in such a case.
As planned, CTA will be completed by 2025 and LHAASO will be fully in operation until 2023. With 10 more years of exposure by then, the HAWC’s sensitivity to the FB spectrum will improve, but still be above the high-latitude bubble. In other words, HAWC’s sensitivity will not significant improve to constrain the FB spectrum. In future, a further analysis from HAWC will provide a better sensitivity, especially at lower energies and possibly larger search regions according to the predictions of some theoretical models.
The synergies between IACTs and EAS arrays 444https://www.sgso-alliance.org/SGSOWiki/doku.php, like CTA and LHAASO, one with very good sensitivity and angular resolution and the other with large field of view and high duty cycle, can be beneficial to observe the FB and either detect TeV emission from the FB or constrain the gamma-ray flux models. IceCube neutrino signal from the FB, if confirmed, will provide a chance to differentiate the leptonic and hadronic models through the observation of gamma rays and neutrinos. CTA will constrain the model parameters, such as the cut-off energy and spectral index. For example, with the detection of both messengers, the hadronic origin will be confirmed and the spectrum would be hard with high-cutoff energy. On the other hand, if the FB is observed by CTA at only at the sub-TeV energy range (overlapping with the Fermi-LAT data), and without any neutrino excess, then the hadronic model with low-energy cutoff or a leptonic origin of the gamma rays will be preferred. The results will shed lights on the origin of FB and on multi-messenger (gamma ray and neutrino) emission from this intriguing source.
Acknowledgements.
We thank Dmitry Malyshev, Cecilia Lunardini and Igor Oya for helpful discussion and for comments on the manuscript. We also thank Zhiguo Yao for providing effective area data of LHAASO. L.Y. acknowledges the start-up funding from SYSU and the Slovenia Research Agency grant number Z1-8139 (B). S.R. acknowledges support from the National Research Foundation (South Africa) with Grant No: 111749 (CPRR). This paper has gone through internal review by the CTA Consortium.References
- Aharonian et al. (2006a) F. Aharonian et al. (H.E.S.S.), Astron. Astrophys. 457, 899 (2006a), eprint astro-ph/0607333.
- Hassan et al. (2016) T. Hassan, L. Arrabito, K. Bernlör, J. Bregeon, J. Hinton, T. Jogler, G. Maier, A. Moralejo, F. Di Pierro, and M. Wood (CTA), PoS ICRC2015, 971 (2016), eprint 1508.06075.
- Holder et al. (2006) J. Holder et al. (VERITAS), Astropart. Phys. 25, 391 (2006), eprint astro-ph/0604119.
- Abeysekara et al. (2013) A. U. Abeysekara et al., Astropart. Phys. 50-52, 26 (2013), eprint 1306.5800.
- Acharya et al. (2019) B. S. Acharya et al. (The CTA Consortium), World Scientific (2019), eprint 1709.07997.
- Di Sciascio (2016) G. Di Sciascio (LHAASO), Nucl. Part. Phys. Proc. 279-281, 166 (2016), eprint 1602.07600.
- Su et al. (2010) M. Su, T. R. Slatyer, and D. P. Finkbeiner, Astrophys. J. 724, 1044 (2010), eprint 1005.5480.
- Dobler et al. (2010) G. Dobler, D. P. Finkbeiner, I. Cholis, T. R. Slatyer, and N. Weiner, Astrophys. J. 717, 825 (2010), eprint 0910.4583.
- Ade et al. (2013) P. A. R. Ade et al. (Planck), Astron. Astrophys. 554, A139 (2013), eprint 1208.5483.
- Finkbeiner (2004) D. P. Finkbeiner, Astrophys. J. 614, 186 (2004), eprint astro-ph/0311547.
- Mertsch and Sarkar (2011) P. Mertsch and S. Sarkar, Phys. Rev. Lett. 107, 091101 (2011), eprint 1104.3585.
- Abeysekara et al. (2017a) A. U. Abeysekara et al., Astrophys. J. 842, 85 (2017a), eprint 1703.01344.
- Ackermann et al. (2014) M. Ackermann et al. (Fermi-LAT), Astrophys. J. 793, 64 (2014), eprint 1407.7905.
- Crocker and Aharonian (2011) R. M. Crocker and F. Aharonian, Phys. Rev. Lett. 106, 101102 (2011), eprint 1008.2658.
- Crocker (2012) R. M. Crocker, Mon. Not. Roy. Astron. Soc. 423, 3512 (2012), eprint 1112.6247.
- Lunardini and Razzaque (2012) C. Lunardini and S. Razzaque, Phys. Rev. Lett. 108, 221102 (2012), eprint 1112.4799.
- Razzaque (2013) S. Razzaque, Phys. Rev. D88, 081302(R) (2013), eprint 1309.2756.
- Lunardini et al. (2014) C. Lunardini, S. Razzaque, K. T. Theodoseau, and L. Yang, Phys. Rev. D90, 023016 (2014), eprint 1311.7188.
- Lunardini et al. (2015) C. Lunardini, S. Razzaque, and L. Yang, Phys. Rev. D92, 021301(R) (2015), eprint 1504.07033.
- Fujita et al. (2013) Y. Fujita, Y. Ohira, and R. Yamazaki, Astrophys. J. 775, L20 (2013), eprint 1308.5228.
- Aartsen et al. (2017) M. G. Aartsen et al. (IceCube) (2017), eprint 1710.01191.
- Razzaque and Yang (2018) S. Razzaque and L. Yang (2018), eprint 1802.05636.
- Fang et al. (2017) K. Fang, M. Su, T. Linden, and K. Murase, Phys. Rev. D96, 123007 (2017), eprint 1704.03869.
- Ackermann et al. (2017) M. Ackermann et al. (Fermi-LAT), Astrophys. J. 840, 43 (2017), eprint 1704.03910.
- Thompson (2015) D. J. Thompson, Comptes Rendus Physique 16, 600 (2015).
- de Naurois and Mazin (2015) M. de Naurois and D. Mazin, Comptes Rendus Physique 16, 610 (2015), eprint 1511.00463.
- Knödlseder et al. (2016) J. Knödlseder et al., Astron. Astrophys. 593, A1 (2016), eprint 1606.00393.
- Voelk and Bernloehr (2009) H. J. Voelk and K. Bernloehr, Exper. Astron. 25, 173 (2009), eprint 0812.4198.
- Atwood et al. (2013) W. Atwood et al. (Fermi-LAT) (2013), eprint 1303.3514.
- Aharonian et al. (2006b) F. Aharonian et al. (H.E.S.S.), Nature 439, 695 (2006b), eprint astro-ph/0603021.
- Gaggero et al. (2017) D. Gaggero, D. Grasso, A. Marinelli, M. Taoso, and A. Urbano, Phys. Rev. Lett. 119, 031101 (2017), eprint 1702.01124.
- Cowan et al. (2011) G. Cowan, K. Cranmer, E. Gross, and O. Vitells, Eur. Phys. J. C71, 1554 (2011), [Erratum: Eur. Phys. J.C73,2501(2013)], eprint 1007.1727.
- Aharonian et al. (2004) F. Aharonian et al. (H.E.S.S.), Astron. Astrophys. 425, L13 (2004), eprint astro-ph/0408145.
- Aharonian et al. (2005) F. Aharonian et al. (H.E.S.S.), Astron. Astrophys. 432, L25 (2005), eprint astro-ph/0501265.
- Aharonian (2008) F. Aharonian (H.E.S.S.), Astron. Astrophys. 483, 509 (2008), eprint 0803.2844.
- Wilks (1938) S. S. Wilks, Annals Math. Statist. 9, 60 (1938).
- James and Roos (1975) F. James and M. Roos, Comput. Phys. Commun. 10, 343 (1975).
- Silverwood et al. (2015) H. Silverwood, C. Weniger, P. Scott, and G. Bertone, JCAP 1503, 055 (2015), eprint 1408.4131.
- Berge et al. (2007) D. Berge, S. Funk, and J. Hinton, Astron. Astrophys. 466, 1219 (2007), eprint astro-ph/0610959.
- Li and Ma (1983) T. P. Li and Y. Q. Ma, Astrophys. J. 272, 317 (1983).
- Cousins et al. (2008) R. D. Cousins, J. T. Linnemann, and J. Tucker, Nucl. Instrum. Meth. A595, 480 (2008), eprint physics/0702156.
- Abdallah et al. (2018) H. Abdallah et al. (HESS), Phys. Rev. Lett. 120, 201101 (2018), eprint 1805.05741.
- Lyons (2008) L. Lyons, Ann. Appl. Stat. 2, 887 (2008).
- Ackermann et al. (2012) M. Ackermann et al. (Fermi-LAT), Astrophys. J. 750, 3 (2012), eprint 1202.4039.
- Gaggero et al. (2015) D. Gaggero, A. Urbano, M. Valli, and P. Ullio, Phys. Rev. D91, 083012 (2015), eprint 1411.7623.
- Liao et al. (2017) W. Liao et al. (LHAASO), PoS ICRC2017 (2017), URL https://pos.sissa.it/301/842/.
- Abeysekara et al. (2017b) A. U. Abeysekara et al. (HAWC), Science 358, 911 (2017b), eprint 1711.06223.