(3200) Phaethon: Bulk density from Yarkovsky drift detection
Abstract
Context. The recent close approach of the near-Earth asteroid (3200) Phaethon offered a rare opportunity to obtain high-quality observational data of various types.
Aims. We used the newly obtained optical light curves to improve the spin and shape model of Phaethon and to determine its surface physical properties derived by thermophysical modeling. We also used the available astrometric observations of Phaethon, including those obtained by the Arecibo radar and the Gaia spacecraft, to constrain the secular drift of the orbital semimajor axis. This constraint allowed us to estimate the bulk density by assuming that the drift is dominated by the Yarkovsky effect.
Methods. We used the convex inversion model to derive the spin orientation and 3D shape model of Phaethon, and a detailed numerical approach for an accurate analysis of the Yarkovsky effect.
Results. We obtained a unique solution for Phaethon’s pole orientation at ecliptic longitude and latitude (both with an uncertainty of ), and confirm the previously reported thermophysical properties ( km, ). Phaethon has a top-like shape with possible north-south asymmetry. The characteristic size of the regolith grains is cm. The orbit analysis reveals a secular drift of the semimajor axis of au Myr-1. With the derived volume-equivalent size of 5.1 km, the bulk density is g cm-3. If the size is slightly larger km, as suggested by radar data, the bulk density would decrease to g cm-3. We further investigated the suggestion that Phaethon may be in a cluster with asteroids (155140) 2005 UD and (225416) 1999 YC that was formed by rotational fission of a critically spinning parent body.
Conclusions. Phaethon’s bulk density is consistent with typical values for large ( km) C-complex asteroids and supports its association with asteroid (2) Pallas, as first suggested by dynamical modeling. These findings render a cometary origin unlikely for Phaethon.
Key Words.:
minor planets, asteroids, individual: (3200) Phaethon, methods:numerical, methods: observational, astrometry, celestial mechanics1 Introduction
Physical properties of the low-perihelion near-Earth asteroid Phaethon, target of the proposed JAXA DESTINY+ mission (Arai et al., 2018), have so far been inferred from a wide range of datasets: photometry in optical (Krugly et al., 2002; Ansdell et al., 2014) and infrared bands (Green et al., 1985; Tedesco et al., 2004), spectroscopy (Licandro et al., 2007; Hanuš et al., 2016), polarimetry (Devogèle et al., 2018; Ito et al., 2018), and radar (Taylor et al., 2018). Other studies were dedicated to Phaethon’s comet-like activity (Jewitt & Li, 2010; Jewitt et al., 2013; Li & Jewitt, 2013; Ye et al., 2018), to the associated Geminid meteor stream (Gustafson, 1989; Williams & Wu, 1993; Trigo-Rodríguez et al., 2004), or to the dynamical link with the main-belt asteroid (2) Pallas (de León et al., 2010; Todorović, 2018).
Despite these numerous studies, the true nature of Phaethon has not yet been convincingly revealed. There is even a controversy involving the basic physical properties of Phaethon, such as its size and geometric visible albedo: recent studies based on polarimetric observations (Devogèle et al., 2018; Ito et al., 2018) report a significantly lower geometric albedo than has been inferred from thermal infrared data. Similarly, a possibly larger size than previous diameter determinations from thermal infrared observations was reported from the analysis of delay-Doppler observations by Taylor et al. (2018). These persisting inconsistencies motivated us to apply independent methods and improve our previous thermophysical modeling to ultimately understand the nature and origin of this intriguing object.
The polarimetric and dynamical studies mentioned above are in favor of a physical link between Phaethon and Pallas. In their view, Phaethon is an escapee member from the Pallas collisional family. This association is also supported by the spectroscopic studies in the visible and near-infrared (Licandro et al., 2007; de León et al., 2012). On the other hand, some authors remain in favor of a cometary origin for Phaethon (e.g., Trigo-Rodríguez et al., 2004; Borovička, 2010). In order to shed light on this fundamental issue, we first determine a unique model of Phaethon’s spin state and its shape from a thermophysical model. Next, we use all available astrometric data to prove that accurate orbit determination requires that the Yarkovsky effect is included, which results in a steady decrease of the semimajor axis (e.g., Vokrouhlický et al., 2015). Because of its non-gravitational origin, a detailed theoretical model of the Yarkovsky effect, if fed by our spin and shape solution, allows us to constrain Phaethon’s bulk density. This parameter helps us to infer its internal composition and conclude about its origin.
2 Astrometric observations and orbit determination
Astrometric data exist since the discovery of Phaethon by the Infrared Astronomical Satellite in October 1983 (Green & Kowal, 1983). As of July 2018, 4782 astrometric observations have been reported to the Minor Planet Center by ground-based observatories and 28 observations by the WISE spacecraft.111https://www.minorplanetcenter.net/db_search/show_object?utf8=\%E2\%9C\%93&object_id=3200 To this dataset of optical astrometry, we applied the Farnocchia et al. (2015a) star catalog debiasing and the Vereš et al. (2017) weighting scheme. Isolated observations that showed localized biases or internal inconsistencies were de-weighted or excluded from the fit.
In addition to the ground-based observations and WISE data, the Gaia spacecraft observed Phaethon during 12 transits between September 2014 and February 2016. The corresponding astrometry was part of the Gaia DR2 release (Gaia Collaboration et al., 2018). The Gaia small-body astrometry is decoupled into two components, along scan (AL), and across scan (AC). These two components are only weakly correlated; the AL component has a much greater accuracy than the AC component. Nevertheless, we made use of the full correlated observation error covariance model and found that the characteristic uncertainties were mas in the AL direction and ″ in the AC direction. To avoid problems with transit-specific systematic errors, we selected a single observation for each of the 12 transits.
Because of its low Earth MOID of au, Phaethon occasionally experiences close approaches to the Earth. During the 2007 and 2017 approaches, a total of six delay measurements were collected from the Arecibo and Goldstone radars (Taylor et al., 2018).222https://ssd.jpl.nasa.gov/?grp=ast&fmt=html&radar= This wealth of observational data places extremely tight constraints on the orbit of Phaethon. For instance, the formal uncertainty in semimajor axis is only m and only 20 ms in orbital period.
We used the aforementioned astrometric observations for orbital determination: Our force model includes the Newtonian gravity of the Sun, the planets, Pluto, Moon, the 16 largest perturbers in the main belt, and relativistic effects (e.g., Farnocchia et al., 2015b). Since Phaethon has a low perihelion and experiences close encounters to the Earth, we also included perturbations that are due the oblateness of the Sun and the Earth. To fit the complete dataset, and in particular both the 2007 and 2017 radar apparitions, it was also necessary to include non-gravitational perturbations, in particular, the Yarkovsky effect. We describe Yarkovsky modeling and its parametric dependence in Sect. 3.4.
3 Results
3.1 Revised spin and shape model
We applied the convex inversion method of Kaasalainen et al. (2001) and Kaasalainen & Torppa (2001) to the optical dataset of 70 light curves (described in Appendix A and listed in Table 3) following exactly the procedure of Hanuš et al. (2016). Specifically, we scanned rotation periods in the proximity of the expected value while testing ten initial pole solutions for each sampled period. Four poles were selected on the equator with 90 degrees difference in longitude, and three poles in each hemisphere with the latitude degrees and with 120 degrees difference in longitude. We assumed that all solutions within a uncertainty interval had , where is the of the best-fitting solution and is the number of degrees of freedom. This threshold to consider the solution acceptable was used before in Vokrouhlický et al. (2017) or Ďurech et al. (2018)333Be aware of the typo in the referenced equation in these two studies. and corresponded to a % increase in value. Only the best-fitting solution fulfilled the condition on the . To further verify that the best-fitting solution was the only one acceptable, we also visually inspected the light-curve fit with the second-best-fitting period, similarly as in Hanuš et al. (2016), see their Figs. 3 and 4 for illustration. This solution was already inconsistent with several individual light-curves. Therefore, we considered the difference in as significant and rejected all periods except for the best-fitting one. Next, we ran the convex inversion with the unique period and multiple pole orientations (isotropically distributed on a sphere with a 30 degree difference) as starting points of the optimization procedure and derived a single solution within the uncertainty interval defined above. Again, we visually inspected the light-curve fit with the second-best-fitting pole orientation and rejected this solution and also considered all other solutions as non-acceptable. The final solution is given in Table 1 together with the previous determinations. It is notable that our analysis and the recent study of Kim et al. (2018) provide for the first time a unique shape and spin solution that is consistent with the preferred solution of Hanuš et al. (2016). There are two differences between our old and revised models: (i) the relative dimension along the rotation axis (or the ratio) is now smaller by 10%, which is expected because this dimension is generally the least constrained by the optical data, and (ii) the pole directions are about degrees apart.
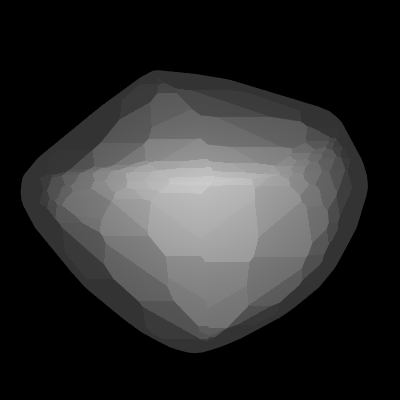
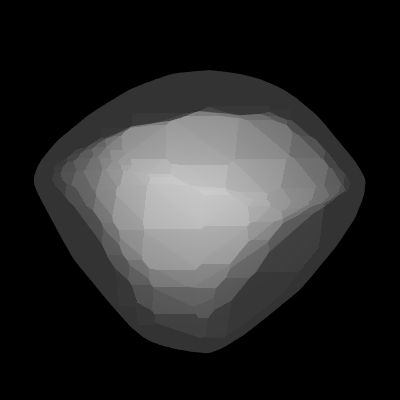
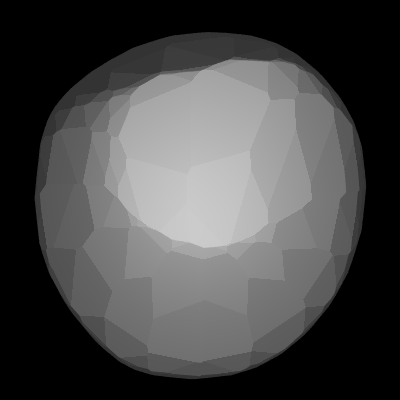
We find that the overall shape of Phaethon is nearly axially symmetric: the x-y projection is not far from a circle with of (right panel of Fig. 1). Moreover, there seems to be a hint of an equatorial ridge and the top-shape like appearance (also noted by Taylor et al., 2018, from radar observations) that is often found in the sub-kilometer and kilometer-sized fast rotators (Ostro et al., 2006; Busch et al., 2011; Naidu et al., 2015). Additionally, our model suggests a north-south asymmetry of Phaethon, with the northern hemisphere slightly suppressed. Interestingly, our model for Phaethon is reminiscent of that of the Hayabusa 2 mission target (162173) Ryugu, whose recent public images revealed its top-shape appearance (Hasegawa et al., 2008).
| Note | |||||
|---|---|---|---|---|---|
| [deg] | [deg] | [deg] | [deg] | [hours] | |
| Krugly et al. (2002) | |||||
| Ansdell et al. (2014) | |||||
| Hanuš et al. (2016) | |||||
| Kim et al. (2018) | |||||
| This work |
3.2 Updated thermophysical properties
Given the new and unique spin and shape model, we repeated the thermophysical modeling (TPM) of Hanuš et al. (2016). The revised TPM solution is consistent with the previous one, mostly because the shape model derived here is similar to that of Hanuš et al. (2016). Therefore, we do not report in detail the new results as they are essentially identical to those in Hanuš et al. (2016): (i) equivalent size km, (ii) geometric albedo , and (iii) thermal inertia (all formal uncertainties).
| Case | ||||
|---|---|---|---|---|
| [mm] | [W m-1 K-1] | [W m-1 K-4] | ||
| 1 | 0.3 | 12 | ||
| 2 | 0.4 | 14 | ||
| 3 | 0.5 | 16 | ||
| 4 | 0.6 | 20 |
3.3 Regolith grain size and thermal conductivity
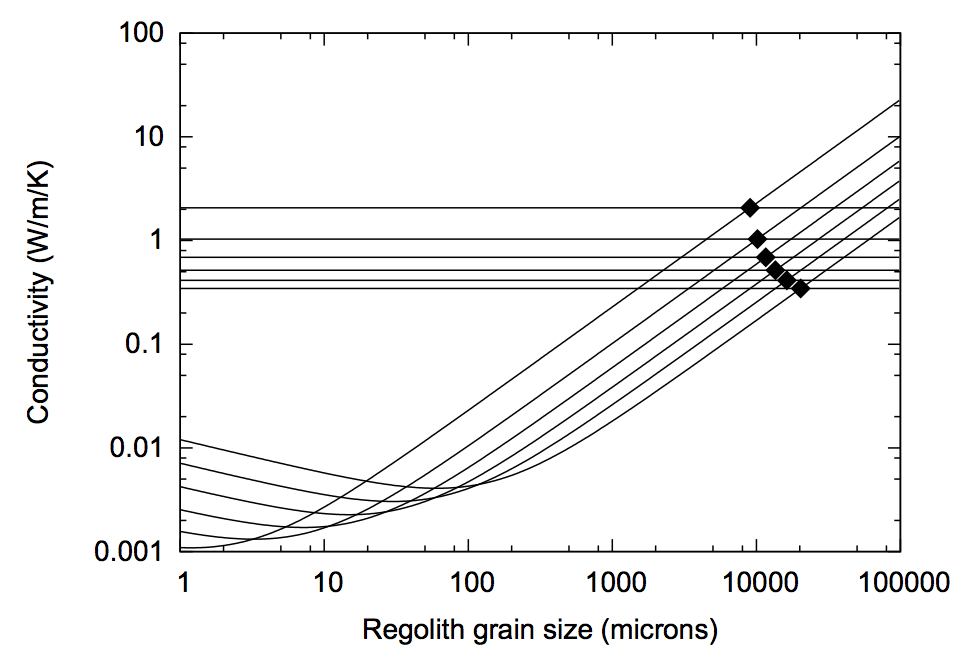
We used the method of Gundlach & Blum (2013) to determine the grain size of the surface regolith of Phaethon. The method uses the asteroid thermal inertia that was obtained by Hanuš et al. (2016) has also been confirmed by us here to infer the thermal conductivity of the regolith,
| (1) |
where is the specific heat capacity, and is the grain density, as a function of the regolith grain filling factor . These conductivity values are represented by the horizontal lines in Fig. 2.
Since the regolith filling factor is unconstrained, we considered its values to range between 0.1 (extremely fluffy packing, which is plausible only for small regolith particles) and 0.6 (close to the densest packing of equal-sized particles) with =0.1 step. The values of and represent typical C-type thermophysical properties of the regolith (see Opeil et al., 2010). We only used the nominal value for the grain size determination. The relative uncertainty of 30% in the value of the thermal inertia translates into variations of the horizontal lines in Fig. 2 of about %, which is still within the range encompassed by our lack of knowledge of the value of .
Next, the Gundlach & Blum (2013) model calculates the thermal conductivity of a granular medium (the regolith) as a function of the size of the grain and temperature, assuming density, heat capacity, and thermal conductivity of the solid grains. The thermal inertia for Phaethon was derived from observations obtained at 1.1 au and 1 au from the Sun. Using and from Hanuš et al. (2016), we obtained a value of the bolometric Bond albedo . Using as in Harris (1998), we estimate sub-solar temperature of 339 K and 355 K at 1.1 au and 1 au, respectively. We used the mean of these values, namely 347 K. Using these input parameters for the model, we now determined the curves in Fig. 2 following the model of Gundlach & Blum (2013). The abscissa value of the intersection points between these curves and the horizontal lines of Fig. 2 indicate the typical radius of the regolith grains. We find that the typical regolith grain size for Phaethon is about cm.
The regolith volume filling factors of or are probably unrealistic for the larger grains derived above, so we decided to consider only the four cases listed in Table 2. Using Eq. (5) of Gundlach & Blum (2013), we calculated the temperature-dependent thermal conductivity for these four cases for temperatures between 100 and 1300 K. For the temperature range and regolith grain size appropriate for Phaethon, Eq. (5) of Gundlach & Blum (2013) gives and may be approximated with a simpler relation in the form (Keihm, 1984; Delbo’ et al., 2015)
| (2) |
where the first term corresponds to the solid-state thermal conductivity , the second term is due to thermal conductivity by photons, and is the temperature. By fitting Eq. (2) to the calculated values, we obtained the parameter values reported in Table 2.
3.4 Yarkovsky drift detection and bulk density
Because of its extremely eccentric orbit (), Phaethon presents a particularly challenging case for an accurate analysis of the Yarkovsky effect. As a result of the temperature-dependent thermal conductivity described by Eq. (2), the value of this parameter changes by a factor between perihelion (0.14 au) and au. Similarly, the thermal parameter, directly dictating angular lag of the thermal effects (e.g., Bottke et al., 2006), may change by a factor of between perihelion and au, and the radiation flux changes by a factor of in the same range. All these large variations limit the validity of simplified approaches to the Yarkovsky effect modeling, and warrant the adoption of a fully fledged numerical approach.
We adopted the model developed by Čapek & Vokrouhlický (2005), in which 1D thermal conduction below each of the surface facets is solved numerically with the nonlinear Robin boundary condition at the surface, and the assumption of an isothermal core at a sufficient depth is made. A temperature-dependence of the thermal conductivity following Eq. (2) was used. For the sake of simplicity, the specific heat capacity was assumed constant, J kg-1 K-1, and the regolith grain density obtained for C-type meteorites was used, g cm-3 (both from Gundlach & Blum, 2013). We ran solutions for four values of the packing factor in the range between and . Each time, the parameters of the thermal conductivity were adjusted to satisfy the constraints from thermal observations described in Sec. 3.3 (see Table 2). The time domain of one revolution about the Sun was divided into steps of s, short enough when compared to the hr rotation period, and the space grid describing the depth below each of the surface increased exponentially, as described in Čapek & Vokrouhlický (2005). We ensured that at each depth, the von Neumann stability condition was satisfied. Typically, ten iterative steps of the algorithm provide the temperature with an accuracy of one degree or better in the whole space and time domain of the solution. The shape and spin state of Phaethon was taken from the modeling in Sec. 3.1. Similarly, the volume-equivalent size of km from Sec. 3.2 was used as an implicit value. The last parameter required to compute the thermal recoil acceleration (the Yarkovsky effect) is the bulk density of Phaethon. Our nominal models use g cm-3 for the clarity, but we treated this value as a free parameter in the orbit determination process (similarly to what was done for asteroid Bennu in Chesley et al., 2014). Scaling to different densities is easily implemented by using the inverse-proportional dependence of the thermal acceleration on the bulk density. In our analysis we neglected the enhancement of the Yarkovsky effect that is due to surface roughness (Rozitis & Green, 2012). This effect could cause an increase in our bulk density estimate of less than 10%, which is well within the formal uncertainty.
After determining the temperature of each surface facet, we evaluated the total thermal acceleration at every minute throughout the orbit using a numerical surface integration. For simplicity, we assumed the Lambert thermal emission law (e.g., Eq. (3) in Bottke et al., 2006). These thermal acceleration values were then used as part of the fit to the astrometry.
With this procedure, we estimated Phaethon’s bulk density as g cm-3. Variations due to the different packing factors are negligible (0.02 g cm-3). Therefore, the differences stemming from a choice of the thermal model are much smaller than the formal uncertainty of the density solution from the fit to the astrometry. We also verified that calibrating the constants and to the value of the thermal inertia and , that is, at one standard deviation from the nominal value, produces an insignificant variation in the bulk density solution (% vs. the % formal uncertainty). Similarly, our solution assumes the nominal value of Phaethon’s size, specifically km, which has only small fractional (formal) uncertainty of %. This may again be neglected with respect to the % fractional uncertainty of the density solution. If required, we may also express the Yarkovsky detection for Phaethon in the usual way as a au Myr-1 secular drift of the orbital semimajor axis (compare with data, e.g., in Vokrouhlický et al., 2015).
4 Discussion
The size and albedo solution from the thermal modeling may have a systematic error due to the possibly improper modeling of physical effects on the surface of this extreme body. This point of view is advocated by results of the recent radar campaign (e.g., Taylor et al., 2018) and extrapolation of the polarimetric measurements at large phase angles (Ito et al., 2018; Devogèle et al., 2018), both of which yield asomewhat larger size km than the 5.1 km nominal value used in this work. Without a detailed understanding of this difference, we are not fully capable of correcting our basic thermal model to accommodate this difference. If we were to assume this larger size, we would obtain a bulk density of 1.48 g cm-3, which is within the estimate uncertainty. We only note that the bulk density would approach the g cm-3 value obtained for asteroid (101955) Bennu (Chesley et al., 2014), which is also a small B-type body. While this consistency is encouraging, it should not be overstated: we note, for instance, that the suggested source region for Bennu (Eulalia or new Polana asteroid families, Walsh et al., 2013; Bottke et al., 2015) is different from that of Phaethon and the spectra of these two bodies are somewhat different in the near-infrared range (Campins et al., 2010).
Our density solution for Phaethon from the Yarkovsky model in Sec. 3.4 assumed a particular model of the temperature dependence of the surface thermal conductivity. While supported by theoretical arguments and measurements for the lunar regolith (e.g., Keihm, 1984), we do not have a direct observational confirmation of this effect on Phaethon. On the other hand, Rozitis et al. (2018) measured a different dependence of the thermal inertia on temperature on (1036) Ganymed, (276049) 2002 CE26, and (1580) Betulia. This is because the calibration of Phaethon’s surface conductivity derives from observations taken at a very restricted range of heliocentric distances. Moreover, we note that the bulk density solution depends on the conductivity assumption. For instance, if the conductivity were assumed constant (and not increasing toward smaller heliocentric distances), the bulk density would decrease to g cm-3. In general, any shallower dependence of the surface thermal conductivity on heliocentric distance than that of our nominal model would imply a lower bulk density.
We assumed that the Yarkovsky effect is the dominant non-gravitational effect in the orbital solution of Phaethon. While the effects of the Poynting-Robertson or solar wind drag are about two orders of magnitude smaller and may be safely neglected, some concern remains about influence of the mass loss near perihelion passages. We note that direct observational evidence is quite limited and reveals only short episodes of very weak activity (e.g., Li & Jewitt, 2013). Additionally, the assumed small size of the particles triggering the observed effects results in a quite low mass-loss rate (e.g., Ye et al., 2018). We estimated the corresponding dynamical effects in Appendix B and found that the resulting change in semimajor axis of Phaethon is at most an order of magnitude smaller than the Yarkovsky effect.
Additionally, we note that the spin state solution from Sec. 3.1 implies that Phaethon’s pole regions are never irradiated from low zenith angles near perihelion passages. For instance, the south rotation pole is shadowed before the perihelion passage and becomes illuminated during and after the passage. However, the maximum solar elevation about the local horizon at the south pole is only about and quickly becomes even smaller within a week. The situation is opposite for the north rotation pole. As a result, we do not expect a huge increase in activity at the pole regions caused by the changing geometry of illumination near perihelion.
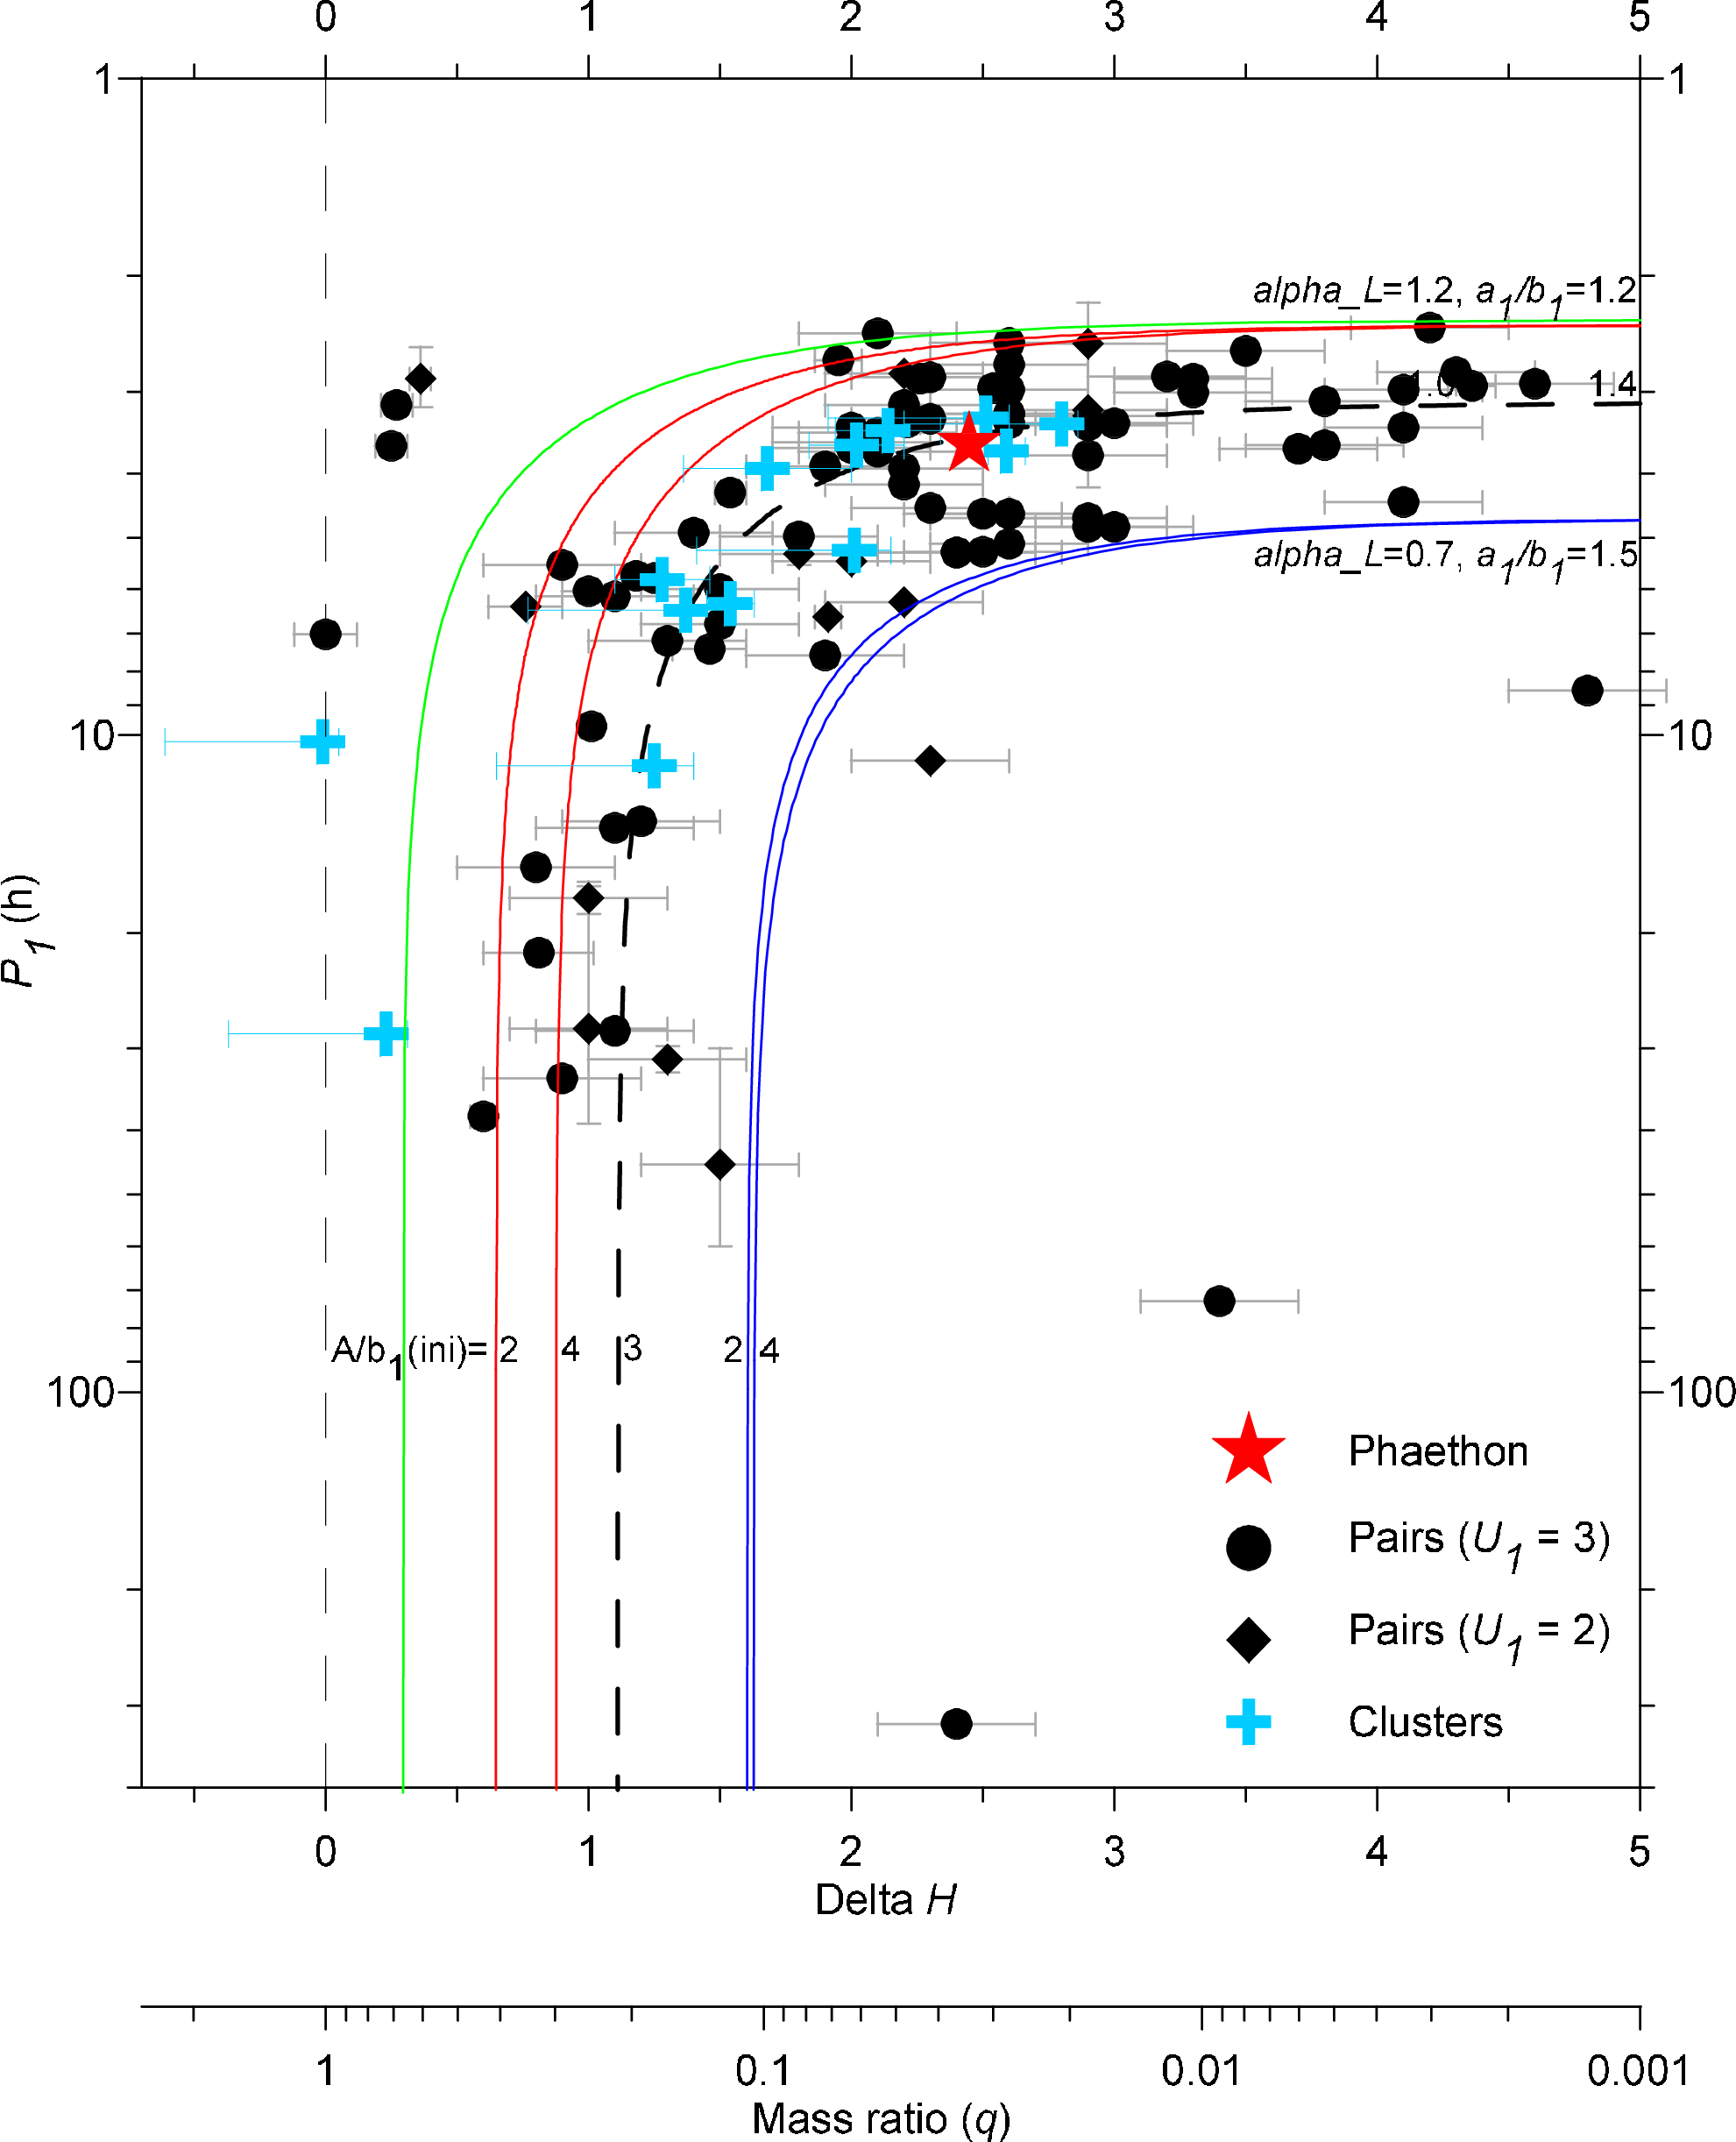
(3200) Phaethon appears to be in a cluster with asteroids (155140) 2005 UD and (225416) 1999 YC (Ohtsuka et al., 2006, 2008; Hanuš et al., 2016).444The 6m diameter asteroid 2012 KT42 may be also a member of the Phaethon cluster. Polishook et al. (2012) found it to be a B type, very similar to Phaethon. The cluster 3200–155140–225416 could be formed by rotational fission of a critically spinning parent body (Scheeres, 2007; Pravec et al., 2018, and references therein). To examine this hypothesis, we estimated the total secondary-to-primary mass ratio of the cluster from the absolute magnitudes of its three members, and (Hanuš et al., 2016, and MPC) using Eqs. (3) and (4) of Pravec et al. (2018): . With the primary rotation period h, this agrees excellently well with the theory of cluster formation by rotational fission. Specifically, it falls very close to the nominal – curve in Fig. 14 of Pravec et al. (2018), which nominally predicts h for , see Fig. 3. In other words, the current rotation of Phaethon was slowed down from the original critical spin frequency by the formation and ejection of the two secondaries, with part of its original rotation energy and angular moment carried away by the escaping secondaries. The apparent top-like shape of Phaethon may be a product of the spin fission process, as observed for a number of primaries of near-Earth binary asteroids. We further note that this hypothesis should not be overestimated: the uncertainty about whether the three bodies are indeed dynamically related is still great. Further physical characterization of the two smaller bodies is required to better understand the properties of the suggested cluster.
Our derived Phaethon bulk density is consistent with values typical for large (100 km) C-complex asteroids (Carry, 2012; Marchis et al., 2008; Hanuš et al., 2017). However, similarly sized C-complex asteroids should have higher porosity and therefore a slightly lower density than found here for Phaethon. We may only speculate that the extreme solar irradiation is capable of decreasing the macroporosity. Interestingly, the bulk density of Pallas is higher than the typical values for the 100 km C-complex asteroids, so that the possible dynamical link with Phaethon (de León et al., 2010; Todorović, 2018) is consistent with Phaethon’s higher bulk density. Conversely, typical comets are found to have bulk densities far lower (often lower than g cm-3, e.g., Weissman & Lowry, 2008). Our results thus speak against Phaethon being a comet in its nearly dormant phase.
Acknowledgements.
This work has been supported by the Czech Science Foundation (JH grant 18-04514J, DV and the Ondřejov group grant 17-00774S). Additional support from the Charles University Research program No. UNCE/SCI/023 is also acknowledged. MD acknowledges support from the French Centre National d’Études Spatiales (CNES). DP acknowledges the Koshland Foundation’s support. Part of the research was carried out at the Jet Propulsion Laboratory, California Institute of Technology, under a contract with the National Aeronautics and Space Administration. We thank J. Giorgini for providing useful information about the radar astrometry of Phaethon.References
- Ansdell et al. (2014) Ansdell, M., Meech, K. J., Hainaut, O., et al. 2014, ApJ, 793, 50
- Arai et al. (2018) Arai, T., Kobayashi, M., Ishibashi, K., et al. 2018, in Lunar and Planetary Science Conference, Vol. 49, Lunar and Planetary Science Conference, 2570
- Borovička (2010) Borovička, J. 2010, in Proceedings of the International Meteor Conference, 26th IMC, Bareges, France, 2007, ed. J. Rendtel & J. Vaubaillon, 42–51
- Bottke et al. (2006) Bottke, J. W. F., Vokrouhlický, D., Rubincam, D. P., & Nesvorný, D. 2006, Annual Review of Earth and Planetary Sciences, 34, 157
- Bottke et al. (2015) Bottke, W. F., Vokrouhlický, D., Walsh, K. J., et al. 2015, Icarus, 247, 191
- Busch et al. (2011) Busch, M. W., Ostro, S. J., Benner, L. A. M., et al. 2011, Icarus, 212, 649
- Campins et al. (2010) Campins, H., Morbidelli, A., Tsiganis, K., et al. 2010, ApJ, 721, L53
- Čapek & Vokrouhlický (2005) Čapek, D. & Vokrouhlický, D. 2005, Dynamics of Populations of Planetary Systems, ed. Z. Knežević & A. Milani (Cambridge University Press, Cambridge)
- Carry (2012) Carry, B. 2012, Planet. Space Sci., 73, 98
- Chesley et al. (2014) Chesley, S. R., Farnocchia, D., Nolan, M. C., et al. 2014, Icarus, 235, 5
- de León et al. (2010) de León, J., Campins, H., Tsiganis, K., Morbidelli, A., & Licandro, J. 2010, A&A, 513, A26
- de León et al. (2012) de León, J., Pinilla-Alonso, N., Campins, H., Licandro, J., & Marzo, G. A. 2012, Icarus, 218, 196
- Delbo’ et al. (2015) Delbo’, M., Mueller, M., Emery, J., Rozitis, B., & Capria, M. T. 2015, in Asteroids IV, ed. P. Michel, F. E. DeMeo, & W. F. Bottke (The University of Arizona Press), 107–128
- Devogèle et al. (2018) Devogèle, M., Cellino, A., Borisov, G., et al. 2018, MNRAS
- Ďurech et al. (2010) Ďurech, J., Sidorin, V., & Kaasalainen, M. 2010, A&A, 513, A46
- Ďurech et al. (2018) Ďurech, J., Vokrouhlický, D., Pravec, P., et al. 2018, A&A, 609, A86
- Farnocchia et al. (2015a) Farnocchia, D., Chesley, S. R., Chamberlin, A. B., & Tholen, D. J. 2015a, Icarus, 245, 94
- Farnocchia et al. (2015b) Farnocchia, D., Chesley, S. R., Milani, A., Gronchi, G. F., & Chodas, P. W. 2015b, in Asteroids IV, ed. P. Michel, F. E. DeMeo, & W. F. Bottke (The University of Arizona Press), 815–834
- Gaia Collaboration et al. (2018) Gaia Collaboration, Spoto, F., Tanga, P., et al. 2018, ArXiv e-prints
- Green & Kowal (1983) Green, S. & Kowal, C. 1983, IAU Circ., 3878
- Green et al. (1985) Green, S. F., Meadows, A. J., & Davies, J. K. 1985, MNRAS, 214, 29P
- Gundlach & Blum (2013) Gundlach, B. & Blum, J. 2013, Icarus, 223, 479
- Gustafson (1989) Gustafson, B. A. S. 1989, A&A, 225, 533
- Hanuš et al. (2016) Hanuš, J., Delbo’, M., Vokrouhlický, D., et al. 2016, A&A, 592, A34
- Hanuš et al. (2017) Hanuš, J., Viikinkoski, M., Marchis, F., et al. 2017, A&A, 601, A114
- Harris (1998) Harris, A. W. 1998, Icarus, 131, 291
- Hasegawa et al. (2008) Hasegawa, S., Müller, T. G., Kawakami, K., et al. 2008, PASJ, 60, S399
- Hui & Li (2017) Hui, M.-T. & Li, J. 2017, AJ, 153, 23
- Ito et al. (2018) Ito, T., Ishiguro, M., Arai, T., et al. 2018, Nature Communications, 9, 2486
- Jakubík & Neslušan (2015) Jakubík, M. & Neslušan, L. 2015, MNRAS, 453, 1186
- Jewitt & Li (2010) Jewitt, D. & Li, J. 2010, AJ, 140, 1519
- Jewitt et al. (2013) Jewitt, D., Li, J., & Agarwal, J. 2013, ApJ, 771, L36
- Kaasalainen & Torppa (2001) Kaasalainen, M. & Torppa, J. 2001, Icarus, 153, 24
- Kaasalainen et al. (2001) Kaasalainen, M., Torppa, J., & Muinonen, K. 2001, Icarus, 153, 37
- Keihm (1984) Keihm, S. J. 1984, Icarus, 60, 568
- Kim et al. (2018) Kim, M.-J., Lee, H.-J., Lee, S.-M., et al. 2018, ArXiv e-prints
- Krugly et al. (2002) Krugly, Y. N., Belskaya, I. N., Shevchenko, V. G., et al. 2002, Icarus, 158, 294
- Li & Jewitt (2013) Li, J. & Jewitt, D. 2013, AJ, 145, 154
- Licandro et al. (2007) Licandro, J., Campins, H., Mothé-Diniz, T., Pinilla-Alonso, N., & de León, J. 2007, A&A, 461, 751
- Marchis et al. (2008) Marchis, F., Descamps, P., Baek, M., et al. 2008, Icarus, 196, 97
- Naidu et al. (2015) Naidu, S. P., Margot, J. L., Taylor, P. A., et al. 2015, AJ, 150, 54
- Ohtsuka et al. (2008) Ohtsuka, K., Arakida, H., Ito, T., Yoshikawa, M., & Asher, D. J. 2008, Meteoritics and Planetary Science Supplement, 43, 5055
- Ohtsuka et al. (2006) Ohtsuka, K., Sekiguchi, T., Kinoshita, D., et al. 2006, A&A, 450, L25
- Opeil et al. (2010) Opeil, C. P., Consolmagno, G. J., & Britt, D. T. 2010, Icarus, 208, 449
- Ostro et al. (2006) Ostro, S. J., Margot, J.-L., Benner, L. A. M., et al. 2006, Science, 314, 1276
- Polishook et al. (2012) Polishook, D., Binzel, R. P., Lockhart, M., et al. 2012, Icarus, 221, 1187
- Polishook & Brosch (2009) Polishook, D. & Brosch, N. 2009, Icarus, 199, 319
- Pravec et al. (2018) Pravec, P., Fatka, P., Vokrouhlický, D., et al. 2018, Icarus, 304, 110
- Rozitis & Green (2012) Rozitis, B. & Green, S. F. 2012, MNRAS, 423, 367
- Rozitis et al. (2018) Rozitis, B., Green, S. F., MacLennan, E., & Emery, J. P. 2018, MNRAS, 477, 1782
- Scheeres (2007) Scheeres, D. J. 2007, Icarus, 189, 370
- Taylor et al. (2018) Taylor, P. A., Marshall, S. E., Venditti, F., et al. 2018, in Lunar and Planetary Science Conference, Vol. 49, Lunar and Planetary Science Conference, 2509
- Tedesco et al. (2004) Tedesco, E. F., Noah, P. V., Noah, M., & Price, S. D. 2004, NASA Planetary Data System, 12
- Todorović (2018) Todorović, N. 2018, MNRAS, 475, 601
- Trigo-Rodríguez et al. (2004) Trigo-Rodríguez, J. M., Llorca, J., Borovička, J., & Fabregat, J. 2004, Earth Moon and Planets, 95, 375
- Vereš et al. (2017) Vereš, P., Farnocchia, D., Chesley, S. R., & Chamberlin, A. B. 2017, Icarus, 296, 139
- Vokrouhlický et al. (2015) Vokrouhlický, D., Bottke, W. F., Chesley, S. R., Scheeres, D. J., & Statler, T. S. 2015, The Yarkovsky and YORP Effects, ed. P. Michel, F. E. DeMeo, & W. F. Bottke, 509–531
- Vokrouhlický et al. (2017) Vokrouhlický, D., Pravec, P., Ďurech, J., et al. 2017, AJ, 153, 270
- Walsh et al. (2013) Walsh, K. J., Delbó, M., Bottke, W. F., Vokrouhlický, D., & Lauretta, D. S. 2013, Icarus, 225, 283
- Warner (2017) Warner, B. D. 2017, Minor Planet Bulletin, 44, 98
- Weissman & Lowry (2008) Weissman, P. R. & Lowry, S. C. 2008, Meteoritics and Planetary Science, 43, 1033
- Williams & Wu (1993) Williams, I. P. & Wu, Z. 1993, MNRAS, 262, 231
- Ye et al. (2018) Ye, Q., Wiegert, P. A., & Hui, M.-T. 2018, ApJ, 864, L9
Appendix A Optical light curves
We downloaded 55 optical light curves from the DAMIT555http://astro.troja.mff.cuni.cz/projects/asteroids3D database (Ďurech et al. 2010) that have been already used for the shape model determination in Hanuš et al. (2016). Moreover, we enhanced this dataset by adding four light curves obtained in 2016 by Warner (2017), four light curves by David Polishook (apparitions in 2005, 2007 and 2017), and finally, four light curves obtained by Brian Warner, two by Robert Stephens and one by Petr Pravec during the most recent apparition in December 2017. We note that our new data sample three additional apparitions in 2005, 2016 and 2017. New observations are summarized in Table 3. Additional details about the image/data processing can be found in Polishook & Brosch (2009).
| N | Epoch | Filter | Site | Observer | Reference | ||||
|---|---|---|---|---|---|---|---|---|---|
| [a.u.] | [a.u.] | [deg] | |||||||
| 1 | 2005-11-27.0 | 62 | 1.51 | 2.40 | 12.6 | R | WISE | David Polishook | This work |
| 2 | 2007-12-02.0 | 93 | 0.21 | 1.07 | 62.2 | R | WISE | David Polishook | This work |
| 3 | 2016-11-02.2 | 49 | 0.69 | 1.49 | 34.0 | V | CS3-PDS | Brian Warner | Warner (2017) |
| 4 | 2016-11-03.2 | 62 | 0.71 | 1.50 | 33.8 | V | CS3-PDS | Brian Warner | Warner (2017) |
| 5 | 2016-11-04.2 | 119 | 0.72 | 1.51 | 33.5 | V | CS3-PDS | Brian Warner | Warner (2017) |
| 6 | 2016-11-05.2 | 109 | 0.74 | 1.52 | 33.4 | V | CS3-PDS | Brian Warner | Warner (2017) |
| 7 | 2017-11-12.1 | 100 | 0.69 | 1.49 | 33.1 | R | WISE | David Polishook | This work |
| 8 | 2017-11-23.2 | 160 | 0.46 | 1.36 | 30.4 | R | D65 | Petr Pravec, Hana Kučáková | This work |
| Kamil Hornoch, Peter Kušnirák | |||||||||
| 9 | 2017-11-26.3 | 89 | 0.40 | 1.32 | 29.1 | V | CS3-TRJ | Robert Stephens | This work |
| 10 | 2017-12-01.3 | 25 | 0.30 | 1.25 | 26.2 | V | CS3-TRJ | Robert Stephens | This work |
| 11 | 2017-12-01.5 | 24 | 0.30 | 1.25 | 26.1 | V | CS3-PDS | Brian Warner | This work |
| 12 | 2017-12-02.3 | 21 | 0.28 | 1.23 | 25.5 | V | CS3-PDS | Brian Warner | This work |
| 13 | 2017-12-02.4 | 12 | 0.28 | 1.23 | 25.4 | V | CS3-PDS | Brian Warner | This work |
| 14 | 2017-12-02.5 | 23 | 0.28 | 1.23 | 25.4 | V | CS3-PDS | Brian Warner | This work |
| 15 | 2017-12-09.0 | 58 | 0.16 | 1.14 | 19.7 | R | WISE | David Polishook | This work |
Appendix B Acceleration due to mass loss
Here we estimate the change in semimajor axis of Phaethon that is due to mass loss. The documented activity of Phaethon (e.g., Jewitt & Li 2010; Jewitt et al. 2013; Li & Jewitt 2013) is very tiny and restricted to a very narrow interval of time around perihelion passage. Jewitt et al. (2013) mention the 2009 and 2012 events as 2 d activity with an average mass loss rate d/d 3 kg s-1 and characteristic ejection speeds between 10–30 m s-1 (the upper value being an order of magnitude higher than the escape speed from Phaethon, perhaps consistent with small size of the observed particles and radiative striping from the body, rather than a traditional jet-like activity). We note that the 2016 perihelion passage activity was even smaller (Hui & Li 2017). With these numbers we obtain an estimate of the effective recoil acceleration
| (3) |
Here, is the estimated mass of the body, conservatively assuming a smaller size of 5.1 km and only 1 g cm-3 bulk density.
We denote the time interval of activity around perihelion and assume 5 d, again longer than observed so far. For the sake of estimating the dynamical effect, we take now the most extreme possibility that all the observed particles are ejected in a narrow jet emanating from the north pole of Phaethon. Then the effective orbit-averaged change in semimajor axis is
| (4) |
where the factor stems from expressing the perihelion velocity and the coefficient is a projection factor of the recoil acceleration to the perihelion velocity vector direction. With our determined pole orientation we find . By combining this, we obtain
| (5) |
This is less then 10% of our found orbital decay of –(6.91.9) au/Myr.
We note that our assumptions were rather conservative. If the activity comes from lower latitudes at the body, another decrease of the effect should be expected. This is because the equatorial projection of the recoil will be averaged by fast rotation of the asteroid.
We admit that the observed activity is mainly in very small particles. There is no direct observational evidence of a possible ejection of larger particles during the recent perihelion passages. With this lack of observational constraints, it is hard to say anything about this component. It may appear that properties of the associated Geminid stream would be a guidance. We note, however, that studies of the Geminid activity (e.g., Jakubík & Neslušan 2015), while indicating a rather young age not exceeding 1000 yr, cannot be directly taken as support for an equivalent activity within the last 30 yr of the orbital data.
Appendix C Additional figures