A Notebook Format for the Holistic Design of Embedded Systems (Tool Paper)
Abstract
This paper proposes the use of notebooks for the design documentation and tool interaction in the rigorous design of embedded systems. Conventionally, a notebook is a sequence of cells alternating between (textual) code and prose to form a document that is meant to be read from top to bottom, in the spirit of literate programming. We extend the use of notebooks to embedded systems specified by pCharts. The charts are visually edited in cells inline. Other cells can contain statements that generate code and analyze the charts qualitatively and quantitatively; in addition, notebook cells can contain other instructions to build the product from the generated code. This allows a notebook to be replayed to re-analyze the design and re-build the product, like a script, but also allows the notebook to be used for presentations, as for this paper, and for the inspection of the design. The interaction with the notebook is done through a web browser that connects to a local or remote server, thus allowing a computationally intensive analysis to run remotely if needed. The pState notebooks are implemented as an extension to Jupyter. The underlying software architecture is described and the issue of proper placement of transition labels in charts embedded in notebooks is discussed.
1 Introduction
This work addresses the design documentation and user interface aspects in the rigorous design of embedded systems.
In the 80’s, Knuth argued that programs should be written as if they are the work of literature: “Let us change our traditional attitude to the construction of programs: Instead of imagining that our main task is to instruct a computer what to do, let us concentrate rather on explaining to human beings what we want a computer to do” [23]. In his system for literate programming, there is a single source file containing both the executable code and explaining prose. One tool, tangle, extracts the code for submission to a compiler and another tool, weave, processes the embedded markup instructions to generate a hyperlinked, pretty-printed document using TeX. Literate programming has been used for compilers [19], scientific software [26], operating system [16], cryptography [21] as well as Knuth’s TeX system [24]. The ideas have also influenced formal specification languages [3] and functional programming languages [4]. The documentation facilities of languages like Java [5] also draw from literate programming, even if there the prose is embedded in the code rather than on equal footing. The notebooks of Mathematica [17] and Jupyter [12] and the worksheets of Maple [11] add interactivity to literate programming: code fragments can be executed right in the editor and their results, which can be text, formulae, or diagrams, are displayed inside the document. In Jupyter, prose can be formatted with markdown, an HTML-based markup language, and is pretty-printed interactively, thus eliminating the edit-generate-process cycle of Knuth’s weave.
System models are meant to be critiqued by humans as well as mechanically processed. It is therefore fitting to consider a literate approach to designing those. This paper reports on the design decisions of the re-implementation of the pState user interface with notebooks [28]. The pState tool supports the holistic design of embedded systems with pCharts, a visual formalism for embedded systems:
-
•
The state of the system is described by hierarchical and concurrent states together with variables within those states; transitions between states can be triggered by (external and internal) events, can be timed (deterministic, nondeterministic within an interval, uniformly distributed within an interval, exponentially distributed), and can be probabilistic. For (sub-) charts without probabilistic transitions, executable code can be generated. Thus pCharts can model both the system under development as well as its environment [29].
-
•
Charts can be analyzed qualitatively and quantitatively. For the qualitative analysis, invariants can be attached to hierarchical states and the correctness of the transitions with respect to the accumulated invariant [34] is verified.
-
•
For the quantitative analysis, costs can be attached to transitions and states (state costs accumulate linearly with time). Queries for the (minimal and maximal) reachability probability and for expected (maximal and minimal) costs can be attached to states [30].
-
•
Maximal execution times of transitions can be specified and are checked against the generated code, taking the scheduler into account [31].
-
•
Comments can be embedded in the charts and are preserved in the generated executable code. If they are attached to states and transitions, then they are placed in the generated code where the corresponding variables are declared or transition is taken [30].
Internally, pState first transforms the pChart model into probabilistic guarded commands with priority. That representation serves for further transformations:
-
•
For (sub-) charts without probability, C code and Arduino code (Arduino is experimental) can be generated [33].
-
•
For (sub-) charts without probability, PIC assembly code for ATMega microcontrollers can be generated and the worst-case execution time of the generated code can be analyzed [33].
-
•
Whole charts are translated into the guarded command language of the PRISM probabilistic model checker [25]. Invariants and quantitative queries are translated to PRISM PCTL formulae.
-
•
Transition guards are compiled into formulae for the Yices SMT solver [18] to detect infeasible paths; this is used to improve the WCET analysis of the generated code.
Interaction with notebooks can take place in different ways:
-
•
Notebooks can be edited and executed through a web browser that connects to a (local or remote) Jupyter server running a Python kernel with pState.
-
•
Notebooks can be rendered through GitHub or a service like http://nbviewer.jupyter.org; editing and execution is not possible, but all parts of the notebook can be inspected. For example, this notebook can be viewed at its GitLab Repository [10]. At the time of writing, the GitLab notebook renderer has several limitations. One is that only png (bitmap) images work as expected, which necessitates that all images in this notebook are bitmaps. A more fundamental limitation is that citations and references to figures are not displayed properly in notebooks, but are in the generated pdf file.
- •
For example, a new chart is created by calling pChart("filename") in a code cell and assigning it to a Python variable. The JSON representation of the chart would then be stored in the file named __pcharts__/filename.pchart. Below, a new chart is assigned to sender_receiver. Displaying the value of sender_receiver opens then a cell for editing; the menu with the commands for drawing AND, XOR states, transitions, etc. appears only interactively and is not visible in this notebook.
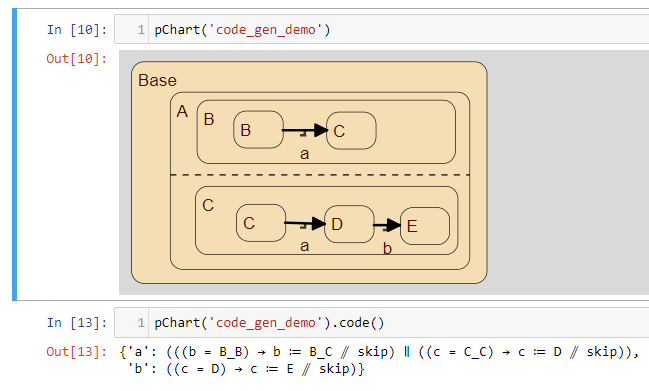
The chart is a Python object on which methods can be called: sender_receiver.code(), for example, would generate intermediate code for the chart. Other methods can then inspect invariants, events, and costs. Figure 1 is a screenshot where the chart code_gen_demo is displayed and in the following cell, the intermediate code is generated and displayed.
2 The pState-Jupyter Architecture
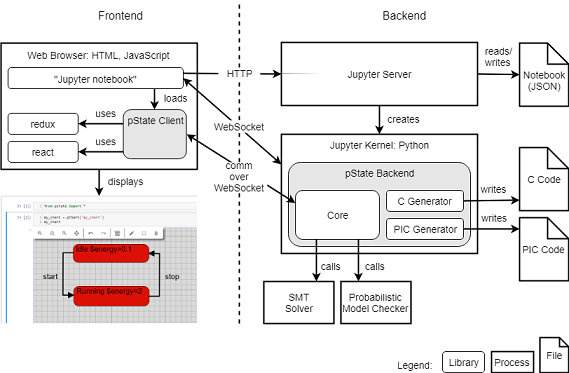
Jupyter notebooks are a document format that interleave prose in markdown cells, code cells, and code execution results. Notebooks, including the code execution results, are stored in JSON files. The three major components that make up the interactive environment for running notebooks are the server, the frontend, and the kernel. An architecture diagram is depicted in Figure 2.
The server interacts with the file system to store notebooks. Communication between the frontend and the server is done via HTTP requests/responses. Frontends may also request the creation of a kernel and the server has the responsibility of spawning the appropriate kernel process and providing it with connection details so that the kernel and frontend can connect directly. Kernels exist for numerous programming languages. For pState, we use the IPython kernel.
The frontend provides the graphical user interface for viewing and editing the notebook prose and code. When connected to a kernel it may also send a code cell to the kernel for execution; for pState, these are Python commands that are interpreted by the Python kernel. The result is sent to the frontend and displayed. Frontends commonly support rendering image formats such as PNG, JPEG, and SVG, as well as richer formats including LaTeX equations, HTML, and JavaScript.
The kernel is a process responsible for executing notebook code, as well as providing other language features such as code completion. The communication with the frontend is via the Jupyter messaging protocol. This communication is two-way, allowing the frontend to make requests to the kernel and vice-versa.
Embedding pState into a Jupyter notebook requires the coordination of two components, one on the frontend for viewing and graphically editing pCharts and another on the backend for compiling, analyzing, and generating code for pCharts.
The frontend is a web application written in TypeScript [15], which is compiled to JavaScript to run in a browser, and built on the React [13] and Redux [14] frameworks. In a Redux application, the entire state of the application is a single JavaScript object. This state is immutable and modified by pure reducers that are triggered via dispatched actions. Additionally the state and actions are JSON serializable, making synchronization and remote action dispatching possible. When the state changes, React renders a virtual view of the changed state, compares it to the concrete view, and makes the necessary changes to the concrete view so that it matches the virtual view. The concrete view is an HTML element with inline SVG for most of the chart drawing.
The backend component is a Python library that lives in the kernel, as the pState interface must be accessible to user code written in the notebook. Code written in the notebook is sent to the Python kernel for execution. Every pChart is a Python object; “displaying” the object opens the inline editor. Methods of a pChart object are called for analysis and code generation.
The frontend is connected to the backend via the Jupyter messaging protocol’s comm messages. As such, the components communicate through asynchronous message passing. The backend sends chart updates, dispatches user interface actions, and sends chart errors or analysis results to the frontend to display to the user. The frontend sends compilation or analysis requests as well as chart modifications to the backend.
3 Interface
In the notebook context the graphical editor is to be used when it is helpful. All of the functionality of the editor is also accessible via the Python object residing in the kernel. This allows for scripting changes to the diagram in addition to graphically editing it, which in the notebook format is side by side.
Future work on the backend will widen the pChart API to support programatically varying constants. With this feature we anticipate Jupyter users will bring the libraries and tools they are familiar with to integrate with pState. Such examples include Matplotlib [9] or bqplot [2] for plotting analysis results and ipywidgets [7] to create interactive interfaces for modulating constants defined within their pCharts.
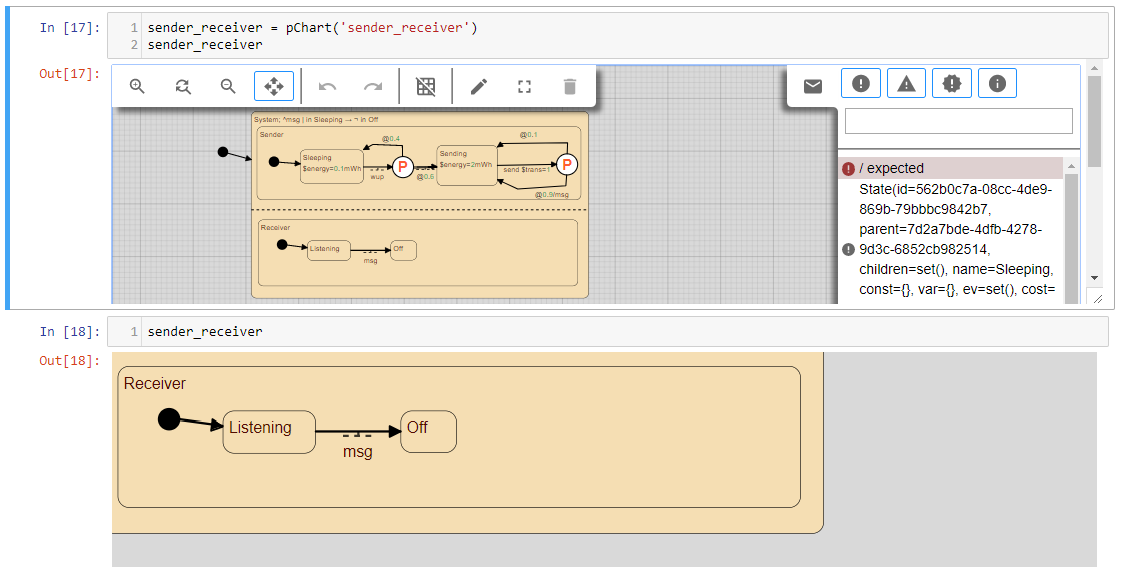
The notebooks format necessitates that charts are as wide as all other cells, which are typically of the width of a printed page, rather than filling the whole screen. The editor was designed to not overflow the space it is allocated to render in. It is fully contained and therefore many editors may be present within the same webpage. Additionally any menus are kept to a minimum and hidden when not being edited to leave as much space for the chart. To allow for large charts, a single chart (or rather the underlying Python object) can have multiple views, which are kept automatically synchronized. These views can provide an overview or “zoom” in particular states of the chart. Even then, the layout of charts is critical for readability. Figure 3 is a screenshot of a chart that is displayed twice with the user working in the top editor causing it to be in focus making the menus visible.
In the spirit of using the visual editor as a tool it implements some features for making editing quicker, namely automatically positioning labels and drawing concurrent state separating lines with plans for extending this list in the future with automatic reformating and connection path routing.
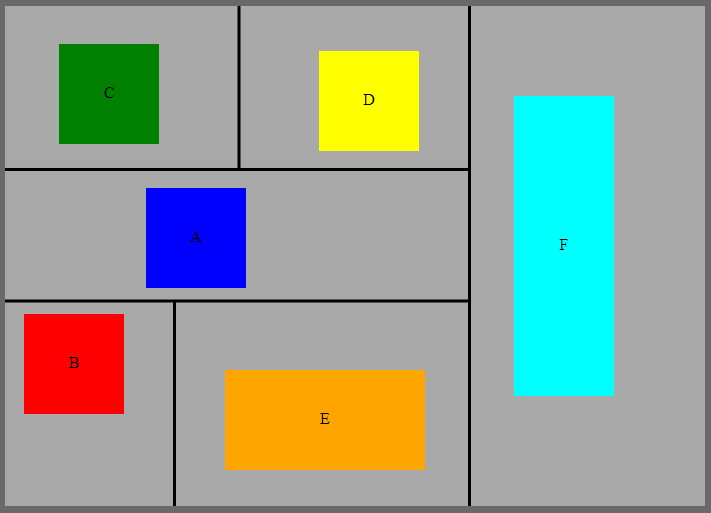
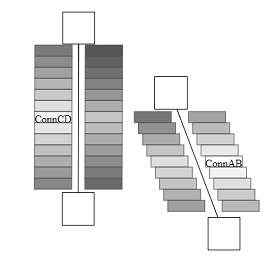
Concurrent states (AND states) visually separate their children with a dashed line. These lines are drawn automatically by recursively splitting groups of child states with a dashed line spanning the entire group across a single axis. Any groups left are split across the alternate axis until a group cannot be split further. Figure 4 shows how the algorithm splits the child boxes A-F.
Transitions between states are broken down in connections between states and probabilistic/conditional pseudo-states. These serve for splitting a transition depending on a probability or on a condition. Like commonly done in drawing editors, the frontend requires states and pseudo-states to be positioned manually, but automatically places the labels of connections. The frontend implements a variation of an algorithm by Kakoulis and Tollis for labeling edges in hierarchical drawings [20]. It consists of three steps,
-
1.
finding viable label positions,
-
2.
rating the positions on how good their placement is, and
-
3.
choosing a subset of those positions (one for each label) that reduces the total ambiguity in the relationship of label to connection.
Positions that collide with objects in the chart, including states and connections, are removed from the set of potential positions. As pCharts are hierarchical state charts, nested states will have label positions that overlap their parent states. When removing labels that collide with objects in the chart, the algorithm must not consider collisions with parent objects that are conceptually behind the label. The algorithm bases this decision on where the source state of the connection exists in the state hierarchy.
The costs is based on a force directed calculation for pulling towards the centroid of a connection path and pushing away from other labels. This algorithm may result in placements that are still of high cost. In these cases the editor renders a linking dotted line from the label to it’s connection to help reduce the ambiguity in the resulting placement. In any case the user is also free to manually position any labels that are not placed to their standards. Figure 5 shows the potential label positions along with their computed costs (darker implies a “worse” placement) and resulting placement decision.
4 Conclusions
This project was initiated to explore if it is possible to adopt a notebook format for embedded system design with hierarchical state charts. Using Jupyter notebooks, this turns out to be feasible, even if with considerable complexity: a separation of the frontend and backend is necessary and the frontend alone consists of 10,000 lines of TypeScript and uses two JavaScript frameworks. The advantages of the separation are that the backend can run on a possibly remote server and only a browser is needed for connecting to the backend; from the user’s point, the complexity is not visible but the benefits are obvious. The frontend implementation took approximately seven months which includes roughly two months spent learning about web technologies. Connecting the frontend to the backend was quite painless due to the design decisions made when implementing the editor, mainly using Redux’s design patterns including immutable state and rendering the UI based on a single state object, allowing the efficient replacement of the entire state for synchronization. As such the complexity for a reader to do the same is very much dependent on the implementation of the web interface.
At the time of writing, the backend still misses the integration of PRISM, Yices, and most of the code generators of the original pState implementation; we hope to report on using the notebooks format for full development soon. Additionally there are plans to integrate a simulation/animation tool into the frontend as well as bringing the editor into the newer interface JupyterLab [8] which was recently (late February 2018) released as a stable beta.
Notebooks have been proposed for documenting reproducible research [22]. The authors give numerous examples, but also write “It is not yet very practical to write academic papers themselves as notebooks, but we are working towards this”. We have managed to generate a pdf version of this paper from a notebook.
More importantly, we believe that notebooks can support a rigorous design process: the notebook format serves uniformly for designing, documenting, and for building the executable code. As they are self-contained and can be replayed, they can be inspected by third parties. Notebooks may therefore prove to be suitable for certification.
References
- [1]
- [2] bloomberg/bqplot: Plotting library for IPython/Jupyter Notebooks. Available at https://github.com/bloomberg/bqplot. [Online; accessed 25-May-2018].
- [3] Fuzz typechecker for Z. Available at http://spivey.oriel.ox.ac.uk/corner/Fuzz. [Online; accessed 25-May-2018].
- [4] The Haskell 98 Report: Literate Comments. Available at https://www.haskell.org/onlinereport/literate.html. [Online; accessed 25-May-2018].
- [5] How to Write Doc Comments for the Javadoc Tool. Available at http://www.oracle.com/technetwork/java/javase/documentation/index-137868.html. [Online; accessed 25-May-2018].
- [6] Jupyter Notebook EPTCS Style Exporter. Available at https://gitlab.cas.mcmaster.ca/parksj6/pstate-jupyter-eptcs-exporter. [Online; accessed 25-May-2018].
- [7] jupyter-widgets/ipywidgets: Interactive widgets for the Jupyter Notebook. Available at https://github.com/jupyter-widgets/ipywidgets. [Online; accessed 25-May-2018].
- [8] jupyterlab/jupyterlab: JupyterLab computational environment. Available at https://github.com/jupyterlab/jupyterlab. [Online; accessed 25-May-2018].
- [9] matplotlib/jupyter-matplotlib: Matplotlib Jupyter Extension. Available at https://github.com/matplotlib/jupyter-matplotlib. [Online; accessed 25-May-2018].
- [10] A Notebook Format for the Holistic Design of Embedded Systems (Tool Paper) - Source Notebook. Available at https://gitlab.cas.mcmaster.ca/lime/pstate-jupyter/blob/master/docs/submission.ipynb. [Online; accessed 25-May-2018].
- [11] Overview of Basic Features - Maple Programming Help. Available at https://www.maplesoft.com/support/help/Maple/view.aspx?path=worksheet. [Online; accessed 25-May-2018].
- [12] Project Jupyter. Available at http://jupyter.org/. [Online; accessed 25-May-2018].
- [13] React - A JavaScript library for building user interfaces. Available at https://reactjs.org/. [Online; accessed 25-May-2018].
- [14] Redux. Available at https://redux.js.org/. [Online; accessed 25-May-2018].
- [15] TypeScript - JavaScript that scales. Available at https://www.typescriptlang.org/. [Online; accessed 25-May-2018].
- [16] Ulix OS – The Literate Operating System. Available at http://ulixos.org/. [Online; accessed 25-May-2018].
- [17] Wolfram Language & System Documentation Center. Available at http://reference.wolfram.com/language/#NotebookDocumentsAndPresentation. [Online; accessed 25-May-2018].
- [18] Bruno Dutertre (2014): Yices 2.2. In Armin Biere & Roderick Bloem, editors: Computer-Aided Verification (CAV’2014), Lecture Notes in Computer Science 8559, Springer, pp. 737–744, 10.1007/978-3-319-08867-949. Available at http://yices.csl.sri.com/.
- [19] Christopher W. Fraser & David R. Hanson (1995): A Retargetable C Compiler: Design and Implementation. Addison-Wesley Longman Publishing Co., Inc., Boston, MA, USA. Available at http://sites.google.com/site/lccretargetablecompiler/.
- [20] Konstantinos G. Kakoulis & Ioannis G. Tollis (1997): An algorithm for labeling edges of hierarchical drawings. In Giuseppe DiBattista, editor: Graph Drawing, Springer, Berlin, Heidelberg, pp. 169–180, 10.1007/3-540-63938-160.
- [21] Andreas Klein (2013): Stream Ciphers. Springer, London, 10.1007/978-1-4471-5079-4.
- [22] Thomas Kluyver, Benjamin Ragan-Kelley, Fernando Pérez, Brian E Granger, Matthias Bussonnier, Jonathan Frederic, Kyle Kelley, Jessica B Hamrick, Jason Grout, Sylvain Corlay et al. (2016): Jupyter Notebooks-a publishing format for reproducible computational workflows. In F. Loizides & B. Schmidt, editors: Positioning and Power in Academic Publishing: Players, Agents and Agendas, IOS Press, pp. 87–90, 10.3233/978-1-61499-649-1-87.
- [23] Donald E. Knuth (1984): Literate programming. Computer Journal 27(2), pp. 97–111, 10.1093/comjnl/27.2.97.
- [24] Donald E. Knuth (1986): Computers and Typesetting. Volume B: TeX: The Program, Addison-Wesley Professional.
- [25] Marta Kwiatkowska, Gethin Norman & David Parker (2011): PRISM 4.0: Verification of Probabilistic Real-Time Systems. In Ganesh Gopalakrishnan & Shaz Qadeer, editors: Computer Aided Verification, Lecture Notes in Computer Science 6806, Springer, pp. 585–591, 10.1007/978-3-642-22110-147.
- [26] Nedialko S. Nedialkov (2006): VNODE-LP — A Validated Solver for Initial Value Problems in Ordinary Differential Equations. Technical Report CAS-06-06-NN, Department of Computing and Software, McMaster University, Hamilton, Ontario, Canada. Available at http://www.cas.mcmaster.ca/~nedialk/vnodelp/doc/vnode.pdf.
- [27] Bojan Nokovic (2016): Verification and Implementation of Embedded Systems from High-Level Models. Ph.D. Thesis, McMaster University, Hamilton, Ontario, Canada.
- [28] Bojan Nokovic & Emil Sekerinski (2013): pState: A Probabilistic Statecharts Translator. In Radovan Stojanović, Lech Jóźwiak & Budimir Lutovac, editors: Embedded Computing (MECO), 2nd Mediterranean Conference on, IEEE Press, pp. 29–32, 10.1109/MECO.2013.6601339.
- [29] Bojan Nokovic & Emil Sekerinski (2014): Verification and Code Generation for Timed Transitions in pCharts. In Bipin C. Desai, editor: C3S2E ’14: Proceedings of the 2014 International C* Conference on Computer Science & Software Engineering, ACM, pp. 3:1–3:10, 10.1145/2641483.2641522.
- [30] Bojan Nokovic & Emil Sekerinski (2015): A Holistic Approach in Embedded System Development. In Catherine Dubois, Paolo Masci & Dominique Méry, editors: Proceedings Second International Workshop on Formal Integrated Development Environment, Electronic Proceedings in Theoretical Computer Science 187, Open Publishing Association, pp. 72–85, 10.4204/EPTCS.187.6. Available at http://eptcs.web.cse.unsw.edu.au/paper.cgi?FIDE2015.6.
- [31] Bojan Nokovic & Emil Sekerinski (2015): Model-based WCET Analysis with Invariants. In Gudmund Grov & Andrew Ireland, editors: Proceedings of the 15th International Workshop on Automated Verification of Critical Systems, AVoCS 2015, Electronic Communications of the EASST 72, European Association of Software Science and Technology, pp. 1–15, 10.14279/tuj.eceasst.72.1026.
- [32] Bojan Nokovic & Emil Sekerinski (2016): Automatic Quantitative Analysis and Code Generator for Sensor Systems: The Example of Great Lakes Water Quality Monitoring. In Benny Mandler, Johann Marquez-Barja, Miguel Elias Mitre Campista, Dagmar Cagáňová, Hakima Chaouchi, Sherali Zeadally, Mohamad Badra, Stefano Giordano, Maria Fazio, Andrey Somov & Radu-Laurentiu Vieriu, editors: Internet of Things. IoT Infrastructures: Second International Summit, IoT 360∘ 2015, Rome, Italy, October 27-29, 2015, Revised Selected Papers, Part II, Springer International Publishing, pp. 313–319, 10.1007/978-3-319-47075-735.
- [33] Bojan Nokovic & Emil Sekerinski (2017): Analysis and Implementation of Embedded System Models: Example of Tags in Item Management Application. In Anca Molnos & Christian Fabre, editors: Model-Implementation Fidelity in Cyber Physical System Design, Springer International Publishing, pp. 175–199, 10.1007/978-3-319-47307-97.
- [34] Emil Sekerinski (2009): Design Verification with State Invariants. In Kevin Lano, editor: UML 2 Semantics and Applications, John Wiley & Sons, pp. 317–347, 10.1002/9780470522622. Available at http://onlinelibrary.wiley.com/doi/10.1002/9780470522622.ch13/summary.